To map MAFs a variety of mapping platforms can be used, operating from space, the air, or the sea (Kearns & Breman, 2010; Li et al., 2023, and references therein) (Figure 3). The choice of platform will depend on the habitat’s depth (< or > 20 m), the size of the area that is to be mapped (meters, 10s or 100s of kilometres), and the resolution needed (centimetre to kilometre scale) (Table 1).
Air-based mapping
Airborne platforms consist of manned aeroplanes, helicopters and drones and unmanned aerial systems (UAS), which are used to map the seafloor at local and regional scales (1-to-100 km2), and are most useful for mapping shallow MAFs (<20 m). Like satellites, airborne tools are also used to map tropical coral reefs (Collin et al., 2018; Hamylton, 2017). These platforms mostly use electromagnetic waves and primarily encompass aerial photography, active light detection and ranging (LiDAR) and radar imaging (Javan et al., 2025 and references therein). Depending on the closeness of the airborne vehicle to the ocean’s surface, a spatial resolution from several centimetres up to hundreds of metres can be achieved. Another advantage of using airborne mapping tools is that one can control the time of day and the flight direction, which can avoid issues with sunlight reflection and times with cloud coverage. They can also cover a relatively large area in a short time and can usually be operated for several hours per day. While drones are a relatively cost-efficient way to map an area, manned airplanes and helicopters are more costly.
Systems such as UAS leverage aerial photogrammetry to generate high-resolution spatial data, contributing significantly to marine habitat monitoring and conservation efforts (Figure 5) (Monteiro et al., 2021; Ventura et al., 2023). By integrating Red Green Blue (RGB) and multispectral imagery, UAS-based habitat mapping enables the generation of digital surface models (DSM), 3-dimensional (3D) mesh models and RGB and multispectral orthomosaics (Kvile et al., 2024; Mazza et al., 2023) (Figure 5). Ground control points (GCPs) and georeferencing techniques enhance the spatial accuracy of the derived products, while bathymetric corrections improve mapping capabilities for submerged structures (Alevizos et al., 2022a; David et al., 2021; Mandlburger et al., 2021).
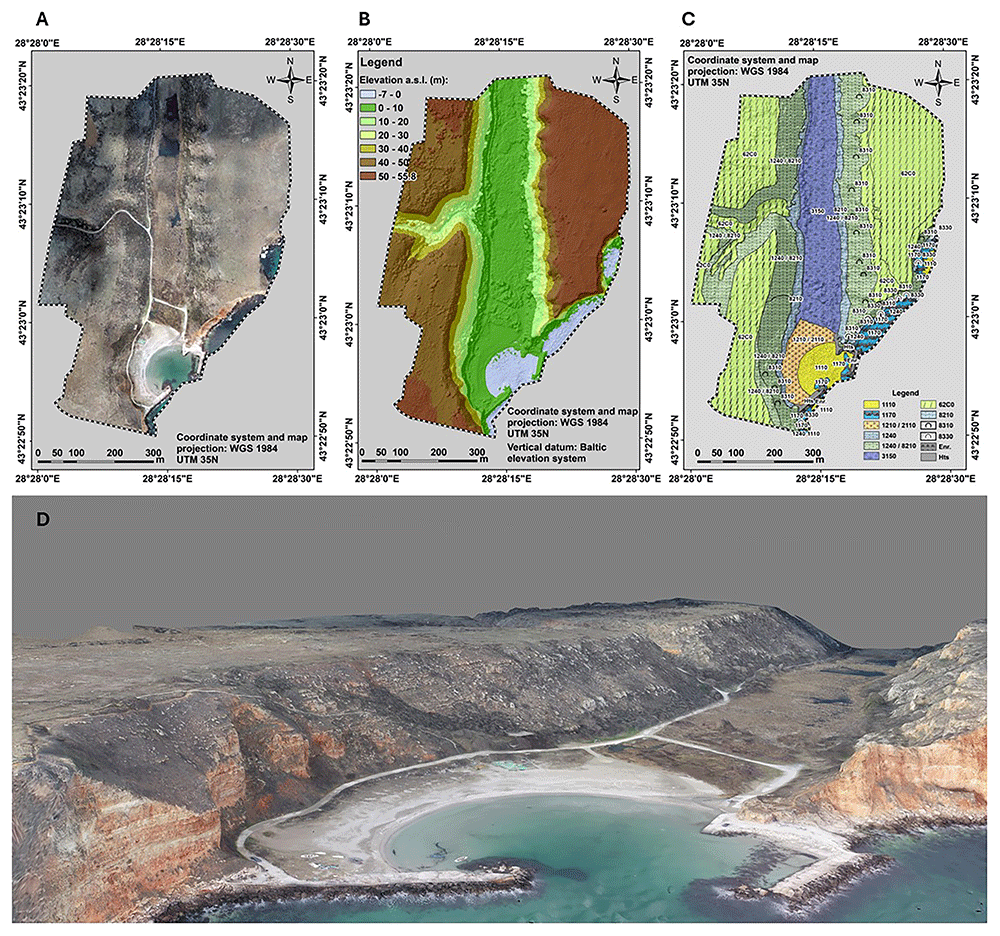
Figure 5. UAS-derived imagery products for seafloor/habitat mapping purposes.
Three of the basic drone products are an (A) orthophotomosaic, (D) 3D photorealistic model of the area, (B) a (topo-bathy) DSM, all three at cm scale. (C) The biotope/habitat map is the final stage of the analysis. The codes readable on the map provided are the HD habitat codes, i.e. 1110 - sandbanks, 1170 - reefs, 1210/2110 - Annual vegetation of drift lines/ embryonic shifting dunes, 1240 - Vegetated sea cliffs of the Mediterranean coasts with endemic Limonium spp, 8210 - Calcareous rocky slopes with chasmophytic vegetation, 3150 - Natural eutrophic lakes with Magnopotamion or Hydrocharition, 62C0 - Ponto-Sarmatic steppes, 8310 - Caves not open to the public, 8310 - submerged or partially submerged sea caves, Enr - enrockment (rip-rap), Hts - hydrotechnical structure/coastal engineering structure.
One of the main advantages of UAS technology is its ability to provide high-resolution data compared to satellite or aircraft-based remote sensing. Additionally, UAS surveys are cost-effective and offer a flexible alternative to traditional hydrographic methods (Alevizos et al., 2022a; Kvile et al., 2024), allowing for rapid data collection across extensive areas with reduced time and resources. These advantages make UAS an indispensable tool for habitat classification, supporting machine-learning models in distinguishing different habitat types (Giles et al., 2023; Nababan et al., 2021; Tallam et al., 2023; Ventura et al., 2023) (Figure 5C). Furthermore, the generation of DSMs (Figure 5B) and mesh models enables detailed morphological assessments of underwater features (David et al., 2021; Prodanov et al., 2020), including shallow-water archaeological sites (Mazza et al., 2023; Prahov et al., 2020), while multitemporal surveys facilitate change detection, helping monitor habitat changes due to both natural and anthropogenic factors (Kvile et al., 2024; Monteiro et al., 2021).
Despite its many benefits, air-based mapping also presents several challenges. Water clarity and depth significantly impact the effectiveness of photogrammetry, as optical penetration is limited in deeper or turbid waters (Alevizos et al., 2022a; Mandlburger et al., 2021). Environmental conditions such as surface reflections, wave motion, and lighting variations can also affect image quality and data accuracy (David et al., 2021; Kvile et al., 2024). Moreover, regulatory constraints must be considered, as for example, UAV operations in coastal areas require compliance with aviation and marine protection regulations. Addressing these limitations requires the integration of advanced sensor technologies, improved image processing algorithms, and optimised flight planning strategies. As for satellite-based images, air-based methods can only be used to map relatively shallow systems (~20 m depth). While repeated surveys are possible with this approach, often data will only be collected for the duration of a project (<10 years). It was only in the early 2000s that researchers started using drones to map and monitor wildlife. Therefore, it is unlikely that baseline data from before then is available for comparison. Consequently, most studies using airborne mapping approaches use the data to describe the extent, composition and complexity of the habitat.
In conclusion, air-based technology is revolutionising the mapping of underwater habitats, offering high-resolution and cost-effective solutions for marine spatial planning and conservation. Future developments in sensor integration, artificial intelligence (AI)/machine learning (ML) algorithms, AI-driven classification, and advanced photogrammetric processing will further enhance its capabilities in underwater habitat mapping to classify coastal habitats with minimal or no field data collection (Kvile et al., 2024; Liu et al., 2022).
Sea-based mapping
There are three categories of sea-based mapping platforms: i.e. those at the surface, underwater and those held by divers and snorkellers. Sea surface platforms comprise vessels of different sizes and capabilities, including Unmanned Surface Vehicles (USV). Underwater platforms comprise manned submersibles, unmanned tethered Remotely Operated Vehicles (ROV) and untethered Autonomous Underwater Vehicles (AUVs). Divers could be considered “living underwater platforms”. Active acoustic (e.g. seismic and multibeam sonar) and image-based tools are attached to sea-based mapping platforms to map habitats at local and regional scales.
The advantage of surface-based mapping platforms, such as ships, is that they can travel at greater speed and cover larger areas. It is relatively easy to follow a straight trajectory and maintain a constant speed (i.e., usually 5–8 knots). Fair sea conditions are also needed to collect high-quality data. Both single-beam and, especially, multibeam data have been used to produce seafloor maps at various scales, from local (e.g. De Clippele et al., 2017) to basin-scale (e.g. Schumacher et al., 2022). One disadvantage when working with multibeam systems is that in deeper habitats, the resolution of the maps is lower due to the larger distance between the seafloor and the hull of the surface-based vessel.
Whereas there are some manned submersibles in use across the world, the number of unmanned vehicles largely outweighs the manned ones, mostly because of safety reasons and associated operational procedures and costs. The advantages of underwater platforms are that their payload is modulable depending on each specific mission's needs and that they can operate at very short distances from the seafloor, thus enhancing data resolution. An inconvenience of these platforms is that they move at relatively low speeds, can struggle to hold position and can usually operate for only several hours a day, although longer continuous periods could be envisaged in the case of AUVs.
Divers can carry a variety of instruments (e.g., video and photographic cameras), and assist in detailed mapping and, more importantly, in the in-situ ground truthing of data acquired from other platforms. For example, they can check in situ if a given object is hard or soft, a property that is often not obvious from imagery alone. However, such inputs by divers are limited by factors related to water depth and time spent underwater.
Beyond very shallow coastal waters, a combination of sea surface platforms for medium to large-scale general mapping (i.e. from km2 to 100’s of km2 in size areas) with underwater platforms for detailed inspection and mapping of spots previously identified in the general maps, appears as the best approach for MAFs mapping.
Active acoustic tools. Active acoustic sonar-based technologies emit sound pulses from a transmitter, which then travel to the bottom and, in some cases, penetrate the seafloor down to variable depths while reflecting the upwards part of the emitted energy, which is recorded by a receiver. This signal is then processed in order to obtain a graphical expression of the surface or subseafloor (Dowdeswell, 2016; Jakobsson et al., 2016).
Side Scan Sonar profiling. Side Scan Sonar (SSS) has become an essential tool for underwater habitat mapping due to its ability to provide high-resolution acoustic imagery of the seafloor. By analysing differences in acoustic reflectance, researchers can infer sediment composition, habitat structures, and biological distributions. The effectiveness of SSS in habitat mapping lies in its capability to cover large areas efficiently while maintaining high spatial resolution, making it ideal for applications in marine ecology, fisheries management, and environmental monitoring (Blondel, 2009; Degraer et al., 2008; Greene et al., 2018; Klaucke, 2017; Sun et al., 2021).
SSS operates by transmitting acoustic pulses from a transducer mounted on a towed vehicle, an autonomous underwater vehicle (AUV), or a ship. These pulses propagate through the water column and reflect off the seafloor, with the returning signals recorded to generate an acoustic image. The intensity of the returned signal, or backscatter, varies depending on the texture, hardness, and composition of the seabed (Ainslie, 2010; Blondel, 2009). Backscatter measurements, often used in combination with bathymetric data, provide insights into the distribution of different habitat types. Areas with high backscatter typically correspond to hard substrates such as rocky outcrops, whereas low backscatter is associated with soft sediments like mud and sand (Lurton et al., 2015).
The data acquired from SSS surveys is processed into various products that aid in habitat classification and environmental assessments. These include (a) sonograms, which are raw acoustic images that display variations in backscatter intensity, used to visually interpret habitat types and seabed structures; (b) mosaics, which are composite images created by stitching together multiple sonar passes to form a continuous, large-scale representation of the surveyed area (Figure 6); (c) backscatter maps, which are georeferenced representations of sonar intensity values, aiding in quantitative analysis of seabed properties; (d) habitat classification maps, which are interpreted maps where seabed types and biological zones are categorized based on sonar data and ground-truth samples; (e) three-dimensional models, which are when integrated with multibeam bathymetry data, SSS imagery can contribute to the development of 3D models of underwater landscapes, enhancing visualization and analysis.
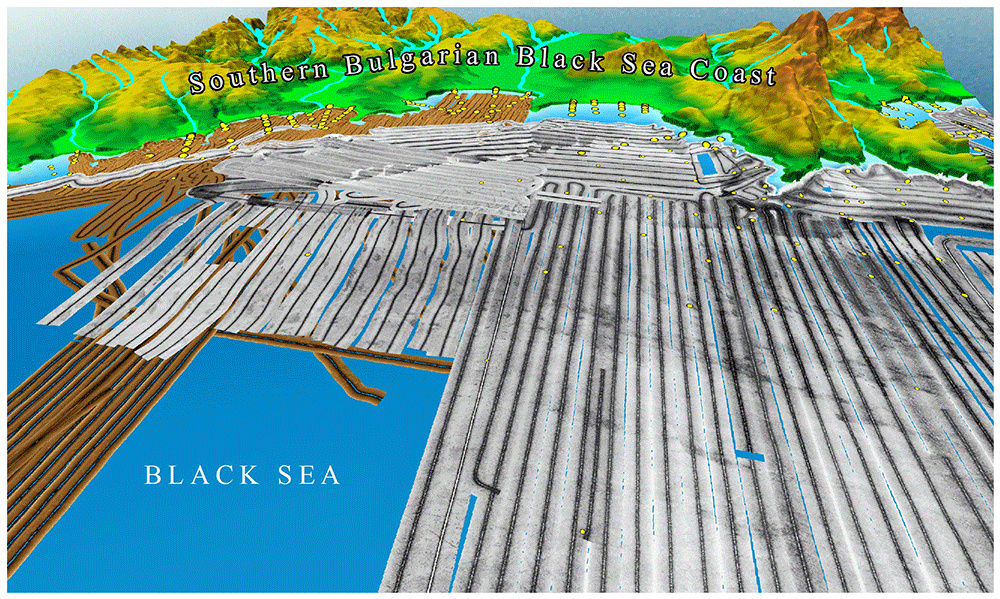
One of the primary applications of SSS in habitat mapping is classifying benthic environments based on substrate type and structure. The strength of the sonar signal provides crucial information about the composition of the seafloor. For example, studies have correlated high-resolution SSS images with sediment grab samples to classify seabed habitats in fisheries management (Lucieer, 2008; Micallef et al., 2012; Papatheodorou et al., 2012; Todorova et al., 2015).
Manual interpretation of SSS imagery can be time-consuming and subjective. Therefore, automated image classification techniques have been developed to improve accuracy and efficiency. Algorithms and supervised classification methods have been used to distinguish between different habitat types, achieving classification accuracies above 80% (Brown & Collier, 2008; Kaeser et al., 2013; Ojeda et al., 2004; Rusmadi & Hasan, 2020; Sun et al., 2020)
SSS is extensively used to study the spatial extent, geomorphology, and geological composition of underwater landscapes, including reef structures, sedimentary deposits, and tectonic features. By integrating SSS data with ground-truthing methods such as sediment coring, bottom photography, and high-resolution bathymetry, researchers can characterise geomorphic features such as underwater ridges, sandbanks, rock formations, and fault structures. For example, high-resolution SSS mosaics have been instrumental in identifying lithological variations, fault structures, and sediment transport patterns, contributing to improved geological and geomorphological mapping of continental shelves and reef ecosystems (Blondel, 2009; Dimitrov et al., 2019; Pillay et al., 2020; Subarsyah & Arifin, 2019; Todorova et al., 2015; Wang et al., 2023; Zhao et al., 2018).
Advancements in sonar technology and image processing are set to transform habitat mapping with SSS. Machine learning models for automated classification and real-time data processing will enhance mapping accuracy, reducing subjectivity and increasing efficiency (Pijanowski & Brown, 2021). The integration of SSS with AUVs and ROVs can facilitate high-resolution, real-time habitat assessments, expanding sonar applications in deep-sea exploration and environmental monitoring (Wynn et al., 2014). Additionally, emerging multi-frequency and multispectral sonar systems improve substrate discrimination, offering more detailed seafloor characterisation (Gaida et al., 2018). The combination of SSS with other remote sensing technologies, such as LiDAR and satellite-derived bathymetry, will further refine seabed classification and habitat mapping (Ierodiaconou et al., 2018).
Despite certain limitations, SSS remains a cornerstone of underwater habitat mapping, providing high-resolution acoustic imagery essential for marine science and conservation. Global initiatives like Seabed 2030 leverage advancements in sonar to map the entire ocean floor at high resolution, addressing knowledge gaps in marine ecosystems (Mayer et al., 2018). By overcoming current challenges and harnessing new technologies, SSS will continue to play a key role in sustainable ocean management, supporting biodiversity protection and ecosystem monitoring.
Seismic reflection profiling. Seismic reflection profiling is a widely used tool to image the subseafloor at shallow (1-10’s of meters scale), intermediate (10’s to a few 100’s of meters scale) and large depths (several 100’s of meters to kilometres scale) (Crutchley & Kopp, 2018). This method can be used to reveal information on the formation and history of certain marine animal forests, such as cold-water coral carbonate mounds.
The method relies on the emission of sound pulses to obtain a graphical expression of the subseafloor structure in the form of a seismic reflection profile (Jakobsson et al., 2016). Seismic reflection profiling requires an energy source, a receiving system of the reflected energy, a recording unit for data storage, and processing and visualisation software at various stages (e.g. pre-processing or post-processing). Acoustic impedance contrasts are stronger at interphases separating materials with distinct physical properties, such as sediments from underlying rocks, or sedimentary layers of different densities. These interphases are known as “seismic reflectors”. Consequently, the continuous repetition of emission-reception cycles over time allows for visualising the configuration of materials in the sub-seafloor along the time axis, including the boundaries between different geological units and their internal structure. That is why seismic reflection profiles usually have a vertical axis in two-way travel time (in seconds or milliseconds), expressing the time required for the signal to travel from the location of the source (at the sea surface or below) to the different reflectors at depth and back. The horizontal axis is also expressed in time, which in this case represents the time required for successive emission-reception cycles while the vessel moves forward at a controlled speed (Jakobsson et al., 2016).
There is a wide variety of seismic reflection systems, each designed for a specific purpose. The most interesting for MAFs and other shallow subseafloor studies are very high to high-frequency systems, which allow for penetrating the upper sediment layers while providing centimetre to decimetre-scale resolutions. Other high-resolution towed seismic reflection systems, such as boomers or small sparkers, could also be of interest, although they are intended to achieve larger depths below the seafloor than those strictly needed for MAFS studies. In these systems, both the source (emitter) and the receiver system are towed behind the mother vessel. Receivers usually consist of a flexible pipe (named streamer) holding a set of hydrophones to detect the reflected acoustic signals. Acquisition can be single-channel or multi-channel, and 2D or 3D (seismic cubes). Grids of densely spaced 2D profiles can be used to produce pseudo-3D seismic cubes. For example, sub-bottom profiler data have been used, in combination with side scan sonar data, for benthic habitat mapping in a number of places worldwide (e.g. Alevizos et al., 2022b; Fakiris et al., 2018; Hamouda et al., 2024; Ierodiaconou et al., 2018; James et al., 2007).
Multibeam sonar. Since the early 1990s, multibeam echosounders have become the dominant method for full-coverage seafloor mapping at all depths. Similar to seismic reflection systems, multibeam systems require the emission of repeated energy pulses at high frequencies that travel and are reflected off the seabed, returning to the surface or the location of the survey vehicle. Today, there is a wide variety of multibeam systems on the market, some of which are designed for shallow coastal waters and small-sized boats or underwater vehicles, whereas others are intended for ocean depths and can only be installed in large vessels. The diversity of multibeam systems can be seen on the webpages of the leading manufacturers, such as Atlas Hydrographic, Konsberg Discovery, LC Klein, Norbit, Teledyne RESON A/S, or Wärtsilä Elac Nautik.
As indicated by their name, multibeam systems consist of arrays of emitters and receivers, each of which emits a beam with specific properties (e.g., amplitude, single-beam opening angle). Adjacent beams form a fan-like front that successively insonifies seafloor stretches of a given total width as the carrying platform advances, which can be either a surface vessel or an underwater vehicle. Successive swaths expanding towards both sides of the platform provide full coverage of the insonified area along a given stretch of the seafloor. The width of the mapped seabed stretch depends on water depth (i.e., the larger the water depth, the wider the stretch) and on system configuration (i.e., the larger the total opening angle of the beam ensemble, the wider the stretch) (Jakobsson et al., 2016). Overlapping successive, generally parallel, stretches allow for achieving full coverage bathymetric maps of given regions, which are essential for habitat mapping and understanding, including MAFs. Further, any kind of information, such as landform features or species presence, could be draped on the bathymetry base map using geospatial software such as ArcPro or QGIS (e.g. Sowers et al., 2024)
The footprint of every individual beam determines the resolution of the bathymetric products obtained from multibeam systems, such that smaller footprints (involving less energy and higher frequencies) result in higher-resolution maps. However, to travel deeper, more energy is needed, which usually implies that deep-water bathymetric maps have poorer resolution than shallow water ones, unless using an underwater vehicle capable of carrying the system close to the seabed. Vessel speed while profiling must be as constant as possible and not too high (i.e., usually around 8 knots) to ensure the quality of the data, though this ultimately depends on vessel’s performance and sea state. Usually, multibeam systems are hull-mounted, although they can also be attached to ROVs and AUVs, resulting in very high-resolution data. For example, at the Mingulay reef complex a “microbathymetry” was collected through attaching a MBES to an ROV. This resulted in a map of a 20 cm resolution on which live cold-water coral colonies were visible and annotated for use in a species distribution model (De Clippele et al., 2017).
Multibeam data enable the creation of a variety of mapping products that can be particularly useful. These include backscatter intensity maps, which represent the intensity of ”backscattered” seabed reflection of the emitted signal, itself indicative of the seabed’s nature, either rocky or sedimentary or vegetation-covered. Another option is generating 3D Digital Terrain Models from full coverage bathymetry datasets, allowing visualisations from different angles and elevations, with more or less vertical exaggeration of seascape images to better visualise specific features (Fabri et al., 2017). Other cartographic products directly derived from multibeam bathymetry data, which are increasingly being used, include rugosity (a dimensionless measure of surface roughness), slope gradient, bathymetric positioning index, and aspect (slope orientation), and segmentation (per backscatter classes, for instance) maps (Canals et al., 2020; De Clippele et al., 2017 and references therein).
If repeated at given intervals of time, such full-coverage maps allow for the monitoring of seascape and habitat evolution in an unprecedented way. Repeated multibeam surveys have been done to assess both short and long-term changes associated with the seafloor (e.g. Normandeau et al., 2020). The “Digital Elevation Model (DEM) of Difference” (DoD) can be calculated and will indicate the change in elevation with positive values showing deposition (or fill), negative values showing erosion (or cut, scour) and null values showing an unchanged surface (Schmitt et al., 2008). However, the accuracy of the depth values can be affected due to different sonar systems being used, vessel-related differences because of configuration and weather conditions, differences in oceanographic conditions and issues related to the use of geo-positioning techniques (Brothers et al., 2011; Schmitt et al., 2008). These inaccuracies may be more pronounced in deeper locations and areas with more complex hydrodynamics, such as cold-water coral reefs. Given enough time and under the right environmental conditions, cold-water coral reefs can develop from mini-mounds to large, cold-water carbonate mounds. While these mounds can be mapped and characterised using multibeam sonar approaches, to date no studies have assessed long-term changes in their morphology. Using multiple acoustic frequencies could also be useful as it may help differentiate seafloor features of various sizes and shapes (Whitmire et al., 2007).
Cameras. Image-based tools, such as cameras that capture still images or video, are widely used in marine habitat mapping. These systems typically provide centimetre-scale resolution and cover relatively small spatial areas (usually less than 1 km2). Cameras can be operated by divers, deployed from vessels using various support systems (e.g., drop or drift cameras), or mounted on underwater vehicles such as Remotely Operated Vehicles (ROVs) and Autonomous Underwater Vehicles (AUVs) (De Clippele et al., 2017; Foubert et al., 2011; Huvenne et al., 2011; Robert et al., 2017; Van Audenhaege et al., 2021).
The characteristics of the vehicles and camera systems, particularly in terms of stability, lighting, and control, influence the type and quality of data collected, making each platform more suitable for specific objectives or environments.
ROVs are controlled from a surface vessel, allowing real-time decision-making and fine manoeuvrability. This makes them ideal for targeted observations, detailed inspection of specific areas, or sample collection. Their lighting systems can be adjusted on the spot to adapt to local visibility conditions. However, their dependence on a ship-based control system and umbilical cable limits the area they can cover and may introduce motion constraints.
AUVs, on the other hand, are autonomous platforms that follow pre-programmed missions without human control during deployment. They are especially well-suited for high-resolution mapping of small to medium-sized areas due to their stable motion and efficient, systematic coverage. AUVs often carry advanced cameras and lighting systems calibrated for optimal imaging conditions. While they offer high spatial resolution and consistency, they lack flexibility during missions and cannot adjust to unexpected features in real time.
High-resolution (<1 cm) video mosaics, combined with multibeam sonar data, typically mounted on AUVs, have provided valuable insights into the spatial organisation of deep-sea coral frameworks and the environmental and temporal drivers influencing them (Boolukos et al., 2019; Conti et al., 2019; Price et al., 2019). As a result, non-invasive methods involving remote imaging technologies are increasingly favoured for studying and monitoring marine benthic habitats.
The quality of the imagery depends on several factors, including the camera specifications, lighting conditions, and water turbidity. Image resolution is generally highest when the platform is stationary or moving slowly. Collecting data close to the seafloor improves the ability to identify organisms and benthic structures. However, operating very close to the bottom may pose safety concerns and increase the risk of disturbing or damaging fragile marine life.