Introduction
It is estimated that 72% of the energy consumed globally is wasted as heat1. This is such a huge amount that recovering only 10% of this heat would exceed the total energy generated by modern renewable energy sources (wind, solar, geothermal and hydro-energy)2,3. Unlike waste heat, omnipresent heat sources including solar radiation and human body heat are widely available. Thus, the conversion of low-grade heat into electricity is something highly desirable and can significantly contribute to mitigating the current energy crisis. In this respect, thermoelectric (TE) devices have drawn significant interest due to their capability to directly convert heat into electricity in an eco-friendly, safe, and silent manner4,5. TE technology has already been employed in a variety of applications such as generating power from automotive exhausts, powering instruments for space exploration, recovering heat from industrial furnaces, harnessing solar energy, powering sensors, and many more4–6.
The heat-to-electricity energy conversion efficiency of a TE material is related to the dimensionless figure of merit zT=S2σT/κ, where S is the Seebeck coefficient, σ is the electrical conductivity, T is the absolute temperature, and κ is the thermal conductivity. Thus, large power factor (PF=S2σ) as well as low κ are key to obtaining high zT. Most of the recent improvements in the figure of merit have been mainly achieved by reducing κ through approaches including nanostructuring, doping, or defect engineering. Despite this, κ is nearly reaching its amorphous limit in many cases, making necessary to enhance the PF7,8. Nevertheless, efforts to increase the PF are limited and challenging due to the adverse correlation between S and σ9–11.
In recent years, our group has developed a new concept to improve the PF, which is based on the interactions of an electrolyte with a porous TE solid. So far, all our studies have employed a porous and nanostructured Sb-doped SnO2 material as the TE solid. Very large PF improvements (>2.5 times) were obtained in many cases with different electrolytes: a solution of lithium tetrafluoroborate (LiBF4) in 3-methoxypropionitrile (3-MPN)12, the ionic liquid 1-butyl-3-methylimidazolium iodide (BMII)12, the redox molecule Cr(III) acetylacetonate dissolved in 3-MPN13, and the polymer electrolyte poly(diallyldimethylammonium chloride) (PDADMAC)14. However, despite the significant PF improvements in Sb:SnO2, the obtained PF values were far from the state of the art, since Sb:SnO2 exhibits modest TE properties (S≈45 μV/K).
In this article, we investigate if similar PF enhancements can also be produced in high-performance n- and p-type bismuth and antimony telluride alloys, which are the best-performing TE materials around room temperature15.
First, we synthesized nanoparticles of n-type Bi2Te3 and p-type Sb2Te3, which were cold pressed to form pellets with PF values close to the state of the art, while preserving a porous structure. Then, the pellets were brought into contact with several electrolytes to identify if the desired improvements can be reached.
Methods
All chemicals utilized in this study were of analytical grade and sourced from Sigma Aldrich (Stockholm, Sweden). The synthesis process involved bismuth chloride (BiCl₃, 98%, ref. 7787-60-2), sodium tellurite (Na₂TeO₃, 99%, ref. 10102-20-2), sodium hydroxide (NaOH, 97.0%, ref. 1310-73-2), and sodium borohydride (NaBH₄, 98%, ref. 16940-66-2) as the main reagents. BiCl₃ and Na₂TeO₃ were used as sources of Bi and Te ions, respectively. Deionized water served as the solvent, ethylenediaminetetraacetic acid (EDTA, ref. 60-00-4) was used as the shape directing agent, NaBH₄ acted as the reducing agent, and NaOH was added to adjust the pH of the reaction medium. The synthesis was conducted using a Milestone flexiWAVE microwave (MW) system 1800 W (Milestone Srl, Sorisole, Italy). Acetone (ref. 67-64-1), and isopropanol (ref. 67-63-0) were also used in the synthesis as received without any further purification.
Synthesis of Bi2Te3 and Sb₂Te₃: it was achieved through solution chemical synthesis, adopting the hydrothermal method and MW-assisted heating16. The synthetic protocol details are given for the preparation of a 1 g Bi2Te3 or Sb₂Te₃ sample, which can be scaled up. A one-pot synthesis method was used by combining all precursor materials in a single reaction vessel. To synthesize Bi₂Te₃ or Sb₂Te₃, a Bi/Sb to Te molar ratio of 2:3 was maintained. The mixture, including BiCl₃ (0.79 g) or SbCl₃ (0.72 g), Na₂TeO₃ (0.8 g), EDTA (0.6 g), and NaBH₄ (0.6 g), was prepared in a 100 mL Teflon-lined reactor, with the pH adjusted to between 10.5 and 11 using (0.2 g) of NaOH. The solutions were stirred magnetically for 30 min to ensure even mixing before MW heating. The temperature was raised to 220 °C for 4 min, then held for 2 min. After the reaction, the system was cooled down to room temperature, causing the product to settle at the bottom and clear phase separation to occur. The powder was collected by centrifugation and washed with isopropanol, acetone, and deionized water. Finally, the powder was dried in a vacuum oven (MSE PRO, MA2015) at 60 °C.
Fabrication of cold-pressed pellets: To have Bi2Te3 materials with good TE properties, we fabricated a set of p- and n-type samples by cold pressing at the optimized pressure of 100 MPa. This was performed in order to mainly improve the electrical conductivity of the material and reach closer values to the state-of-the-art bulk bismuth telluride. The prepared Bi2Te3 and Sb2Te3 (n and p type, respectively) nano powders were then cold pressed using a die with 10 mm × 5 mm × 0.4 mm dimensions (see Figure 1) under equivalent weight for 5 min.
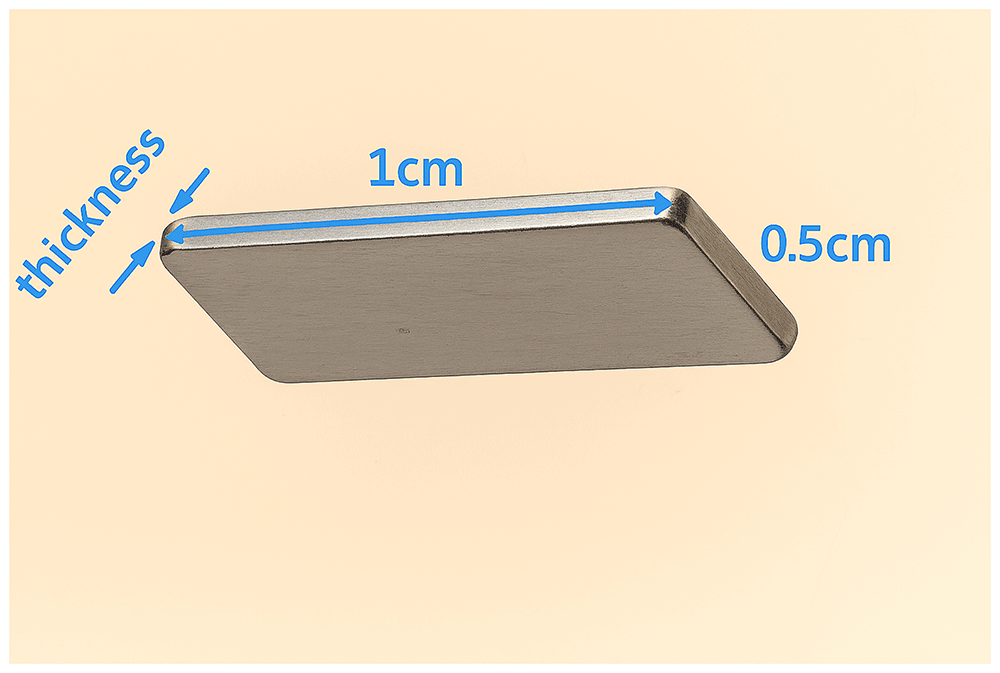
Figure 1. Die.
Dimensions of the die for the fabrication of the pellets by cold press.
Characterization: X-ray powder diffraction (XRPD) analysis was performed using a Philips PANalytical X'Pert Pro Powder Diffractometer equipped with a copper anode (Cu-Kα1 radiation, λ=1.5406 Å) to identify crystalline phases of TE powders. The measurements employed continuous scan mode, with a step size of 0.10° (2θ) and a scan rate of 0.02°/s. Crystalline phases were determined using High-score Pro software.
The sample's morphology was analyzed with scanning electron microscopy (SEM, FEI Nova 200, Hillsboro, OR, USA). To prevent charging and enhance image quality, the SEM samples were attached to the holder using copper tape.
PF measurement system: To evaluate the PF of the pellets before and after their exposure to different electrolytes, a cell was assembled, composed of soda-lime glasses of 25 mm × 15 mm and 1.8 mm thickness as substrates (Figure 2). The glasses were cleaned before film deposition by means of three sonication steps of 15 min in different media. In the first step, sonication was performed using a soap (Labkem, SOAP-0685K0)/water solution (1:10 v/v). Then, in the second step, distilled water was used to remove excess soap. Finally, isopropanol (Labkem, PROL-P0P-5K0) medium was employed for sonication. After this, substrates were dried under a compressed air flow and treated in a UV ozone cleaner (Ossila, L2002A2-UK) for 20 min. The pellets were first mounted to a glass substrate using a small piece of double-side tape. Subsequently, both ends of the pellet were painted by Ag paint (RS, ref. 186-3600) to establish electric contact (see Figure 2a). To accommodate the electrolyte, a plastic container (frame) was 3D printed and affixed on the top of the pellet using two component Poxipol epoxy (see Figure 2a), which was allowed to cure overnight. The TE measurements with liquid electrolytes were performed in the configuration shown in Figure 2a. In contrast, the polymer electrolyte PDADMAC, which does not require confinement, was directly added on top of the pellet and dried under ambient conditions overnight, as shown in Figure 2b.
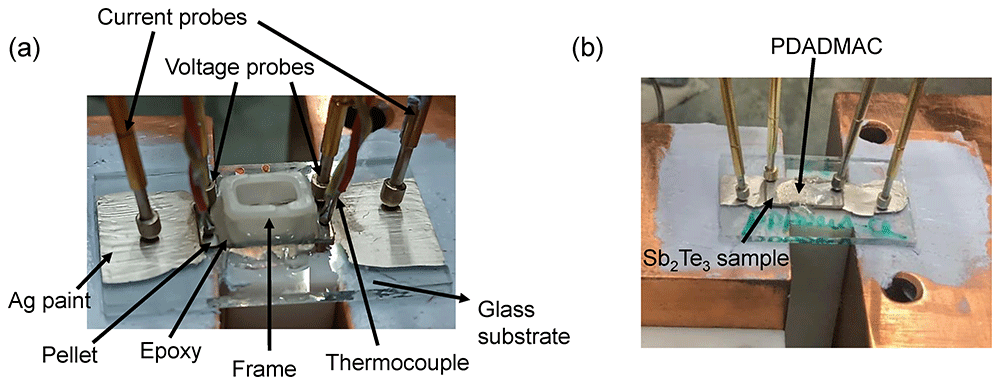
Figure 2. Setups.
Setups for the measurement of the pellets in contact with (a) liquid electrolytes and (b) with the solid electrolyte PDADMAC.
Electrolytes tested: The different electrolytes that were tested in the n-type Bi2Te3 and p-type Sb2Te3 samples are listed in Table 1.
Table 1. Electrolytes.
List of the electrolytes tested.
| Electrolyte | Type of electrolyte |
|---|
0.1 M tBuNH4BF4 (Sigma Aldrich, ref. 217964) in
3-methoxipropionitrile, 3-MPN (Sigma Aldrich, ref. 65290) | Non-electroactive molecule |
0.1 M guanidinium chloride (Sigma Aldrich, ref. N018131020
144) in H2O | Non-electroactive molecule |
| 0.1 M benzoquinone (Sigma Aldrich, ref. B10358-100G) in H2O | Electroactive (redox)
molecule |
| 0.1 M Cr(acac)3 (Sigma Aldrich, ref. 202231) in 3-MPN | Electroactive (redox)
molecule |
| 0.1 M LiBF4 (Sigma Aldrich, ref. 244767) in 3-MPN | Non-electroactive salt |
| 0.1 M urea (Sigma Aldrich, ref. U5128-500G) in H2O | Non-electroactive salt |
0.5 mM bis(2-phosphonoethyl) 4,4ʹ-bipyridinium dichloride* in
methanol (VWR chemicals, ref. 230526C003) | Electroactive (redox)
molecule |
1-Butyl-3-methylimidazolium iodide, BMI-I (Solvionic, ref.
IM0406C10) | Ionic liquid |
1-Ethyl-3-methylimidazolium bis(trifluoromethylsulfonyl)imide,
EMIM-TFSI (Solvionic, ref. M0208A10) | Ionic liquid |
poly(diallyldimethylammonium chloride) 20 wt.% solution,
PDADMAC (Sigma Aldrich, ref. 409022) | Polymer electrolyte |
Once cells were prepared, Seebeck coefficient and electric resistance (R) were measured before and after the pellets were in contact with the different electrolytes. For each electrolyte two samples were measured to evaluate repeatability when possible. Both S and R were measured in a home-made setup. The Seebeck coefficient was determined by placing the glass substrates with the pellet and the frame (for liquid electrolytes) or only the pellet (for PADAMAC) on top of a small Cu block (30 mm × 30 mm × 10 mm) with 3 inserted cartridge heaters (Watlow, ref. C1E13-L12) that acted as the heat source at the hot side, and on top of a large Cu block (50 mm × 50 mm × 30 mm) that served as heat sink at the cold side, as presented in Figure 2b. Thermal grease (RS, ref. 2173835) was used at the glass/Cu-blocks interfaces to improve the heat transfer. Two K-type thermocouples (RS, ref. 8140134) were positioned on both sides of the pellets to measure the temperature difference ΔT between the hot and cold side (see Figure 2a). These thermocouples were also used to measure the voltage differences, which was recorded using a nanovoltmeter (Keithley 2182A). To determine the Seebeck coefficient, the slope of the ΔT, which was varied from 0 to 5 K in 1 K steps using a PID temperature controller (Watlow EZ-zone), vs the open-circuit potential was calculated. The temperature differences were monitored using a dual datalogger thermometer (RS, ref. 1316). The errors of the measurements, obtained from the fitting error to the linear slope, were below 4%.
R was measured from the slope of current-voltage curves, obtained in a 4-probe mode as illustrated in Figure 2. Two spring probes (RS, ref. 2615092) were positioned on the lateral Ag paint contacts to measure the current. In addition, two similar probes were placed on top of the pellet to measure the voltage. The current was scanned using a Keithley 2450 source meter with a 10 ms delay time. The error of the measurements, determined from the fitting error of the slope, were below 2%. The electrical conductivity σ=L/(RA) was then determined using the distance between the voltage probes L, and the width and the thickness of the pellets that were used to calculate the cross-sectional area A.
Results and discussion
The structure of the synthesized powders was analyzed by XRPD. The XRPD pattern from the Bi2Te3 powders in Figure 3a indicates that the powders synthesized through the MW-assisted hydrothermal method have a rhombohedral lattice structure of Bi2Te3 space group of R-3m (JCPDS #15-0863). The lattice constants are a=b=4.38 Å and c=30.49 Å, which agree with the reported values (JCPDS #15-0863). The main peaks originated from the (006), (015), (10 10), and (00 15) planes. The sharp diffraction peaks are an indication of the highly crystalline nature of the synthesized Bi2Te3 nanostructures.
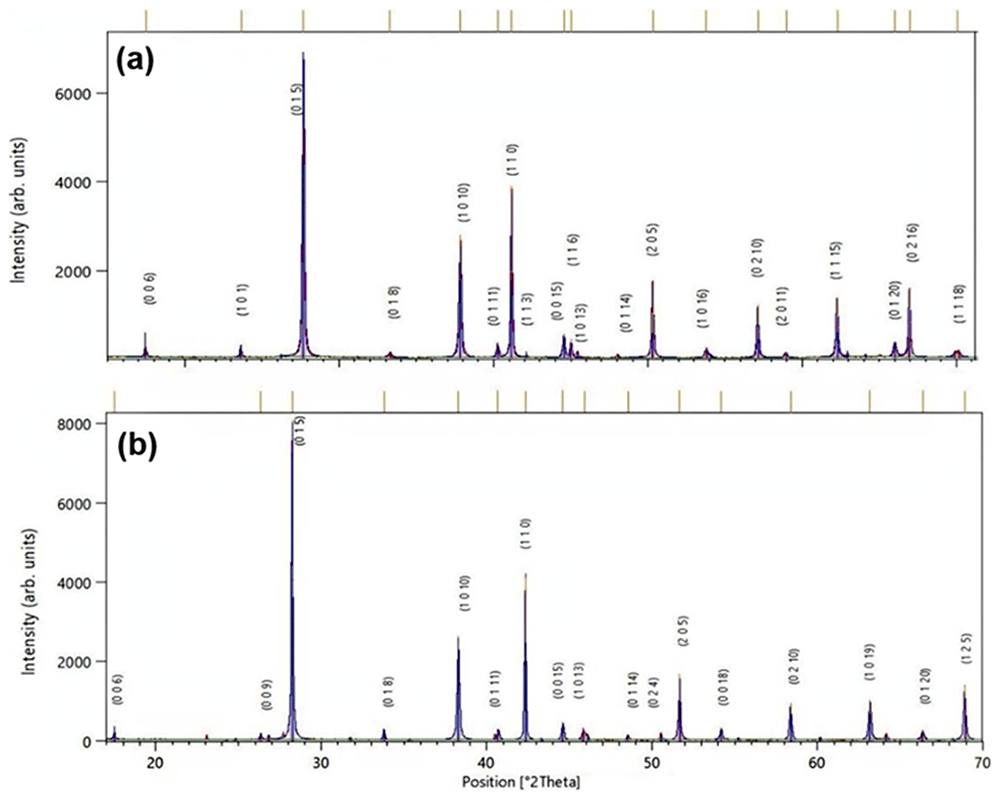
Figure 3. XRPD.
XRPD patterns of (a) Bi2Te3 and (b) Sb2Te3 nanocrystals synthesized by MW-assisted hydrothermal route. (Peaks are indexed to rhombohedral phase of Bi2Te3 with JCPDS #15-0863 and Sb2Te3 with JCPDS #01-071-0393).
Figure 3b shows the XRPD pattern of the as-prepared Sb2Te3 nanoplates and the diffraction peaks were indexed to the rhombohedral Sb2Te3 structure (JCPDS #01-071-0393). No peaks of Te or Sb oxide were detected, indicating the formation of single phase Sb2Te3 with a high phase purity. The sharp XRD peaks reveal a high crystallinity in the Sb2Te3 nanoplates.
Figure 4a represents the SEM micrograph of the Bi2Te3 nanoplatelets, which reveals that the typical powders consist of irregular structures mostly of hexagonal plate-like shapes and nanoparticles. The hexagonal platelets are 300 nm to 1 μm in diagonal and 20–70 nm in thickness, and the nanoparticles are 40–100 nm in diameter. On the other hand, Figure 4b displays the SEM micrographs of the Sb2Te3 nanoplatelets showing small and large platelets having edge lengths as small as 80 nm to approximately 1 μm, and thickness ranging from 30 to 120 nm. The presence of micro and nanostructures can provide an improved pathway for the conduction of the charge carriers along the grain boundary.
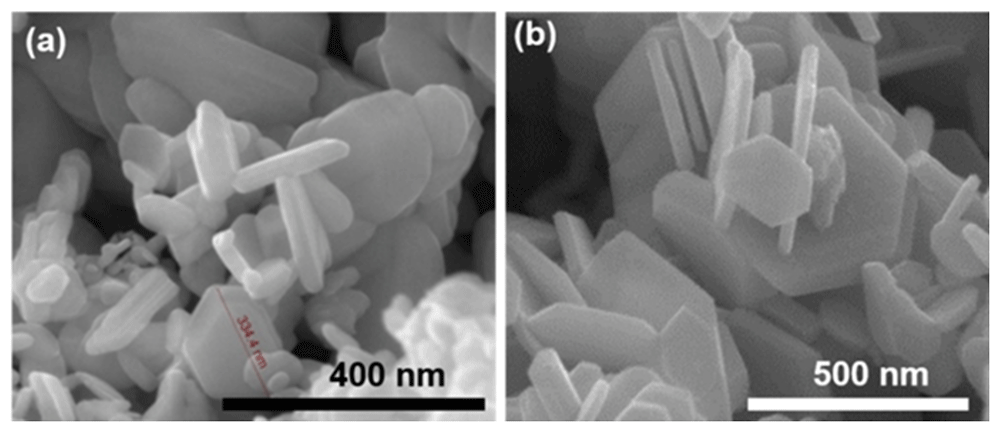
Figure 4. SEM of nanoparticles.
SEM micrographs of (a) Bi2Te3 and (b) Sb2Te3 nanoplatelets synthesized using MW-assisted hydrothermal route.
SEM was also carried out to evaluate the morphology of the prepared pellets. It can be observed from Figure 5 that porosity remains after pressing, since the nanoparticles were not completely compacted. The compaction density of the samples was estimated by taking the ratio of their packing density, calculated from geometrical measurements and mass data, to the theoretical density, from which the porosity was subsequently derived. Porosity values of 41% for Bi2Te3 and 32% for Sb2Te3 were estimated for the samples pressed at 100 MPa.
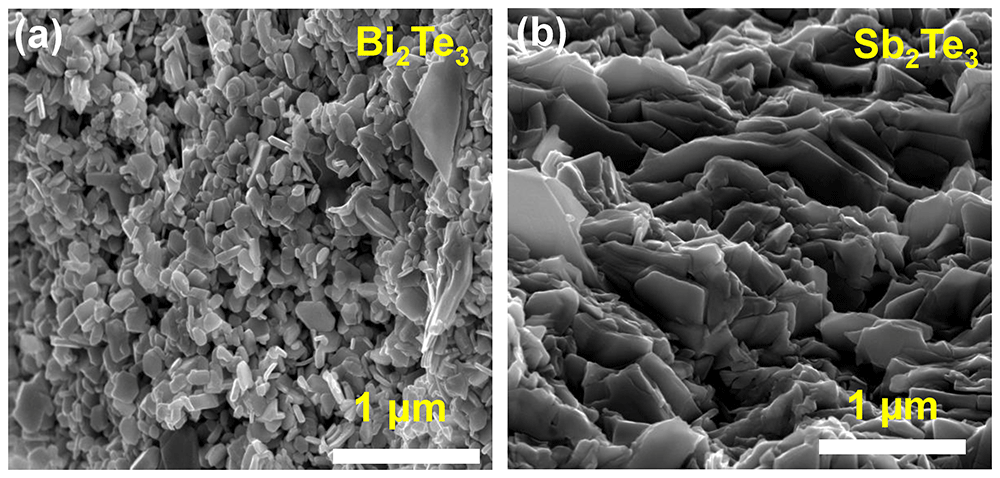
Figure 5. SEM of pellets.
SEM images of the cross-sectional view of cold-pressed (a) Sb2Te3 and (b) Bi2Te3 pellets compacted at 100 MPa.
The PFs of the pellets prepared were measured before and after the exposure to electrolytes. For Bi2Te3, the results obtained are shown in Table 2. It can be seen that none of the electrolytes evaluated offered PF improvements, since neither the Seebeck coefficient nor the electrical conductivity was significantly affected after the electrolytes were injected.
Table 2. Power factor of n-type samples.
Power factor measurements of Bi2Te3 pellets without and with different electrolytes. Results from two different samples are indicated as _1 and _2. The variations in Seebeck coefficient and electrical conductivity, as well as the power factor ratio are given.
| Electrolyte | Seebeck coefficient
(µV/K) | Electrical
conductivity
(S/cm) | Power factor
(µWK-2m-1) |
|---|
| Without | With | |ΔS|
(%) | Without | With | Δσ
(%) | Without | With | PFwith/
PFwithout |
|---|
| tBuNH4BF4 _1 | -98.08 | -101.86 | 3.85 | 13.5 | 13.4 | -0.7 | 12.9 | 13.9 | 1.08 |
| tBuNH4BF4 _2 | -94.74 | -95.71 | 1.02 | 13.0 | 12.6 | -3.07 | 11.6 | 11.5 | 0.99 |
| Guanidinium chloride_1 | -108.61 | -99.95 | -8.24 | 13.3 | 11.4 | -14.3 | 15.6 | 11.4 | 0.73 |
| Guanidinium chloride_2 | -98.14 | -102.69 | 4.63 | 10.6 | 10.3 | -2.91 | 10.2 | 10.8 | 1.06 |
| Benzoquinone_1 | -93.43 | -95.05 | 1.73 | 9.93 | 10.5 | 5.74 | 8.6 | 9.4 | 1.09 |
| Benzoquinone_2 | -104.17 | -103.62 | -0.52 | 10.8 | 10.3 | -4.63 | 11.7 | 11.0 | 0.94 |
| Cr(acac)3 _1 | -92.63 | -93.57 | 1.01 | 14.6 | 14.2 | -2.74 | 12.5 | 12.4 | 0.99 |
| Cr(acac)3 _2 | -88.40 | -94.76 | 7.19 | 17.2 | 15.9 | -7.55 | 13.4 | 14.2 | 1.06 |
On the other hand, the results obtained for the Sb2Te3 pellets are shown in Table 3. It can be seen again that none of the electrolytes evaluated offered significant PF enhancements, since both the Seebeck coefficient and the electrical conductivity were not significantly affected after injecting the electrolytes. We would like to remark that only one measurement per electrolyte was performed in the last electrolytes shown in Table 3 due to the shortage of samples. Finally, we would like to remark that the Seebeck coefficient values in BMI-I and EMIM-TFSI are smaller than in the other electrolytes since their open-circuit voltage were not be measured with the thermocouples (metal probes were used instead). In spite of this, we decided to include them since measurements are comparative and finally show the PF variations.
Table 3. Power factor of p-type samples.
Power factor measurements of Sb2Te3 pellets without and with different electrolytes. Results from two different samples are indicated as _1 and _2. The variations in Seebeck coefficient and electrical conductivity, as well as the power factor ratio are given.
| Electrolyte | Seebeck coefficient
(µV/K) | Electrical conductivity
(S/cm) | Power factor
(µW/K-2m-1) |
|---|
| Without | With | |ΔS|
(%) | Without | With | Δσ
(%) | Without | With | PFwith/
PFwithout |
|---|
| LiBF4_1 | 162.80 | 159.05 | -2.30 | 51.5 | 55.2 | 6.80 | 136.0 | 140.0 | 1.02 |
| LiBF4_2 | 155.90 | 152.61 | -2.11 | 10.4 | 10.2 | -1.77 | 25.3 | 23.7 | 0.94 |
| tBuNH4BF4 _1 | 153.65 | 151.70 | -1.26 | 16.2 | 16.1 | -0.61 | 38.2 | 37.0 | 0.97 |
| tBuNH4BF4 _2 | 153.72 | 155.48 | 1.14 | 18.2 | 15.7 | -13.7 | 43.0 | 37.9 | 0.92 |
| Urea_1 | 163.14 | 164.94 | 1.10 | 54.5 | 51.4 | -5.68 | 145.0 | 139.0 | 0.96 |
| Urea_2 | 163.32 | 163.10 | -0.13 | 40.3 | 44.1 | 9.43 | 107.1 | 117.0 | 1.09 |
| Viologen _1 | 161.08 | 167.85 | 4.20 | 43.6 | 47.5 | 8.94 | 113.2 | 133.1 | 1.18 |
| Viologen _1 | 155.70 | 154.75 | -0.61 | 18.7 | 22.0 | 17.7 | 45.0 | 52.1 | 1.16 |
| PDADMAC | 152.17 | 162.33 | 6.68 | 52.39 | 44.92 | -14.3 | 121.1 | 118.2 | 0.92 |
| BMI-I | 90.846 | 83.175 | -8.44 | 30.87 | 31.07 | 0.65 | 25.5 | 21.5 | 0.85 |
| EMIM-TFSI | 77.566 | 82.381 | 6.21 | 21.95 | 21.99 | 0.18 | 13.2 | 14.9 | 1.13 |
The observed lack of improvements in the PF can be attributed to a higher carrier concentration in the bismuth/antimony telluride alloys and a larger particle size, compared to the Sb-doped SnO2 material that showed PF improvements above 2.5 times for some of the electrolytes tested here. Nanostructured and porous oxides, such as the Sb:SnO2 material, typically show an exponential density of states below the conduction band, which is due to a large extent of disorder (e.g. surface and trap states and interparticle boundaries)18,19. If the carrier concentration and the particle size is low (e.g. 1018–1019 cm-3 and 2–40 nm18,19), the Fermi level typically lies within this exponential density of states and can move closer to the conduction band when equilibrating with an electrolyte, increasing thus the carrier concentration in the material and hence the electrical conductivity (non-degenerate semiconductor). This occurs because space charges cannot be developed at the surface of the nanoparticles and basically extend to the whole particle (varying the distance of the Fermi level with respect to the conduction band edge, in the case of an n-type material)20. This phenomena was observed in our previous studies with Sb:SnO214, that exhibited particle sizes of 4–10 nm.
This equilibration can occur by the formation of a double layer (electrons accumulated in the oxide balanced at the electrolyte part of the interface by cations) and/or by the presence of electroactive species (redox molecules) able to exchange electrons with the oxide. When the carrier concentration of the material is significantly high, the Fermi level no longer falls deep within the exponential density of states but very close or even within the conduction band (degenerate semiconductor). In this case, the equilibration with the electrolyte is achieved by space charges with low penetration inside the nanoparticles (basically at the surface of the oxide) and a significant change in the carrier concentration, and hence, a significant variation in the electrical conductivity of the material, is not possible. In TE materials, such as the bismuth/antimony telluride alloys used in this study, the Fermi level typically lies very close or within the conduction band (for n-type semiconductors) and hence the material is in the degenerate semiconductor situation. In addition, the dimensions of the nanoparticles of the pellets are higher than 2–40 nm (see Figure 5). These factors make difficult to increase the electrical conductivity and hence improve the PF.
Conclusions
In this study, we have analyzed the effect of electrolyte integration on the thermoelectric power factor of bismuth/antimony telluride alloys. First, we synthesized nanoparticles of n-type Bi2Te3 and p-type Sb2Te3 by microwave-assisted hydrothermal route. These were then consolidated by cold pressing to prepare porous pellets, while maintaining good power factor values. Both Bi2Te3 and Sb2Te3 pellets were brought in contact with different electrolytes, aiming to obtain power factor improvements. No significant variations in the power factors were reached in any of the electrolytes tested. Thus, the strategy of combining thermoelectric solids with electrolytes that produced significant power factor improvements for Sb-doped SnO2 cannot be extended to bismuth and antimony telluride alloys. This was attributed to the larger carrier concentration and particle sizes in these alloys, when compared to Sb:SnO2.
Ethics and consent
Ethical approval and consent were not required.