Introduction
Uveal melanoma (UM), which arises from melanocytes in the uvea, is the most common primary intraocular tumour in adults1. UM most commonly occurs in the choroid (90% of cases), followed by the ciliary body (6% of cases) and finally the iris (4% of cases)2. First line treatment options for primary UM (pUM) include local resection, radiation therapy (consisting of plaque radiotherapy and proton beam therapy) and enucleation3. Metastatic spread occurs in ~50% of UM patients, the most common site of metastatic spread is the liver, with liver-directed local treatments, such as hepatic artery embolization, being employed in mUM patients4–6. Unfortunately, regardless of the treatment received the prognosis for mUM is poor. One study conducted a systemic review and meta-analysis of 78 articles containing information about UM-patient survival, totalling 2494 patients7. The study reported the median overall survival across all treatments, including conventional chemotherapy, isolated hepatic perfusion, immunoembolization, surgery and checkpoint inhibitor treatment, to be 1.07 years7.
Currently there are few treatments available for mUM, with tebentafusp-tebn (KIMMTRAK) becoming the first Food and Drug Administration (FDA) and European Medicines Agency (EMA) approved disease-specific treatment for mUM in January and April 2022, respectively8,9. Tebentafusp-tebn is restricted to HLA-A*0201 haplotypes, whose prevalence is higher in European and North American Caucasian populations than other ethnic groups9–13. In August 2023, the HEPZATO KIT, which consists of melphalan injection via the hepatic delivery system, was approved by the FDA for mUM based off the FOCUS study results14,15. However, eligibility for the melphalan clinical trial curtailed strict criteria including patients must have unresectable metastases in less than half of the liver and extrahepatic disease limited to the bone, lymph nodes, subcutaneous tissues or lung that is amenable to resection or radiation15. These strict criteria would leave patients at advanced stages of disease unable to participate. At the data cutoff point of the study, the median overall survival in the treated population was 20.5 months with 80% of patients surviving at least 1 year and 43% surviving at least 2 years15. 95 patients assessed for safety after treatment with melphalan all reported at least one treatment-emergent adverse effects (TEAE), with 17.9% of patients discontinuing treatment due to TEAEs15.
Due to the poor prognosis and inadequate therapeutic interventions for mUM, there is a need to identify alternative therapeutic targets and drugs. GNAQ and GNA11 mutations are present in ~90% of UM cases16,17. Consequential constitutive activation of downstream signalling pathways, such as the protein kinase C (PKC) pathway, leads to cell proliferation contributing to cancer progression1. Darovasertib is a first-in-class oral, small molecule inhibitor of protein kinase C (PKC). Darovasertib potently inhibits the activity of the novel η, θ, δ, ε and classical α, β PKC isoforms, and was granted orphan drug designation for mUM by the U.S FDA on 2 May 202218,19. However, a recent study reported that darovasertib cannot suppress multiple active pathways in UM tumours20. This study involved the incubation of 11 different UM cell lines (92.1, MP46, MEL270, MP38, OMM1.3, OMM1.5, MP41, MEL285, MEL290 and MEL202) with 1 or 5 µM darovasertib20. The UM cells had three distinct responses to darovasertib: cytotoxic (defined as >25% in sub G1 content), cytostatic (defined as ≥30% S-phase inhibition, at both PKC inhibitor concentrations, without evidence of cell death) and resistant (defined as minor/inconsistent changes in cell cycle distribution with no evidence of cell death in response to PKC inhibition). PKC inhibition was cytotoxic in only the GNAQ-mutant Mel270 and GNA11-mutant OMM1 cell lines. These two cell lines showed substantial cell death (defined as >25% in sub G1 content). Another 7 UM cells lines displayed a cytostatic response after treatment with PKC inhibitors. These cells displayed ≥30% S-phase inhibition, at both PKC inhibitor concentrations, without evidence of cell death. Cytostatic UM cell lines included the 92.1, Mel202, OMM1.3, OMM1.5, MP38, MP41, and MP46. Meanwhile the Mel290 and Mel285 cell lines were resistant to darovasertib20.
Since darovasertib decreases UM cell proliferation but does not directly produce cell death, it was considered that it could be more efficacious when used in combination with other drugs20. Indeed, darovasertib in combination with crizotinib, a c-Met receptor tyrosine signalling inhibitor, has gained traction as a potential therapeutic strategy. C-Met is a receptor tyrosine kinase, that when bound to its ligand hepatocyte growth factor (HGF), leads to activation of a signalling cascade activating the Ras-ERK, STAT, and PI3K-AKT pathways, all implicated in oncogenic cell proliferation, survival, and motility21. Crizotinib is a small-molecule inhibitor that is selective for c-Met as well as anaplastic lymphoma kinase (ALK) and ROS proto-oncogene 1, receptor tyrosine kinase22. It inhibits cell proliferation, migration, and invasion of several tumour cell lines in vitro. Crizotinib also displayed significant antitumor activity in UM xenograft mouse models23. It is approved for the treatment of ALK expressing advanced and metastatic non-small cell lung cancer23. Darovasertib and crizotinib have been previously tested in vitro in the 92.1 and MEL202 (primary) and MM28 (metastatic) UM cell lines. Crizotinib synergised strongly with darovasertib in MEL202 and MM28 but not in the 92.1 cells24. However, these results are only reported in an abstract and not yet been peer-reviewed.
Darovasertib and crizotinib both initially entered clinical trials as single agents. Phase I clinical trial with darovasertib monotherapy showed that the median overall survival for patients with mUM treated with darovasertib was 13.2 months18. Crizotinib was evaluated in a single-arm, multicentre study in high-risk UM patients, who received treatment for pUM and had no evidence of metastasis. 34 patients enrolled and received at least one dose of crizotinib, but two patients withdrew early. Of these 32 patients left, 8 patients did not complete the trail due to disease recurrence or toxicity. After a median follow up duration of 47.1 months, 21 patients developed distant recurrent disease25. The median recurrence-free survival was 34.9 months, with a 32-month recurrence rate of 50% (95% CI, 33-67%)25.
Following the clinical trials as single agents, darovasertib and crizotinib entered clinical trials in combination. Positive interim phase 2 data was reported for darovasertib (300 mg twice daily) and crizotinib (200 mg twice daily) given to 20 evaluable first line and 63 evaluable any-line patients, 63% of these patients received at least 1 previous line of therapy and 43% received 2 or more prior lines of therapy in the metastatic setting (Clinical trial: NCT03947385). In the 20 evaluable first-line mUM patients, the confirmed overall response rate (ORR) was 45%, with 9 patients experiencing a partial response (PR). Furthermore, the disease control rate (DCR) was 90% and the median progression-free survival (PFS) was approximately 7 months. In evaluable patients who received the regimen in any line (n = 63), the confirmed ORR was 30%. The DCR was 87% and the median PFS was approximately 7 months. In the group of first- and any-line patients with hepatic-only disease (n = 20), the confirmed ORR with darovasertib plus crizotinib was 35%. The DCR was 100% and the median PFS was approximately 11 months. Darovasertib plus crizotinib was found to have a manageable toxicity profile26. Currently, there is an ongoing phase 2/3, multi-arm, multi-stage, open-label study of human leukocyte antigen (HLA)-A*02:01 negative participants with mUM who will be randomized to receive either darovasertib + crizotinib or investigator's choice of treatment (pembrolizumab, ipilimumab + nivolumab, or dacarbazine) (Clinical trial number: NCT05987332). Overall, it appears that darovasertib and crizotinib in combination shows promise as therapy for mUM.
The aim of this research was to determine in vitro, if darovasertib and crizotinib in combination have a greater effect on mUM cell proliferation than either drug alone. To our knowledge there are no publications detailing the effect of darovasertib and crizotinib, either alone or in combination, on the OMM2.5 cell line, nor the effects of darovasertib and crizotinib using the IncuCyte S3 Live-Cell Analysis System. The OMM2.5 cell was utilised as it is derived from a liver metastasis, which is the most common metastatic site in UM patients. Furthermore, the IncuCyte S3 Live-Cell Analysis System provides the ability to monitor the real-time effect of darovasertib and crizotinib on mUM cell proliferation, providing novel insights into the pharmacological activity of these drugs27.
Methods
Cell culture
OMM2.5 cells (kindly provided by Dr. Martine Jager, Leiden, The Netherlands) were cultured and passaged in complete media containing RPMI 160 with GlutaMAXTM Supplement (Gibco; Waltham, MA, USA) + 10% foetal bovine serum (FBS; Gibco) + 2% penicillin-streptomycin (PEST) and incubated at 37 ºC with 5% CO2, unless otherwise stated28. Cell passage number ranged from 23 to 77.
Drug preparation
0.08, 0.16, 0.31, 0.63, 1.25, 2.5, 5, 10 and 20 µM of darovasertib (#TA9H93CFC345-5MG, Merck) or crizotinib (#PZ0191-5MG, Merck) were prepared through a 1:2 serial dilution. For the drug combination experiments, a stock of 100 µM of crizotinib and 100 µM of darovasertib was prepared. 0.16, 0.31, 0.63 or 1.25 µM crizotinib were each tested in combination with 1.25, 2.5, 5 or 10 µM darovasertib. Total combination concentrations (TCC) of 1.88, 2.5, 2.81, 3.13, 3.75, 5.31, 5.63, 6.25, 10.63 and 11.25 µM crizotinib and darovasertib were prepared from the same 100 µM stock for the drug combination experiments. For the drug combination experiment, crizotinib and darovasertib were added to the plate at the same time point and cells were treated in duplicate.
MTT assay
Cell metabolism, an indirect measure of viability was determined using MTT (3-(4,5-dimethylthiazol-2-yl)-2,5-diphenyltetrazolium bromide) (#M5655, Sigma-Aldrich; St. Louis, MO USA) assay. 5000 cells per well were seeded into 96-well plates and allowed to adhere overnight. Cells were treated in either duplicate or triplicate with either 0.2% DMSO or 1% DMSO (#276855-100ML, Sigma-Aldrich) (vehicle control) or specific concentrations of darovasertib (#TA9H93CFC345-5MG, Merck) or crizotinib (#PZ0191-5MG, Merck) alone or in combination prepared in completed media for 96 hours. After 96 hours, the drug treatment was removed and 90 µL of prewarmed serum-free medium and 10 µl of 10% MTT solution, prepared by placing 5 mg of thiazolyl blue tetrazolium bromide in 1 ml of Phosphate-buffered saline (Gibco, Gaithersburg, MD, USA) in a fume hood, was added to each well. The plate was covered with tin foil and incubated for 2.5 hours at 37°C. After incubation, the MTT dye and media were removed and replaced with 100 µl of 100% DMSO to dissolve the formazan crystals. Cells with high metabolic activity stained purple, while cells with low metabolic activity were clear. Absorbance values were read at 570 nm using a SpectraMax M2 microplate reader (Molecular Devices Corporation, Sunnyvale, CA, USA). The overall % metabolic activity was calculated based on the vehicle control treated samples, following the formula: % metabolic activity = sample average absorbance/control average absorbance x 100. Statistical analysis was carried out by ANOVA with Dunnett’s post hoc multiple comparison test using GraphPad Prism software (GraphPad, SAN Diego, CA, USA). Data is presented as mean +/- standard deviation of the mean. Differences were considered statistically significant at p<0.05. One-Way and Two-Way Anova were carried out without a normality test being performed on the data. Background was not subtracted from final absorbance values28.
IncuCyte S3 Live-Cell Analysis System proliferation assay set-pp
5000 cells/well were seeded into a 96 well plate, 100 µL of cell/media solution was pipetted into each well. The 96 well plate was then placed into 37°C incubator to allow the cells to adhere. After 24 hours, the plate was examined under the microscope to check cell adherence. An image of the plate was then taken using the IncuCyte S3 Live-Cell Analysis System (Sartorius, Germany) at 10x magnification, this served as the time 0 time point. Cell media was then removed and replaced with the desired drug concentration. For darovasertib and crizotinib alone, cells were treated in triplicates with 0.2% DMSO (vehicle control) or specific concentrations of either darovasertib (Merck, TA9H93CFC345-5MG) or crizotinib (Merck, PZ0191-5MG). For drug combination experiments, cells were treated in duplicate, the drugs were added to the cells at the same time point, with 0.2% or 1% DMSO control. Cells were incubated for 96 hours with the drugs. The IncuCyte S3 Live-Cell Analysis System was set to take images of the cells every 3 hours at 10X magnification throughout the 96-hour long experiment. One-Way and Two-Way Anova was carried out without a normality test being performed on the data.
IncuCyte S3 Live-Cell Analysis
Following completion of the 96-hour treatment, an adherent cell by cell analysis was carried out on the obtained images using the IncuCyte S3 Live-Cell Analysis System. The cell boundary, seed and cell by cell parameters were adjusted based off the images obtained of the cells. Following completion of this analysis, a dead/alive analysis was carried out on the cells using the IncuCyte S3 Live-Cell Analysis Software. Dead cells were selected based off wells with the highest level of cell death, while alive cells were selected based off wells with the highest level of cell viability. Statistical analysis was carried out by ANOVA with Dunnett’s post hoc multiple comparison test using GraphPad Prism software. Data is presented as mean +/- standard deviation of the mean. Differences were considered statistically significant at p<0.05. The average confluence of each well was calculated and normalised against the baseline (time 0). Adherent cell by cell analysis, which performs label-free adherent cell counts and subsequent cell-by-cell classification based on cell shape, size or fluorescence intensity, was carried out using the IncuCyte S3 Live-Cell Analysis System software.
Additive or greater than additive analysis
For the combination data, the results are shown as the % reduction in cell metabolic activity or cell proliferation. This was calculated by subtracting the cell metabolic activity or cell proliferation at a given concentration from the cell metabolic activity or cell proliferation of the DMSO-treated cells at that time point. This allowed for easier comparison between the effects of the drugs alone and in combination. If a treatment showed a negative % reduction in comparison to DMSO, the reduction was set to 0 %. If the calculated combined predicted effect of darovasertib and crizotinib was greater than 100%, it was adjusted to 100% for data analysis. A combination was deemed to be greater than additive if the drug combination was statistically different than crizotinib alone, darovasertib alone and the predicted % reduction of crizotinib and darovasertib. If a combination was statistically significant in comparison to crizotinib alone, darovasertib alone and equivalent to the predicted % additive reduction of darovasertib and crizotinib, it was concluded that the combination was additive. Conversely, a combination was indicated as antagonistic if it was statistically less effective than either crizotinib alone or darovasertib alone.
Statistical analysis
Statistical analysis was performed using GraphPad Prism v8.2.1 (GraphPad Software, San Diego, CA, USA). Normality test was not performed on the data. Either one-way or two-way ANOVA, with Dunnett’s post-hoc analysis, was used as indicated in figure legends. Error bars depict the standard deviation of the mean (St. Dev), indicating the variability among samples. The investigators were not blinded to allocation during experiments and outcome assessment. Significance was set at p-value less than 0.0528.
IC50 curves
IC50 curves were generated using GraphPad Prism v8.2.1. Concentrations were transformed to log values. DMSO control was represented as 1, every other concentration of crizotinib or darovasertib was increased by 1 in line with the DMSO control. Non-linear regression was performed, using log(inhibitor) vs. normalized response—Variable slope. 1 was subtracted from the generated IC50 value to account for the addition of 1 to all of the concentrations.
Results
Crizotinib or darovasertib alone reduce metastatic uveal melanoma cell metabolic activity
Darovasertib is a first-in-class oral, small molecule inhibitor of PKC (schematic in Figure 1A). It potently inhibits the activity of the novel η, θ, δ, ε and classical α, β PKC isoforms18. Meanwhile crizotinib is a small-molecule inhibitor that is selective for c-Met (schematic in Figure 1A) as well as anaplastic lymphoma kinase (ALK) and ROS proto-oncogene 1, receptor tyrosine kinase22 (Figure 1A). Darovasertib or crizotinib have not previously been tested, either alone or in combination, in the mUM OMM2.5 cell line. In this study, the effect of crizotinib and darovasertib alone, on metabolic activity was initially assessed using the MTT assay (Figure 1B–E).
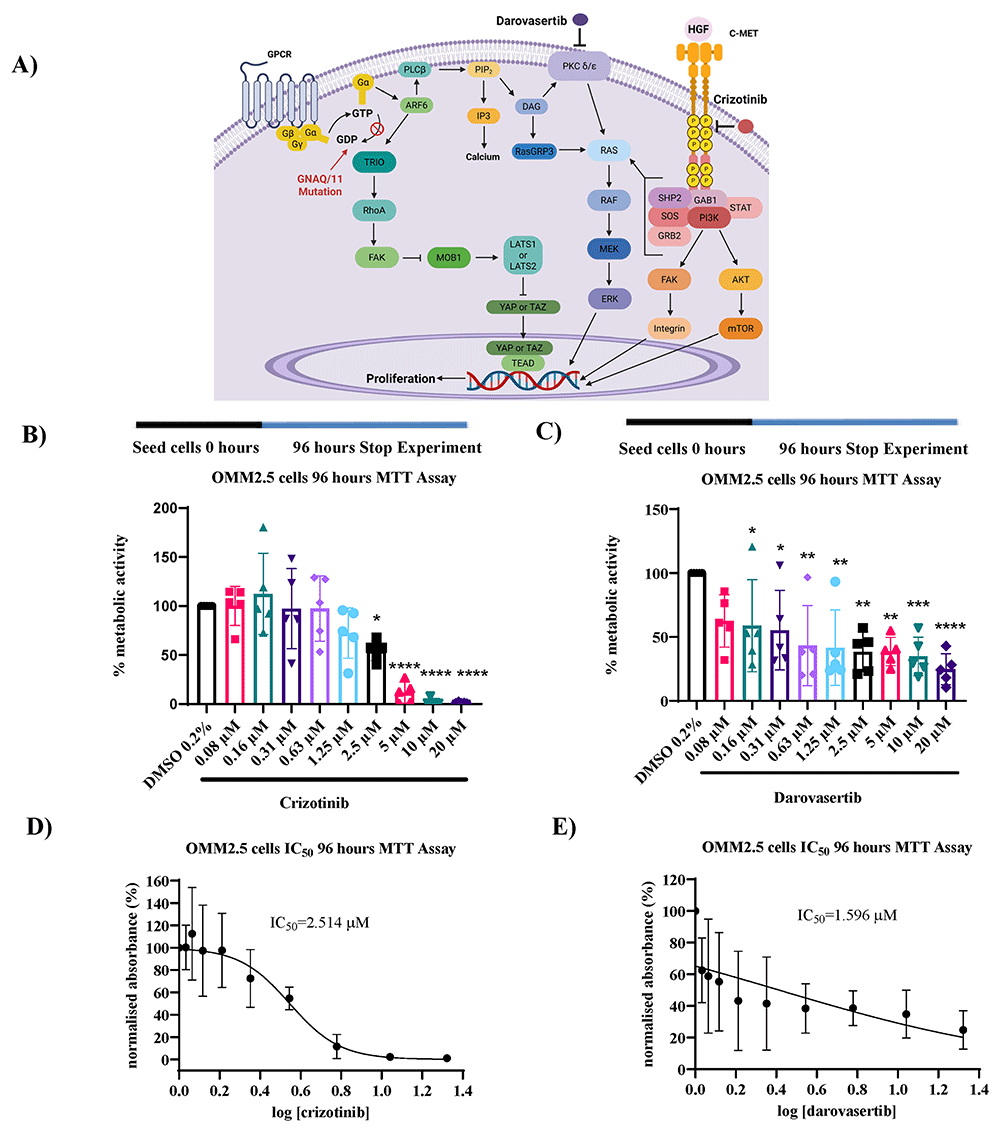
Figure 1. Crizotinib and darovasertib alone significantly reduce metastatic uveal melanoma cell metabolic activity.
A) Schematic of the cellular pathways targeted by darovasertib and crizotinib. Darovasertib inhibits protein kinase C signalling while crizotinib inhibits c-MET receptor tyrosine kinase signalling, which can attenuate cancer cell proliferation. This dual inhibition may suppress downstream activation of the MAPK and PI3K/AKT pathways, which are key drivers of uveal melanoma cell growth and survival. GPCR= G-protein-coupled receptor, GDP= guanosine diphosphate, GTP= guanosine triphosphate, ARF6= ADP-ribosylation factor 6, TRIO= guanine nucleoside exchange factor, RhoA= ras homolog family member A, FAK= focal adhesion kinase, LATS1/LATS2= large tumour suppressor kinase ½, YAP= Yes-associated protein, TAZ= PDZ-binding motif, TEAD= transcriptional enhancer factor, PLCβ= phospholipase C beta, PIP2= phosphatidylinositol diphosphate, IP3 = inositol triphosphate, DAG= diacylglycerol, PKC= protein kinase C, RasGRP3= RAS guanyl-releasing protein-3, RAS= Rat sarcoma virus, RAF= Rapidly accelerated fibrosarcoma, MEK= mitogen-activated protein kinase, ERK= extracellular signal-regulated kinases, HGF= hepatocyte growth factor, c-MET= mesenchymal epithelial transition, GAB1= Grb2-associated binder 1, SHP2= Src homology 2 domain-containing, GRB2= growth factor receptor-bound protein 2, SOS= son of sevenless, PI3K= phosphatidylinositol 3-kinase, STAT= signal transducer and activator of transcription, AKT= protein kinase B, mTOR= mechanistic target of rapamycin [Adapted from (1,18,29–31)]. Created with BioRender.com. Subscription: Institution (University College Dublin) B) Graph showing the effect on OMM2.5 cellular metabolism of 96-hour treatment with 0.08 µM, 0.16 µM, 0.31 µM, 0.63 µM, 1.25 µM, 2.5 µM, 5 µM, 10 µM and 20 µM of crizotinib (n=5). C) Graph showing the effect on OMM2.5 cellular metabolism of 96-hour treatment with 0.08 µM, 0.16 µM, 0.31 µM, 0.63 µM, 1.25 µM, 2.5 µM, 5 µM, 10 µM and 20 µM in OMM2.5 of darovasertib (n=5). D) IC50 for crizotinib in OMM2.5 cells following a 96-hour treatment, as determined by metabolic activity assay. E) IC50 for darovasertib in OMM2.5 cells following 96-hour treatment, as determined by metabolic activity assay. Cell metabolic activity was determined using MTT (3-(4,5-dimethylthiazol-2-yl)-2,5-diphenyltetrazolium bromide) assay. 5000 cells were seeded and treated in triplicate for each individual experiment. Statistical analysis was performed by One-Way Anova with Dunnett’s post hoc multiple comparison test. Error bars are mean ± S.D.*p<0.05 **p<0.01, ***p<0.001, ****p<0.0001. 0.2 % DMSO (vehicle control). No normality test was performed on the data.
96-hour crizotinib treatment resulted in a dose-dependent reduction in OMM2.5 cell metabolic activity, 2.5, 5, 10 or 20 µM crizotinib significantly reduced OMM2.5 metabolic activity on average to 54.6% (p=0.0331), 11.6% (p<0.0001), 2.2% (p<0.0001) or 1.1% (p<0.0001), respectively (Figure 1B).
Similarly, 96-hour darovasertib treatment resulted in a dose-dependent reduction in OMM2.5 cell metabolic activity. 0.16, 0.31, 0.63, 1.25, 2.5, 5, 10 or 20 µM darovasertib significantly reduced OMM2.5 metabolic activity on average to 58.8% (p=0.0473), 55.4% (p=0.0264), 43.3% (p=0.0027), 41.6% (p=0.0019), 38.4% (p=0.0010), 38.7% (p=0.0011), 34.8% (p=0.0005) or 24.8% (p<0.0001), respectively (Figure 1C). In the OMM2.5 MTT assays, the IC50 of crizotinib at 96 hours is 2.514 µM (95% CI: 1.926 µM to 3.279 µM), while the IC50 of darovasertib is 1.596 µM (95% CI: 0.578 µM to 3.529 µM) at 96 hours (Figure 1D, E).
Crizotinib and darovasertib in combination do not reduce OMM2.5 cell metabolic activity to a greater extent than either drug alone
Consequently, the effect of crizotinib and darovasertib in combination, on metabolic activity was assessed using the MTT assay (schematic in Figure 2A). For the combinations, crizotinib was tested at 0.16 µM, 0.31 µM, 0.63 µM or 1.25 µM. While darovasertib was tested at 1.25 µM, 2.5 µM, 5 µM or 10 µM. For the drug combinations, the MTT results are calculated as % reduction in cell metabolic activity compared to DMSO controls. In the tabulated data, the specific drug combination is compared to i) each of the drugs tested alone at the same concentration and ii) the predicted additive effect of the specific combination based on summing the activity from the individually tested drugs (Figure 2B). A drug combination being greater than additive was defined as displaying activity statistically higher than: a) equimolar crizotinib alone, b) equimolar darovasertib alone and c) the predicted % reduction for additive effects. A drug combination was deemed additive if the activity was significantly greater to a) equimolar crizotinib alone and b) equimolar darovasertib alone but equivalent to the predicted % additive reduction. A one-way Anova was carried out to determine statistical significance at the 48- and 96-hour timepoints.
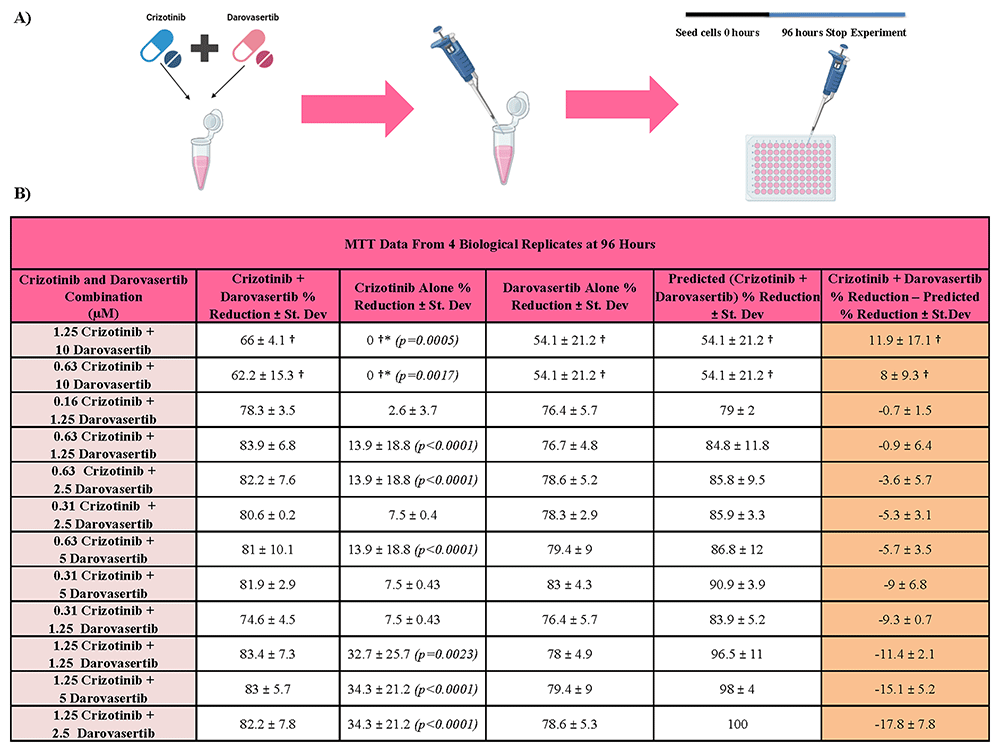
Figure 2. Crizotinib and darovasertib in combination do not have a greater effect on metastatic uveal melanoma cell metabolic activity than either drug alone.
A) Schematic showing how darovasertib and crizotinib were added in combination to the OMM2.5 cells. B) Average % reduction in metabolic activity across four biological MTT replicates with crizotinib and darovasertib in combination (n=2, 3 or 4). The drug combination results for the MTT assay are ordered with the combination with the greatest difference between the observed and predicted % reduction at the top. † indicates that 1% DMSO was used to normalise the data, otherwise 0.2% DMSO was used to normalise the data. * indicates that the concentration was prepared in 0.2% DMSO but compared to 1% DMSO. Data is presented as mean ± Standard Deviation. Statistical analysis was performed by One-Way Anova with Dunnett’s post hoc multiple comparison test, comparing the combination treatments (n=3 or 4) to crizotinib alone, darovasertib alone and the % predicted additive effect. Only significant p values are shown. A normality test was not performed on the data. Cell metabolic activity was determined using MTT (3-(4,5-dimethylthiazol-2-yl.
The drug combination results for the MTT assay are ordered with the combination with the greatest difference between the observed and predicted % reduction at the top (Figure 2B). The table shows the average % reduction for each treatment across the MTT replicates for the most promising drug combinations (Figure 2B). Any combinations using 10 µM darovasertib were compared to 1% DMSO, to account for higher vehicle DMSO concentrations in those solutions. Based on these parameters, the 96-hour MTT results with crizotinib plus darovasertib drug combinations indicate that none of the combinations are additive or greater than additive (Figure 2B). One-way ANOVA on the combination of 0.63 µM crizotinib with 1.25, 2.5, or 10 µM darovasertib, or the combination of 1.25 µM crizotinib and 1.25, 2.5, 5 or 10 µM darovasertib revealed significant changes only compared to 0.63 µM crizotinib or 1.25 µM crizotinib alone, but not to darovasertib alone. Therefore, these combinations did not meet the criteria for additive drug effects (Figure 2B).
Crizotinib alone significantly reduces metastatic uveal melanoma live cell proliferation
To assess the effects of single and combinations drugs on the proliferation of OMM2.5 mUM cells, live cell proliferation was analysed from 12 to 96 hours post treatment using an IncuCyte S3 Live-Cell Analysis System (Figure 3A). Time points of every 12 hours were used for data analysis, which revealed that crizotinib had a time-dependent as well as a dose-dependent effect on OMM2.5 cell proliferation. (Figure 3A). Cell images revealed a difference in OMM2.5 cell morphology with concentrations of crizotinib above 1.25 uM, compared to the 0.2% DMSO controls (Figure 3B). The changes included fewer cells and cellular shrinkage, which is a characteristic of cell death32. At 96 hours, 5, 10 or 20 µM crizotinib significantly reduced live cell proliferation to 19.4% (p<0.0001), 11.24% (p<0.0001), or 9.4% (p<0.0001) respectively (Figure 3C). The IC50 of crizotinib for live cell proliferation was 4.122 µM at 96 hours, GraphPad prism software could not generate a confidence interval (Figure 3D).
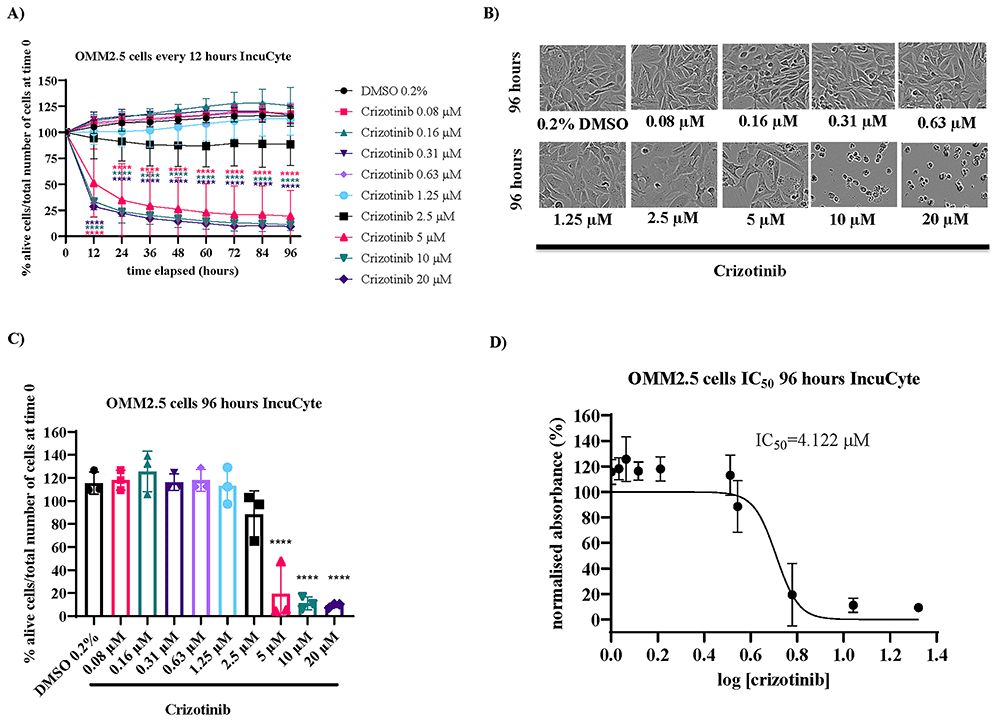
Figure 3. Crizotinib alone significantly reduces metastatic uveal melanoma cell proliferation.
A) Graph showing the effect of 96-hour treatment with 0.08 µM, 0.16 µM, 0.31 µM, 0.63 µM, 1.25 µM, 2.5 µM, 5 µM, 10 µM and 20 µM of crizotinib on OMM2.5 cell line proliferation (n=3). Statistical analysis was performed by Two-Way with Dunnett’s post hoc multiple comparison test. ****p<0.0001. The pink * indicates significance for 5 µM crizotinib, the green * indicates significance for 10 µM crizotinib and the purple * indicates significance for 20 µM crizotinib, compared to 0.2% DMSO B) IncuCyte S3 Live-Cell images of OMM2.5 cells, taken at 10 x magnification, treated with 0.2% DMSO and 0.08 µM, 0.16 µM, 0.31 µM, 0.63 µM, 1.25 µM, 2.5 µM, 5 µM, 10 µM and 20 µM crizotinib at 96 hours. C) The effect of 96-hour crizotinib treatment on OMM2.5 cell line proliferation (n=3). Statistical analysis was performed by One-Way Anova with Dunnett’s post hoc multiple comparison test. ****p<0.0001. D) IC50 of crizotinib in OMM2.5 cells following a 96-h treatment, as determined by IncuCyte S3 Live-Cell proliferation analysis (n=3). Cell proliferation was determined using IncuCyte S3 Live-Cell analysis system. 5000 cells were seeded and treated in triplicate for each experiment; images were taken every 3 hours at 10x magnification. Data is normalized to number of cells present in each well at time 0 and presented as % alive cells divided by the number of total cells present in the well at that time point. Error bars are mean ± standard deviation. Normality test was not performed on the data. 0.2 % DMSO (vehicle control).
Darovasertib alone significantly reduces metastatic uveal melanoma live cell proliferation
For darovasertib, the effects of single drug concentrations on the proliferation of OMM2.5 mUM cells, was likewise analysed from 12 to 96 hours post treatment using IncuCyte S3 Live-Cell Analysis (Figure 4A). Time points of every 12 hours were used for data analysis, which revealed that darovasertib had a time- and dose-dependent effect on OMM2.5 cell proliferation. (Figure 4A). Cell images revealed a difference in OMM2.5 cell morphology for concentrations of darovasertib above 1.25 µM, compared to the 0.2% DMSO control (Figure 4B). The changes again are consistent with cell death, including fewer cells and cellular shrinkage32.
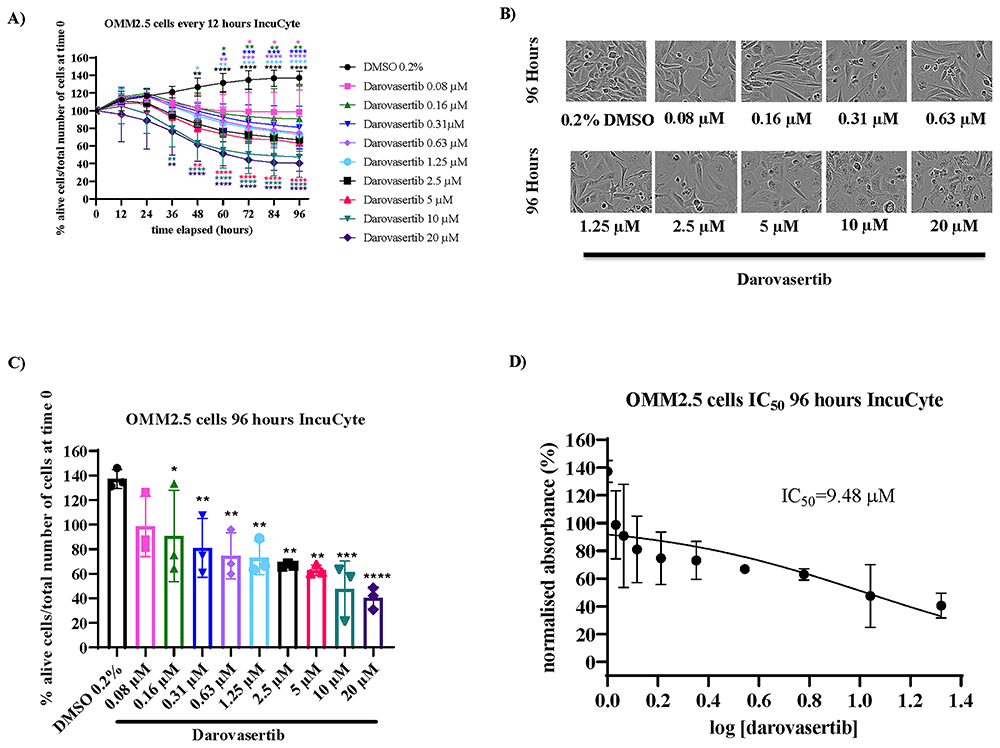
Figure 4. Darovasertib alone significantly reduces metastatic uveal melanoma cell proliferation.
A) Graph shows the effect of 96-hour treatment with 0.08 µM, 0.16 µM, 0.31 µM, 0.63 µM, 1.25 µM, 2.5 µM, 5 µM, 10 µM and 20 µM of darovasertib on OMM2.5 cell line proliferation (n=3). Statistical analysis was performed by Two-Way Anova with Dunnett’s post hoc multiple comparison test. *p<0.05, **p<0.01, ***p< 0.001. The dark pink * indicates significance for 0.08 µM darovasertib, the dark green * indicates significance for 0.16 µM darovasertib, the dark blue* indicates significance for 0.31 µM darovasertib, the light purple * indicates significance for 0.63 µM darovasertib, the light blue * indicates significance for 1.25 µM darovasertib, the black * indicates significance for 2.5 µM darovasertib, the pink * indicates significance for 5 µM crizotinib, the light green * indicates significance for 10 µM crizotinib and the dark purple * indicates significance for 20 µM crizotinib compared with 0.2% DMSO. B) IncuCyte S3 Live-Cell images of OMM2.5 cells treated with 0.2% DMSO and 0.08 µM, 0.16 µM, 0.31 µM, 0.63 µM, 1.25 µM, 2.5 µM, 5 µM, 10 µM and 20 µM darovasertib at 10x magnification at 96 hours C) The effect of 96-hour crizotinib treatment on OMM2.5 cell line proliferation (n=3). Statistical analysis was performed by Two-Way or One-Way Anova with Dunnett’s post hoc multiple comparison test. *p<0.05, **p<0.01, ***p< 0.001, ****p<0.0001. D) IC50 of darovasertib in OMM2.5 cells following a 96-h treatment, as determined by IncuCyte S3 Live-Cell Analysis System (n=3). Cell proliferation was determined using IncuCyte Live-Cell imaging system. 5000 cells were seeded and treated in triplicate for each experiment; images were taken every 3 hours at 10x magnification. Data is normalized to number of cells in each well at time 0 and presented as % alive cells divided by the number of total cells in the well at that time point. Error bars are mean ± standard deviation. No normality test was performed on the data. 0.2 % DMSO (vehicle control).
At 96 hours, 0.31, 1.25, 2.5, 5,10 or 20 µM darovasertib significantly reduced cell proliferation to 81% (p=0.0141), 74.7% (p=0.0058), 73% (p=0.0046), 66.9% (p=0.0019), 63% (p=0.0011), 47.5% (p=0.0001) or 40.5% (p<0.0001), respectively (Figure 4C). The IC50 of darovasertib for live cell proliferation at 96 hours was 9.48 µM (95% CI: 5.046 to 25.61) (Figure 4D).
Crizotinib and darovasertib combinations exhibit additive or greater effects on metastatic uveal melanoma live cell proliferation
For the IncuCyte S3 Live-Cell analysis of pharmacological effects on cell proliferation of crizotinib plus darovasertib drug combinations (Table 1), either 0.16 µM, 0.31 µM, 0.63 µM or 1.25 µM crizotinib were tested in combination with either 1.25 µM, 2.5 µM, 5 µM or 10 µM darovasertib. The IncuCyte results were calculated as % reduction in cell proliferation compared to DMSO controls. This data is tabulated, and the specific drug combination is compared to; i) each of the drugs tested alone at the same concentration and ii) the predicted additive effect of the specific combination based on summing the activity from the individually tested drugs (Table 1).
Table 1. Crizotinib and darovasertib in combination do have a greater effect on metastatic uveal melanoma cell proliferation than either drug alone.
Average % reduction in proliferation across four biological IncuCyte S3 Live-Cell replicates with crizotinib and darovasertib in combination (n=2, 3 or 4). † indicates that 1% DMSO was used to normalise the data, otherwise 0.2% DMSO was used to normalise the data. * indicates that the concentration was prepared in 0.2% DMSO but compared to 1% DMSO. Data is shown +/- Standard Deviation. Statistical analysis was performed by One-Way Anova with Dunnett’s post hoc multiple comparison test, comparing the combination treatments (n=3 or 4) to crizotinib alone, darovasertib alone and the % predicted additive effect. Only significant p values are shown. A normality test was not performed on the data. 5000 cells were seeded and treated in duplicate for each experiment; images were taken every 3 hours at 10x magnification. Data is normalized to number of cells present in each well at time 0 and presented as % alive cells divided by the number of total cells present in the well at that time point. 0.2% DMSO or 1% DMSO served as vehicle control. TCC=Total Combination Concentration. Data is presented as mean ± Standard Deviation.
| IncuCyte S3 Live-Cell Data From 4 Biological Replicates 96 Hours |
|---|
Crizotinib and Darovasertib Combination
(µM) | Crizotinib + Darovasertib % Reduction ± St.Dev | Crizotinib Alone % Reduction ± St. Dev | Darovasertib Alone % Reduction ± St.Dev | Predicted (Crizotinib + Darovasertib) % Reduction ± St.Dev | Crizotinib + Darovasertib % Reduction – Predicted % Reduction ± St.Dev | TCC
(µM) | Crizotinib at TCC % Reduction ± St.Dev | Darovasertib at TCC % Reduction ± St.Dev |
|---|
0.63 Crizotinib +
1.25 Darovasertib | 73.8 ± 9 | 1.8 ± 2.5 (p<0.0001) | 62 ± 11.5 | 63.9 +/- 9.4 | 9.9 ± 0.4 | 1.88 | 25.1 ± 29.6 | 67.9 ± 2.3 |
| 0.63 Crizotinib + 2.5 Darovasertib | 74.4 ± 0.8 | 1.8 ± 2.5 (p<0.0001) | 65.6 ± 1.9 (p=0.0005) | 67.5 ± 2.5 (p=0.0028) | 7 ± 3.2 | 3.13 | 33.1 ± 21.9 | 74.6 ± 7.6 |
| 0.63 Crizotinib + 10 Darovasertib | 40.5 ± 31.3† | 0†* | 34.6 ± 29.7† | 34.6 ± 29.7† | 5.9 ± 1.7† | 10.63† | 75.4 ± 36.8† | 43.1 ± 27.6† |
| >1.25 Crizotinib + 10 Darovasertib | 48.6 ± 21.8† | 0†* (p=0.0316) | 42.8 ± 25.4† | 42.8 ± 25.4† | 5.8 ± 3.8† | 11.25† | 81.8 ± 30.8† | 44.6 ± 25.1† |
| 1.25 Crizotinib + 1.25 Darovasertib | 80.5 ± 3 | 13.8 ± 18.3 (p<0.0001) | 62 ± 11.5 | 75.8 ± 10.2 | 4.7 ± 10.7 | 2.5 | 43 ± 28.8 | 65.8 ± 1.5 |
| 0.63 Crizotinib + 5 Darovasertib | 75.8 ± 3.3 | 1.8 ± 2.5 (p<0.0001) | 71.6 ± 0.6 | 73.5 ± 2.1 | 2.3 ± 5.1 | 5.63 | 80.9 ± 16.2 | 72.3 ± 3.3 |
| 1.25 Crizotinib + 2.5 Darovasertib | 79.7 ± 2.3 | 11.8 ± 15.4 (p<0.0001) | 65.8 ± 1.5 | 77.6 ± 14.8 | 2.1 ± 17 | 3.75 | 45.1 ± 22 | 70 ± 0.3 |
| 0.31 Crizotinib + 2.5 Darovasertib | 67.7 ± 2 | 0.7 ± 1 | 65.9 ± 2.6 | 66.6 ± 1.5 | 1.1 ± 3.5 | 2.81 | 37.4 ± 27.2 | 67.9 ± 7 |
| 0.31 Crizotinib + 5 Darovasertib | 72.3 ± 1.9 | 0.7 ± 1.0 | 71.9 ± 0.7 | 72.6 ± 0.3 | -0.3 ± 2.3 | 5.31 | 74.8 ± 2.1 | 69.9 ± 3.8 |
| 0.31 Crizotinib + 1.25 Darovasertib | 68 ± 0.7 | 0.7 ± 1 | 68.3 ± 5.4 | 69 ± 6.4 | -1 ± 5.7 | 1.56 | Not Calculated | Not Calculated |
| 1.25 Crizotinib + 5 Darovasertib | 78.6 ± 4.6 | 11.8 ± 15.4 (p<0.0001) | 71.7 ± 0.6 | 82.2 ± 12.2 | - 3.5 ± 16.2 | 6.25 | 98.4 ± 20.8 | 69.9 ± 6.2 |
| 0.16 Crizotinib + 1.25 Darovasertib | 65.7 ± 3.5 | 3 ± 4.2 | 68.3 ± 5.4 | 71.2 ± 9.6 | -5.5 ± 13.1 | 1.41 | Not Calculated | Not Calculated |
The data is ordered from highest difference between the observed % reduction of darovasertib plus crizotinib in combination, minus the predicted % reduction of darovasertib and crizotinib in combination. Any combinations using 10 µM darovasertib were compared to 1% DMSO, to account for higher DMSO in the solution. Based on these parameters, the 96-hour live cell proliferation results with crizotinib plus darovasertib drug combinations identifies the four-highest rank combinations (0.63 uM crizotinib + 1.25 uM darovasertib; 0.63 uM crizotinib + 2.5 uM darovasertib 0.63 uM crizotinib + 10 uM darovasertib and 1.25 uM crizotinib + 10 uM darovasertib) where the observed activity of the combinations appears greater (~5.9 to ~9.9%) than the calculated additive effect of the individual drugs (Table 1).
Based on this ranking, selective drug combinations were analysed in greater detail. A combination being greater than additive was defined as a drug combination being statistically greater than a) equimolar crizotinib alone, b) equimolar darovasertib alone and c) the predicted % reduction in proliferation for the additive effects of darovasertib and crizotinib. A drug combination was deemed additive if it were significantly greater to a) equimolar crizotinib alone and b) equimolar darovasertib alone but equivalent to the predicted % additive reduction. We focused on the 48-hour and 96-hour timepoints as OMM2.5 cells have a doubling time of 50 hours33. Applying these parameters the combination of 0.63 µM crizotinib and 1.25 µM darovasertib was identified as being greater than additive (Table 1)
1.25 µM crizotinib and 1.25 µM darovasertib in combination have an additive effect on metastatic uveal melanoma cell proliferation at 48 hours
To analyse the effects of the combinations on the proliferation of OMM2.5 mUM cells, IncuCyte data was analysed every 12 hours from 12 to 96 hours post-treatment (Figure 5A). 1.25 µM crizotinib and 1.25 µM darovasertib in combination had a time dependent effect on OMM2.5 cell proliferation (Figure 5A).
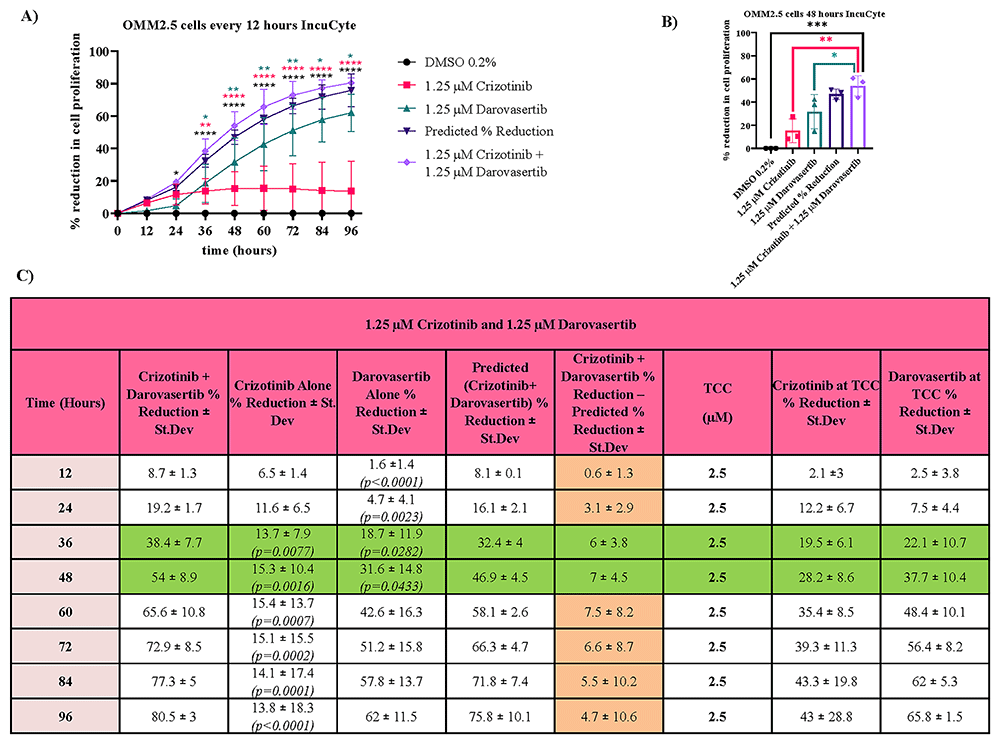
Figure 5. 1.25 µM crizotinib and 1.25 µM darovasertib in combination have an additive effect on metastatic uveal melanoma cell proliferation at 48 hours.
A) The effect of 96-hour treatment with 1.25 µM crizotinib and 1.25 µM darovasertib in combination on cell proliferation (n=3). Statistical analysis was performed by Two-Way Way Anova with Dunnett’s post hoc multiple comparison test, comparing 1.25 µM crizotinib and 1.25 µM darovasertib to all the other conditions. *p<0.05, **p<0.01, ****p<0.0001. The black * indicates significance of 1.25 µM crizotinib and 1.25 µM darovasertib in combination compared to 0.2% DMSO, the pink * indicates significance of 1.25 µM crizotinib and 1.25 µM darovasertib in combination compared to 1.25 µM crizotinib and the green * indicates significance of 1.25 µM crizotinib and 1.25 µM darovasertib in combination compared to 1.25 µM darovasertib. B) The effect of 48-hour treatment with 1.25 µM crizotinib and 1.25 µM darovasertib in combination on cell proliferation (n=3). Statistical analysis was performed by One-Way Anova with Dunnett’s post hoc multiple comparison test, comparing 1.25 µM crizotinib and 1.25 µM darovasertib to all the other conditions. *p<0.05, **p<0.01,***p<0.001. C) The average % reduction of IncuCyte S3 Live-Cell replicates every 12 hours across the 96-hour treatment (n=3). TCC=Total Combination Concentration. Statistical analysis was performed by One-Way Anova with Dunnett’s post hoc multiple comparison test, comparing 1.25 µM crizotinib and 1.25 µM darovasertib (n=3) to crizotinib alone, darovasertib alone and the % predicted additive effect. Only significant p values are shown. Green indicates additive, white indicates that the combination is neither antagonistic, additive or greater than additive at that timepoint. 5000 cells were seeded and treated in duplicate for each individual experiment. Cell proliferation was determined using IncuCyte S3 Live-Cell analysis system, images were taken every 3 hours at 10x magnification. Data is normalized to number of cells present in each well at time 0 and presented as % reduction in cell viability. Error bars are mean ± standard deviation. 0.2 % DMSO (vehicle control). No normality test was performed.
At 48 hours, the decrease in cell proliferation elicited by the combination is significantly greater than the decrease observed with DMSO controls (p=0.001), crizotinib alone (p=0.0077) (p=0.0016) or darovasertib alone (p=0.0433), but not significantly different in comparison to the predicted % additive effect (p=0.7604). Thus, indicating that this combination is additive, not greater than additive (Figure 5B,C). The combination of 1.25 µM crizotinib and 1.25 µM darovasertib was also found to be additive at 36 hours (Figure 5C).
1.25 µM crizotinib and 2.5 µM darovasertib in combination have an additive effect on metastatic uveal melanoma cell proliferation at 48 hours
Likewise, 1.25 µM crizotinib and 2.5 µM darovasertib in combination had a time dependent effect on OMM2.5 cell proliferation. (Figure 6A). At 48 hours, One-Way Anova showed that the decreased cell proliferation caused by this combination is significantly greater than the decrease seen with DMSO controls (p<0.0001), crizotinib alone (p<0.0001) or darovasertib alone (p=0.0184), but this combination was not significantly different in comparison to the predicted % additive effect (p=0.9274). Thus, this combination appears to be additive, not greater than additive (Figure 6B,C). The combination of 1.25 µM crizotinib and 2.5 µM darovasertib was found to be additive at 24, 36, 60 and 72 hours also (Figure 6C).
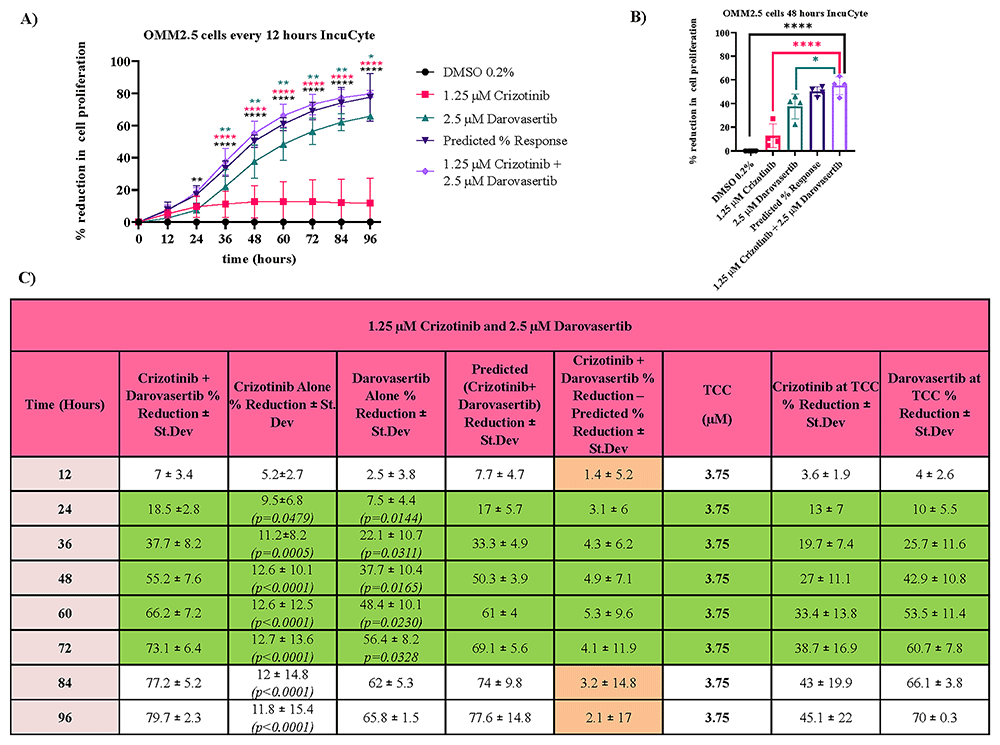
Figure 6. 1.25 µM crizotinib and 2.5 µM darovasertib in combination have an additive effect on metastatic uveal melanoma cell proliferation at 48 hours.
A) The effect of 96-hour treatment with 1.25 µM crizotinib and 2.5 µM darovasertib in combination on cell proliferation (n=4). Statistical analysis was performed by Two-Way Anova with Dunnett’s post hoc multiple comparison test, comparing 1.25 µM crizotinib and 2.5 µM darovasertib to all the other conditions, *p<0.05, **p<0.01, ****p<0.0001. The black * indicates significance of 1.25 µM crizotinib and 2.5 µM darovasertib in combination compared to 0.2% DMSO, the pink * indicates significance of 1.25 µM crizotinib and 2.5 µM darovasertib in combination compared to 1.25 µM crizotinib and the green * indicates significance of 1.25 µM crizotinib and 2.5 µM darovasertib in combination compared to 2.5 µM darovasertib. B) The effect of 48-hour treatment with 1.25 µM crizotinib and 2.5 µM darovasertib in combination on cell proliferation (n=4). Statistical analysis was performed by One-Way Anova with Dunnett’s post hoc multiple comparison test, comparing 1.25 µM crizotinib and 2.5 µM darovasertib to all the other conditions, *p<0.05, ****p<0.0001. C) The average % reduction of IncuCyte S3 Live-Cell replicates every 12 hours across the 96-hour treatment (n=4). TCC=Total Combination Concentration. Statistical analysis was performed by One-Way Anova with Dunnett’s post hoc multiple comparison test, comparing 1.25 µM crizotinib and 2.5 µM darovasertib (n=4) to crizotinib alone, darovasertib alone and the % predicted additive effect. Only significant p values are shown. Green indicates additive, white indicates that the combination is neither antagonistic, additive or greater than additive at that timepoint. 5000 cells were seeded and treated in duplicate for each individual experiment. Cell proliferation was determined using IncuCyte S3 Live-Cell analysis system, images were taken every 3 hours at 10x magnification. Data is normalized to number of cells present in each well at time 0 and presented as % reduction in cell viability. Error bars are mean ± standard deviation. 0.2 % DMSO (vehicle control). No normality test was performed.
0.63 µM crizotinib and 2.5 µM darovasertib in combination have a greater than additive effect on metastatic uvea melanoma cell proliferation at 96 hours
In contrast, the combination of 0.63 µM crizotinib and 2.5 µM darovasertib in combination had a time dependent, greater than additive effect on OMM2.5 cell proliferation. (Figure 7A). At the 96-hour timepoint, 0.63 µM crizotinib plus 2.5 µM darovasertib in combination is statistically significantly different in comparison to DMSO controls (p<0.0001), 0.63 µM crizotinib (p<0.0001), 2.5 µM darovasertib (p=0.0005) and the predicted % reduction of the pair (p=0.0028) (Figure 7B). This indicates this combination is greater than additive. Analysis of the 96-hour time-course of this combination indicates that the difference between the observed and calculated additive effects on live cell proliferation maximised (10.4% ± 0.4%) at ~72 hours (Figure 7C). The combination of 0.63 µM crizotinib and 2.5 µM darovasertib was found to be additive at the 84 hours timepoint, with the combination being statistically significant in comparison to 0.63 µM crizotinib (p<0.0001), 2.5 µM darovasertib (p=0.0155) but not the predicted % reduction (Figure 7C).
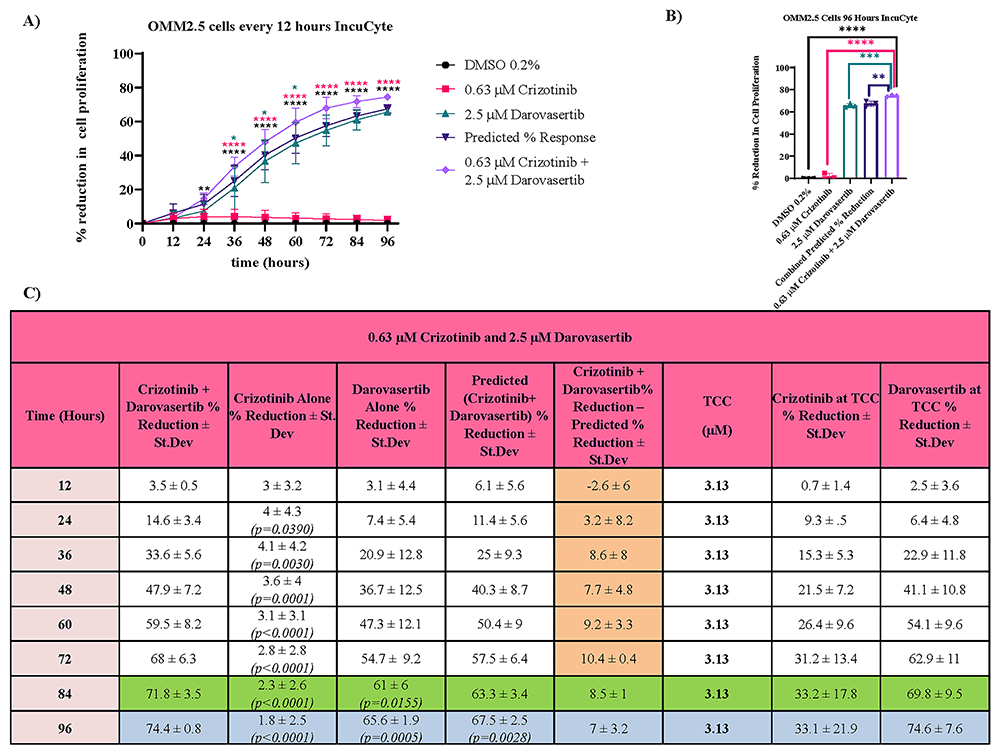
Figure 7. 0.63 µM crizotinib and 2.5 µM darovasertib in combination have a greater than additive effect on metastatic uveal melanoma cell proliferation at 96 Hours.
A) The effect of 96-hour treatment with 0.63 µM crizotinib and 2.5 µM darovasertib in combination on OMM2.5 cell proliferation (n=3). Statistical analysis was performed by Two-Way Anova with Dunnett’s post hoc multiple comparison test, comparing 0.63 µM crizotinib and 2.5 µM darovasertib to all the other conditions. *p<0.05, **p<0.01, ****p<0.0001. The black * indicates significance of 0.63 µM crizotinib and 2.5 µM darovasertib in combination compared to 0.2% DMSO, the pink * indicates significance of 0.63 µM crizotinib and 2.5 µM darovasertib in combination compared to 0.63 µM crizotinib and the green * indicates significance of 0.63 µM crizotinib and 2.5 µM darovasertib in combination compared to 2.5 µM darovasertib. B) The effect of 96-hour treatment with 0.63 µM crizotinib and 2.5 µM darovasertib in combination on OMM2.5 cell proliferation (n=3). Statistical analysis was performed by One-Way Anova with Dunnett’s post hoc multiple comparison test, comparing 0.63 µM crizotinib and 2.5 µM darovasertib to all the other conditions. **p<0.01, ***p<0.001, ****p<0.0001. C) The average % reduction of IncuCyte S3 Live-Cell replicates every 12 hours across the 96-hour treatment (n=3). TCC=Total Combination Concentration. Statistical analysis was performed by One-Way Anova with Dunnett’s post hoc multiple comparison test, comparing 0.63 µM crizotinib and 2.5 µM darovasertib (n=3) to crizotinib alone, darovasertib alone and the % predicted additive effect. Only significant p values are shown. Blue indicates greater than additive, green indicates additive, white indicates that the combination is neither additive, antagonistic nor greater than additive. 5000 cells were seeded and treated in duplicate for each individual experiment. Cell proliferation was determined using IncuCyte S3 Live-Cell Analysis system, images were taken every 3 hours at 10x magnification. Data is normalized to number of cells present in each well at time 0 and presented as % reduction in cell viability. Error bars are mean ± standard deviation. 0.2 % DMSO (vehicle control). No normality test was performed on the data.
Discussion
mUM carries a poor prognosis, with very few treatments available. This study provides pre-clinical evidence that crizotinib and darovasertib, both alone and in combination, are efficacious in conferring anti-cancer effects in a specific mUM cell line.
Darovasertib received approval as an orphan drug by the U.S FDA on 2 May 2022, for treating mUM18. It is currently being evaluated in clinical trials in combination with crizotinib18,26. To date, neither darovasertib nor crizotinib, alone or in combination, has been tested in the OMM2.5 cell line. Furthermore, the effect of darovasertib and crizotinib either alone or in combination on mUM cells has not previously been monitored using the IncuCyte S3 Live-Cell Analysis System.
Firstly, the effect of crizotinib and darovasertib alone on OMM2.5 cell metabolic activity and live cell proliferation was analysed using MTT and IncuCyte S3 Live-Cell Analysis System, respectively. Crizotinib and darovasertib alone significantly reduced OMM2.5 cell metabolic activity, with darovasertib having higher potency while crizotinib had higher efficacy (Figure 1). However, this is not seen with the IncuCyte S3 Live-Cell Analysis Software results, with darovasertib having a higher IC50 value than crizotinib. These results indicate that darovasertib has a greater effect on cell metabolic activity than proliferation. A recent study found that darovasertib cannot suppress multiple active pathways in UM tumours. The incubation of 11 different UM cell lines (92.1, MP46, MEL270, MP38, OMM1.3, OMM1.5, MP41, MEL285, MEL290 and MEL202) with 1 or 5 µM darovasertib, produced cell cycle inhibition but not cell death in most of the GNAQ/GNA11-mutant cell lines. Since OMM2.5 is a GNAQ Q209P mutant cell line20,34, darovasertib’s mechanism of action may explain its differing effects on cell metabolic activity and proliferation.
Preliminary darovasertib and crizotinib combinations have been previously tested in 92.1 and MEL202 (primary) and in MM28 (metastatic) UM cells. Crizotinib was reported to synergize strongly with darovasertib at clinically relevant doses (80 nM) in MEL202 and MM28 in contrast to the 92.1 cells, where mild or no synergy was observed24. However, these results are only reported in an abstract and not yet been peer-reviewed. For the drug combination experiments here, 0.16 µM, 0.31 µM, 0.63 µM or 1.25 µM crizotinib were tested in combination with either 1.25 µM, 2.5 µM, 5 µM or 10 µM darovasertib.
Based on MTT assay data, none of the combinations were found to be additive or greater than additive. However, the combination of 0.63 µM crizotinib plus 2.5 µM darovasertib (1:4 ratio) appear to hold the most promise as a greater than additive combination, according to the IncuCyte S3 Live-Cell Analysis System data. In Table 1, combinations such as 0.63 µM crizotinib + 1.25 µM darovasertib and 1.25 µM crizotinib + 10 µM darovasertib ranked among the most effective. However, statistical analysis revealed that neither combination is statistically greater than darovasertib alone or the predicted % reduction. In the phase 2 clinical trials, patients were given 200 mg of crizotinib and 300 mg of darovasertib, therefore a ratio of 1:1.5. The findings suggest that darovasertib and crizotinib can produce a greater than additive effect on mUM cell proliferation, but at a different ratio than the one used in clinical trials26. The combination of 0.63 µM crizotinib plus 2.5 µM darovasertib could be further evaluated in vivo and also used to explore the mechanism of action of the crizotinib and darovasertib combination through further biochemical assays.
Differences were seen between the MTT and IncuCyte S3 Live-Cell Analysis System results. Recently issues with over/underestimation of cell viability with the MTT assay have emerged35. This over/underestimation may be due to adaptive metabolic and mitochondrial reprogramming in cells caused by inhibitor off-target effects or pharmacological treatment-mediated stress35. In a study comparing the MTT assay versus direct cell counting of TMZ-treated glioblastoma cells, the MTT assay results showed either over- or under estimation of cell death in several glioblastoma cell lines35. Thus, it is recommended to supplement the tetrazolium salt-based assays with other non-metabolic methods35. In our opinion, the IncuCyte S3 Live-Cell Analysis provides a more comprehensive and robust analysis than the MTT assay. However, there is potential for error with the IncuCyte S3 Live-Cell Analysis as user-based bias can occur in regard to deciding if a cell is dead or alive.
A limitation of this study is that all in vitro experiments were carried out using the OMM2.5 cell line, which a BAP1 negative cell line. However, 84% of mUMs are BAP1 positive36. This means that the results collated here are only applicable to 16% of mUM cases. So, a future direction of this research is to repeat these experiments in a BAP1 positive cell line.
Conclusion
This study provides novel preclinical evidence supporting the anti-cancer potential of darovasertib and crizotinib, both individually and in combination, against mUM in the OMM2.5 cell line. Discrepancies between MTT and IncuCyte S3 Live-Cell assay results highlight the importance of using complementary methods to assess drug efficacy and underscore the limitations inherent in metabolic-based viability assays. Additionally, the reliance on a single, BAP1-negative mUM cell line restricts the application of these findings to the broader UM patient population, the majority of whom are BAP1-positive. Nonetheless, this work lays the foundation for more refined combination strategies and highlights the need for further investigation in diverse mUM models. Future studies incorporating BAP1-positive lines, combination software analysis, additional biological replicates, and enhanced assay techniques will be critical to validating and optimizing this potentially synergistic therapeutic combination.
Ethics and consent
Ethical approval and consent were not required.









