Introduction
One of the major challenges in drug discovery is the occurrence of toxicity when compounds have already undergone clinical trials and sometimes even after approval. This means that all the resources and efforts invested in bringing the compound to the final phases are wasted.
In this scenario, providing reliable in vitro screening tools that can predict toxic outcomes at the beginning of drug development is crucial and will help prevent failures at clinical stages, thereby reducing loss of money, time, and, more importantly, preventing human and animal testing with potential side effects.
Among all the safety issues faced during the development of a new drug, liver toxicity is the most frequent, being responsible for one-third of drug candidates’ discontinuation in drug discovery and over 30% of drug withdrawals from the pharmaceutical market1–4.
Drug-induced liver injury (DILI) can manifest in acute or chronic forms, ranging from mild reversible effects to serious life-threatening adverse effects that could progress to liver failure and eventually require transplantation.
Considering the gravity of the situation, the possibility of predicting the hepatotoxicity of compounds as soon as possible during the early discovery phase becomes paramount in order to mitigate failures during clinical stages. To date, the risk of DILI has not been predicted using in vitro ADME assays5.
The aim of the present study was to validate the application of an in vitro screening test to detect hepatotoxicity and identify potential toxic metabolites that are applicable to hits and leads to identify toxic compounds before reaching clinical phases. This methodology could help decision making to advance promising candidates, direct the selection of privileged scaffolds in drug design, and help refine in silico tools in drug discovery.
Over the years, several studies, including one of our latest project6, showed that in vitro models have proven to accurately reproduce hepatotoxicity in humans7,8.
Here, we evaluated cell viability after acute exposure of human hepatocyte cultures to compounds. To validate this test, we selected a set of approved drugs belonging to several medical classes ranging from non-hepatotoxic to highly hepatotoxic compounds.
The liver is the principal organ where xenobiotic metabolism occurs, and although biotransformation primarily detoxifies compounds in some cases, this conversion results in noxious products. Liver tissue is normally the first site of drug-induced toxicity. Toxicity is often not triggered by the parent compound per se, but by its metabolites; hence, evaluating the potential hepatotoxicity of metabolites is as important as assessing the safety of the parent compounds.
One way to distinguish the potential toxicity of parent compounds and their metabolites is to test the drugs in two cell lines expressing different metabolic capacities of the human liver, HepG2 and HepaRG.
Although both HepaRG and HepG2 cells are human hepatocytes, they differ in several respects. HepG2 cells are immortalized cells that express low levels of key metabolizing liver enzymes involved in drug metabolism and toxicity, such as CYP450 superfamily9–14.
In contrast, HepaRG cells express most enzymes of the CYP450 superfamily, as well as class II metabolic enzymes (e.g., UGT and SULT), at levels comparable to those of primary hepatocytes10,15–17.
Therefore, exposing HepG2 cells to compounds will show effects generated by the parent compounds, as this cell line will barely produce metabolites. On the other hand, when drugs are added to HepaRG, metabolites are produced, and the effects observed are principally due to metabolites. By comparing the viability of HepG2 and HepaRG cells after drug exposure, we can determine not only if a drug is toxic, but also if the toxic outcome is triggered by the parent compound, metabolites, or both.
In general, when a drug is administered, at least three possible toxicity scenarios are encountered. First, the parent drug is toxic and is converted into safe metabolites, which represents the natural detoxification process operated by the liver. However, metabolism sometimes transforms parent compounds into toxic products. This represents a second possible scenario. The third toxicity scenario, although less common, occurred when both the parent drug and its metabolites were toxic.
In this study, we showed that HepG2 and HepaRG cells react differently to compound insults and may represent a useful tool to determine if the parent drug, its metabolites, or both are responsible for toxicity.
Materials and methods
Drug compounds
All compounds tested in the experimental part of this project were commercially available drugs or withdrawn drugs. These compounds included acetaminophen, amoxicillin, astemizole, ceftazidime, clozapine, cefiderocol, ciprofloxacin, cyclophosphamide, clindamycin hydrochloride, doxorubicin hydrochloride, fluconazole, fusidic acid sodium salt, imipenem hydrochloride, ketoconazole, linezolid, moxifloxacin, nefazodone hydrochloride, nitrofurantoin, potassium clavulanate, sulbactam sodium salt, and tetracycline hydrochloride. All samples were purchased from Sigma-Aldrich.
The two metabolites of nefazodone, hydroxynefazodone (NFZ-OH) and triazoledione (NFZ-TD), were purchased from Toronto Research Chemicals Inc., Canada.
HepaRG cell culture
Cryopreserved, differentiated HepaRG cells were purchased from Gibco (Thermo Fisher Scientific). After thawing, the cells were seeded in a monolayer in transparent flat bottom 96 well plates coated with Collagen I, Rat tails (Gibco). A solution of 0.05 mg/mL was used for the coating. Cells were seeded at a density of 70,000 cells/well and maintained in William’s E media (Gibco) supplemented with 10% heat-inactivated Fetal Bovine Serum (Gibco), 1% penicillin-streptomycin (100X, Sigma-Aldrich), 5µg/mL of insulin (insulin solution from bovine pancreas, Sigma-Aldrich Chemie, Germany), 0.1 µM dexamethasone (Sigma-Aldrich), Glutamax™ (100X, Gibco). Cells were maintained in culture for six days, and the medium was renewed every two days. For the cytotoxicity assay, HepaRG cells were seeded in monolayer in 96 well, transparent flat bottom plates (Corning®) at a final volume of 200 µL/well.
HepG2 cells culture
Cryopreserved HepG2 cells were purchased from ATCC (American Type Culture Collection). Cells were thawed and maintained in culture, following the manufacturer’s instructions and then seeded in flasks and cultured in MEM medium (Gibco) supplemented with 10% heat-inactivated Fetal Bovine Serum (Gibco), 1mM Sodium Pyruvate solution (Sigma), 1% MEM Non-Essential Amino Acid solution (100X, Sigma), and 1% penicillin-streptomycin (100X, Sigma). The cells were maintained in a humidified incubator with 5% CO2 at 37°C and cultured until passage 6 or 7 before the cytotoxicity assay. Medium was renewed 3 times per week. For the cytotoxicity assay, HepG2 cells were seeded in monolayer in 96 well, transparent flat bottom plates (Corning®) at a final volume of 200 µL/well.
Drugs exposure
Twenty-four hours after seeding, cells were exposed to increasing concentrations of each test compound. The doses of the compounds were added once and cells were exposed for 48h to them before the cytotoxicity assay was performed. Several concentrations per drug were assayed, ranging from Cmax (the therapeutic maximal drug concentration in human plasma), as the lowest, to 32-fold Cmax, as the highest. For Cmax values, we referred to data published in the scientific literature (Table 1).
Table 1. List of all tested drugs with the corresponding plasma peak concentration, Cmax in humans reported in scientific published data.
| Drug compound | Cmax (mg/L) |
|---|
| acetaminophen | 18.07-26.5518 |
| amoxicillin | 9.38-7.6119 |
| astemizole | 0.003620 |
| cefiderocol | 15021 |
| ceftazidime | 79.8-91.722 |
| clavulanic acid | 2.4623 |
| clindamycin | 9-1524 |
| clozapine | 0.91425 |
| cyclophosphamide | 0.56-1.1126 |
| doxorubicin | 3.927 |
| fluconazole | 1.54-2.4228 |
| fusidic acid | 3.3-14.529 |
| imipenem | 12.7-22.830 |
| ketoconazole | 4.2-6.231 |
| linezolid | 15-2732 |
| moxifloxacin | 4.7333 |
| nefazodone | 2.334 |
| nitrofurantoin | 0.26-1.1135 |
| sulbactam | 32.0-93.736 |
| tetracycline | 2-537 |
Mother solutions of each compound were prepared by dissolving each drug in 100% DMSO. The other test concentrations were prepared starting from the mother solution and preparing 2-fold serial dilutions in 100% DMSO. One microliter of each compound’s solution in the mother plate was added to each well containing cells cultured in 199 µL of media to reach a final DMSO solution of 0.5% v/v. A DMSO solution at a final concentration of 0.5% (DMSO/media) was used as a negative control. Tamoxifen (final concentration, 200 µM) was used as the positive control.
Cytotoxicity assay
Cell viability was performed in HepG2 and HepaRG cell lines by evaluating cellular ATP content using the CellTiter-Glo® Luminescent Cell Viability Assay (Promega) following the manufacturer’s instructions. Briefly, the medium was renewed and an equal volume to that of the media of CellTiter-Glo reagent was added in each well. The plates were placed in an orbital shaker for 2 min to allow mixing of the reagent and induce cell lysis. Finally, the plates were incubated at RT in the dark for 10 min, and the luminescence signal was measured using a BioTek Synergy H1 Plate Reader and recorded. The relative light units (RLUs) of the luminescence signal were proportional to the ATP released by lysed cells and served as a parameter of cell viability.
Data analysis and statistics
At least three independent experiments were conducted to assess the toxicity of compounds in each cell line. Raw data of luminescence signals were analyzed by generating the mean and standard error of the mean (SEM) (GraphPad Prism 8.3.0; GraphPad Software, San Diego, CA). Each value, subtracted from the blank (luminescence signal from wells with medium only), was divided by the control (luminescence signal of cells treated with 0.5% DMSO only) and expressed as the percentage of viable cells with respect to the control. LC50 values were calculated using non-linear regression analysis with a sigmoidal dose-response model (GraphPad Prism 8.3.0; GraphPad Software, San Diego, CA, USA).
Results
To validate this method, we tested 21 commercial drugs and compared their cytotoxic effects in HepaRG and HepG2 cells. The method presented here was able to encompass all possible cases of toxicity. Of the total drugs tested, 10 did not show toxic effects in HepG2 or HepaRG cells, maintaining cell viability at approximately 100% for all the concentrations tested (data not shown). For all the drugs showing toxic effects, we identified three possible cases of toxicity, which we refer to as “case A,” in which the toxic parent compound is transformed into non-toxic metabolites; “case B,” the opposite case, where the non- toxic parent compound generates toxic metabolites; “case C,” where toxicity is due to both toxic parent compounds and toxic metabolites. Four drugs reproduced Case A of toxicity: three drugs, Case B; and finally, four drugs generated Case C of hepatotoxicity (Table 2).
Table 2. Classification of drugs tested according to toxicity outcomes.
Case A: toxic parent compounds transformed into safe metabolites; Case B: non-toxic parent drugs converted into toxic metabolites; Case C: toxic parent compounds converted into toxic metabolites; Case NT (non-toxic): drugs with non-toxic effects in both metabolizing and non-metabolizing conditions.
CASE OF
TOXICITY | TESTED DRUGS |
|---|
| A | Astemizole, Clozapine, Nitrofurantoin, Fusidic acid |
| B | Acetaminophen, Doxorubicin, Moxifloxacin |
| C | Nefazodone, Sulbactam, Ketoconazole, Clyndamycin |
| NT | Amoxicillin, Ceftazidime, Cefidercol, Ciprofloxacin,
Cyclophosphamide, Fluconazole, Imipenem,
Linezolid, Clavulanic acid, Tetracycline |
Case A of toxicity: assessment of hepatotoxic parent compounds converted into non-toxic metabolites
We started by analyzing the toxicity of case A, which comprised drugs that showed higher lethality in HepG2 cells than in HepaRG cells. These drugs include astemizole, clozapine, nitrofurantoin, and fusidic acid. The viability of HepaRG and HepG2 cells exposed to increasing concentrations of astemizole, clozapine, nitrofurantoin, and fusidic acid is shown in Figure 1, as well as the lethal dose 50 values (LC50) of the drugs relative to both cell lines (Table 3).
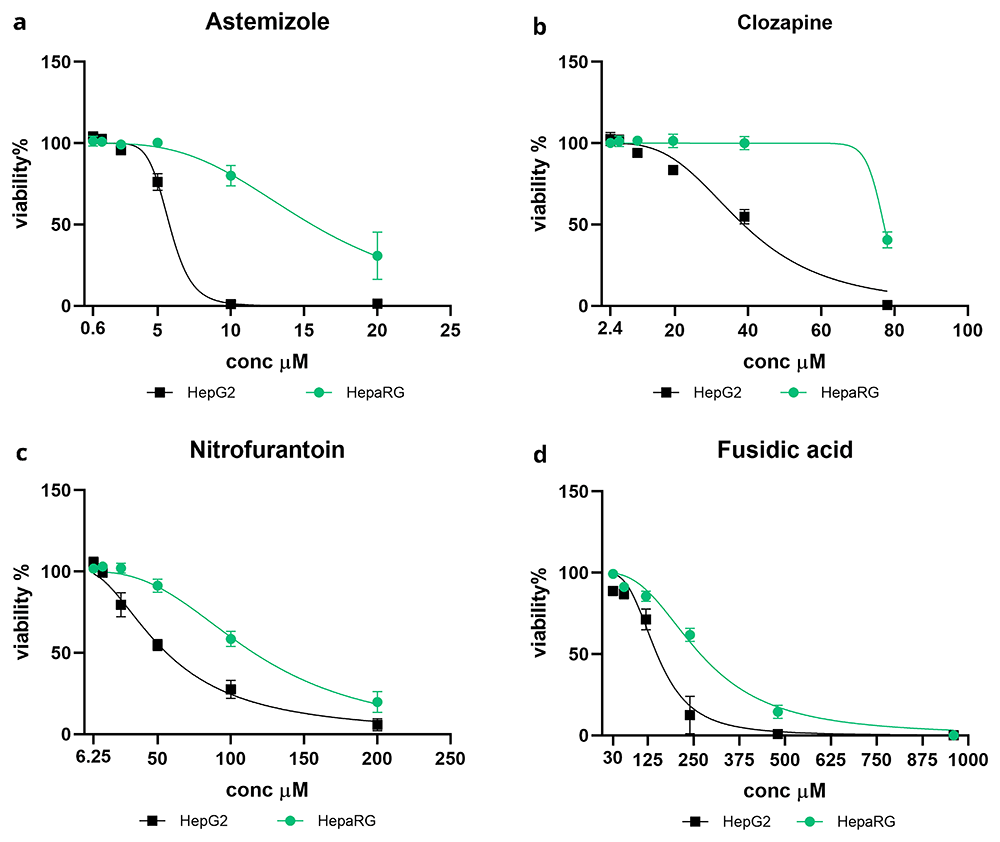
Figure 1. Case A: toxic parent drugs converted into non-toxic/less-toxic metabolites.
Acute cytotoxicity of selected compounds in HepaRG (green) and HepG2 (black). Both cell lines were treated with astemizole (a), clozapine (b), nitrofurantoin (c) and fusidic acid (d) for 48h. Drug concentrations, starting from Cmax, are indicated in µM. Cell viability is expressed in percentage relative to the control, represented by cells treated with DMSO only. Data are presented as mean ± SEM of three or more replicates. Curves were generated using non-linear regression analysis with a sigmoidal dose-response model (GraphPad Prism 8.3.0; GraphPad Software, San Diego, CA).
Table 3. Values of LC50 of astemizole (AST), clozapine (CLZ), nitrofurantoin (NIT) and fusidic acid (FSA) found in HepG2 (non-metabolizing conditions) and HepaRG (metabolizing conditions).
LC50 (µM) were calculated using non-linear regression analysis with a sigmoidal dose-response model (GraphPad Prism 8.3.0; GraphPad Software, San Diego, CA).
| AST LC50
(µM) | CLZ LC50
(µM) | NIT LC50
(µM) | FSA LC50
(µM) |
|---|
| HepG2 | 5.8 | 38.7 | 56.2 | 150.1 |
| HepaRG | 15.5 | 77.1 | 115.7 | 268.7 |
According to the dose-viability curves, astemizole and clozapine induced a more marked difference in mortality between the two cell lines than nitrofurantoin and fusidic acid did. At 10 µM, astemizole killed the entire cell population HepG2 while it reduced HepaRG viability to only 80% (Figure 1a). Similarly, 40 µM clozapine reduced by half HepG2 viability while did not show any cytotoxicity in HepaRG cells. Clozapine cytotoxicity in HepaRG cells started to occur at 80 µM, the highest concentration tested (Figure 1b). The different effects observed in HepaRG and HepG2 cells were less marked for nitrofurantoin and fusidic acid, although they presented the same trend. At 50 µM, nitrofurantoin killed half of the HepG2 population but barely affected HepaRG viability, and the dose of 250 µM fusidic acid induced near total mortality of HepG2 cells while reducing only 50% HepaRG viability (Figure 1c, 1d).
Considering the different metabolic capacities of HepaRG and HepG2 cells, we deduced that these drugs were metabolized into non-toxic compounds in HepaRG cells. In contrast, the low metabolizing hepatocytes HepG2, showed the effect of the non-transformed parent drugs. For each drug, the LC50 values found in HepaRG cells were approximately double those found in HepG2 cells (Table 3), confirming that HepaRG carried out drug detoxification, whereas HepG2 did not.
Case B of toxicity: assessment of non-toxic parent compounds converted into toxic metabolites
Here, we show another possible scenario of toxicity, Case B, in which drug-induced cytotoxicity is not derived from the compound per se, but mainly from the production of toxic metabolites. HepaRG and HepG2 cells exposed to acetaminophen and doxorubicin showed higher toxicity in HepaRG than in HepG2 cells (Figure 2). The marked reduction in HepaRG viability compared to HepG2 suggests that the effect of metabolism, essentially carried out by HepaRG and poorly by HepG2 cells, led to the transformation of the parent drugs into toxic products.
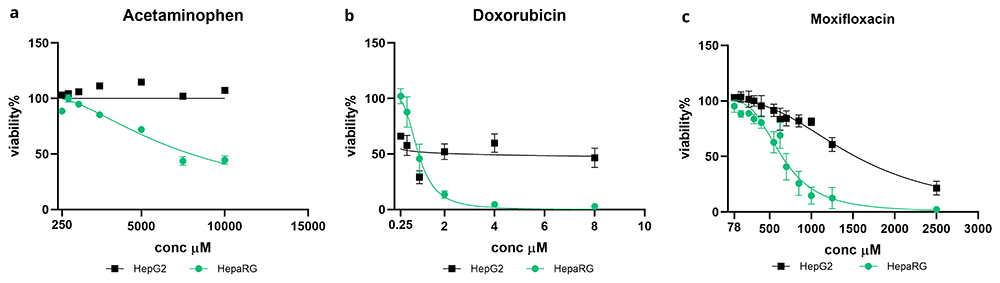
Figure 2. Case B: non-toxic or low toxic parent drugs are converted into high toxic metabolites.
Acute cytotoxicity of selected compounds in HepaRG (green) and HepG2 (black). Both cell lines were treated with acetaminophen (a), doxorubicin (b) and moxifloxacin (c) for 48h. Drugs concentrations, starting from Cmax, are reported in µM. Cells viability was expressed in percentage relatively to the control, represented by cells treated with DMSO only. Data are presented as mean ± SEM of three or more replicates. Curves were generated using non-linear regression analysis with a sigmoidal dose-response model (GraphPad Prism 8.3.0; GraphPad Software, San Diego, CA).
Specifically, we observed a viability lower than 50% of HepaRG cells treated with 10,000 µM acetaminophen, whereas at the same concentration, the viability of HepG2 was maintained at 100% (Figure 2a). Similarly, doxorubicin caused total mortality of the HepaRG population at 4 µM, while at the same concentration onwards, HepG2 viability remained stable at approximately 50% (Figure 2b). Finally, a large discrepancy in cell viability was detected between HepG2 and HepaRG cells treated with moxifloxacin (Figure 2c). At 1000 µM, moxifloxacin induced 75% and 15% mortality in HepaRG and HepG2 cells, respectively (Figure 2c). Our evaluation is supported by the LC50 values of the drugs, which were much higher in HepG2 cells than in HepaRG cells. These values show that HepaRG cells are more sensitive than HepG2 cells to compounds’ cytotoxic effects (Table 4).
Table 4. Values of LC50 of acetaminophen (ACP), doxorubicin (DOX) and moxifloxacin (MOX) found in HepG2 (non-metabolizing conditions) and HepaRG (metabolizing conditions).
LC50 (µM) were calculated using non-linear regression analysis with a sigmoidal dose-response model (GraphPad Prism 8.3.0; GraphPad Software, San Diego, CA).
| ACP LC50
(µM) | DOX LC50
(µM) | MOX LC50
(µM) |
|---|
| HepG2 | >10000 | 2.8 | 1531 |
| HepaRG | 7492 | 0.97 | 649 |
Case C of toxicity: assessment of toxic parent compound converted into toxic metabolites
The third case of toxicity is when toxicity derives from the effects of both the parent compound and its metabolites (case C). To assess this using our in vitro approach, we selected the following drugs as examples: nefazodone, clindamycin, ketoconazole, and sulbactam. As shown in the dose-viability curves, these drugs exerted similar cytotoxic effects in HepaRG and HepG2 cell lines (Figure 3). Indeed, the graphs for both cell lines almost overlap. In this situation, unlike cases A and B, the LC50 values were similar in both cell lines (Table 5).
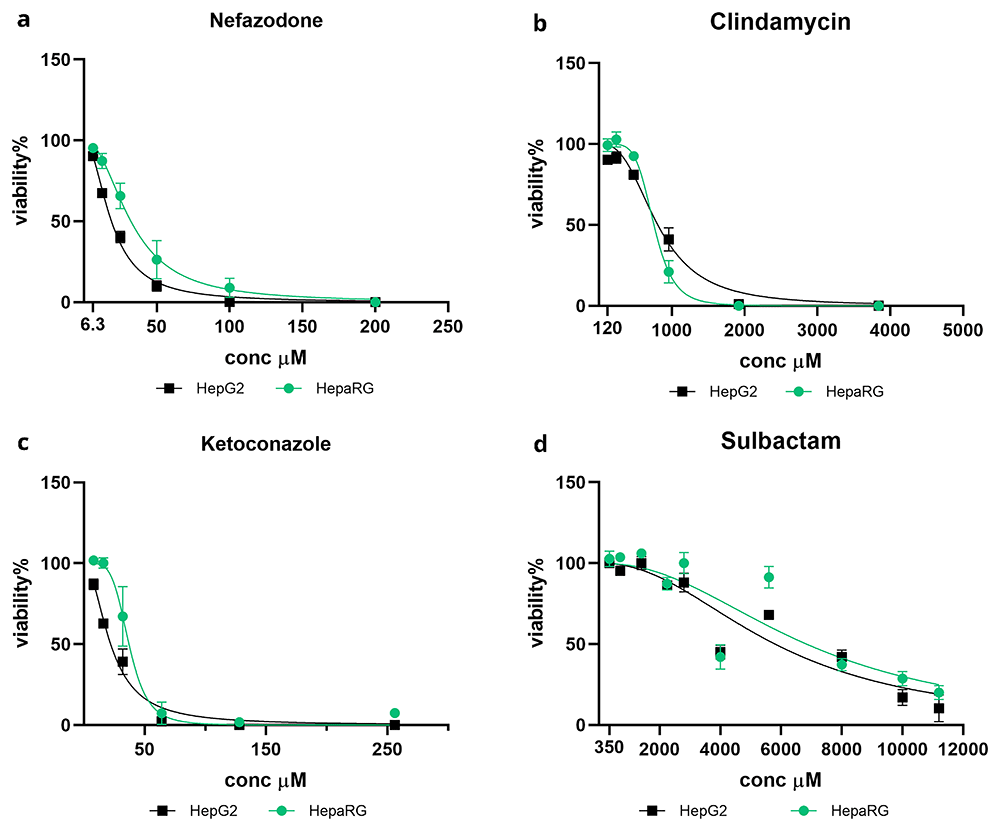
Figure 3. Case C: toxic parent drugs are converted into toxic metabolites.
Acute cytotoxicity of selected compounds in HepaRG (green) and HepG2 (black). Both cell lines were treated with nefazodone (a), clindamycin (b), ketoconazole (c) and sulbactam (d) for 48h. Drugs concentrations, starting from Cmax, are reported in µM. Cells viability was expressed in percentage relatively to the control, represented by cells treated with DMSO only. Data are presented as mean ± SEM of three or more replicates. Curves were generated using non-linear regression analysis with a sigmoidal dose-response model (GraphPad Prism 8.3.0; GraphPad Software, San Diego, CA).
Table 5. Values of LC50 of nefazodone (NFZ), clindamycin (CLY), ketoconazole (KET) and sulbactam (SUL) found in HepG2 (non-metabolizing conditions) and HepaRG (metabolizing conditions).
LC50 (µM) were calculated using non-linear regression analysis with a sigmoidal dose-response model (GraphPad Prism 8.3.0; GraphPad Software, San Diego, CA).
| NFZ LC50
(µM) | CLY LC50
(µM) | KET LC50
(µM) | SUL LC50
(µM) |
|---|
| HepG2 | 19.9 | 809.6 | 22.1 | 5807 |
| HepaRG | 32.3 | 756.6 | 37.2 | 6844 |
Identification of toxic metabolites: nefazodone case-study
We showed that our approach to evaluating in vitro hepatotoxicity could distinguish toxicity due to parent compounds, metabolites, or both. Although this is an important step in explaining the mechanism of hepatotoxicity, it remains incomplete. To fully elucidate the mechanism by which a drug exerts its toxicity, it is necessary to identify toxic metabolites. For this purpose, using nefazodone as an example, we investigated the effects of its metabolites separately.
The metabolism of nefazodone is well described, and all metabolites of this drug have been disclosed. The primary enzyme involved in nefazodone metabolism in the liver is CYP3A4. Three main active metabolites are generated during this process: hydroxynefazodone (NFZ-OH), triazoledione (NFZ-TD), and meta-chlorophenylpiperazine (m-cPP)34,38–42. Other metabolites were isolated at a very small percentage43.
Nefazodone’s main metabolites are illustrated in Figure 4.
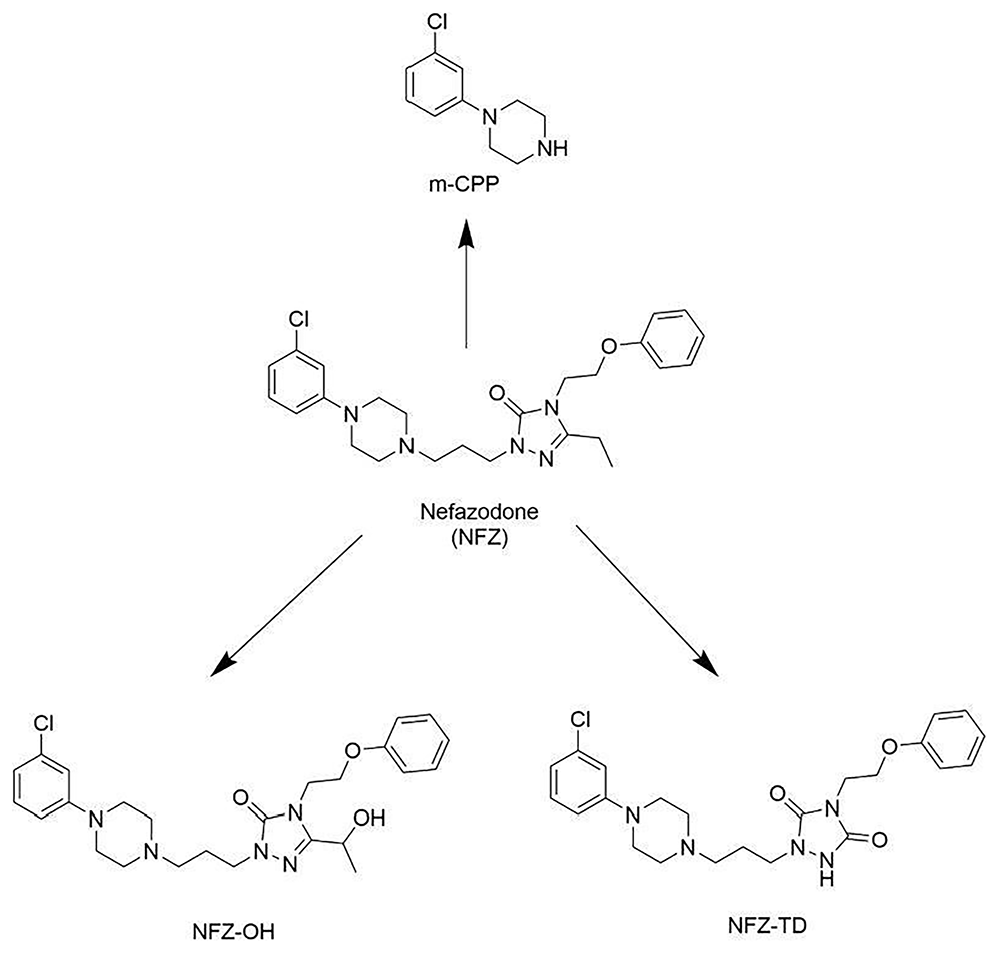
Figure 4. Principal metabolites of the antidepressant nefazodone (NFZ).
NFZ-OH: hydroxynefazodone; NFZ-TD: triazoledione-nefazodone; m-CPP: m-chlorophenylpiperazine38.
To investigate the potential toxicity of nefazodone metabolites, we tested the individual compounds, focusing on the most abundant: hydroxynefazodone (NFZ-OH) and triazoledione (NFZ-TD), excluding meta-chlorophenylpiperazine (m-cPP). From a toxicological perspective, the metabolite m-CPP, which is present in several drugs with different biological activities, is considered a privileged scaffold that is largely employed in drug discovery, that is present in several drugs with different biological activities44. Therefore, we did not include m-CPP in our cytotoxicity assessment.
Remarkably, in exposing both HepaRG and HepG2 cells to NFZ-OH and NFZ-TD, we found that while NFZ-TD was not toxic, NFZ-OH showed marked toxicity in both cell lines, very similar to that of the parent compound. Nefazodone and hydroxynefazodone (NFZ-OH) killed 100% of the HepaRG and HepG2 cells at 100 µM, whereas triazoledione (NFZ-TD) at the same concentration did not affect cell survival (Figure 5). Indeed, the LC50 values reported in Table 6 support our findings; in both cell lines, the LC50 of triazoledione (NFZ-TD) was at least 6-fold the LC50 of nefazodone and hydroxynefazodone (NFZ-OH).
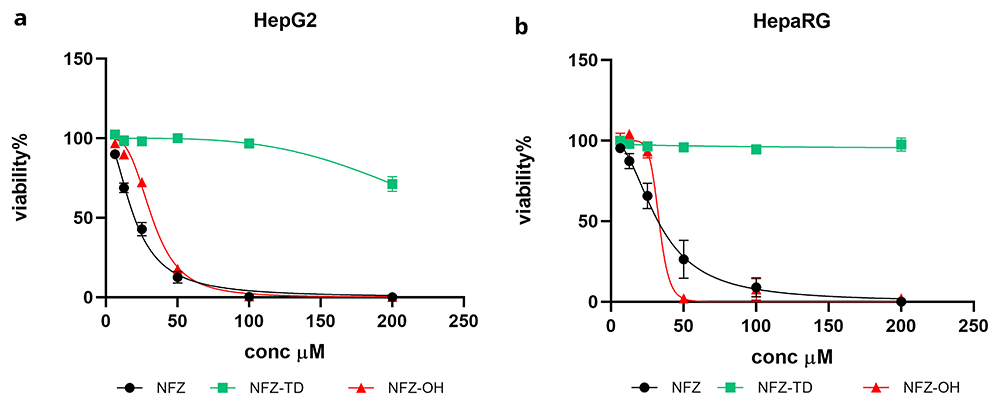
Figure 5. Dose-viability curves of HepG2 and HepaRG exposed to nefazodone parent compound (NFZ, black) and its metabolites triazoledione (NFZ-TD, green) and hydroxynefazodone (NFZ-OH, red).
Drug concentrations are reported in µM. Cell viability is expressed in percentage relative to the control, represented by cells treated with DMSO only. Data are presented as mean ± SEM of three or more replicates. Curves were generated using non-linear regression analysis with a sigmoidal dose-response model (GraphPad Prism 8.3.0; GraphPad Software, San Diego, CA).
Table 6. Values of LC50 of nefazodone (NFZ), nefazodone-triazoledione (NFZ-TD) and hydroxy-nefazodone (NFZ-OH) found in HepG2 (non-metabolizing conditions) and HepaRG (metabolizing conditions).
LC50 (µM) were calculated using non-linear regression analysis with a sigmoidal dose-response model (GraphPad Prism 8.3.0; GraphPad Software, San Diego, CA).
| NFZ LC50 (µM) | NFZ-TD LC50 (µM) | NFZ-OH LC50 (µM) |
|---|
| HepG2 | 19.9 | >200 | 32.3 |
| HepaRG | 32.3 | >200 | 33.1 |
The findings from previous studies indicated that the nefazodone metabolites NFZ-OH and NFZ-TD possess activity, with NFZ-OH demonstrating efficacy similar to that of the parent compound and NFZ-TD exhibiting reduced potency34,45,46. However, to our knowledge, the potential contribution of these metabolites to nefazodone toxicity has not yet been explored. Our assessment revealed that the metabolite NFZ-OH, in addition to the parent drug, was responsible for nefazodone toxicity, whereas NFZ-TD did not exhibit cytotoxic effects. This finding was surprising because hydroxylation reactions typically represent the initial step in the liver detoxification process, leading to the generation of polar and safe metabolites for excretion.
Discussion
Drug-induced liver injury (DILI) remains the primary cause of toxicity, leading to compound discontinuation in clinical trials and drug withdrawal after approval. Therefore, prediction of hepatotoxicity in the initial steps of drug discovery will help to narrow the clinical testing of the most promising candidates, thereby reducing animal and human experimentation and money lost to useless research.
In this study, we proposed the application of a simple and low-cost in vitro experimental procedure to predict the toxicity of compounds and identify putative toxic metabolites to aid lead selection in drug discovery.
To validate our procedure, we selected 21 approved drugs known to exhibit a range of hepatotoxic effects, ranging from relatively harmless or low-toxicity compounds to those with high-toxicity profiles.
We compared the cytotoxic effects of the selected drugs in two human hepatocyte cell lines, HepaRG and HepG2. HepaRG cells are well known for their high metabolic capacity, whereas HepG2 cells are characterized by limited metabolic activity. Indeed, when exposed to compounds, owing to their poor metabolism, HepG2 cells essentially show the effect of the parent compounds. In contrast, metabolically competent HepaRG cells predominantly express the effects of drug metabolites.
By testing several drugs, we validated the proposed method, showing that it was able to reproduce in vitro several hepatotoxic outcomes: toxicity induced by parent compounds (case A), metabolites (case B), or both (case C).
Among the set of drugs, we found that astemizole, clozapine, nitrofurantoin, and fusidic acid were representative of case A toxicity. Here, the compounds induced higher cell mortality in HepG2 cells than in HepaRG cells, as indicated by the LC50 values, which were approximately twice as high as those in HepG2 cells (Table 3). Given the limited metabolic capacity of HepG2 cells compared to HepaRG cells, the high mortality observed in this study was attributed to the parent compounds. In contrast, the higher viability of HepaRG cells implies their ability to transform drugs into safer products (Figure 1).
Indeed, the CYP2D6 and CYP3A4 isoforms required for astemizole detoxification are consistently higher in HepaRG than in HepG210,47,48.
Similarly, CYP1A2, the main enzyme involved in clozapine metabolism, is highly expressed in HepaRG but not in HepG210,49,50.
The higher mortality in HepG2 (LC50= 56.2 µM) than in HepaRG (LC50= 115.7 µM) (Figure 1c and Table 3) induced by nitrofurantoin supports the direct toxicity of the parent drug hypothesized in previous studies51,52.
Also, the observed difference in cytotoxic effects of fusidic acid between HepG2 and HepaRG cells (LC50= 147.0 µM and 268.7 µM, respectively) can be reasonably attributed to the absence in HepG2 of phase II enzymes, as well as the isoforms CYP2D6 and CYP3A4, which are essential for the detoxification of the drug53. Unlike HepG2 cells, these enzymes are highly expressed in HepaRG cells.
Second, acetaminophen, doxorubicin, and moxifloxacin were three examples of drugs generating toxic metabolites, representing case B of toxicity (Figure 2).
The well-known mechanism of acetaminophen-induced hepatotoxicity involves the production of the toxic metabolite NAPQI54,55. Therefore, acetaminophen served as the reference standard for validation. As expected, in our assessment, the drug induced marked cytotoxicity in HepaRG, implying that at high doses, HepaRG efficiently converted acetaminophen into NAPQI. Conversely, the drug did not affect HepG2 viability (Figure 2a).
In addition to acetaminophen, both doxorubicin and moxifloxacin were found to induce toxicity through the production of toxic metabolites. Previous studies have reported that doxorubicin elicit liver damage by generating reactive metabolites that induce oxidative stress and mitochondrial dysfunction in hepatocytes, ultimately leading to cell death56,57. Although it has been described that moxifloxacin is not primarily metabolized by the liver58,59 and that the incidence of severe cases of hepatic adverse effects is very low60–62, our study suggests that metabolism of moxifloxacin produces potential hepatotoxic compounds. Our results further supported the involvement of metabolites in hepatotoxicity. In particular, both drugs significantly reduced cell viability in metabolizing cells (HepaRG) compared to low-metabolizing cells (HepG2) (Figure 2b and 2c), as indicated by the LC50 values, which were in HepG2 3-fold and 2-fold higher than those observed in HepaRG for doxorubicin and moxifloxacin, respectively (Table 4).
Lastly, the drugs ketoconazole, clindamycin, sulbactam, and nefazodone reproduced case C, where the parent compounds and their metabolites contributed to cytotoxicity. These drugs demonstrated a consistent trend in both HepG2 and HepaRG cell lines (Figure 3), as supported by their comparable LC50 values (Table 5).
Previous studies have reported that ketoconazole can cause liver toxicity per se and produce toxic metabolites. Reactive species and toxic metabolites, such as N-deacetyl ketoconazole, have been identified63,64. In addition, it is believed that the hepatotoxicity of the parent compound is associated with its mechanism of action, and inhibition of sterol synthesis may affect cell membrane integrity65.
Although hepatotoxicity represents only a minor side effect of clindamycin, it is not yet known whether the drug itself, its metabolites, or both, are responsible for this toxic effect66–68. However, our results showed that the viability of both cell lines was similarly affected by clindamycin, suggesting that not only the unmodified drug but also its metabolites are responsible for toxicity.
To date, sulbactam has rarely been associated with adverse effects69,70. Rather, cases of liver injury associated with ampicillin-sulbactam administration were attributed to an allergic reaction to ampicillin71. In line with these findings, our data showed that sulbactam induced only mild cytotoxicity in the hepatocytes (Figure 3d). Notably, the viability of HepG2 and HepaRG cells was affected in a similar manner, indicating a possible role of metabolites in toxicity initiation, in addition to the parent compound.
Nefazodone was included in our set of compounds owing to its well-known hepatotoxic effects, ranging from asymptomatic liver enzyme elevations to severe liver damage, including fulminant hepatic failure, in rare cases, which led to its discontinuation in 200372–74. The drug significantly reduced the viability of both the HepG2 and HepaRG cell lines (Figure 3a). Therefore, in this case, metabolism of nefazodone by HepaRG was not able to detoxify the drug. A significant cytotoxic effect was already visible at 25 µM, 4 times the nefazodone Cmax, and at a dose of 100 µM, the entire cell population was killed (Figure 3a).
Using the proposed experimental procedure, we demonstrated the capability to distinguish whether hepatotoxicity arises from parent drugs, their metabolites, or a combination of both. However, when metabolites are implicated in initiating toxicity, our understanding remains incomplete, as we have not specifically identified the metabolites responsible for triggering toxicity. Therefore, we carried out an additional study to identify toxic metabolites.
For this purpose, we used nefazodone as a model because of its well-described metabolism (Figure 4)34,38,39,41,42. Although the metabolites of nefazodone have been identified, previous research has primarily focused on assessing their efficacy and potency46. To the best of our knowledge, no prior investigations have explored their hepatotoxicity.
Here, we separately tested the principal metabolites of nefazodone: hydroxynefazodone (NFZ-OH) and nefazodone-triazoledione (NFZ-TD) to compare their effects on the parent drug and to define the extent to which each compound contributes to hepatotoxicity. Interestingly, treatment with nefazodone and NFZ-OH markedly reduced the viability of HepG2 and HepaRG cells. Conversely, NFZ-TD did not affect HepaRG cell viability and only slightly affected HepG2 cell viability (Figure 4a and 4b). These findings indicate that NFZ-OH exerts hepatotoxic effects comparable to those of the parent drug, while NFZ-TD is harmless. The case study of nefazodone serves as an example of how our proposed method can be used to explore the implications of metabolites in toxicity, and highlights the potential of this approach for application to new drugs under development.
Despite the toxicological guidelines of regulatory agencies to include accurate tests for hepatotoxicity detection, there are examples in which these tests have proven inadequate, as evidenced by reported cases of unpredicted DILI. In response to this limitation, the proposed experimental evaluation offers a fast, low-cost, and reliable procedure for lead discovery, aiming to exclude toxic compounds as early as possible before advancing to clinical trials.
Rather than solely identifying toxic compounds, this approach can aid in the discovery of safe metabolites derived from potentially toxic parent drugs. If a metabolite exhibits efficacy similar to that of the parent drug but lacks toxic effects, it represents a convenient alternative. In such cases, the metabolite can be considered the primary drug candidate, while the parent compound may be discarded.
Conclusions
In summary, the in vitro approach provided here, based on hepatotoxicity evaluation under metabolic and non-metabolic conditions, allows the discrimination of whether cytotoxicity is triggered by parent compounds and/or hepatic metabolites, and further enables the identification of metabolites responsible for toxicity. This understanding is key, given that hepatotoxicity remains a leading cause of failure in clinical trials. Indeed, by applying the present approach in early drug discovery, hepatotoxic metabolites can be identified earlier to prevent or reduce adverse liver effects in vivo at later stages, directing the selection of safer and more promising candidates.
Furthermore, the application of the presented method can contribute to the refinement and improvement of current in silico tools used to assess hepatotoxicity in drug discovery, thereby enhancing their predictive capabilities and overall effectiveness in identifying safe and efficacious drug candidates.









