Introduction
A hybrid rocket engine (HRE) is a chemical rocket propulsion system based on the combination of a liquid oxidizer and a solid fuel. While being first demonstrated in 1933 in the Soviet Union1, the development of the technology fell behind the two most efficient alternatives, liquid rocket propulsion and solid rocket propulsion, and most of its peculiarities and drawbacks have yet to be fully understood and overcome2.
Nevertheless, the research on this type of technology never halted, due to the promising advantages it offers in exchange for a compromise in performance. These advantages are simplicity, safety, and cost-effectiveness.
And it is mainly the perspective of a limited cost of manufacturing and operation that gave new momentum in recent years to the development of hybrid rocket propellant based launchers and spacecrafts3.
Hybrid rocket slab burners
When developing a new rocket engine, the accurate modeling of the internal ballistics of the combustion chamber is fundamental to design a reliable system, and for propulsion systems using a solid propellant the regression rate is one of the main drivers. In particular, when developing a new propellant formulation, it is convenient to test small samples in dedicated burners to understand their behavior before scaling up4. In Solid Rocket Motors (SRMs) this is typically done in strand burners, where a small propellant sample is ignited at controlled chamber pressure, and its consumption over time is measured to determine the regression rate. Strand burners are convenient for SRMs, where fuel and oxidizer are mixed together, but in HREs an external supply of oxidizer is necessary to sustain the combustion. A solution for this research requirement is found in hybrid rocket slab burners, which present the main characteristics of a HRE, namely an oxidizer feed system, an ignition system, a combustion chamber with oxidizer injection and a nozzle. Compared to their conventional counterparts, the main difference is in the fuel grain, which is not a classical cylindrical perforated grain, but a slab, which is by definition a thick, flat piece of a solid substance.
While the regression rate could be measured in a simpler cylindrical grain using a radial burner5, the main advantage of the slab burner is the bi-dimensional flow field that is created over the flat fuel surface. The introduction of an optical access positioned parallel to the direction of the oxidizer, and normal to the slab surface, allows the visualization of the boundary layer and the diffusion flame developing over the solid fuel surface in a bi-dimensional condition which is key for the experimental verification and deduction of internal ballistics modeling of fuel regression6.
An example of a fuel slab used for the tests discussed in this article is shown in Figure 1, presenting a forward facing ramp for flameholding purposes.
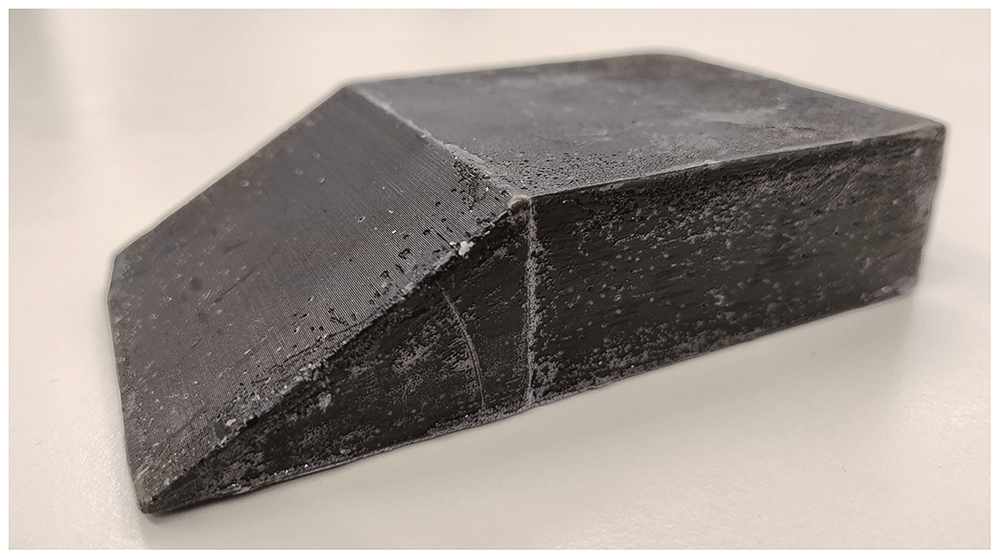
Figure 1. Paraffin fuel slab.
Experiments with paraffin-based fuels
Thanks to the entrainment mechanism, paraffin-based fuels allow to have a high regression rate without compromising the simplicity of HREs7. In particular, a high regression rate allows to use single port fuel grains, with a high volumetric loading and reduced complexity and inert mass requirements. Moreover, paraffins are non-toxic and relatively environmentally friendly, with a good specific impulse8. The main drawbacks that need to be tackled are, however, a low combustion efficiency, a low structural resistance and the proneness to low frequency combustion instabilities, aspects that can be addressed by introducing additives in the paraffin fuel formulation9.
Visualization experiments with a slab burner are particularly interesting for paraffin-based fuels due to the peculiar combustion mechanics, given by the liquid film formation and the droplets breakout and entrainment phenomena. Hybrid rocket slab burners have been used to perform investigations on the effect of additives and different liquid layer viscosity on the combustion. The experiments differ for the visualization techniques, typically high-speed video acquisitions, and operating pressure and mass flux. The rest of the section gives an overview of recent slab burner experiments carried out for paraffin-based fuels.
Kim et al.10, at the Korea Aerospace University, performed optical investigations of paraffin fuel blended with low density polyethylene (LDPE), to visualize liquid layer entrainment phenomena with hot gas injection, without a combustion reaction, and then to visualize the flame of paraffin, paraffin blended with LDPE and pure high density polyethylene (HDPE), providing qualitative results of the fuel type influence on the flame shape.
Nakagawa et al.11, from the Tokai University, performed combustion experiments using gaseous oxygen as oxidizer and both pure paraffin and paraffin mixed with ethylene-vinyl acetate (EVA) as fuels to change the viscosity of the melted layer. They used high speed videos to experimentally demonstrate the presence of a melted fuel layer and the entrainment of paraffin droplets and derived a relation between the viscosity of the melting layer and the regression rate.
Chandler et al.12 from Stanford University acquired high speed videos of different fuels (Paraffin, HDPE, HTPB among others) burning with gaseous oxygen with a pressure up to 5 bar, performing qualitative investigations of liquid entrainment, droplets visualization and flame bursting. Jens et al.13,14 continued the work by performing experiments with different fuels with a pressure up to 17 bar and a higher mass flow rate.
Kobald et al.15 from the German Aerospace Center performed high speed visualization and Z-type schlieren imaging of paraffin burning at atmospheric pressure conditions. They also tested paraffin mixed with stearic acid to change the viscosity of the liquid layer. They later introduced Proper Orthogonal Decomposition (POD) and Independent Component Analysis (ICA) techniques to analyze the luminosity field of the frames acquired with the high speed videos, to automatize the data analysis of the videos and acquire wavelengths and frequencies information about the flame patterns16. Petrarolo et al.17–19 improved the quality of the acquired videos, and applied the aforementioned techniques to investigate Kelvin-Helmholtz instability at the liquid layer, the relationship with viscosity and the droplets entrainment mechanism.
Wada et al.20 from Akita University performed combustion experiments of different polymers and paraffin fuels with a chamber pressure up to 20 bar. The slab burner configuration adopted for their test bench is a vertically mounted set up, with two opposing slabs mounted in parallel with the fuel flow. For the combustion of paraffin at high-pressure range they observed that both the number and size of droplets entrained are independent of the pressure.
Paravan et al.21 at Politecnico di Milano carried out entrainment visualizations of paraffin blended fuels at atmospheric pressures and in cold flow to identify the droplet breakout and entrainment mechanism. In their setup, the fuel is not ignited, but melted using an electrical resistance. They observed the primary and secondary break-up mechanisms of pure paraffin and paraffin with the addition of polymers to increase the mechanical properties.
Bertoldi et al.22 at Université libre de Bruxelles (ULB) used a slab burner to investigate the effect on performance of a paraffin slab doped with magnesium diboride (MgB2).
At the University of Calgary, Dunn et al.23 visualized burning paraffin-based fuels in ambient pressure, inserting wedges to change the pressure gradient inside the combustion chambers. From image reconstruction they performed measurements of the regression rate with different pressure gradients in the chamber and at different points of the fuel grain.
At the Kyushu Institute of Technology, Ozawa et al.24 realized a slab burner to investigate the effect of the test bench orientation on the combustion of paraffin-based fuels. With a high-speed camera, they visualized the diffusion flame at atmospheric chamber pressure both in a horizontal and in a vertical burner configuration, to asses if gravity effect impacted on the entrainment and ballistics of droplets. They observed that a body force up to 10 g doesn't affect the entrained droplets internal ballistics, but has an impact of the mass flux of the melted layer.
Budzinski et al.25 from the University of Buffalo realized a slab burner to study the radiation heat transfer in paraffin wax fuel grains, applying two-color pyrometry to the high speed images.
Liu et al.26 performed several studies on the boundary layer combustion of paraffin painted black with a 1% of carbon powder and using gaseous oxygen as oxidizer. They also performed experiments doping the fuel with catocene and copper chromite and cobalt stearate.
Experimental methods
An optical access slab burner, called MOUETTE (Moteur OptiqUe pour ÉTudier et Tester Ergols hybrides), has been designed at ULB to investigate the combustion behavior of HRE fuels27,28. The combustor features a modular design, so the components can be modified according to the different research needs, and can be also used as small-scale HRE test bench. The chosen oxidizer is gaseous oxygen (GOX), with a mass flow rate that can be adjusted using a chocking orifice in the feed lines and regulating the pressure of the gas fed from the reservoir. The ignition of the solid fuel slab is achieved with a pyrotechnic squib, and the pressure in the combustion chamber is maintained using a convergent nozzle with a graphite throat insert. Pressure measurements are acquired both in the combustion chamber and in the feed lines, as well as the oxygen flow temperature. The pre-combustion chamber is fitted with two honeycombs and a wire mesh screen, to reduce the oscillations of the flow during testing.
The test section has two parallel quartz windows that can be used to perform high-speed video acquisitions of the fuel combustion, also with chemiluminescence and schlieren imaging techniques. For the tests investigated in this article, a Photron FASTCAM SA4 500K-M1 high-speed camera has been used.
The nominal maximum operating conditions of the MOUETTE slab burner are listed in Table 1, while a photograph of a test is shown in Figure 2.
Table 1. Maximum operating conditions of MOUETTE.
| Combustion chamber pressure | 10 bar |
| Oxidizer mass flow rate | 100 g/s |
| Oxidizer mass flux | 50 kg/m2s |
| Burning time | 10 s |
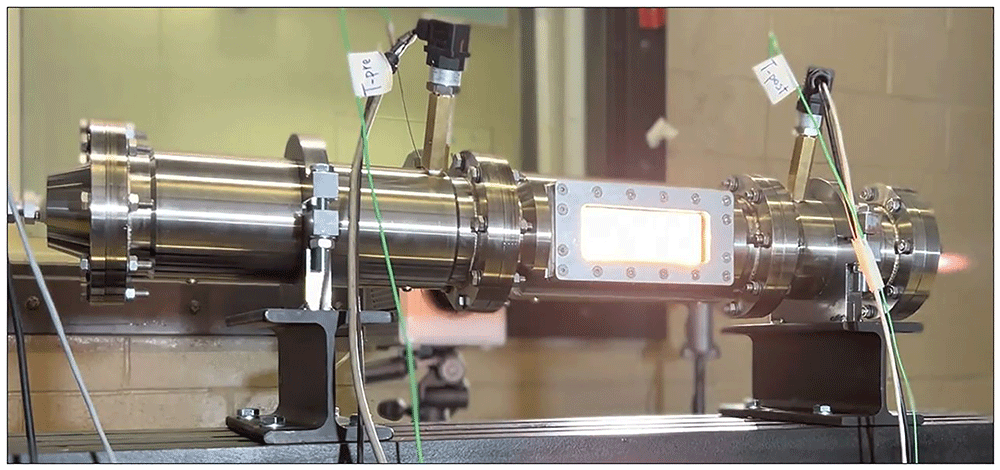
Figure 2. Photograph of a MOUETTE test.
The first step in performing a test with the MOUETTE is the definition of the test parameters. In particular, the variables that can be controlled are the test duration, the rate of injected oxidizer, and the nozzle throat.
After the parameters have been set, the fuel slab is weighed, and the dimensions are measured and reported.
The tests discussed in this article are taken from different campaigns performed with a paraffin fuel slab made in Tudamelt 52/54, produced by Hansen & Rosenthal group. The material is supplied in white pellets, with a melting temperature ranging between 52 and 54 °C, and a density of 920 kg/m3. The slabs are realized through casting in a dedicated mold. A black pigment is incorporated into the paraffin at a concentration of 0.5% by weight, to enhance the radiation absorption of the fuel and liquid droplets surface. Before testing, the lateral and rear faces of the slab are protected with a coating of Paraloid B-72, an inhibitor also used for SRMs29. The typical fuel slab has a forward facing ramp of 30°, a base length of 130 mm, a width of 75 mm and a height of 30mm, for a mass of approximately 210 grams.
The tests are enumerated with letters from A to D according to the test campaign in which they have been performed, as in Table 2.
Table 2. Overview of MOUETTE experimental campaigns.
| Time period | Test Code | Number
of tests |
|---|
| Spring 2022 | A | 18 |
| Spring 2023 | B | 15 |
| Winter 2023 | C | 6 |
| Spring 2024 | C | 4 |
| Spring 2024 | D | 16 |
The typical test sequence starts with the ignition transient, where the pyrotechnic igniter generates the heat required for the combustion to start, followed by the main combustion phase. After the defined test duration, the oxygen valve closes, leading to the shut-off transient. Finally, a nitrogen flow purges the combustion chamber and extinguish the flame.
At the end of the test, the pressure in the feed system is discharged, the nozzle is removed and the windows are disassembled and cleaned from soot and paraffin deposits. The fuel grain is removed, as well as the unburnt paraffin residuals which typically remain in the post-chamber and on the trailing edge of the grain holder, a phenomena well-known in experimental research on paraffin combustion24,30–32. The mass of the slab and residuals is taken, and the final dimensions of the slab are recorded, in order to estimate the average burning area, and the different regression among the faces. The residuals, collected by accurately scraping the grain holder and the post-chamber, typically account for 10–15% of the total final mass of the fuel. The slab burner can then be prepared for another test.
Excluding the high-speed videos, the main data output of a test are the pressure readings in the feed system and in the chamber, acquired with a sampling frequency of 1 kHz, with an example given in Figure 3.
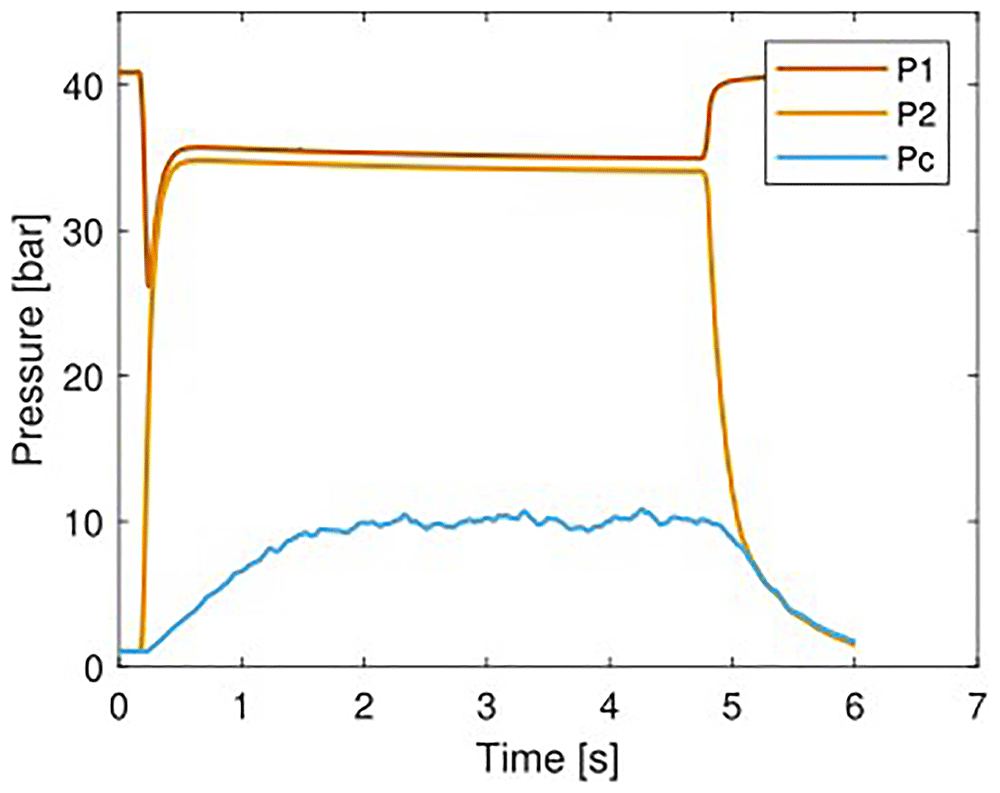
Figure 3. Measured pressure curves for test B08.
In the plot, P1 is the pressure reading upstream of the oxidizer main valve, P2 is the reading upstream of the choking orifice, and Pc is an average between the readings of the sensors in the pre-chamber and post-chamber. P2 value is lower than the value of P1, due to the pressure losses in the pipes. The effect of the choking orifice can be noticed due to the high pressure drop ΔP between P2 and Pc.
The first value that is extrapolated from these data is the burning time tb, which has to defined taking into account the transients due to the ignition and shut-off of the system. The initial and final time instants used for the calculation are based on the observation of the ascending and descending peaks of the combustion chamber pressure. The definition of burning time is not standardized, and there are different methods that can be adopted to define the actual duration that have to be selected according to the dynamics of the HRE33,34.
Karp and Jens35 provide an overview of five different methods commonly adopted in literature, and some indication to select the method that is less prone to errors, depending to the test dynamics, which can be coupled with the methodology of Frederick et al.36 to address the resulting uncertainty due to the different burning time definition.
Long ignition and shut-off transients have been observed in the MOUETTE, constituting a large portion of the total test duration, especially in case of slow ignition. For these considerations, the method selected is based on the average value of the combustion chamber pressure measured in the quasi-steady state period. The method is not suitable for large pressure variations during testing, but this is not the case for the MOUETTE tests. In particular, the initial value of tb is selected when the pressure rises over a predefined threshold of the average value of Pc, and the final point when it decreases under that value. Thresholds commonly selected in hybrid rocket testing when adopting this tb definition lies between 50%36, 70%37, 90%35 and 95%38. Due to the slight pressure variation over the quasi-steady state testing time and to exclude the long ignition transients, the more conservative threshold of 90% has been selected.
Once the burning time is defined, the average pressure values during the firing test can be estimated as well. The average oxidizer mass flow rate ṁox is calculated with the equation for the choking orifice (Equation 1):
Where γ is the heat capacity ratio of oxygen and ρ0 its density upstream of the orifice, P0 the pressure of the flow upstream of the orifice, A the area of the orifice and cD the discharge coefficient, experimentally characterized to a value of 0.6.
The oxidizer mass flux Gox is then calculated as follows:
Where the denominator is the cross-section of the combustion chamber traversed by the gas flow: Ap is the empty section of the chamber, minus the section of the fuel slab normal to the flow direction, calculated using the height hs and the width ws. The value of Ap is 0.004227 m2.
The second main output of a MOUETTE test is the high-speed video recording of the combustion.
To set-up the camera, several tests have been carried out to define the best parameters. The main parameters that can be adjusted are the frame rate, the lens aperture, the shutter speed and the resolution. Moreover, a camera filter can be used, in order to reduce the amount of light coming into the lens, or to allow only certain wavelengths to penetrate the lens.
For what concerns the camera used, the duration of a video is limited by the memory of the camera, and both the frame rate and the resolution affect the maximum duration that can be recorded, therefore a trade-off had to be done to be able to cover the full duration of the test.
The lens used for the camera is a Nikon 50mm f/1.2, a manual focus lens with a focal length of 50 mm, a maximum aperture of f/1.2 and a minimum of f/16. The test section is not illuminated, all the light that is captured by the high-speed camera comes from the flame itself. Therefore, to ensure the correct exposure of the video at the desired frame rate, the shutter speed and lens aperture have to be accurately tuned.
Through a calibration process performed before the tests, the conversion factor from pixel to mm can be estimated and used for the analysis.
After a test, the high-speed videos are divided in single frame sequences and then post-processed. A typical image that can be acquired from the combustion of a paraffin slab is given in Figure 4, with oxidizer flowing from left to right. On the left side of the image there is the leading edge of the slab, constituted by a forward-facing ramp that acts as flame holder. The trailing edge of the slab is harder to detect due to the recirculation zone that forms after the backward facing step. In general, the observed flame structures are highly oscillating.
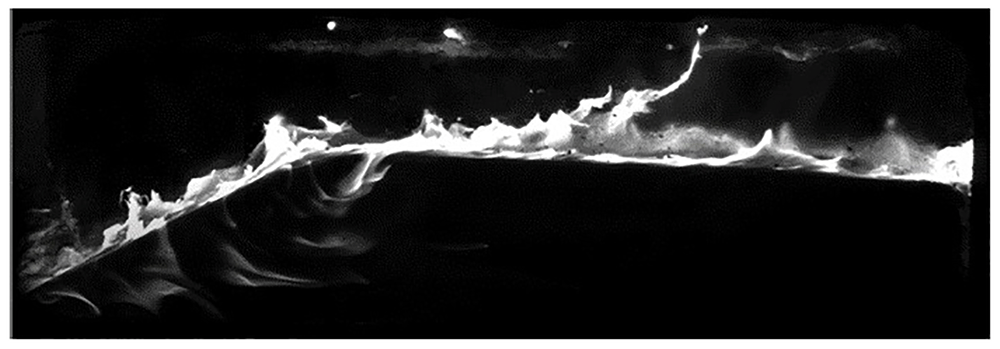
Figure 4. Combustion of paraffin in the MOUETTE slab burner.
Results discussion
Selected tests performed in the campaigns listed in Table 2 are discussed in this section, with the objective of providing an overview of the regression rate as function of the oxidizer mass flux, and to describe the phenomena observed in the combustion of paraffin. A visual comparison between a new slab and a burnt one is given in Figure 5 and Figure 6. After combustion, the length and height reduce, while the width is less affected, as the lateral surfaces are coated with the polymer.
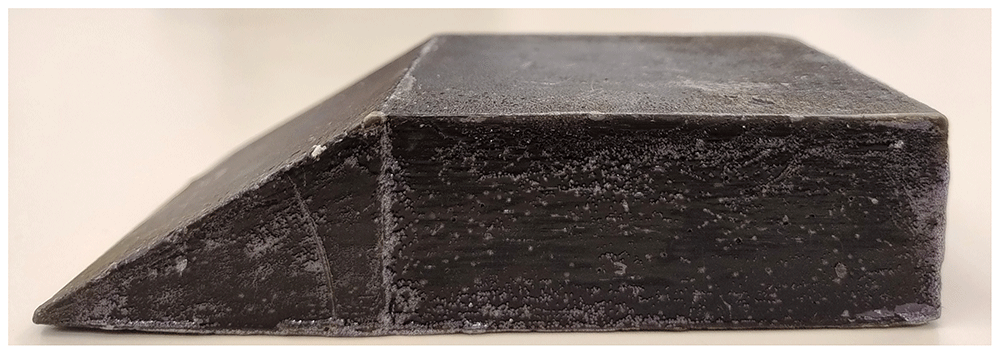
Figure 5. Paraffin fuel slab before testing.
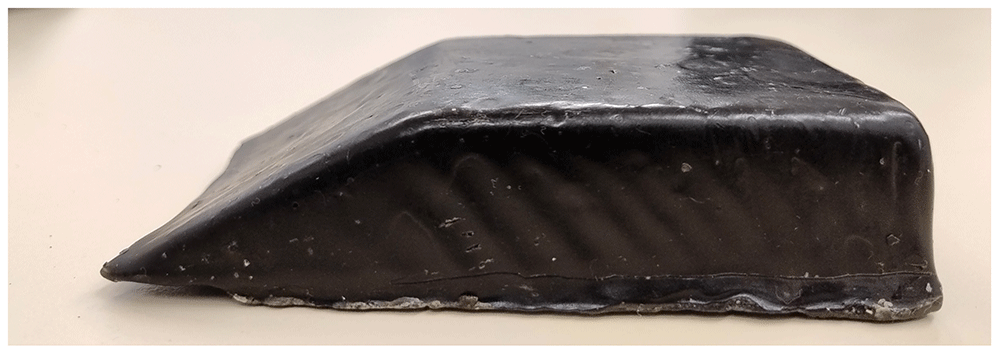
Figure 6. Paraffin fuel slab after testing.
In general, after the firing all the sharp edges of the slab are smoothed, in particular the top of the forward facing ramp and the top of the backward facing step. These correspond to the inlet and outlet zones of a typical hybrid rocket fuel grain, and in these zones there is a larger consumption of fuel. The increased recirculation and mixing has been observed to affect the regression rate at the entrance of fuel grains39,40, and the backward facing step at the exit of the fuel grain has as well a beneficial effect on mixing and therefore an increased regression rate41,42. Moreover, the bottom of the forward facing ramp, the leading edge of the slab, has an uneven consumption along the lateral axis, with the center of the edge more burnt than the extremities. This phenomenon has been observed in all the tests, and the shape is consistent with the velocity profile of a fully developed turbulent flow in a pipe43, suggesting that a higher oxygen flow velocity translates to a higher fuel regression.
The regression rate is calculated using the mass loss method, which is based on the variation of the fuel mass measured before and after the test, Δmf. More precisely, what can be calculated using this method is the space and time averaged regression rate hereafter denoted simply as ṙ.
For a conventional fuel grain with a single circular port, this value can be obtained by measuring the variation of the port diameter over the burning time:
where Di and Df are respectively the initial and final port diameter. As the evolution of the diameter is not perfect due to the turbulent nature of the combustion phenomena, an equivalent final diameter is calculated by measuring the total fuel mass variation Δmf of the test using the following equation:
where ρf is the density of the solid fuel and Lf the length of the grain.
The adaptation of this method to a slab burner is not trivial, as the burning area is not the conventional cylindrical port. Therefore, a final equivalent diameter cannot be defined easily. For providing an estimation, a different method has been adopted. Starting from the definition of fuel mass flow rate, where Ab is the burning surface of the fuel slab:
a space and time average ṙ can be estimated knowing an average burning surface. To define the value of Ab to use, some considerations have been made. First, the fuel slab geometrical features are measured before and after each test. However, it has been noticed by observing the recorded videos of the tests, that the melting of the paraffin happening at the end of the test, between the shut-off transient and the purge, affects the final shape of the slab and therefore the measurable dimensions. The deformation can't be accurately predicted, therefore the average between initial and final area cannot be used. Moreover, it must be remembered that not all the slab surfaces are subjected to combustion in the same manner. For the slabs investigated, the lateral and rear surfaces are covered with the polymer, and the bottom of the slabs, except for non-nominal tests where the slab detaches from the holder and burns underneath, is not affected by the combustion. Generally, even if the polymer is not present, the observed reduction in height is higher than the reduction in width.
Based on these observations, the value of Ab considered for the estimation of the regression rate is limited to the forward facing ramp surface and the top surface, the two areas more affected by the combustion. Due to the short burning time duration and the relatively small variation of the size observed, to neglect the deformation induced by the paraffin melting at the end of the test, only the initial area is used for the calculation, providing a standard condition for tests comparison. Due to the small variation of cross-section compared to the total port area of the chamber, it can also be initially assumed that the variation of the oxidizer mass flux Gox is negligible during the duration of the combustion tests, therefore a value can be estimated based on the average mass flow rate and initial slab cross-section.
The uncertainties in the estimation of the space and time average regression rate have been calculated following the method described in the ASME standards44,45. The method has been specifically translated to the investigation of HRE performances by Frederick and Greiner36, and applied as in the work of Sanders on slab burners46. In the tests analyzed, the burning time estimation proved to be the most important source of uncertainty in the regression rate measurements, especially for long transient times observed in the MOUETTE tests. Longer tests would reduce the effect of the burning time on the regression rate, as well as a faster and more reliable ignition.
The main dataset selected for the analysis of the regression rate of paraffin comes from the fourth test campaign (D), performed at different test conditions, based on different combustion chamber pressure and oxidizer mass flux. When possible, at least three tests at the same conditions have been performed. In order to increase the range of data available, some tests have been selected from the second and third campaign. A summary of the test matrix with the test numbers is given in Table 3 with the pressure expressed as relative pressure, and maintaining the original nomenclature.
Table 3. Matrix of test conditions.
| Pc 0-1 bar | Pc 2-4 bar | Pc 4-6 bar | Pc ≥ 6 bar |
| Gox 6-8 kg/m2s | B04, C01, C04, D13-D16 | D08-D12 | - | - |
| Gox 10-12 kg/m2s | D02-D04 | C09-C10, D01 | D05-D07 | - |
| Gox 13-15 kg/m2s | - | - | - | B08-B12 |
While the three tests of the third campaign (C) add more measurements to an already tested value of Gox, the data from the second campaign (B) provide an extended range of analysis. In particular, test B04 has been performed in atmospheric pressure and with a fuel slab with a reduced height, for a low value of Gox. On the opposite side, B08 and B12 present a higher mass flux and combustion chamber pressure, induced by the utilization of a larger chocking orifice. Tests from the first campaign (A) have not been taken into account due to the different slab geometry used.
Generally, as the scattering of the data is an inevitable outcome of experimental research, the access to high-speed camera videos helped in identifying outliers that have a non-nominal behavior and would affect the outcome of the tests. In particular, some of the tests have not been considered in the final discussion, either for detachment of fuel slab from the holder, unsteady combustion or excessively long ignition transient.
The regression rate resulting from the test campaigns is given in Table 4 for the second test campaign, Table 5 for the third and Table 6 for the fourth, along with the experimental data used for the estimation. The regression rate and combustion chamber (relative) pressure are the measured average value of the test, while the Gox is calculated with the average oxidizer mass flow rate divided by the initial port area, as discussed previously. For the same reasoning, Ab is the initial burning area.
Table 4. Experimental results from the second test campaign.
Test
number | Δmf [g] | tb [s] | Ab [mm2] | Pc [bar] | Gox [kg/m2s] | ṙ [mm/s] |
|---|
| B04 | 7.62 ± 0.02 | 3.99 ± 1.26 | 10963.88 ± 34.01 | 0.02 ± 0.00 | 6.61 ± 0.07 | 0.19 ± 0.06 |
| B08 | 14.18 ± 0.03 | 3.51 ± 1.12 | 10459.30 ± 33.73 | 9.84 ± 0.98 | 14.44 ± 0.14 | 0.39 ± 0.12 |
| B12 | 20.16 ± 0.10 | 3.98 ± 1.09 | 10500.00 ± 200.00 | 10.96 ± 1.10 | 13.76 ± 0.14 | 0.42 ± 0.10 |
Table 5. Experimental results from the third test campaign.
Test
number | Δmf [g] | tb [s] | Ab [mm2] | Pc [bar] | Gox [kg/m2s] | ṙ [mm/s] |
|---|
| C01 | 12.53 ± 0.06 | 4.74 ± 0.84 | 10442.08 ± 32.95 | 1.98 ± 0.20 | 8.24 ± 0.08 | 0.28 ± 0.05 |
| C02 | 13.69 ± 0.07 | 4.44 ± 1.08 | 10530.00 ± 33.06 | 2.04 ± 0.20 | 8.27 ± 0.08 | 0.32 ± 0.08 |
| C03 | 9.71 ± 0.05 | 4.38 ± 1.04 | 10412.16 ± 32.91 | 1.92 ± 0.19 | 7.96 ± 0.08 | 0.23 ± 0.06 |
| C04 | 11.89 ± 0.04 | 5.27 ± 0.66 | 10232.63 ± 32.78 | 2.01 ± 0.20 | 7.54 ± 0.08 | 0.24 ± 0.06 |
Table 6. Experimental results from the fourth test campaign.
| Test number | Δmf [g] | tb [s] | Ab [mm2] | Pc [bar] | Gox [kg/m2s] | ṙ [mm/s] |
|---|
| D01 | 9.99 ± 0.03 | 4.46 ± 1.54 | 10566.92 ± 33.25 | 3.40 ± 0.34 | 11.57 ± 0.16 | 0.30 ± 0.14 |
| D03 | 16.48 ± 0.07 | 3.75 ± 1.20 | 9922.70 ± 32.41 | 0.93 ± 0.09 | 11.44 ± 0.11 | 0.48 ± 0.16 |
| D04 | 14.23 ± 0.07 | 3.28 ± 1.43 | 10443.84 ± 33.30 | 0.90 ± 0.09 | 11.38 ± 0.11 | 0.45 ± 0.20 |
| D05 | 11.54 ± 0.03 | 3.85 ± 1.57 | 10450.72 ± 33.29 | 5.48 ± 0.55 | 11.36 ± 0.11 | 0.31 ± 0.13 |
| D06 | 8.93 ± 0.04 | 3.91 ± 1.46 | 10425.23 ± 33.06 | 4.83 ± 0.48 | 11.37 ± 0.11 | 0.24 ± 0.09 |
| D07 | 11.08 ± 0.04 | 4.07 ± 1.47 | 10417.75 ± 33.13 | 5.17 ± 0.52 | 11.31 ± 0.11 | 0.28 ± 0.10 |
| D10 | 9.59 ± 0.03 | 4.77 ± 1.99 | 10638.78 ± 33.44 | 1.48 ± 0.15 | 7.62 ± 0.08 | 0.21 ± v0.09 |
| D11 | 6.74 ± 0.03 | 3.02 ± 1.70 | 10359.90 ± 32.69 | 1.41 ± 0.14 | 7.63 ± 0.08 | 0.23 ± 0.13 |
| D13 | 9.47 ± 0.04 | 3.79 ± 0.42 | 10562.04 ± 33.06 | 0.34 ± 0.03 | 7.62 ± 0.08 | 0.26 ± 0.03 |
| D16 | 13.67 ± 0.05 | 4.14 ± 0.43 | 10465.00 ± 32.95 | 0.39 ± 0.04 | 7.54 ± 0.08 | 0.34 ± 0.04 |
First and foremost, the loss of mass can be discussed. The initial mass of the slabs is between 210 and 220 grams for all the tests, and only a relatively small loss of mass has been measured experimentally, ranging between 3.8 and 20.2 grams, depending on the burning time of the test. In general, for the type of tests performed with the MOUETTE, a loss of mass never higher than 10% has been measured, and a higher burning time leads to a higher mass consumption, as it is expected. This low quantity of mass consumed during the test translates to a generally small value of the regression rate, with an average of 0.34 mm/s, oscillating between 0.2 and 0.5 mm/s.
The second main observation is based on the analysis of the uncertainties. Based on the methodology adopted, it can be observed that, while the fuel mass loss and the burning area are estimated with good accuracy, the burning time presents large uncertainties. This translates in a large uncertainty in the calculated regression rate, and the quality of the data needs to be assessed critically before investigating the effect on regression of Gox and Pc.
With the considerations given, the regression rate over mass flux plot can now be introduced, shown in Figure 7. In the graph, the Marxman's law fitting have been plotted for all the data, for the pressurized tests only and for the atmospheric tests only.
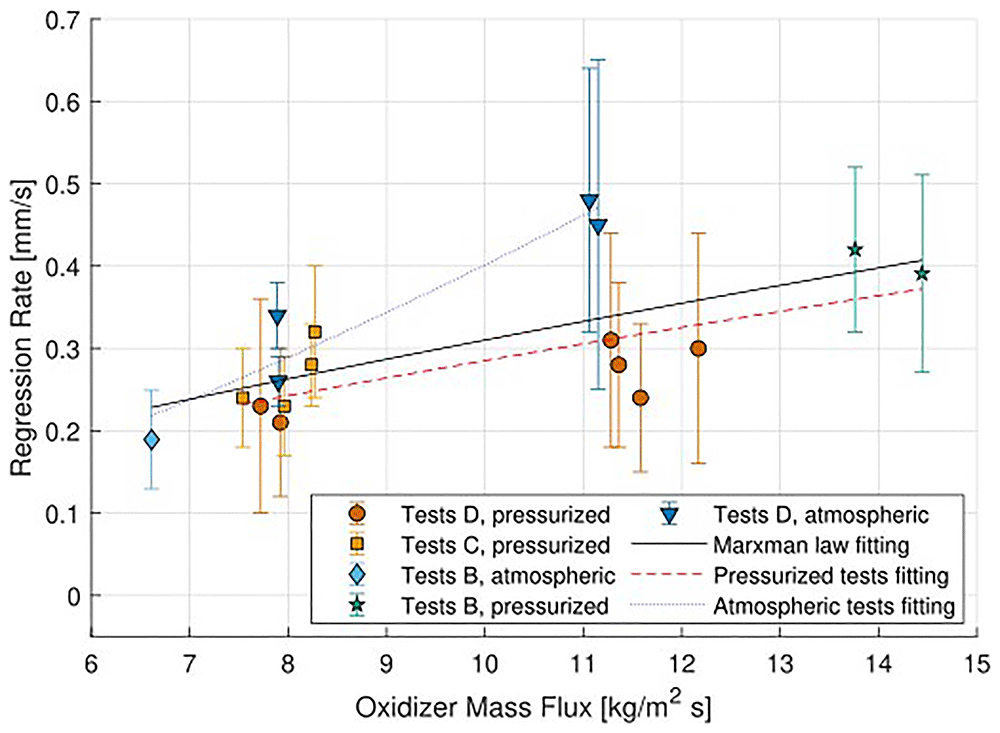
Figure 7. Regression rate against oxidizer mass flux.
By observing the plotted data, some trends can be deducted. First, different clouds of data can be identified, which are distinguished by the value of Gox. The uncertainty bars on the Gox have been omitted, for clarity of presentation, as the uncertainty is on average of 1%.
The first conclusion that can be drawn from these results concerns the effect of the mass flux on the regression rate. Observing both the results obtained at atmospheric pressure, and the results obtained at pressurized conditions, a dependency between the measured regression rate and the oxidizer mass flux appears, further confirmed by the results of the higher Gox tests, B08 and B12, and the lower Gox test, B04. The results fit with the model developed by Marxman for the dependency of the average regression rate over the oxidizer mass flux. Ideally, the trend should be further investigated with the addition of more experimental points, to increase the range of Gox conditions tested.
In particular, the high and low Gox points have been determined with a limited number of tests, and more repeatable tests should be performed in these conditions to increase the reliability of the prevision, and to confirm the results of B04, B08 and B12.
The second conclusion concerns the effect of pressure. To assess the influence of pressure on the combustion, different tests have been performed at the same Gox condition, but adjusting the nozzle throat to have a larger spectrum of analysis.
Even though the results have been acquired in different pressure levels, they all seem to group around a common center, dictated mainly by the mass flux. These results suggest a minimal impact of pressure on the regression rate, which is expected from theory47.
An outlier from the trend is given by the atmospheric pressure tests. Excluding B04, that can't be compared with other tests performed at the same Gox conditions, they all present a higher measured regression rate. While satisfying the conditions of higher oxidizer mass flux equal higher regression rate, they all present a higher measured value than the one taken from pressurized tests. It has been observed that the slabs burned at higher pressure conditions present lower dimensions after the tests, suggesting that a higher consumption of the fuel is present. However, this also comes at the cost of a larger amount of melted paraffin deposits in the combustion chamber, suggesting that part of the heat absorbed by the slab surface melts the fuel, but might be not enough to pyrolyze it and burn.
A possible cause for the increased regression rate should be identified in the test procedure, and in particular on the transitory shut-off of the MOUETTE. At the end of the test a flow of nitrogen is fed in the combustion chamber, halting the combustion and cooling down the slab surface. The flow of nitrogen on the paraffin slab, which presents a melted liquid layer, could lead to the break-up of droplets from the surface, their entrainment in the nitrogen flow and expulsion from the nozzle, which has a larger throat area for the atmospheric tests. The effect of purge could increase the measured regression rate, as the mass of ejected paraffin droplets should have a relatively higher impact on the total measured mass loss, and its impact should be assessed by performing tests with without purging, letting the paraffin cool down in the chamber.
The variation of regression rate as a function of oxidizer mass flux has been fitted with a power law, based on the Marxman's diffusion-limited model:
In particular, three fittings have been calculated, as plotted in Figure 7: one for atmospheric tests, one for pressurized tests, and a general one with all the data available. The resulting coefficients are listed in Table 7.
Table 7. Regression rate parameter results.
| Test number | a0 | n | R2 | Pc | Gox |
|---|
| Atmospheric tests | 0.014 | 1.471 | 0.92 | 0.5 bar | 5-11 kg/m2s |
| Pressurized tests | 0.054 | 0.726 | 0.59 | 2.5-10 bar | 7.5-14.5 kg/m2s |
| All tests | 0.057 | 0.739 | 0.42 | 0.5-10 bar | 5-14.5 kg/m2s |
To evaluate the results, a comparison with experimental data listed in literature is required. The values available have been listed in Table 8. Unfortunately, limited fitting laws with a slab burner are available in literature, and only the curves of Nakagawa et al.11 and Dunn et al.23 are reported. They both report an average regression rate between the tests around 0.35 mm/s. Petrarolo48 and Kobald et al.49 both perform also tests with gaseous oxidizer and paraffin in a slab burner in a similar range of Gox, obtaining a regression rate between 0.2 and 0.6 mm/s, but don't disclose the a0 and n coefficient values. The other data presented have been evaluated for a conventional combustion chamber, with a cylindrical fuel grain. Moreover, when specified, the range of Gox is generally higher then what tested in the MOUETTE.
Table 8. Regression rate parameters from literature.
| Reference | Oxidizer | Fuel | a0 | n | R2 | Pc | Gox |
|---|
| Nakagawa et al.11 | GOX | Paraffin | 0.069 | 0.595 | [-] | atmospheric | 10-30 kg/m2s |
| Dunn et al.23 | GOX | Paraffin | 0.079 | 0.544 | [-] | atmospheric | 5.2-16.2 kg/m2s |
| Karabeyoglu et al.50 | GOX | Paraffin | 0.117 | 0.620 | [-] | 0.1-5.9 | 16-369 kg/m2s |
| Quadros et al.51 | GOX | Paraffin | 0.496 | 0.620 | [-] | atmospheric | 15-32 kg/m2s |
| Karabeyoglu et al.52 | GOX | Paraffin | 0.082 | 0.718 | 0.97 | [-] | [-] |
| Narsai53 | GOX | Paraffin | 0.114 | 0.644 | 0.64 | [-] | [-] |
| Karabeyoglu et al.50 | GOX | Paraffin | 0.144 | 0.590 | 0.70 | [-] | [-] |
| Di Martino et al.54 | GOX | Paraffin | 0.103 | 0.712 | 0.84 | [-] | [-] |
| Evans et al.55 | GOX | Paraffin | 0.672 | 0.600 | [-] | [-] | 63-123 kg/m2s |
| Karabeyoglu et al.56 | GOX | Paraffin | 0.427 | 0.735 | [-] | atmospheric | 43-119 kg/m2s |
A graphical description is also given in Figure 8, plotting the curves available in literature alongside the MOUETTE data, in the region of interest. The pressure has been converted to relative pressure for comparison.
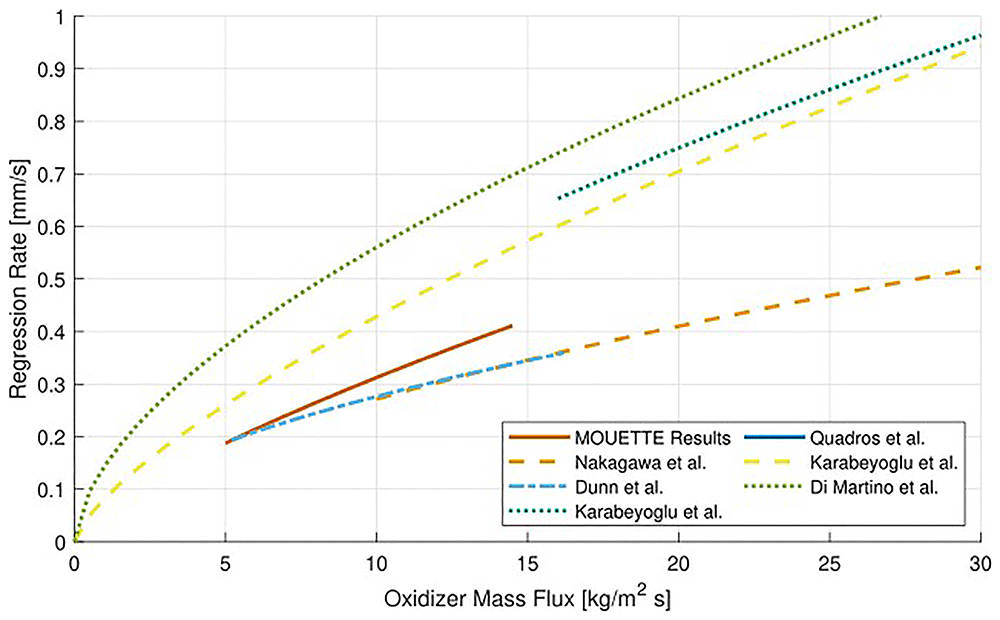
Figure 8. Regression rate against oxidizer mass flux from literature.
The value of n evaluated from the pressurized tests, equal to 0.726, is in the range of the experimental observations found in literature, ranging typically between 0.6 and 0.8. The value obtained for the atmospheric tests is much higher, of 1.471, and such a high value suggests that the limitations in the regression rate estimation method have to be taken into account.
The value of a0, on the other hand, is lower than literature, but this could be justified by the limited range of Gox used for the investigation, plus the large scattering, shown by the low value of the parameter R-squared. If compared with the results of Nakagawa et al. and Dunn et al., performed in a slab burner, the order of magnitude is similar.
The overall fitting lies at the limit of the experimental range reported in literature, but is influenced by the scattering induced by the atmospheric tests, and qualitatively follows the trend given by other researchers shown in Figure 8.
Generally, for a more reliable prediction, a larger amount of points should be tested, especially by changing the value of the oxidizer mass flux, to increase the data interval for the fit.
Internal ballistics visualization
The main purpose of MOUETTE test bench is the acquisition of high-speed videos of the fuel combustion.
In general, the videos have been analyzed to provide more insight on the combustion process, and a first detailed view of combustion of paraffin on the surface of the fuel slab is shown in Figure 9. This figure is a magnification of a frame taken from test B04, and is used to give an example of what is observed in every test. The frame has been recorded at 2000 fps, with a lens aperture of f/8, a shutter speed of 1/593000 s and a resolution 896x512 pixels.
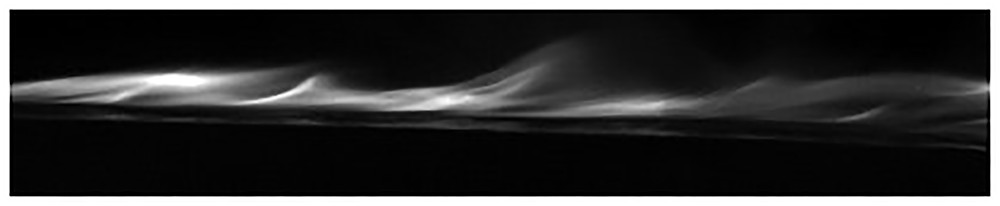
Figure 9. Diffusion flame visualized in test B04, oxidizer flowing from left to right.
Looking at the figure, the black area on the bottom is the lateral surface of the fuel slab. On top of it there is a narrow bright thin line, before a second dark area. The bright zone is assumed to be the liquefied surface of the paraffin slab, which glows reflecting the light of the flame. Between the liquid surface and the flame core there is the fuel rich dark zone, which is filled by the mass flux of gaseous pyrolyzed fuel coming from the slab surface. Over the flame zone there is a second dark area, which is oxidizer rich and filled by the oxygen mass flow. This diffusive flame structure observed experimentally is in accordance with the theoretical models described in literature of the hybrid rocket combustion in the boundary layer.
To investigate the effect of the gaseous oxidizer mass flux and chamber pressure on the flame, the tests have been categorized based on the tested conditions. The operative points are four, summarized in Table 9, all taken from the fourth test campaign. Tests D08 and D09, performed at the same conditions of test D10, have been excluded from the regression rate analysis due to the excessively long ignition transient compared to the burning time, due to problems in the igniter composition, but the steady state videos can be included for a qualitative description of the combustion behavior.
Table 9. Matrix of test conditions.
Low pressure
Low mass flux | Low pressure
High mass flux |
| D13, D16 | D03, D04 |
High pressure
Low mass flux | High pressure
High mass flux |
| D08, D09, D10 | D01, D05, D06, D07 |
Some frames taken from the four tests conditions are presented in Figures from Figure 10 to Figure 13. These frames have been acquired with the same camera settings and allow for a direct comparison. The frames have been recorded at 2000 fps, with a lens aperture of f/16, a shutter speed of 1/593000 s and a resolution 896x512 pixels.
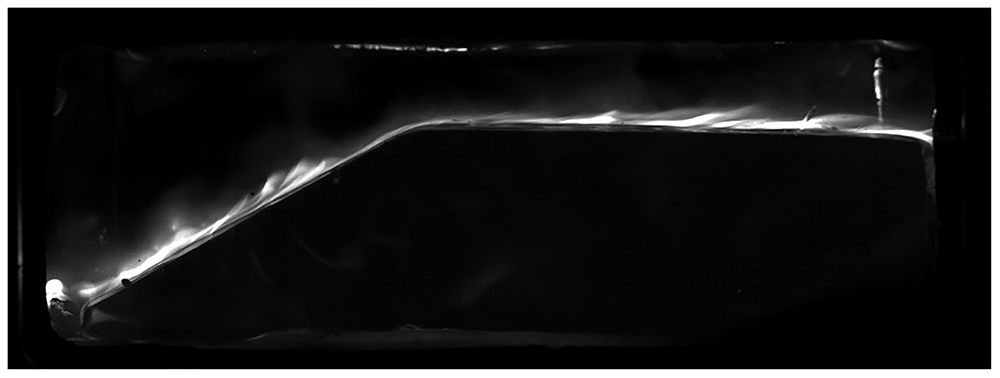
Figure 10. Test D13.
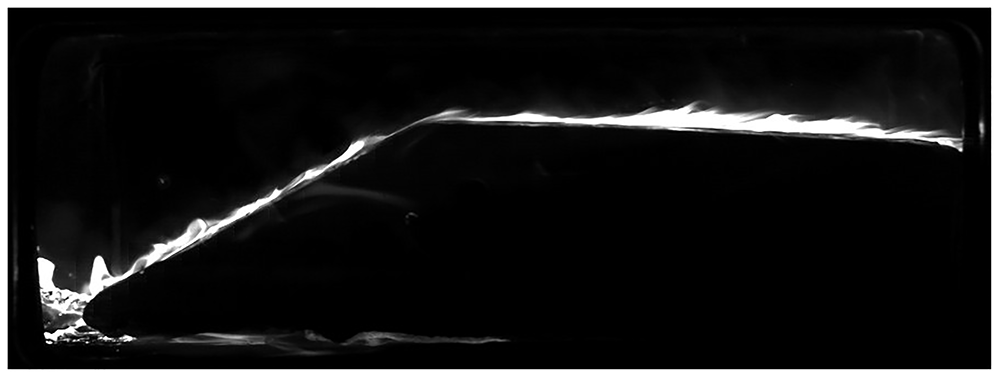
Figure 11. Test D04.
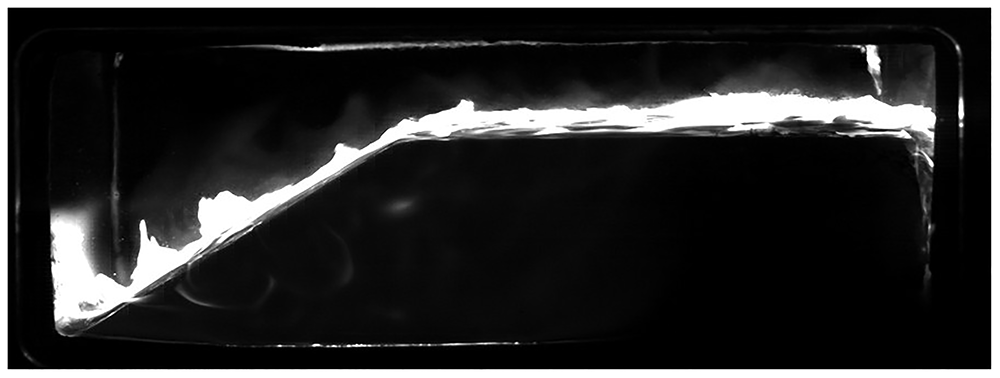
Figure 12. Test D08.
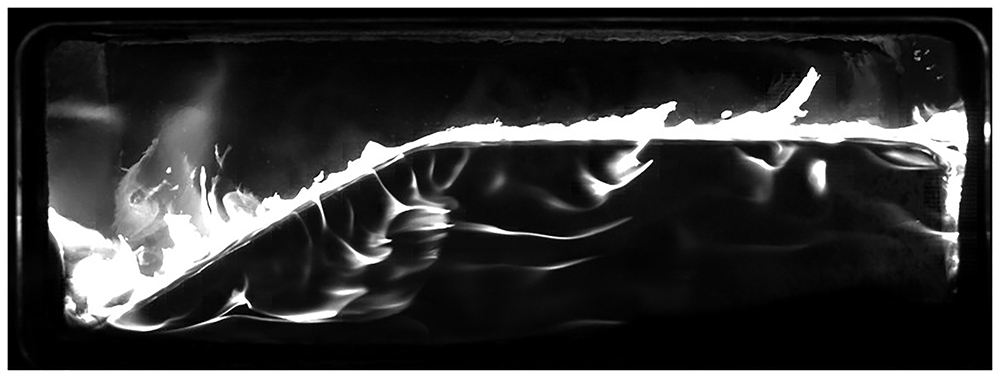
Figure 13. Test D06.
The effect of the mass flux and of pressure on the combustion can be observed qualitatively. First, an increase in Gox at the same pressure conditions is acting on the heat exchange at the surface as predicted by the diffusion-limited model and generating a higher regression rate, which is shown by the more intense emission of soot in the visible light spectrum. An increase in the mass flux, while translating in a higher regression rate, should also decrease the flame thickness26 and this will be assessed in the future through image analysis techniques, taking into account the insurgence of blowing events induced by droplets break-up and combustion instabilities.
The effect of pressure, on the other hand, couldn't be assessed from the space and time average regression rate data, but it's visible using the high-speed camera. In particular, higher pressure translates in again a thicker saturated area of the flame, and in combination with a higher Gox this brings to the more energetic conditions, with flames developing also on the sides of the slab, and more frequent and intermittent blowing events from the fuel surface. Moreover, the effect of the recirculation zone at the beginning of the forward-facing ramp, is even more visible.
In general, a wider spectrum of combustion chamber pressure at low Gox should be investigated, to quantify if an effect is present on the regression rate.
Concerning the entrainment of liquid fuel droplets in the oxidizer flow, the small droplets typically can't be visualized in the videos gathered. The reasons could be multiple. First, the droplet size could be too small to be captured by the camera. Second, the brightness of the flame saturates the image in proximity of the droplets, which are burning cores themselves, therefore enveloped by a burning surface. Larger liquid droplets can be however visualized in correspondence with local blowing events at the surface of the grain, typically coupled with pressure increases induced by the enhanced instantaneous fuel mass flow. A photograph, taken from test B08, is shown in Figure 14, where the burning fuel droplets ejected in the oxidizer flow by some local surface instabilities can be identified.
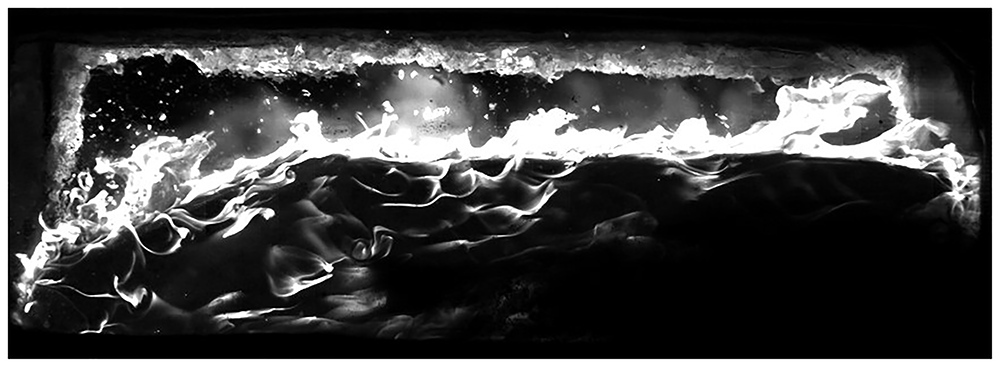
Figure 14. Droplets combustion events observed in test B08.
An interesting result towards the droplets ejection mechanism at the liquid surface layer of investigation comes from test B15. Test B15 has been performed with a Gox in the range of 12 kg/m2s, with a relative combustion chamber pressure of around 0.5 bar, slightly reduced by the presence of a small leak on one of the windows, induced by the ignition wires being stuck between the window gasket and the combustion chamber. The wires burn and illuminate the fuel grain surface, shedding light to the Kelvin-Helmholtz instability phenomena, in which the unstable liquid layer developing on the fuel surface forms roll waves which break-up and release liquid droplets, entrained in the flow.
The phenomenon is shown in a sequence of frames taken from the acquired high-speed video, at an interval of 0.5 ms between each frame. The photographs from Figure 15 to Figure 22 show 3.5 ms of a droplet release event. In the pictures, the oxidizer is flowing from left to right, and only the upper surface of the slab is shown. The frames have not been adjusted in brightness or contrast.

Figure 15. Droplets release observed in test B15.
Time = t0.

Figure 16. Droplets release observed in test B15.
Time = t0 + 0.5 ms.

Figure 17. Droplets release observed in test B15.
Time = t0 + 1 ms.

Figure 18. Droplets release observed in test B15.
Time = t0 + 1.5 ms.

Figure 19. Droplets release observed in test B15.
Time = t0 + 2 ms.

Figure 20. Droplets release observed in test B15.
Time = t0 + 2.5 ms.

Figure 21. Droplets release observed in test B15.
Time = t0 + 3 ms.

Figure 22. Droplets release observed in test B15.
Time = t0 + 3.5 ms.
At first, small liquid protrusions develop on the fuel surface, which start to grow in size and height. Once the waves reach a critical height, they break up and release small droplets in the flow, which evaporates and burn in the flame zone. It can also be noticed that, as the wave fronts grow in height and become more unstable, the background becomes brighter, and the flame fronts develops, suggesting that small paraffin droplets are being entrained in the oxidizer flow and burn. These images show the direct release mechanism of paraffin droplets in a reacting flow, a result hardly achieved in literature, and with a good resolution, that will be used in future works for the calculation of number of droplets, diameter and distribution. This result is a first starting point for the definition of targeted tests in order to visualize the droplet entrainment phenomena at the different chamber conditions.
Conclusions
A hybrid rocket slab burner has been used to investigate the combustion of paraffin, one of the most interesting fuels for HREs due to its high regression rate induced by the liquefying properties.
As outcome of the tests discussed in this article, some features of paraffin combustion have been observed and measured. First, the effect of the oxidizer mass flux on the regression rate has been assessed, and the results are in accordance with the predictions coming from literature, as an increase in mass flux leads to an increase in regression rate. The effect of pressure, on the other hand, seems to be inconclusive, probably due to the limited range of combustion chamber pressures tested, and further investigations are required. Moreover, due to the short burning time, the uncertainties on the results are relatively high, and tests with longer steady-state phases should be performed in the future to address this issue.
In general, to deeply understand the behavior of paraffin combustion and to verify the existing models of the combustion process, a larger amount of tests need to be performed, in particular on a larger oxidizer mass flux range.
The developed test bench and the preliminary results suggest different lines of research to follow. First, a set of non-liquefying fuels tests should be performed, in order to provide a reference that can be used to assess the effect of the unstable liquid layer and droplets entrainment in the increase in regression rate of paraffin fuels. Then, a larger database of paraffin combustion in different operative conditions should be created through more experimental testing, to improve the predictions given in this work.









