Introduction
For energy consumers living in cold climates, such as rural areas of Finland, energy costs are not just another utility bill; they are a fundamental aspect of life that cannot be overlooked as energy consumption for heating is essential during the winter season in harsh environments, also it is necessary to maintain the quality of homes, water piping, and infrastructure (Sandberg et al., 2018). The cost of energy significantly influences the standard of living, especially during the winter months. For energy consumers, various factors influence their energy usage behavior, with energy data visualization being one such aspect (Qureshi et al., 2025). Energy data visualization is displaying energy statistics through a user interface, which is often more important to energy consumers in colder climates than in milder ones. This is mainly due to changing weather conditions and complex dynamic factors, such as heating needs and available energy contracts.
Previous studies conducted within the same demographic in Finnish rural area have identified four groups of energy consumers based on energy consumption and monitoring behaviors categorize from A to D where group A are consumers who less concerned about energy monitoring and consume as much energy as they need. As we move down the scale to Group D, consumers become increasingly focused on energy monitoring and saving. Group D members actively seek to maximize their energy savings, often adjusting their consumption routines based on energy prices (Qureshi et al., 2024). The consumer groups highlighted by the study can be summed into two categories, where the first category consists of tech-savvy individuals who seek advanced features and new energy solutions. The second category includes more traditional, non-affluent consumers who focus on saving energy by modifying their energy consumption habits.
This study is about the energy interface design elements, which provide access to different energy statistics, allowing consumers to monitor and manage their energy consumption. While there are technologies available for providing energy data statistics, most of these are designed as “one size fits all” solutions aimed at automating energy data visualization for the general public. However, such solutions frequently fail to take into account the diverse cultural and social practices of local communities (Berkovsky et al., 2015; Irizar-Arrieta et al., 2018; Wickramathilaka et al., 2025). This oversight can result in inefficient or, in some cases, inappropriate systems that do not adequately meet local needs.
The early interviews and workshop studies were primarily focused on understanding energy consumer practices and their visualization priorities, especially during periods of price hikes. Previous studies have also identified various design elements of energy interface that are relevant to rural energy consumers based on their practices. This paper builds on these findings by employing a user-centered approach that involves experts and engineers to address the challenge of identifying suitable interface design elements for different types of energy users. The experts will evaluate various design elements of the energy user interface from two distinct perspectives, which correspond to the two groups of consumers identified through end-user interviews in existing literature.
The research first question (RQ1) analyzes design principles from the consumer’s perspective. The second research question (RQ2) addresses the developer’s perspective. Together, these questions aim to understand the relationship between user requirements and developer insights in the design of energy interfaces.
RQ1: What design principles and software features are most suitable for different demographic groups based on their unique needs?
RQ2: What design elements do software developers and engineers find most appropriate for energy interfaces?
While previous research has utilized the AHP framework for user interface design, this study provides a novel technical contribution by specifically applying AHP to reconcile the differing priorities of rural energy consumers in cold climates with those of software engineers. Unlike generic AHP interface evaluations, this research synthesizes prior qualitative behavioral data with expert pairwise comparisons to generate highly specific, context-aware design choices for two distinct consumer profiles (tech-savvy and non-affluent).
The paper is structured into several sections. The literature review explores energy interfaces and data visualization from the available perspectives. Following this, the paper highlights the importance of decision-making for energy consumers, focusing on user-centered design and co-design activities, such as the primary method used for decision making, the Analytic Hierarchy Process (AHP) analysis. The sections on research setup and findings provide a detailed account of the progress and results of the study methods. Finally, the discussion and conclusion summarize the outcomes of the study.
Literature review
Energy interface is a user interface designed specifically for energy consumers, showing the visualization of energy data. User interface success relies on engaging users and being user-centric (Irizar-Arrieta & Casado-Mansilla, 2017), as it highlights the necessity for prioritizing specific user needs and preferences, which is hard to achieve without a user-centered design approach (Fortmann & Glanert, 2019). This involves gathering feedback from potential users to ensure the interface aligns with their expectations. Additionally, continuous prototype testing plays a crucial role in enhancing the user experience (Escanillan-Galera & Vilela-Malabanan, 2019). By iterating on design based on user feedback, developers can refine the interface, address usability issues, and ultimately empower consumers with better control over their energy data visualization.
Energy consumers living in Finnish urban and Finnish rural areas have specific differences in their energy usage. As a country with a cold climate, the rural consumers often use energy differently than their urban counterparts due to variations in housing types, available heating infrastructure, and lifestyle choices (Juntunen & Asikainen, 2023). For instance, rural residents frequently rely on oil and wood for space and water heating. In contrast, urban consumers typically have access to centralized heating systems provided by municipalities and hot water, which are often more affordable or, in some cases, may be included in the monthly rent (Finnish district heating year 2006, 2007). The rural households lack centralized heating; they tend to be more self-reliant for their water and space heating needs. This independence often leads them to invest in alternative energy sources, such as solar power with battery storage, as they have the available space around their houses and also more motivation to pursue these options than people living in limited living spaces.
As early research has shown that the energy consumption behavior is clearly reflected in energy data visualization (Qureshi et al., 2025). Consumers with access to city heating are less inclined to search for cheaper energy contracts or to monitor when energy prices are low. For those living in urban areas, the lack of incentive to invest time in searching for savings often results in minimal financial benefit. In contrast, consumers in rural areas are more motivated, as even small savings can accumulate to a significant amount over time. In our interview study, participants explained how even a few cents lower in energy costs can lead to substantial savings by the end of the winter season.
Prior studies on energy interfaces have primarily focused on standardizing design for general populations, often relying on end-user Interviews, and surveys. For example, highlighting user diversity in rural Finnish environments, those previous studies do not fully address the unique infrastructural constraints of rural environments. Previous research focuses on the usability of mobile energy apps but lacks a rigorous, mathematically weighted evaluation of conflicting design priorities. This study fills this gap by employing AHP to formally quantify and compare these distinct design elements from an expert panel’s perspective, moving beyond qualitative surveys to structured decision-making.
One of the structured methods used to organize and analyze complex decisions is the AHP, or the Analytic Hierarchy Process, developed by Thomas L. Saaty in the 1970s, this technique combines principles from mathematics and psychology (Improta et al., 2019; Ramík, 2020; Xiulin & Dawei, 2014). It is a multi-criteria decision-making tool that simplifies complex decisions by breaking them down into smaller, more manageable parts and then applying different comparisons before synthesizing the results based on ranks and priorities (Gasparotti & Domnisoru, 2020; Nonaka et al., 2008). The comparison can be, for example, for selecting something, evaluating, cost-benefit analysis, priority and ranking and decision making in general; the method can also be used as sole tool or it can be combined with other methods, such as fuzzy set theory or statistics (Akram & Adeel, 2023).
The user interface for energy data visualization serves as a crucial medium between energy consumers and providers. It relies on a visual design grounded in human factors engineering to enhance interface design (de Souza Santos & de Almeida Neris, 2015), prioritizing clarity and convenience while also aligning with local culture and human emotions. This approach aims to make user interactions as easy and natural as possible by considering users’ needs and preferences throughout the design process (Kheder, 2023; Xu, 2023).
Research method and setup
The process and steps taken to our methodology are illustrated in
Figure 1 below.
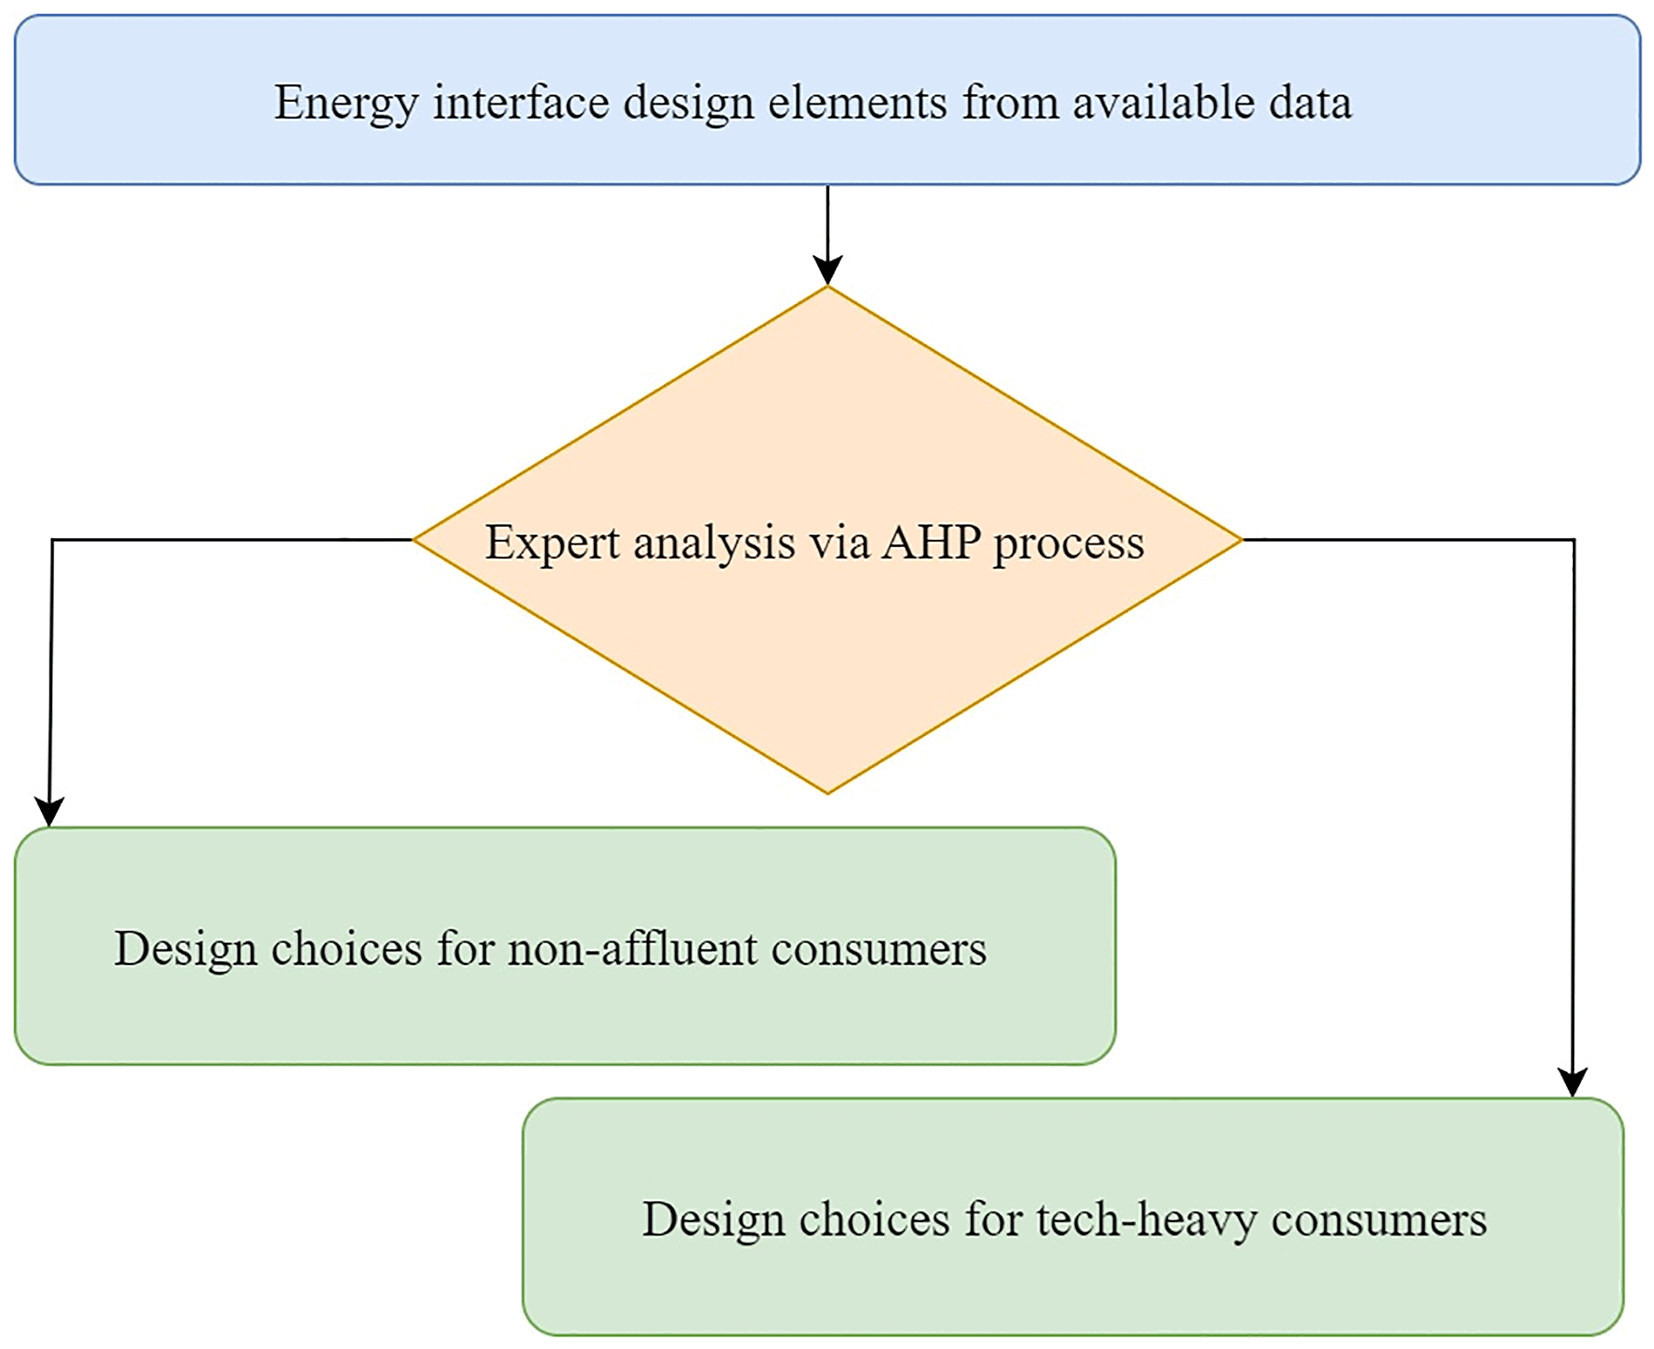
Figure 1. Three steps of the study in different colors.
Research method
Previous studies and literature reviews have examined energy data visualization behaviors among consumers in rural areas, highlighting their priorities regarding energy usage and price monitoring (Qureshi et al., 2024). They have also focused on various types of energy consumption, such as heating and household usage. While considerable data has been collected from previous research, showing the design requirements of energy consumers. A significant aspect of research was lacking, which is the expert’s perspective on interface design elements and feedback on the integration of different elements into energy interface, such as engagement, usability, and functionality from software engineering perspective.
The criteria used to build the AHP hierarchy were extracted from foundational datasets gathered in previous peer-reviewed studies targeting the exact demographic of this research. The validity and consistency of these datasets were ensured through rigorous qualitative methodologies, including thematic analysis of semi-structured interviews with rural energy consumers. Because this prior data successfully saturated the core behavioral themes, for example, identifying the energy profiles of consumers, including the ‘tech-savvy’ and ‘non-affluent’ consumers. These studies provide a grounded basis for establishing the AHP evaluation criteria in this study.
In this study we used the decision-making process to evaluate these findings by including insights from experts, software developers, electrical engineers, and energy consumers. Central step in our methodology is the analysis process using the Analytic Hierarchy Process (AHP) framework which is a structured decision-making method that helps break down complex problems into a hierarchy of goals for conducting pairwise comparison (Ramík, 2020). This approach simplifies decision-making by converting subjective judgments into a structured format and using mathematical calculations. The outcome is a consensus-based, prioritized solution (Xiulin & Dawei, 2014).
Research has shown that the Analytic Hierarchy Process (AHP) is an effective tool for selecting design options in user interface design (Arango et al., 2025; Yamada et al., 2009). The AHP framework has been used to facilitate group decision-making, recognizing the value of collective wisdom for improved outcomes (Lee & Jalao, 2017). Compared to other frameworks, AHP has been evaluated alongside Data Envelopment Analysis (DEA) in the context of benefit-cost analysis, highlighting the potential trade-offs between the two methods (Tone, 2016). It enables decision-makers to quantify both subjective human judgments and objective evaluations (2023). This makes it a widely accepted and reliable method for calculating the weights of attributes in the decision-making environment. In our case, it facilitates the participation of energy consumers and software designers, empowering them to make informed and effective decisions.
There are various AHP tools available across multiple platforms, including web-based AHP systems such as AHP-OS which also used in this study, (Goepel, 2018). These tools offer detailed analyses, support group input, facilitate consensus calculations, and enable sensitivity analysis. This enhances the accessibility and usability of AHP, making it valuable for research purposes. To ensure methodological transparency and avoid a ‘black box’ reliance on the AHP-OS software, a manual verification step was introduced. A sample of the pairwise comparison matrices (specifically the Level 1 primary criteria) was exported and the principal and consistency ratios were manually recalculated using standard spreadsheet software. This cross-validation confirmed that the software’s algorithmic outputs perfectly aligned with traditional AHP mathematical derivations.
In this study we structured the problem as a hierarchy, as per the AHP analysis framework requirements, using the design elements of the energy interface that were identified in data from previous studies. The criteria and sub-criteria populating the AHP hierarchy were not arbitrarily chosen; they were derived through a rigorous thematic extraction process based on existing empirical data (Qureshi et al., 2024, 2025). The most frequently cited interface elements, consumer discomfort points, and behavioral preferences identified in the qualitative transcripts of rural energy consumers were categorized. These themes were then systematically mapped to the Level 1 (e.g., Interactivity, Features) and Level 2 (e.g., Gamification, Smart Devices) criteria to ensure the AHP model was entirely grounded in validated end-user requirements.
The hierarchical table divides design elements into different categories and sub-categories, serving as the basis for subsequent analysis by the AHP framework (see
Table 1 below). At the top level, designated as Level 0, contains the main categories listed as “Interactivity, Interface, Features, Limitations, and Demographics.” Level 1 consists of the sub-criteria, which are divided into multiple sub-categories. At Level 3, each variable from Level 2 has been further broken down into sub-criteria. For instance, the Usability criterion includes sub-criteria such as “clear prompts” and “error prevention.” Similarly, the other Level 2 criteria also have their respective sub-criteria, as shown in
Table 1 below.
Table 1. Design elements of energy user interface.
| MAIN LEVEL |
SUB LEVEL 1 | SUB LEVEL 2 |
|---|
| INTERACTIVITY
| Gamefulness | Gamification Serious games |
| Game play | Notifications Challenges Game storyline |
| Smart devices | IoT Smart meter |
| Passive | Leaderboards Intrinsic motivation Extrinsic motivation Progress sharing Rewards |
| INTERFACES
| Smart devices | TV Mobile Evs |
| Web | Internet Apps/Applications |
| Broadcast | Tv Radio |
| FEATURES
| Customizations | Consumer data Billing information Energy consumption |
| Energy statistics | Live energy data Solar energy production Feedback on Energy Current bill |
| LIMITATIONS
| Cost | App development Continue development |
| Complexity | Meeting consumer demands Integrating devices |
| DEMOGRAPHICS
| Human behavior | Changing human behavior Different energy contracts |
| Culture differences | Different energy profiles Prioritizing some energy usage |
The hierarchical structure of the AHP model was directly developed to address the study’s research questions. To answer RQ1 (consumer demographic needs), the hierarchy includes criteria such as ‘Interactivity,’ ‘Interfaces,’ and ‘Features,’ which capture the end-user’s desired functionalities and engagement preferences. To address RQ2 (developer perspectives), the ‘Limitations’ and ‘Demographics’ nodes were integrated to account for structural feasibility, such as development costs and integration difficulties.
Table 1 outlines how these dual perspectives were synthesized into a single, cohesive decision model.
The above-entioned table served as the basis for subsequent analysis, fourteen (14) experts were invited to participate in the decision-making process. Each participant contributed their opinions through pairwise comparisons and assigned a weight on a scale from 1 to 9 for each pair, reflecting their views. Verbally informed consent and data processing permission were obtained, since all members of the expert panel were employees of LUT University at the time of writing the paper it was not required to have ethical approval, the Extended data contains confirmation from the LUT Ethics Committee (see extended data, confirmation from the LUT Ethics).
No manual matrix calculation was carried out, only the web based AHP analysis framework, AHP-OS (Goepel, 2018) was used to calculate steps in the process. This process resulted in a global priority score for each alternative, combining statistical data with personal preferences to yield a clear, mathematically derived answer.
Mathematical Formulation of the AHP Model
While the AHP-OS software was utilized for computation, the underlying hierarchical decision model relies on standard AHP mathematical principles. The expert judgments are structured into a pairwise comparison matrix A of size n × n:
where aij represents the relative importance of criteria i over criteria j, and adheres to the reciprocal rule aji = 1/aij.
To derive the global priorities (weights), the principal eigenvector w is calculated by solving the eigenvalue problem:
where λmax is the maximum eigenvalue of matrix A. Finally, to ensure the reliability of the expert judgments, the Consistency Index (CI) and Consistency Ratio (CR) are computed:
where RI is the Random Index value dependent on the matrix size n. This mathematical structure ensures that the qualitative expert opinions are rigorously translated into quantitative weights.
Because this study involved a panel of fourteen experts, it was necessary to synthesize their individual evaluations into a single consensus model. The aggregation of multiple expert judgments was conducted using the Aggregation of Individual Judgments (AIJ) approach. Specifically, the AHP-OS software calculated the geometric mean of the individual pairwise comparisons to form a single, aggregated consensus matrix for each consumer profile. The geometric mean is the mathematically appropriate method for AHP group decision-making, as it preserves the reciprocal properties of the comparison matrices and prevents extreme outlier judgments from skewing the final priorities.
Once the local priorities are established for each sub-criterion, the global priorities are computed to determine the overall weight of each design element in relation to the primary goal. This is achieved by multiplying the local weight of the sub-criterion by the global weight of its parent criterion in the hierarchy. This hierarchical weighting ensures that the final percentage scores accurately reflect both the micro-level comparisons and the macro-level category importance.
Research setup
The workshop was organized with the primary objectives of facilitating problem-solving, encouraging brainstorming, and facilitating decision-making activities. Within this framework, the workshop featured a singular yet significant Analytic Hierarchy Process (AHP) activity, during which participants engaged in pairwise comparisons to evaluate various criteria. Before the workshop activity, fourteen experts, including both in-person and those joining online, were selected through convenience sampling. This panel of experts received an introduction to the AHP web-based software, and how to navigate the system and effectively provide their evaluations, also the link for login was provided for each participant. The panel consists of the following experts, and this diverse group brought a range of expertise to the workshop activity.
• A professor of software engineering specializing in community software.
• A software engineering professional with a Master of Science (M.Sc.) degree.
• Two researchers focused on energy networks and markets.
• A researcher studying energy interactions.
• A software engineering researcher with an emphasis on ethics in games.
While a sample size of fourteen participants might be considered small for traditional statistical generalization, it is highly appropriate and robust for Multi-Criteria Decision Making (MCDM) frameworks such as AHP. Unlike large-scale population surveys, AHP relies on the deep, qualitative insights of qualified domain experts. Existing literature on AHP methodology establishes that expert panels typically ranging from 5 to 15 individuals are sufficient to achieve a reliable consensus, as the focus is on the consistency and quality of the pairwise comparisons rather than statistical volume.
Each participant contributed their opinions through pairwise comparisons and assigned a weight on a scale from 1 to 9 for each pair, reflecting their views. The essence of the AHP is the comparison. If we have a simple case of three options A, B and C, the experts compare each option against each other. A to B, A to C and B to C. If they are on the same level the value is 1 for both. If one option is more important in some way it gets a higher value. Usually 3, 5, 7 or 9, but also even numbers can be used if the jump, for example, from 3 to 5 is considered too high. 9 means absolute importance. One side gets a value between 1 and 9 and the opposite side gets then the inverted value, for example 1/5, based on the comparisons. If the weights for different options are not equal, the eigenvectors can be multiplied by the weights of the criteria. In the end there is 1xN eigenvector giving the final values for the comparison. As the sum of values in eigenvector is 1, the numbers can be easily transformed into percentage values. With a consistency ratio and consistency index it is also possible to check whether the judgment is valid (ALONSO & LAMATA, 2006).
While the session was initially scheduled to last one hour, the engaging discussions and the feedback resulted in the activity extending to approximately one and a half hours. Participants took the time to spend on their analyses, ensuring a thorough comparison. At the conclusion of the workshop, the results of the AHP activity were presented to all participants, providing an opportunity for reflection. This closing segment aimed to consolidate the insights gained and enhance collective understanding among the group. The data available in the online repository can be imported to recreate the project and can also be used for analyzing the results (Qureshi, 2025). The data has been anonymized, with participants’ names replaced by identifiers ranging from PPA to PPQ, where “PP” stands for project participants.
Findings
Current study is about the energy data visualization preferences of rural residents in the East Karelia region of Finland. The study used data collected from previous studies in the same geographical area. This existing data offers various viewpoints from energy consumers, gathered through multiple methods, and identifies two main types of consumers. We synthesized early findings by aggregating the opinions of experts and consumers within a hierarchical structure and utilizing the Analytic Hierarchy Process (AHP) framework. Previous studies also highlighted different design elements of energy interfaces and identified two consumer categories: “non-affluent consumers” and “non-tech-savvy, highly impacted” energy consumers. AHP analyzed both perspectives using a panel of experts to conclude the opinion weights for each available option, based on the identified design elements of the energy interface.
To ensure the reliability of the expert evaluations, the Consistency Ratio (CR) was calculated for all pairwise comparison matrices. In standard AHP methodology, a CR threshold of less than 0.1 (10%) is considered acceptable, indicating logical consistency in human judgment. During the workshop, the AHP-OS platform dynamically calculated the CR for participants. If an expert’s initial comparisons yielded a CR exceeding the 0.1 threshold, they were prompted by the system to review and adjust their decisions (judgments) before final submission. The final aggregated consistency ratios for the primary matrices across consumer profiles remained well below the 0.1 threshold, confirming the robust reliability of the dataset.
Figure 2 below shows outcome as design choices for non-affluent energy consumers, a three-level hierarchy table showing the relative importance rated by experts. For example, the weight given to the engagement compared to functionality, and indications which design elements should be prioritized, for example, the preference for a mobile device over a web interface.
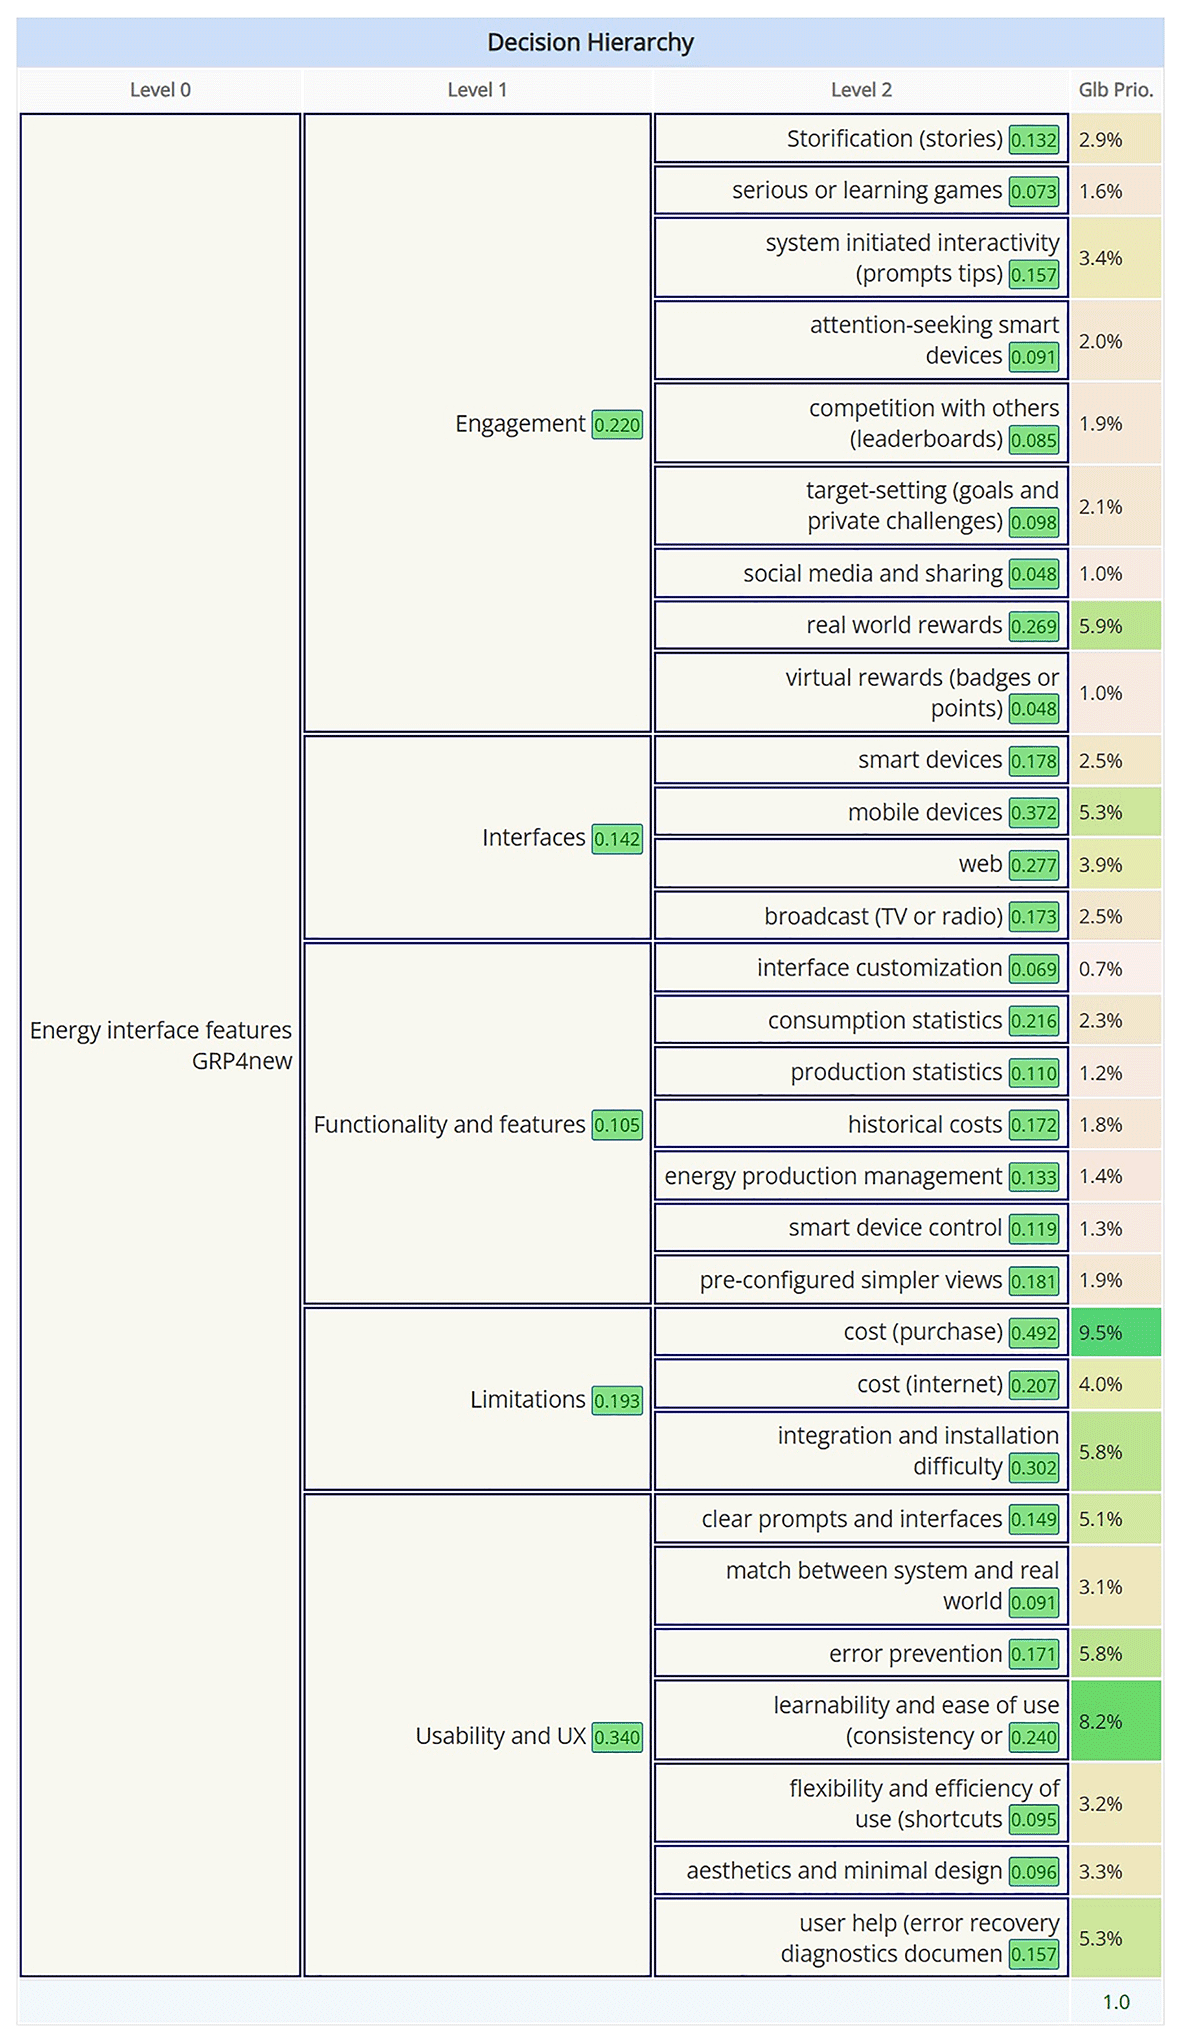
Figure 2. Percentile rating by experts for energy interface design elements.
To conclude the opinion on design elements, the study was conducted on two rounds, with the first round, the expert focused on the consumer with a “non-affluent” background, while in the second round, experts viewed design elements from the “tech-savvy” energy consumers’ point of view.
Figure 3 below shows the result of global priorities from the “non-affluent” consumers’ point of view.
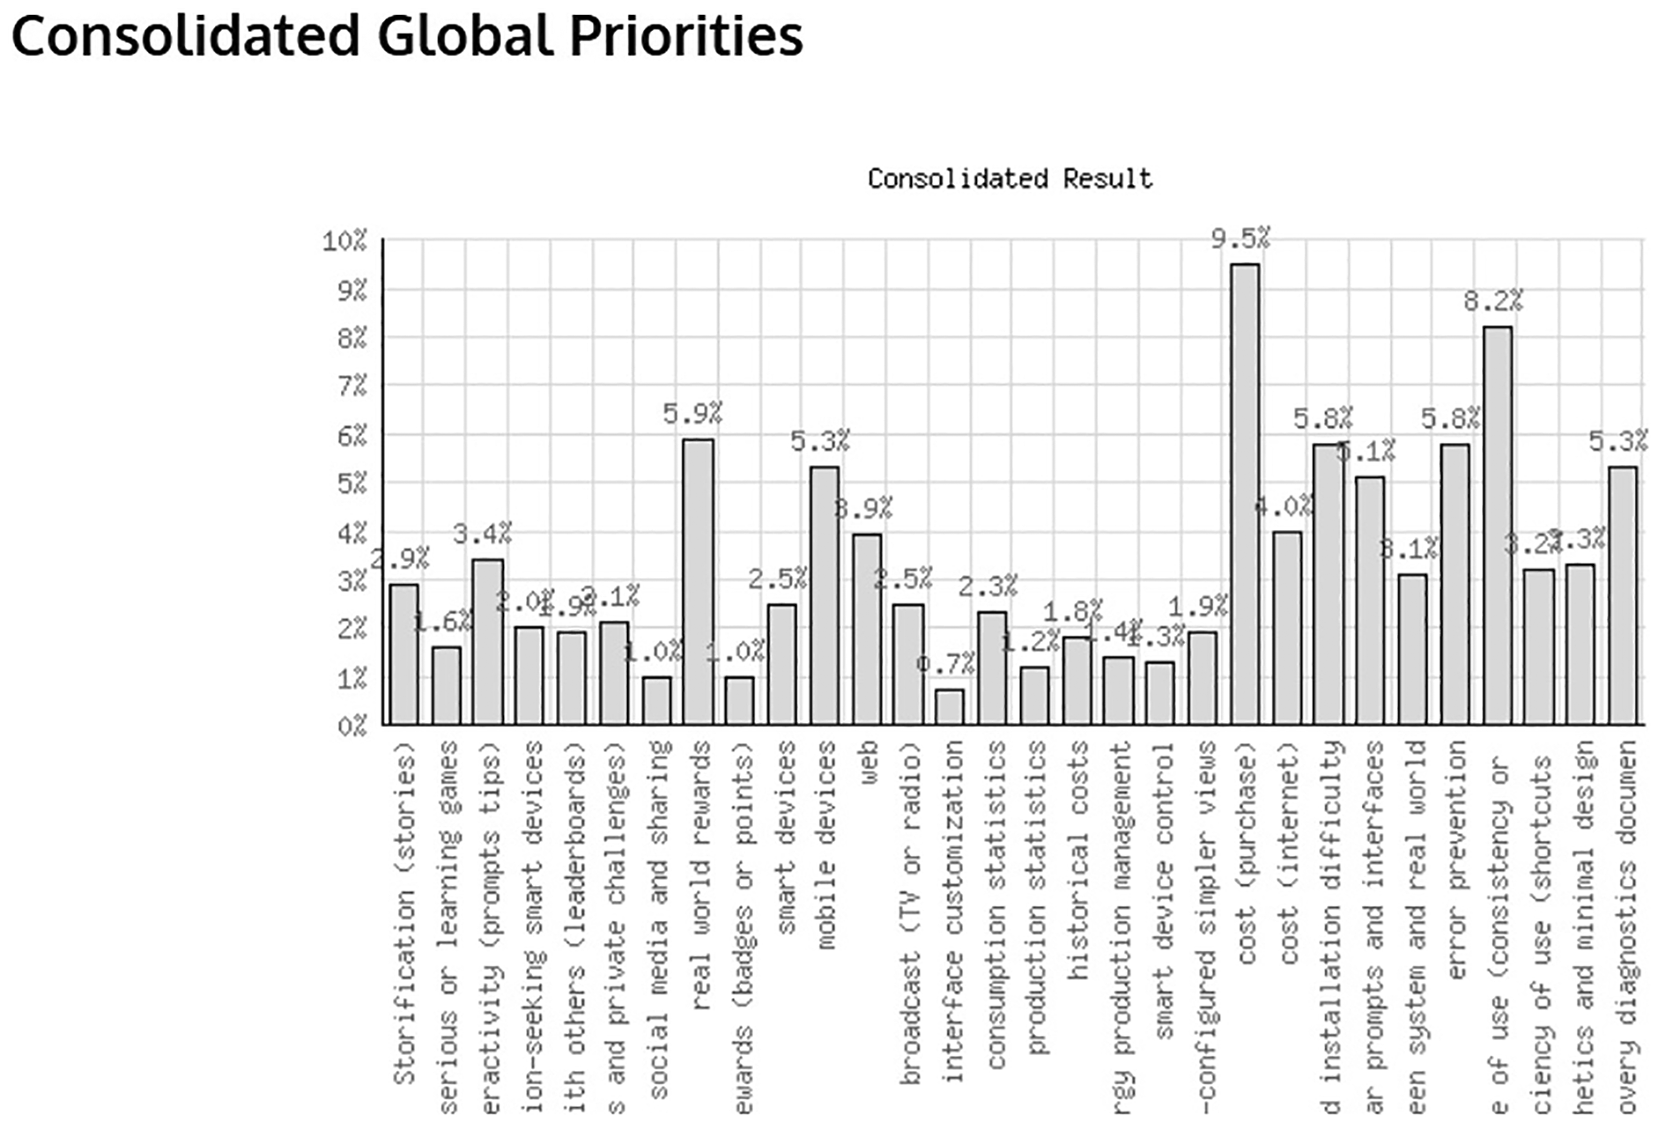
Figure 3. Energy interface design elements for non-affluent.
The evaluation has provided valuable insights that support the study’s main ideas. For experts on non-affluent consumers, considering the importance of finance, ease of use, and low purchase cost emerged as critical factors influencing their preferences and decision-making. This underscores the importance of offering affordable and user-friendly options for the rural demographic. In contrast, experts’ opinion on tech-savvy and affluent background energy consumers is a strong need for advanced technological features, particularly in mobile devices and smart home integration. Their priorities reflect a desire for seamless connectivity and the latest technological advancements to enhance their everyday lives (see
Figure 4 above). These findings highlight the distinct needs and values of rural area energy consumers from an expert perspective.
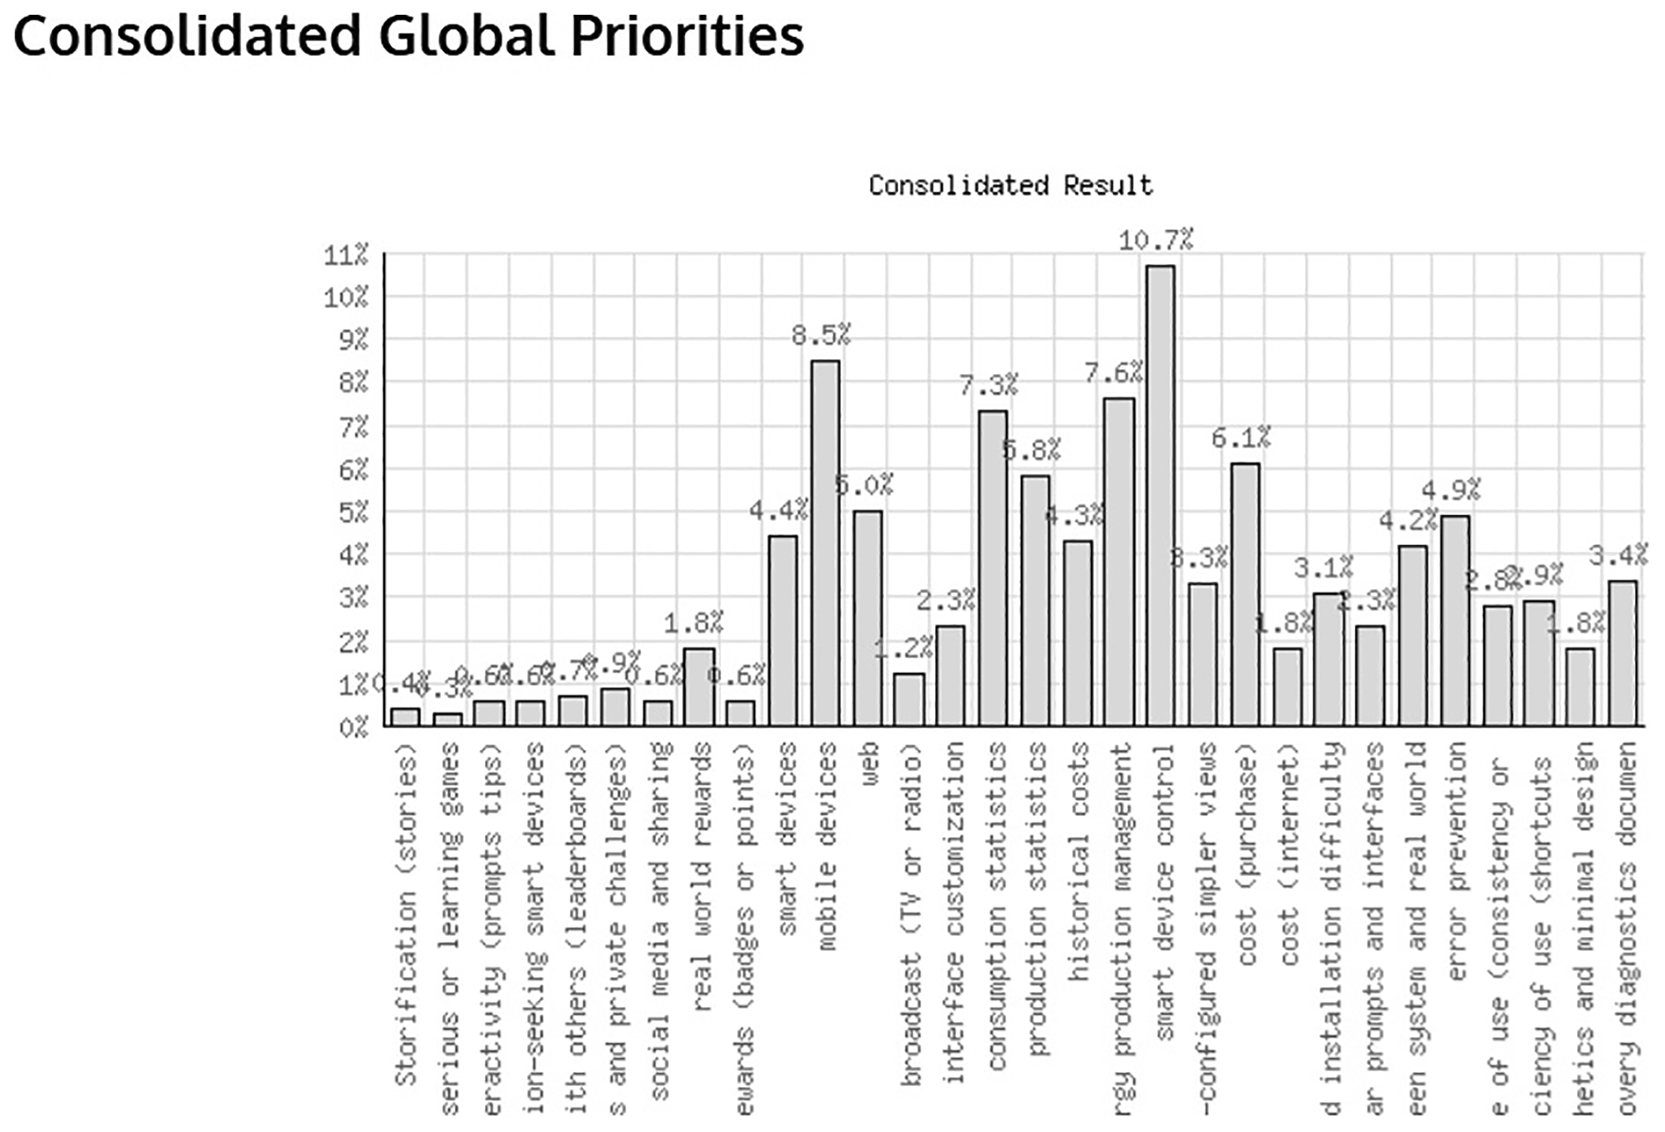
Figure 4. Tech-savvy approach on energy interface design elements.
Sensitivity Analysis and Model Robustness
To evaluate the stability and robustness of the decision-making model, a sensitivity analysis was conducted using the AHP-OS platform. By incrementally adjusting the weights of the primary Level 1 criteria (e.g., simulating a shift in the importance of ‘Limitations’ or ‘Usability’), we observed the resulting impact on the global priorities of the Level 3 design choices. The analysis revealed that the highest-ranking alternatives such as, the preference for mobile device platforms and the prioritization of purchase cost have been remained stable across minor weight fluctuations. No significant rank reversals occurred among the top design choices, confirming that the study’s conclusions are robust and not overly sensitive to slight variations in expert judgment.
To evaluate the stability and robustness of the rankings under different weight scenarios, a sensitivity analysis was conducted using the AHP-OS platform. By incrementally adjusting the weights of the primary Level 1 criteria (e.g., simulating a shift in the baseline importance of ‘Limitations’ or ‘Usability’), we observed the resulting impact on the global priorities of the design choices. The analysis revealed that the highest-ranking alternatives specifically the preference for mobile device platforms and the prioritization of purchase cost remained stable across these varying weight scenarios. No significant rank reversals occurred among the top-tier design choices, confirming that the model’s conclusions are robust and not overly sensitive to slight variations in expert judgment.
Discussion
The aim of this study was to create a structured approach for understanding the data generated by previous research on energy interface design. Specifically, it focused on consumer preferences in energy data visualization, analyzing their choices and the reasons behind those choices, such as different energy profiles and heating needs. Our analysis was conducted from the perspectives of engineers, software developers, and experts, who considered user interface elements, their significance, and usability for energy consumers. As energy consumers themselves and residents of the same area with similar ethical backgrounds, their perspectives also reflect those of the energy consumers.
Given the diverse opinions among energy consumers in rural areas regarding various aspects of energy interface design, the results of this analysis offer valuable guidance to developers in creating effective energy interfaces. The Analytic Hierarchy Process (AHP) framework combines mathematical and psychological principles by integrating human input into the decision-making process. This results in weighted opinions on suitable elements for energy interfaces that are not only visually appealing but also enhance usability.
Design choices of rural and urban energy consumers
To address the first research question, RQ1, “What design principles and software features are most suitable for various demographic groups based on their unique needs?”, we examined the related data provided by earlier studies conducted in the same region. We identified the recommended design elements that can be used to create an energy interface and developed a hierarchical structure of these design elements. The hierarchical structure is divided into Interactivity, Interface, Features, Limitations, and Demographics categories. Each of these categories then includes sub-categories and is further divided into design elements of energy interface based on preferred data visualization. This layout not only serves as a foundation for further analysis but also categorizes consumers’ energy data visualization.
The visualization preferences of energy data also reflect consumers’ energy consumption behaviors. For example, consumers with access to city heating are less inclined to search for cheaper energy, as their main electricity consumption is already covered by heating. To those who rely on electricity for heating, a small amount makes a big difference. Similarly, those who live in urban areas face the lack of incentive to invest time in searching for savings, which results in minimal financial benefit. In contrast, consumers in rural areas are more motivated, as even small savings can accumulate to a significant amount over time. In our interview study, participants explained how even a few cents lower energy costs can lead to substantial savings by the end of the winter season.
Energy consumption patterns in Finland vary between urban and rural residents due to their different living environments. These factors also influence their preferences for software features and design elements in energy data visualization, with their choice of energy-related information being heavily influenced by the local cultural environment. For example, in rural areas, households often depend on traditional energy sources, such as oil and wood, since they do not have centralized heating systems. This isolation promotes self-sufficiency and encourages the exploration of alternative energy solutions, like solar power and battery storage, especially because rural homes typically have more space available. This lifestyle also impacts their energy data visualization in a way that they tend to look for cheap energy contracts; for them, the most important element of the energy interface can be today’s electricity price.
Urban residents, on the other hand, benefit from centralized heating systems provided by municipalities, which offer affordable and convenient heating and hot water services, often included in their rent. This arrangement allows them to focus less on energy costs. In contrast, rural consumers prioritize affordability in their energy choices and tend to concentrate on financial aspects. Some urban consumers, who are more inclined toward innovation, often explore advanced energy technologies like geothermal heating, emphasizing efficiency and sustainability instead of merely aiming to save energy; they seek innovative solutions. Tech-savvy and urban energy consumers see energy data differently, and their energy data preferences differ from those of rural residents. These energy consumers mostly look for advanced integration of IoT devices into the energy interface.
Designing an energy interface requires careful consideration of the unique needs of consumers in rural and urban areas. This includes understanding their demographics, the types of energy contracts they hold, and their specific heating systems for both water and space. An effective energy interface that blends data visualization and user-centric design principles with the primary goal of empowering energy consumers and local culture by focusing on what is most important to them, rather than simply displaying energy data.
Design elements in energy applications
RQ2 was more focused on the fact that designing an energy interface requires careful consideration of the unique needs of consumers in rural areas. To answer this question, we used a co-creation activity using the AHP framework, where consumers and experts collaborate to determine which elements best suit their specific needs. The result shows that preferences for energy interface design elements fall into two main categories. Both correspond to two main consumer groups in our target rural area. The first group tends to value financial elements, including cost reduction and incentives. They focus on design elements showing financial gains, while networking, progress sharing, and leaderboard competitions are lower priorities for them. In contrast, the second group recommends prioritizing the use of technologies. There is, however, some agreement between both sides. Both agree that energy interface design should prioritize the delivery of energy-related data. Both also value interface customization, matching the energy consumers’ profile and the inclusion of historical energy data, as well as ease of use.
Key findings can be categorized according to the Interactivity, Interfaces and Features. The analysis reveals significant differences in opinions across these main categories.
•
Interactivity: The energy-saving perspective emphasizes the importance of incentives, such as real-world rewards, with a weight of 5.9%. Tech heavy view also shows importance on real world incentive with the weight of 1.8%.
•
Interface platform: Both energy-saving and tech-heavy viewpoints place some emphasis on mobile devices as platforms for energy interfaces, with opinion weights of 5.3% and 8.5%, respectively. This is in comparison to other platforms like the Web or Television which was quite low in both opinions.
•
Features: The tech-heavy opinion favors the use of features like smart device control, which received the highest opinion weight at 10.7%. Conversely, the non-affluent consumer want features such as consumption statistics (7.3%) and historical cost (4.3%).
The table below outlines the design elements and opinion analysis from two perspectives, along with design choices from the software engineering viewpoint (see
Table 2). The first column, “Design Elements,” categorizes the list based on existing data regarding energy data visualization. The second column is split into two sub columns, representing the perspectives of two different energy consumer groups. The third column presents the design choices from the developer’s perspective, intended for use in creating energy interface designs.
Table 2. Summarizing the result of AHP analysis.
| Design elements | AHP Opinions | Design choices |
|---|
|
Tech Heavy |
Non-affluent
| |
|---|
| INTERACTIVITY
| Smart devices | | Integrated control of other IoT devices, live energy statistics, EV charging status |
| Energy statistics | | Energy production in Kwh from solar panel or other means, transfer to grid statistics in Kw |
| | Incentives | Energy saving rewards, bonuses options such as free hours, energy saving programs, cheap and expensive electricity hours alerts |
| PLATFORM
| Mobile device | Mobile devices | App for mobile devices, internet connectivity, simplicity in use, easy to use interface, easy to understand, clear visuals |
| FEATURES
| Customization | | Energy profiles based on individual preferences, prompts to configure dynamic energy interface |
| | Historical cost | Prompt displaying current energy price, future energy price, statistics charts, energy consumption prompts, current bill
|
Rural area energy consumers in our study, mainly divided into two categories based on their approach to energy monitoring. The first group emphasizes the importance of affordable solutions and highlights the financial benefits of energy data, particularly in terms of cost savings, such as different prompts displayed in the energy interface about current price and incentives. The second group advocates technical solutions aimed at reducing expenses, like the use of solar panels, including a strong understanding of advanced technologies, and prefers options that grant them greater control over energy management through an energy interface. Thus, the second group advocates a more technical and management-oriented approach, while the first group takes a more traditional view, seeking financial incentives.
Design recommendations for the first group of energy consumers require energy application to understand their preferences, for instance, doing things such as scheduling laundry, baking, or charging electric vehicles based on expected energy price. The better the application facilitates achieving these goals, the more effective it will be for example, connects users to current energy prices and provides control over their energy spending. This will enhance their ability to respond significantly as some people actively change their energy consumption routines, while others modify their usage during periods of lower prices. In both scenarios, consumers prefer to monitor the market, particularly future energy prices, as this helps them adjust their energy consumption.
Design recommendations for tech-savvy energy consumers, who prioritize the integration of their modern devices, include the features such as the ability to control their energy production and connect with other IoT devices. Many consumers appreciate the possibility of integrating advanced features that allow them to enjoy the benefits most important to them, such as monitoring energy consumption for specific appliances or parts of their homes. The level of concern and understanding may vary greatly among this group when it comes to selecting an energy interface. For some consumers, it can be a “make or break” factor for their satisfaction if the energy application cannot control IoT devices; for others, it may not be very critical if the energy application does not provide an EV charging function.
Regardless of whether consumers are focused on cost-saving measures or technological integration, three core factors remain crucial for all rural area energy consumers. The first is the ease of use, including how straightforward the energy interface is to operate. The second is the functionality of how easily consumers can access the necessary information, which matches their energy profiles. The third is the reliability factor involving the energy application’s ability to operate consistently and without failure. These consumer preferences are essential for their energy data visualization, and an important factor to note is that for manufacturers and utility companies, providing seamless, reliable, and valuable integrations is no longer an optional feature; it has become a critical competitive advantage.
Conclusions
The study utilized the Analytic Hierarchy Process (AHP) framework, engaging a panel of experts to evaluate the design element of energy interface. The study also presented a three-level design choices table, which was created from previously available data. The panel of experts used that information for analysis and evaluated various user interface elements of the energy interface for rural populations. This includes the essential priorities of energy consumers for energy data visualization. The expert also looked into other related factors impacting rural area energy consumers, including their contracts, heating systems, local culture, and norms. The result revealed key insights into points such as energy consumers’ affordability and usability. Also, consumers’ preference for the use of advanced technologies, particularly with IoT devices and smart home integration.
To engage all stakeholders, this study utilized a user-centric design approach that facilitated collaboration between software engineers and energy experts to ensure that the outcomes addressed the needs of both developers and energy consumers. The primary goal of this research was to highlight the essential components of energy interfaces that not only improve usability but also resonate meaningfully with all stakeholders, including energy consumers and software developers. By shifting from a “we know best” approach to fostering a collaborative partnership. The results highlight the key design elements and provide a design perspective for both energy consumers and developers.
Expert opinion from the local community is not just important but essential when developing software for local energy consumers, as it bridges the critical gap between technological capability and efficacy on cultural elements. Without the opinion input from domain experts, such as electrical engineers, energy consumers, and software developers, the final user interface for energy consumers risk failing to address core challenges like cultural issues and consumer adoption barriers. Expert insight ensures the software is grounded in physical realities and aligns with the energy consumers need, ultimately benefiting the communities they are intended for.
Limitation and future work
The outcome of the study derived from the available data and qualitative judgments from a available number of experts. The amount of available data may influence the results, especially when evaluating and prioritizing multiple criteria, as this process is constrained by both the data and the number of experts involved. Expanding the research area to include a broader demographic could yield more comprehensive qualitative results. However, this limitation creates challenges for the study and restricts the generalizability of the findings to a wider population and different geographic contexts.
Additionally, the expert panel was assembled using convenience sampling from within LUT University. While convenience sampling inherently carries a risk of institutional bias or ‘groupthink,’ this was avoided by ensuring the panel comprised experts from highly distinct and diverse disciplinary backgrounds. As outlined in the methodology, the panel included specialists in community software engineering, energy networks and markets, energy interactions, and researchers, energy consumers. This cross-disciplinary diversity ensured that multiple, sometimes competing, perspectives were represented in the pairwise comparisons. Nevertheless, future studies should aim to include a broader geographic and institutional demographic to validate these findings further.
The study provided design choices for the user interface targeting energy consumers living in rural areas. Using the study’s outcome, software developers can make informed and effective decisions to enhance the user experience. By following the rigorous evaluation and prioritizing user requirements, the study outcome helps in creating designs that better meet not only user needs and preferences but also lead to higher satisfaction for energy providers and developers. Software developers and researchers can use the results as a foundation to explore the topic further, as well as use these results as a basis to delve deeper into the topic and as a reference for related studies.
Ethics approvals
All previous articles in the series1 have publicly available data and written informed consent, followed by the recommendations of TENK (Guidelines for ethical review in human sciences, 2019). This study utilizes publicly available data from the mentioned studies, and the panel members involved are professional researchers employed by LUT, rather than human subjects as defined by TENK. This study does not require ethical approval; the Extended data contains confirmation from the LUT Ethics Committee (see extended data, confirmation from the LUT Ethics).
Data availability
Underlying data
ZENODO: Exported data from the AHP-OS project for the study on recommendations for energy interface design.
https://zenodo.org/records/18046536 (Qureshi, 2025).
The underlying data includes project and result exports in CSV and JSON format for each set. The only modification made is the anonymization of participants’ names, which have been replaced with identifiers ranging from PPA to PPQ. Here, “PP” stands for project participants.
1) Nonsavvy, nonaffluent
2) Techsavvy
Data are available under the terms of the Creative Commons Zero “No Rights reserved” data waiver (CC0 1.0 Public domain dedication).
Extended data
ZENODO: Exported data from the AHP-OS project for the study on recommendations for energy interface design.
https://zenodo.org/records/18046536 (Qureshi, 2025).
The extended data includes a table used for evaluation during the AHP analysis by the expert, and the
1) Table used for evaluation during AHP analysis by the experts.
2) Briefing slides, which guide the AHP process and facilitate the gathering of participants’ consent.
3) Confirmation from the LUT Ethics to Prof Antti Knutas (Co-author in the study).
Data are available under the terms of the Creative Commons Zero “No Rights reserved” data waiver (CC0 1.0 Public domain dedication).
References
- Akram M, Adeel A:Extended PROMETHEE method under multi-polar fuzzy sets.
Stud Fuzziness Soft Comput.
2023; 430: 343–373. Publisher Full Text
- Alonso JA, Lamata MT:Consistency in the analytic hierarchy process: a new approach.
Int J Uncert Fuzz Knowl Based Syst.
2006; 14(4): 445–459. Publisher Full Text
- Arango EAV, Fernandez A, Collazos C:
Prospective user interfaces for decision-making processes in multidimensional agriculture. Agredo-Delgado V, Ruiz PH, Escobar CAM.Communications in Computer and Information Science (CCIS).Cham: Springer Nature Switzerland, 2025;2369. : 173–184. Publisher Full Text
- Berkovsky S, Freyne J, Oinas-Kukkonen H:
Influencing individually: fusing personalization and persuasion.
Wooldridge MJ, Yang Q. IJCAI International Joint Conference on Artificial Intelligence.AAAI Press; 2015; pp. 4153–4157.
- de Souza Santos MC , De Almeida Neris VP:
Toward an analytical method to evaluate emotional responses in human-computer interaction; [A caminho de um método analítico para avaliação de respostas emocionais na interação humano-computador]. Mattos E, Zaina LSA, Kronbauer AH, Boscarioli C, editors.Proceedings of the 14th Brazilian Symposium on Human Factors in Computing Systems (IHC '15).ACM International Conference Proceeding Series.2015. Publisher Full Text
- Escanillan-Galera KMP, Vilela-Malabanan CM:
Evaluating on User Experience and User Interface (UX/UI) of EnerTrApp a mobile web energy monitoring system.Younus A, editor.
Procedia Comput Sci.2019;161. : 1225–1232. Publisher Full Text
- Finnish district heating year 2006:Euroheat Power.2007; 4(3): 24–25.
- Fortmann J, Glanert F:Human-Centered design in the energy turnaround project enera - it pays to go off the beaten track!
I-Com.
2019; 18(1): 93–100. Publisher Full Text
- Gasparotti C, Domnisoru L:Decision making in engineering applications based on analytic hierarchy process.
Int Multidiscipl Sci GeoConf Surv Geol Min Ecol Manag, SGEM.2020.
2020; (2.1): 103–110. Publisher Full Text
- Goepel KD:Implementation of an online software tool for the Analytic Hierarchy Process (AHP-OS).
Int J Anal Hier Process.
2018; 10(3): 469–487. Publisher Full Text
- Guidelines for Ethical Review in Human Sciences:
Finnish National Board on Research Integrity TENK.
2nd ed. 2019. Reference Source
- Improta G, Converso G, Murino T, et al.:Analytic Hierarchy Process (AHP) in Dynamic Configuration as a Tool for Health Technology Assessment (HTA): The Case of Biosensing Optoelectronics in Oncology.
Int J Inf Technol Decis Mak.
2019; 18(5): 1533–1550. Publisher Full Text
- Irizar-Arrieta A, Casado-Mansilla D:
Coping with user diversity: UX informs the design of a digital interface that encourages sustainable behaviour.Blashki K, Rodrigues L, editors. Proceedings of the International Conference on Interfaces and Human Computer Interaction 2017 - Part of the Multi Conference on Computer Science and Information Systems.2017. pp. 185–192. Reference Source
- Irizar-Arrieta A, Casado-Mansilla D, Retegi A:
Accounting for user diversity in the design for sustainable behaviour in smart offices.Rodrigues JJPC, Nižetić S, Patrono L, et al., editors. Proceedings of the 2018 3rd International Conference on Smart and Sustainable Technologies.SpliTech; 2018. Reference Source
- Juntunen V, Asikainen T:Electricity consumption in Finland influenced by climate effects of energetic particle precipitation.
Sci Rep.
2023; 13(1): 20546. PubMed Abstract
| Publisher Full Text
| Free Full Text
- Kheder HA:Human-Computer interaction: enhancing user experience in interactive systems.
Kufa J Eng.
2023; 14(4): 23–41. Publisher Full Text
- Lee K, Jalao ER:
An Analytic Hierarchy Process (AHP) group decision making methodology for imprecise preferences.Tallón-Ballesteros AJ, Li KFrontiers in Artificial Intelligence and Applications2017;299. : 203–220. Publisher Full Text
- Nonaka T, Uesugi Y, Hase T:
Design strategy of optimal user interface for each user and system using analytic hierarchy process.
Conference Proceedings - IEEE International Conference on Systems, Man and Cybernetics. IEEE;
2008; pp. 1910–1915.
- Qureshi M:Exported data from the AHP-OS project for the study on recommendations for energy interface design.
Zenodo.
2025. Publisher Full Text
- Qureshi M, Knutas A, Wolff A:
Consumer energy interface use and user behavior analysis during a price hike: a qualitative study. In:2024 Proceedings of the 47th MIPRO ICT and Electronics Convention (MIPRO).IEEE; 2024; pp. 1877–1882. Publisher Full Text
- Qureshi M, Knutas A, Wolff A:
Exploring interface design for energy data visualization: a usability testing workshop.
Proceedings of the 2025 MIPRO 48th ICT and Electronics Convention.2025; 1484–1489. Publisher Full Text
- Ramík J:Applications in decision-making: Analytic Hierarchy Process—AHP revisited.
Lect Notes Econ Math Syst.
2020; 690: 189–211. Publisher Full Text
- Sandberg E, Sneum DM, Trømborg E:Framework conditions for Nordic district heating - similarities and differences, and why Norway sticks out.
Energy.
2018; 149: 105–119. Publisher Full Text
- Tone K:
A comparative study of AHP and DEA.
Advances in DEA Theory and Applications: With Examples in Forecasting Models.John Wiley & Sons, Incorporated; 2016. Publisher Full Text
- Wickramathilaka S, Grundy J, Madampe K, et al.:Adaptive and accessible user interfaces for seniors through model-driven engineering.
Autom Softw Eng.
2025; 32(2): 74. Publisher Full Text
- Xiulin S, Dawei L:
An improvement Analytic Hierarchy Process and its application in teacher evaluation.
Proceedings - 2014 5th International Conference on Intelligent Systems Design and Engineering Applications, ISDEA.2014. .2014; 169–172. Publisher Full Text
- Xu Q:
User interface design.
Multimedia Foundations Core Concepts for Digital Design.2023. Reference Source
- Yamada S, Uesugi Y, Nonaka T, et al.:
Selection of suitable GUI for various controllers using Analytic Hierarchy Process.
Conference Proceedings - IEEE International Conference on Systems, Man and Cybernetics.2009; pp. 239–243. Publisher Full Text







