Safety characteristics
3.4
3.4.1 Explosibility
First, all samples were tested for explosibility according to ISO 80079-20-2 using two 1 kJ ignitors. If an explosion was detected, further tests were conducted to determine explosion parameters according to EN 14034–1/2,53,54 using two 5 kJ ignitors.
The explosibility results for all four dusts are summarized in
Table 5. The results of the round-robin test indicate variability in the classification of dust explosibility among laboratories. MT63 was considered non-explosible by six out of nine laboratories, and MT150 by seven out of nine. MT63reg was classified as non-explosible by only one laboratory, whereas MT150reg was classified as non-explosible by six out of nine laboratories. A comparison of the particle size distributions reported by each laboratory (Table 4) with the corresponding explosibility results (Table 5) did not reveal any clear correlation between the characteristic particle size parameters (d10, d50, d90) and the observed explosion behavior.
Table 5. Explosibility of all four dust samples.
| N. | MT63 | MT150 | MT63reg |
MT150reg |
|---|
| 1 | Explosible | Non-explosible
| Explosible | Non-explosible
|
| 2 | Explosible | Explosible | Explosible | Non-explosible
|
| 3 | Non-explosible
| Non-explosible
| Explosible | Non-explosible
|
| 4 | Non-explosible
| Non-explosible
| Explosible | Non-explosible
|
| 5 | Non-explosible
| Non-explosible
| Explosible | Explosible |
| 6 | Non-explosible
| Non-explosible
| Explosible | Explosible |
| 7 | Explosible | Explosible | Explosible | Explosible |
| 8 | Non-explosible
| Non-explosible
| Explosible | Non-explosible
|
| 9 | Non-explosible
| Non-explosible
| Non-explosible
| Non-explosible
|
The observed variations in explosibility results between laboratories may be attributed to the degrees of freedom in the execution of the tests allowed by the standardized procedures, as described in detail in the methodology section. On the one hand, different concentration ranges were considered for the determinations (e.g., up to 1500 or 2500 g/m3). On the other hand, the initial pressures at which ignition occurred were not always consistent. To overcome the challenge of conveying high-density dust at elevated concentrations (above 1000 g/m3) into the sphere, some laboratories accepted ignition at reduced initial pressures, which may lead to false-negative results. The detailed results of all dust explosion tests conducted by all participating laboratories are provided in the Supplemental Material.
It can be observed that the regenerated samples (MT63reg, MT150reg) showed positive explosion results more frequently than the non-regenerated samples (MT63, MT150). Since only minor differences in particle size distribution were observed, this behavior is more likely associated with differences in particle morphology, as the more porous and flake-like structure increases the specific surface area and thus enhances reactivity.72
3.4.2 Explosion severity
For the cases where an explosion was recorded, the safety characteristics such as the maximum explosion pressure
, the maximum rate of pressure rise
, and the volume-normalized deflagration index
were determined (Tables 6–9).
Table 6. Evaluation of MT63 explosion indices based on data reported by three participants.
Pressure values were rounded to one decimal place, whereas rate of pressure rise values and percentages were rounded to integers.
| Parameter [N. participant] | Mean value ± standard deviation |
Relative standard deviation [%] |
|---|
|
in bar g
| 3.3 ± 0.6 | ±19 |
|
in bar g (Lab 1) | 3.8 ± 0.6 | ±17 |
|
in bar g (Lab 2) | 3.6 ± 0.1 | ±3 |
|
in bar g (Lab 7) | 2.6 ± 0.1 | ±6 |
|
in bar g
| 2.5 ± 0.9 | ±38 |
|
in bar g (Lab 1) | 3.1 ± 0.9 | ±29 |
|
in bar g (Lab 2) | 2.9 ± 0.2 | ±5 |
|
in bar g (Lab 7) | 1.4 ± 0.2 | ±14 |
|
in bar/s
| 26 ± 7 | ±27 |
|
in bar/s (Lab 1) | 26 ± 8 | ±31 |
|
in bar/s (Lab 2) | 19 ± 5 | ±27 |
|
in bar/s (Lab 7) | 33 ± 6 | ±17 |
|
in bar·m/s
| 7 ± 2 | ±29 |
|
in bar·m/s (Lab 1) | 7 ± 2 | ±31 |
|
in bar·m/s (Lab 2) | 5 ± 1 | ±27 |
|
in bar·m/s (Lab 7) | 9 ± 2 | ±17 |
Uncertainty in the results also appeared during the determination of the explosion characteristics. According to the standards, duplicate measurements within one laboratory should agree within 5% for the maximum explosion pressure
, while the reproducibility between laboratories should be within 10%.54 For the deflagration index
or the maximum rate of pressure rise
, standards specify a repeatability and reproducibility of 30%.53 However, as shown in Tables 6–9, the observed deviations partially exceed these limits. It should be emphasized that the particle size distributions of the tested samples were very similar (Table 4) between the laboratories, indicating that the observed differences are unlikely to originate from variations in particle size. A plausible explanation for this behavior lies in the specific combustion characteristics of iron. Iron is often classified as a St 1 Class dust, indicating weak explosibility and typically resulting in poorer reproducibility,49–51 as discussed above.
The standard deviation for the maximum explosion pressure (
) between the laboratories is a lot higher than 10% (Tables 6–9). This can be attributed to the data evaluation procedure specified in both American and European standards, where the correction applied according to Equations (4) and (5) increases the scattering by approximately 41%, potentially leading to higher deviations than actually measured. In addition, the signal-to-noise ratio is inherently low: a typical scattering of 0.5 bar corresponds to a much larger relative deviation when the maximum pressure is 2 bar for weakly reactive iron dust than when it is 10 bar for other commonly tested dusts.
Moreover, it should be noted that the actual pressure increase caused solely by the ignitors (
) is not always exactly 1.6 bar but generally assumed (Equation 5). This phenomenon was described in.73 Laboratories often rely on manual assessment of their ignitors, and the resulting values can deviate; for example, instead of 1.6 bar, values as low as 1.1 bar are reported.73 The scattering of the pressure increase caused solely by the ignitors from one batch to another is about 0.1 bar and has a relatively stronger effect in case of weak explosiveness.74 This re-evaluation contributes to the discrepancies observed between laboratories in terms of
.
For this reason, the row data were additionally processed by the authors and the corresponding
values were included in the Tables 6–9. As can be seen, the standard deviation between laboratories decreases after this re-evaluation. For MT63 and MT150, the standard deviation between laboratories exceeds the acceptable limits, but remains lower than that observed for
. For MT63reg and MT150reg, the deviations between laboratories remain within the acceptable range.
The deviations observed between laboratories can be attributed to the remaining degrees of freedom in the execution of the tests, as described in the methodology section, as well as to specific characteristics of iron dust. In particular, the selection of dust concentrations for testing was not uniform across laboratories. Since the concentration range is not strictly predefined and is adapted based on the occurrence of the first positive explosibility result, different concentration ranges were applied, which influenced the subsequent determination of explosion parameters. In addition, practical limitations related to the injection of high-density dust at elevated concentrations further contributes to these variations.
Tables 6–9 also provide the standard deviation with in individual laboratories. It should be noted that these values were calculated only for laboratories that performed multiple test series. In these cases, the standard deviation was determined based on the maximum values obtained from the individual test series within the same laboratory.
As shown in Tables 6–9, the standard deviation within individual laboratories exceeds the 5% limit in several cases. This indicates that significant variability is present not only between laboratories but also within individual laboratories. Such deviations highlight the influence of the dust injection system and its limited repeatability on the measured results. This effect becomes particularly significant at low pressure levels, where even small absolute deviations (e.g., around 0.1 bar) correspond to relative differences exceeding 5%.
With regard to the differences observed in
, all samples exhibited values that did not exceed 50 bar/s. As shown in Tables 6–9, the standard deviation between laboratories for the rate of pressure rise remains within the acceptable limits for MT63 and MT63reg. For MT150 and MT150reg, however, the deviations reach approximately 39%, which is around 9% above the recommended limit, but not considered critical. At the same time, the deviations within individual laboratories remained within the 30% range in all cases. This is particularly noteworthy, as it indicates a good repeatability of the measurements for the second pressure rise within individual laboratories.
A separate comparison of the deflagration index
was performed; however, as this parameter is directly derived from the rate of pressure rise by applying a scaling factor, a separate discussion does not provide additional insight. The corresponding values are included in Tables 6–9.
Figures 10–19 show the individual experimental results
and
plotted as data points. For improved readability, lines representing the average trend are additionally included, based on the average values at each concentration or on single test results, depending on the data reported by each laboratory.
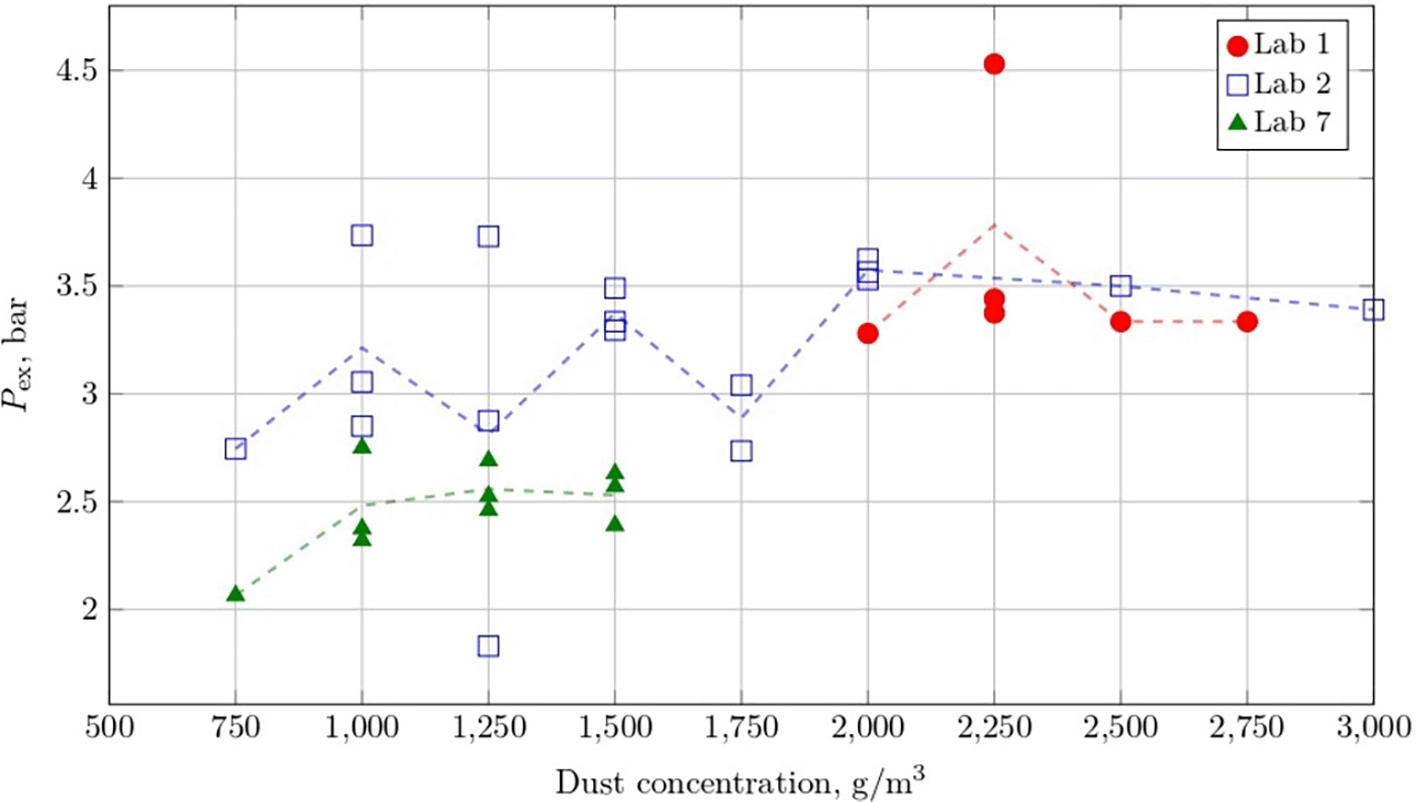
Figure 10. Explosion overpressure
for MT63 as a function of dust concentration measured by Lab. 1, 2, 7.
Based on theoretical considerations, these plots are generally expected to exhibit a curve with a local maximum at a certain dust concentration, after which maximum values should decrease due to the excess thermal mass of unreacted powder.41,75 However, when examining the
–concentration plots obtained in this work, a different behavior can be observed. Instead of a pronounced maximum followed by a decrease, the curves rather show an increase in pressure values followed by a plateau with some fluctuations.
An important aspect in this context to consider is that the maximum explosion pressure for iron-based dust is reported to occur at relatively high dust concentrations (around 2500 g/m3),44 whereas the oxygen available in the 20-L vessel can theoretically oxidize only approximately 660 g/m3 (Fe2O3), 740 g/m3 (Fe3O4), or 990 g/m3 (FeO).
This discrepancy arises because the theoretical stoichiometric concentration assumes that the entire amount of added dust is uniformly dispersed within the 20-L spherical vessel. In reality, this condition is difficult to achieve, especially for dense dusts at high concentrations. This behavior suggests that only a fraction of the nominal dust mass participates in heat absorption. This can be attributed to several factors, including incomplete material injection into the vessel, as well as strongly non-uniform particle dispersion within the sphere. All these aspects contribute to the fact that iron dust exhibits significant deviations in the measured explosibility parameters.
Figures 10 and 11 present the explosion overpressure
and the maximum rate of pressure rise
for MT63 obtained in three laboratories. It should be noted that the selection of dust concentrations for further testing depends on the concentration at which a positive explosion test is obtained using 2 kJ igniters. For example, a positive result was observed at 2000 g/m3 in the first laboratory. Consequently, the first laboratory focused on concentrations above 2000 g/m3, while the seventh laboratory limited its testing to concentrations up to approximately 1500 g/m3. In contrast, the second laboratory investigated a broader range, covering concentrations from 750 to 3000 g/m3. As discussed in the methodology section, testing at such high concentrations is limited by the 20-L apparatus’s injection capacity. Therefore, the differences in the selected concentration ranges for the four powders are due to these practical constraints.
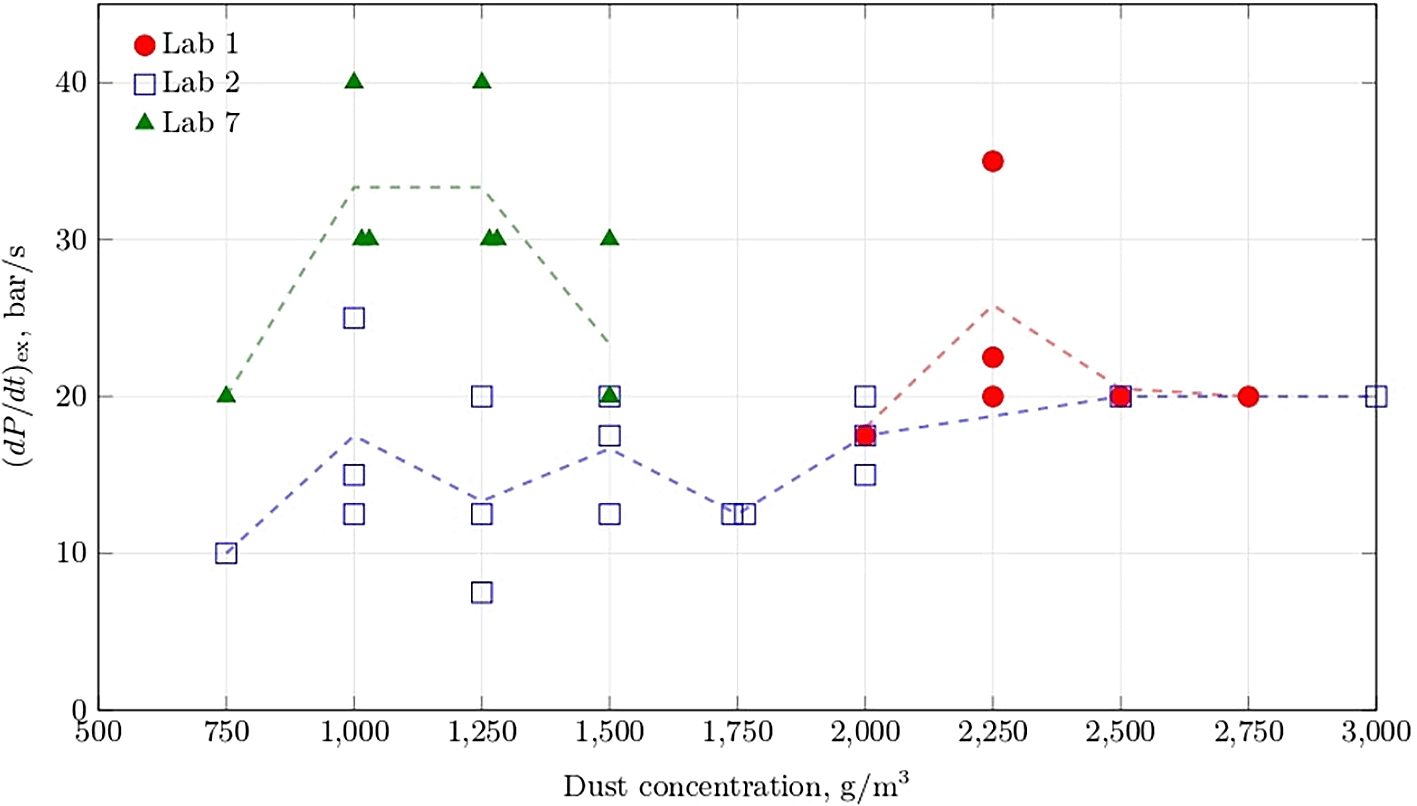
Figure 11. Rate of pressure rise
for MT63 as a function of dust concentration measured by Lab. 1, 2, 7.
A comparison of the MT63 results shows that the first and the second laboratories exhibit relatively similar behavior in
. In contrast, the seventh laboratory reports lower maximum explosion pressure, which leads to higher standard deviation between laboratories (Table 6). With regard to the rate of pressure rise, the opposite trend is observed, as the highest values were observed in the seventh laboratory. Standard deviation for highest values between laboratories in
is in acceptable range, as well as inside each laboratory.
Figures 12 and 13 present the results obtained for MT150. The general trend is similar to that observed for MT63. As described previously, different dust concentrations were tested. The second laboratory investigated a wider concentration range (1000–4000 g/m3) with larger step intervals, whereas the seventh laboratory focused on concentrations up to 1500 g/m3 with smaller step sizes. The measured explosion overpressures are generally higher in the 2nd laboratory, whereas the 7th laboratory reports higher values of the maximum rate of pressure rise. The repeatability of the maximum pressure within the 2nd laboratory remains within the acceptable range, whereas within the 7th laboratory exceeds the limit. Between-laboratory reproducibility is outside the acceptable range. The repeatability of the maximum rate of pressure rise within individual laboratories remains within the acceptable range according to the standard. However, when comparing the maximum values between laboratories, the standard deviation reaches approximately 39%, slightly exceeding the recommended limit of 30% (Table 7).
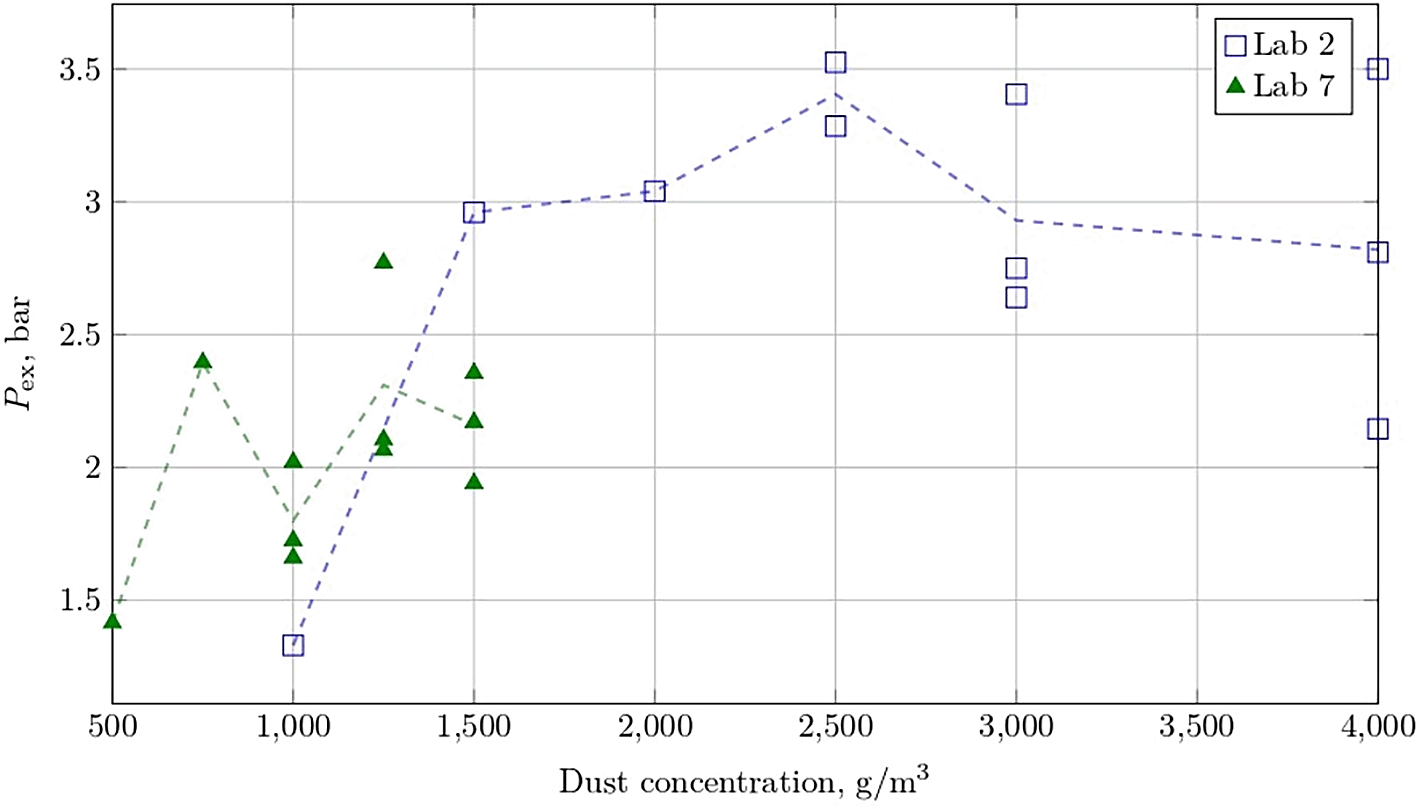
Figure 12. Explosion overpressure
for MT150 as a function of dust concentration measured by Lab. 2, 7.
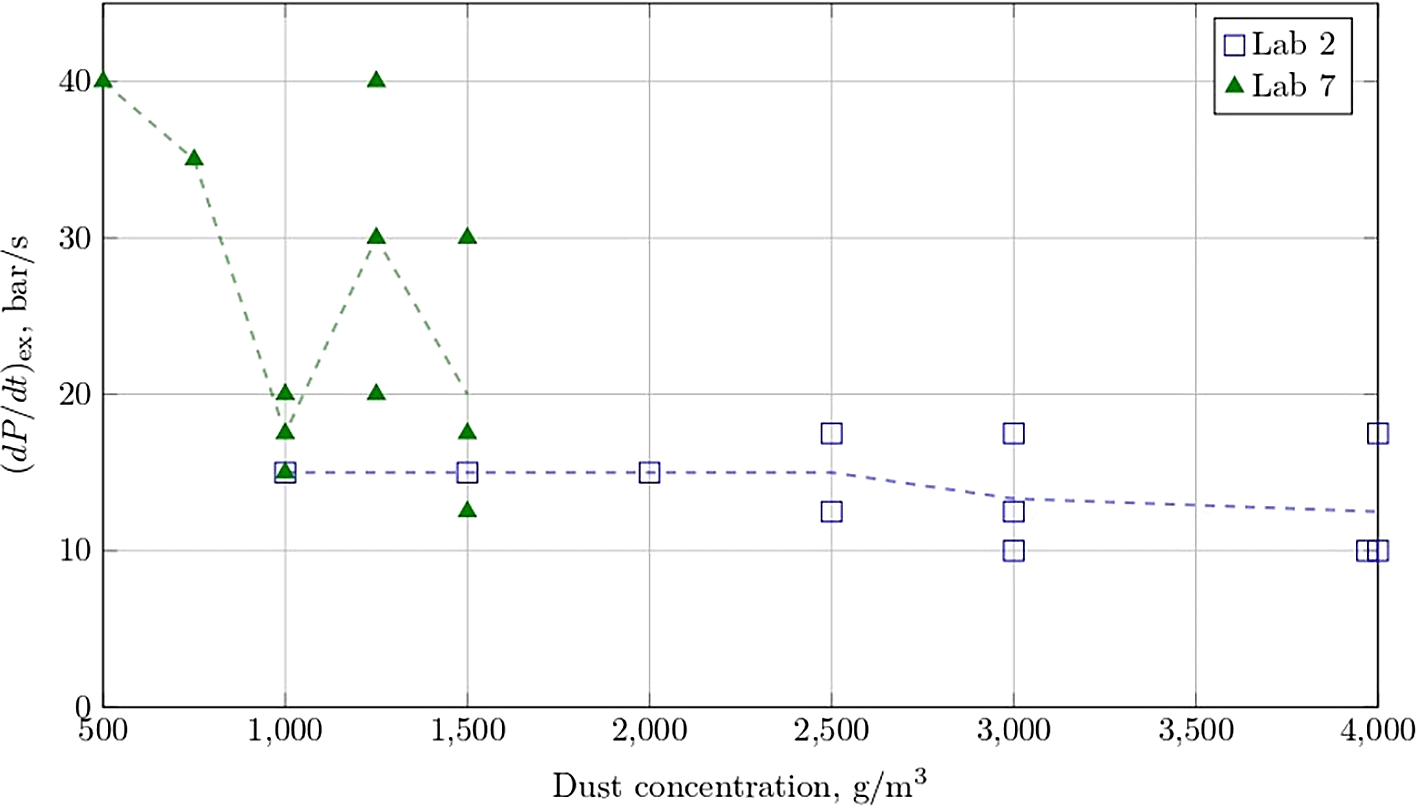
Figure 13. Rate of pressure rise
for MT150 as a function of dust concentration measured by Lab. 2, 7.
Table 7. Evaluation of MT150 explosion indices based on data reported by two participants.
Pressure values were rounded to one decimal place, whereas rate of pressure rise values and percentages were rounded to integers.
| Parameter [N. participant] | Mean value ± standard deviation |
Relative standard deviation [%] |
|---|
|
in bar g
| 2.9 ± 0.8 | ±27 |
|
in bar g (Lab 2) | 3.4 ± 0.1 | ±3 |
|
in bar g (Lab 7) | 2.3 ± 0.4 | ±16 |
|
in bar g
| 1.9 ± 1.1 | ±57 |
|
in bar g (Lab 2) | 2.6 ± 0.2 | ±7 |
|
in bar g (Lab 7) | 1.1 ± 0.6 | ±52 |
|
in bar/s
| 24 ± 9 | ±39 |
|
in bar/s (Lab 2) | 17 ± 1 | ±9 |
|
in bar/s (Lab 7) | 30 ± 8 | ±27 |
|
in bar·m/s
| 7 ± 2 | ±33 |
|
in bar·m/s (Lab 2) | 5 ± 0.4 | ±9 |
|
in bar·m/s (Lab 7) | 8 ± 3 | ±33 |
Figures 14 and 15 present the results obtained for MT150reg. In this case, both laboratories tested within largely comparable concentration ranges. It can be observed that at concentrations of 1000 and 1250 g/m3, the values for both explosion parameters differ significantly between the laboratories. Nevertheless, when considering the average of the maximum values for each parameter in each series, the between-laboratory reproducibility remains within acceptable limits for the maximum explosion pressure, while it is slightly above the recommended range for the maximum rate of pressure rise (Table 8).
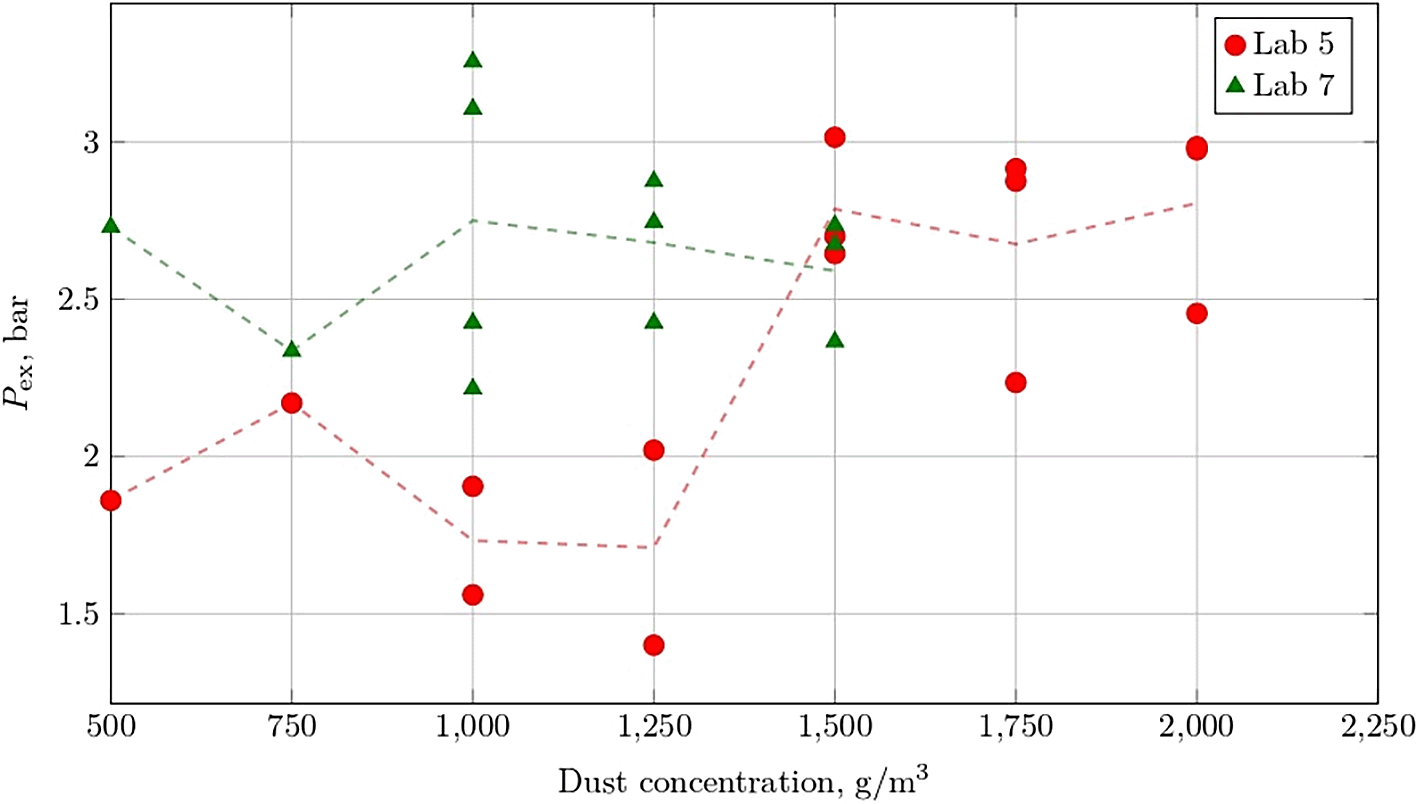
Figure 14. Explosion overpressure
for MT150reg as a function of dust concentration measured by Lab. 5, 7.
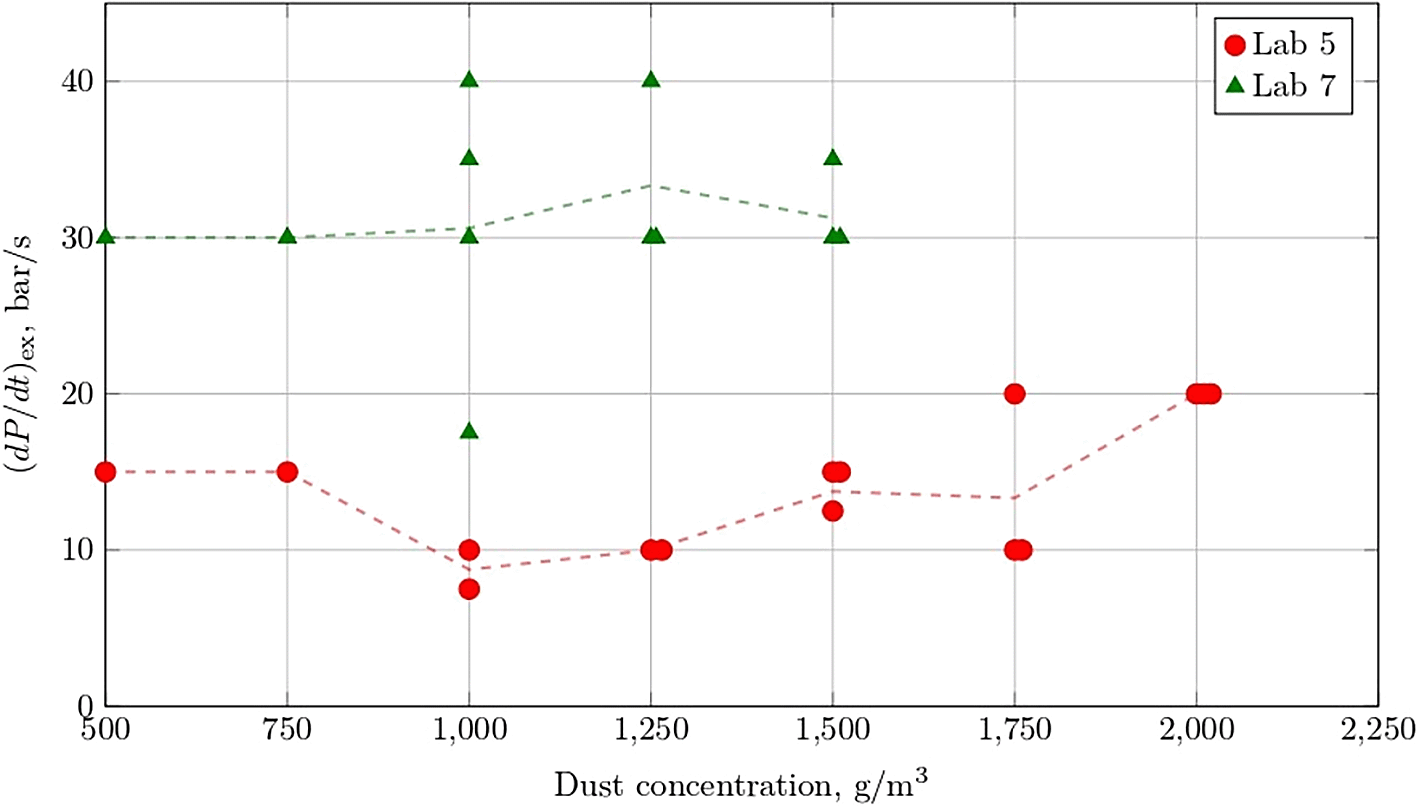
Figure 15. Rate of pressure rise
for MT150reg as a function of dust concentration measured by Lab. 5, 7.
Table 8. Evaluation of MT150reg explosion indices based on data reported by two participants.
Pressure values were rounded to one decimal place, whereas rate of pressure rise values and percentages were rounded to integers.
| Parameter [N. participant] | Mean value ± standard deviation |
Relative standard deviation [%] |
|---|
|
in bar g
| 3.0 ± 0.1 | ±2 |
|
in bar g (Lab 5) | 3.0 ± 0.1 | ±2 |
|
in bar g (Lab 7) | 2.9 ± 0.4 | ±13 |
|
in bar g
| 1.9 ± 0.1 | ±7 |
|
in bar g (Lab 5) | 2.0 ± 0.1 | ±3 |
|
in bar g (Lab 7) | 1.8 ± 0.5 | ±28 |
|
in bar/s
| 28 ± 11 | ±39 |
|
in bar/s (Lab 5) | 20 ± 0 | ±0 |
|
in bar/s (Lab 7) | 35 ± 4 | ±12 |
|
in bar·m/s
| 7 ± 3 | ±40 |
|
in bar·m/s (Lab 5) | 5 ± 0 | ±0 |
|
in bar·m/s (Lab 7) | 9 ± 1 | ±12 |
Figures 16–19 show the explosion overpressure (
) and the rate of pressure rise for MT63reg. As summarized in
Table 9, all deviations remain within the acceptable range. Nevertheless, it can be observed that the pressure peaks occur at different dust concentrations. As this sample was classified as explosible by the majority of the participating laboratories, a larger dataset is available compared to the other powders. Over a wide concentration range (500–5000 g/m3), a consistent overall trend can be observed, with no clear decline in the measured values at higher concentrations. Instead, both parameters increase at lower concentrations and then reach a plateau with some fluctuations. This behavior highlights the limitations of the 20-L sphere when testing marginally reactive dusts, where further increases in dust concentration do not result in lower explosion severity.
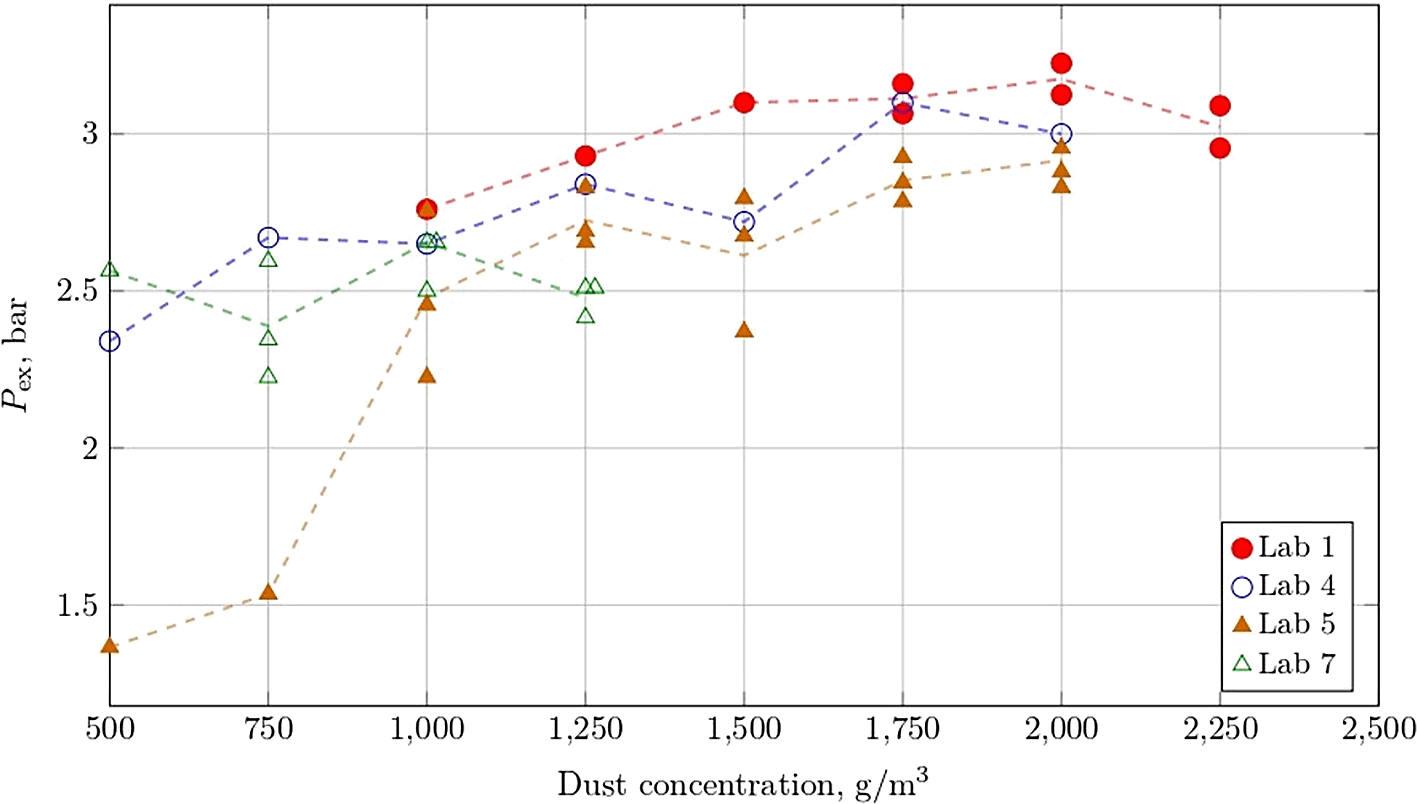
Figure 16. Explosion overpressure p
ex for MT63reg as a function of dust concentration measured by Lab. 1, 4, 5, 7.
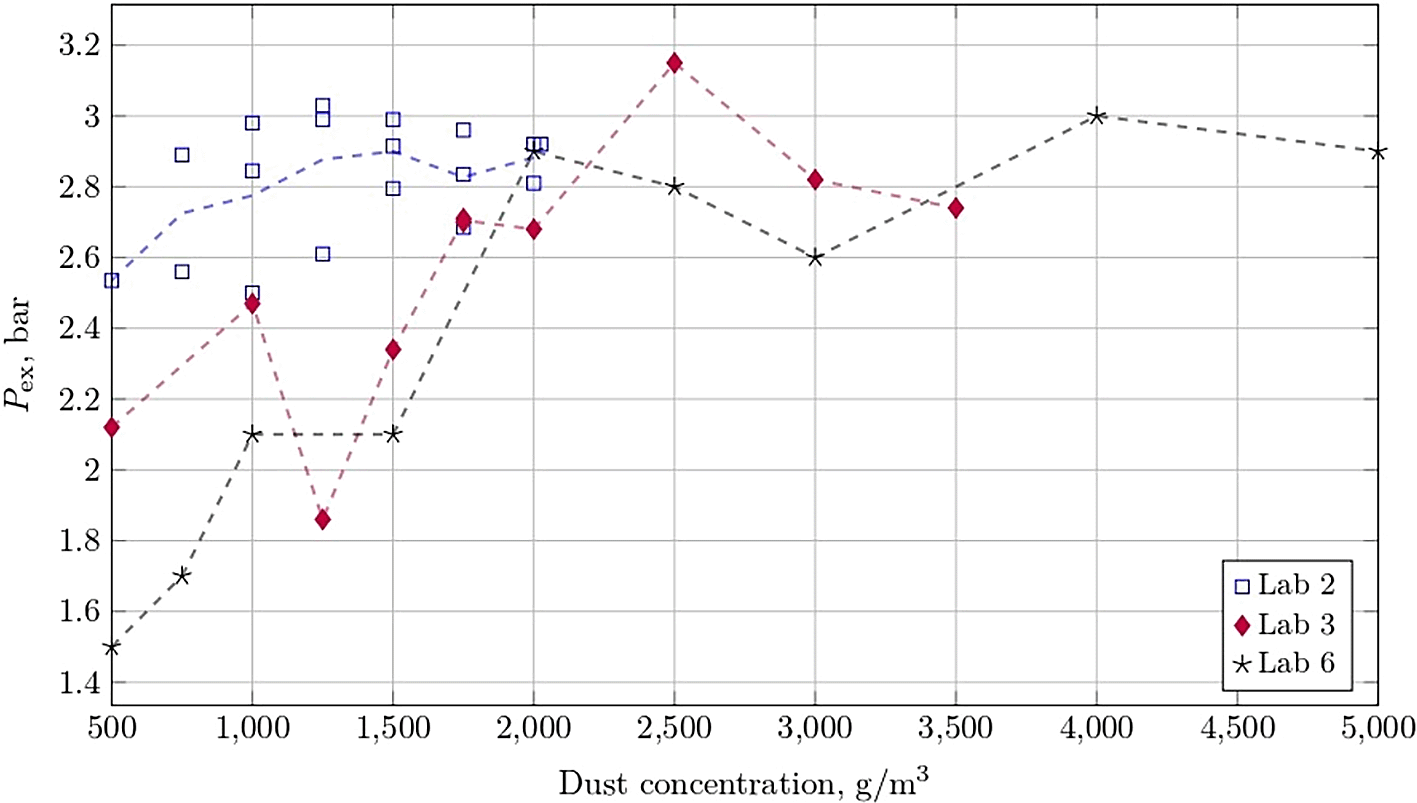
Figure 17. Explosion overpressure p
ex for MT63reg as a function of dust concentration measured by Lab. 2, 3, 6.
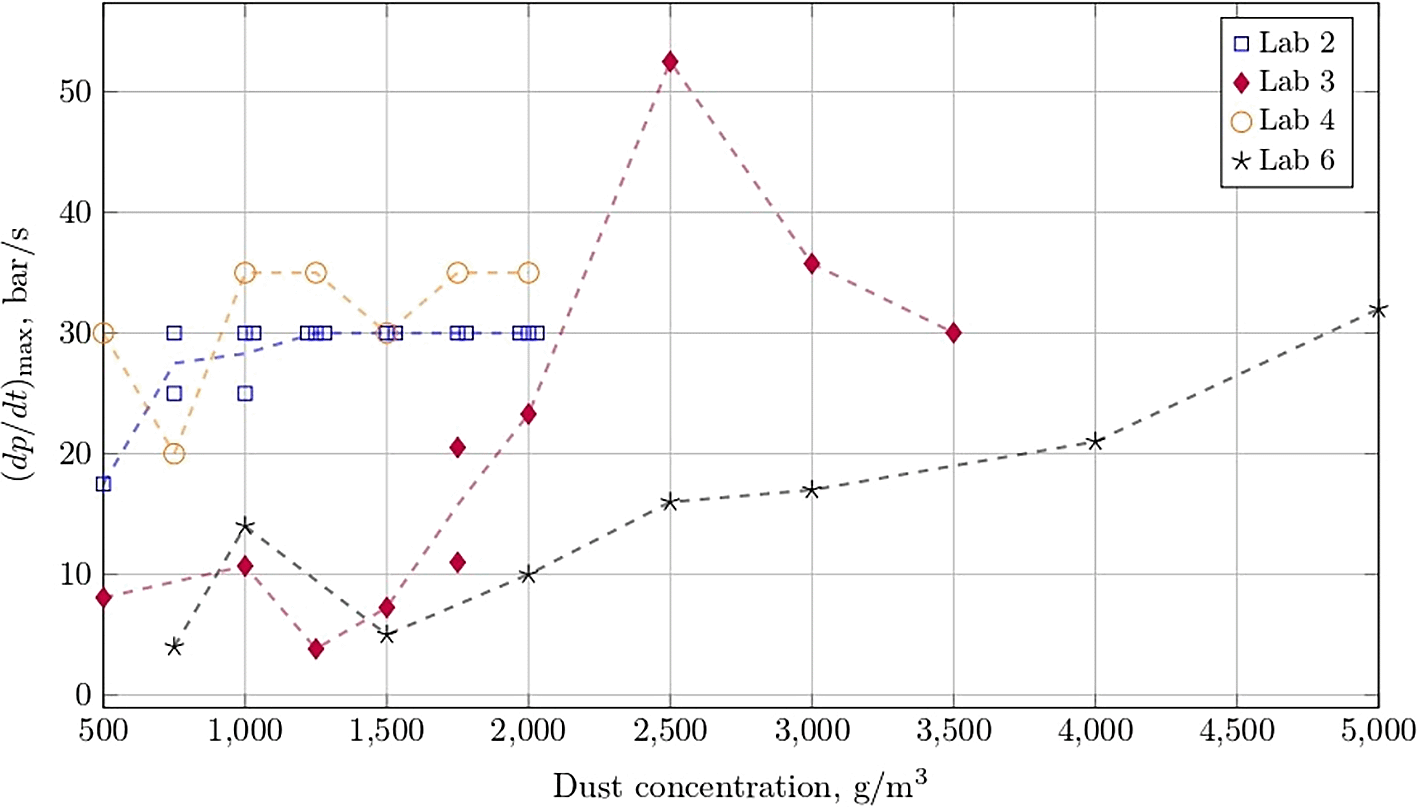
Figure 18. Rate of pressure rise
for MT63reg as a function of dust concentration measured by Lab. 2, 3, 4, 6.
Table 9. Evaluation of MT63reg explosion indices based on data reported by seven participants.
Pressure values were rounded to one decimal place, whereas rate of pressure rise values and percentages were rounded to integers.
| Parameter [N. participant] | Mean value ± standard deviation | Relative standard deviation [%] |
|---|
|
in bar g
| 3 ± 0.2 | ±7 |
|
in bar g (Lab 1) | 3.2 ± 0.1 | ±2 |
|
in bar g (Lab 2) | 3.0 ± 0.03 | ±0.9 |
|
in bar g (Lab 3) | 3.2 | - |
|
in bar g (Lab 4) | 3.1 | - |
|
in bar g (Lab 5) | 2.9 ± 0.1 | ±2 |
|
in bar g (Lab 6) | 3.0 | - |
|
in bar g (Lab 7) | 2.6 ± 0.1 | ±3 |
|
in bar g
| 2.1 ± 0.4 | ±18 |
|
in bar g (Lab 1) | 2.3 ± 0.1 | ±3 |
|
in bar g (Lab 2) | 2.0 ± 0.1 | ±3 |
|
in bar g (Lab 3) | 2.6 | - |
|
in bar g (Lab 4) | 2.1 | - |
|
in bar g (Lab 5) | 1.8 ± 0.2 | ±8 |
|
in bar g (Lab 6) | 2.4 | - |
|
in bar g (Lab 7) | 1.5 ± 0.1 | ±4 |
| (dp/dt)max in bar/s
| 37 ± 10 | ±27 |
| (dp/dt)max in bar/s (Lab 1) | 50 ± 0 | ±0 |
| (dp/dt)max in bar/s (Lab 2) | 30 ± 0 | ±0 |
| (dp/dt)max in bar/s (Lab 3) | 53 | - |
| (dp/dt)max in bar/s (Lab 4) | 35 | - |
| (dp/dt)max in bar/s (Lab 5) | 27 ± 3 | ±11 |
| (dp/dt)max in bar/s (Lab 6) | 32 | - |
| (dp/dt)max in bar/s (Lab 7) | 35 ± 0 | ±0 |
|
in bar·m/s
| 10 ± 3 | ± 28 |
|
in bar·m/s (Lab 1) | 14 ± 0 | ± 0 |
|
in bar·m/s (Lab 2) | 8 ± 0 | ± 0 |
|
in bar·m/s (Lab 3) | 14 | -
|
|
in bar·m/s (Lab 4) | 9 | -
|
|
in bar·m/s (Lab 5) | 7 ± 1 | ± 11 |
|
in bar·m/s (Lab 6) | 9 | -
|
|
in bar·m/s (Lab 7) | 9 ± 0 | ± 0 |
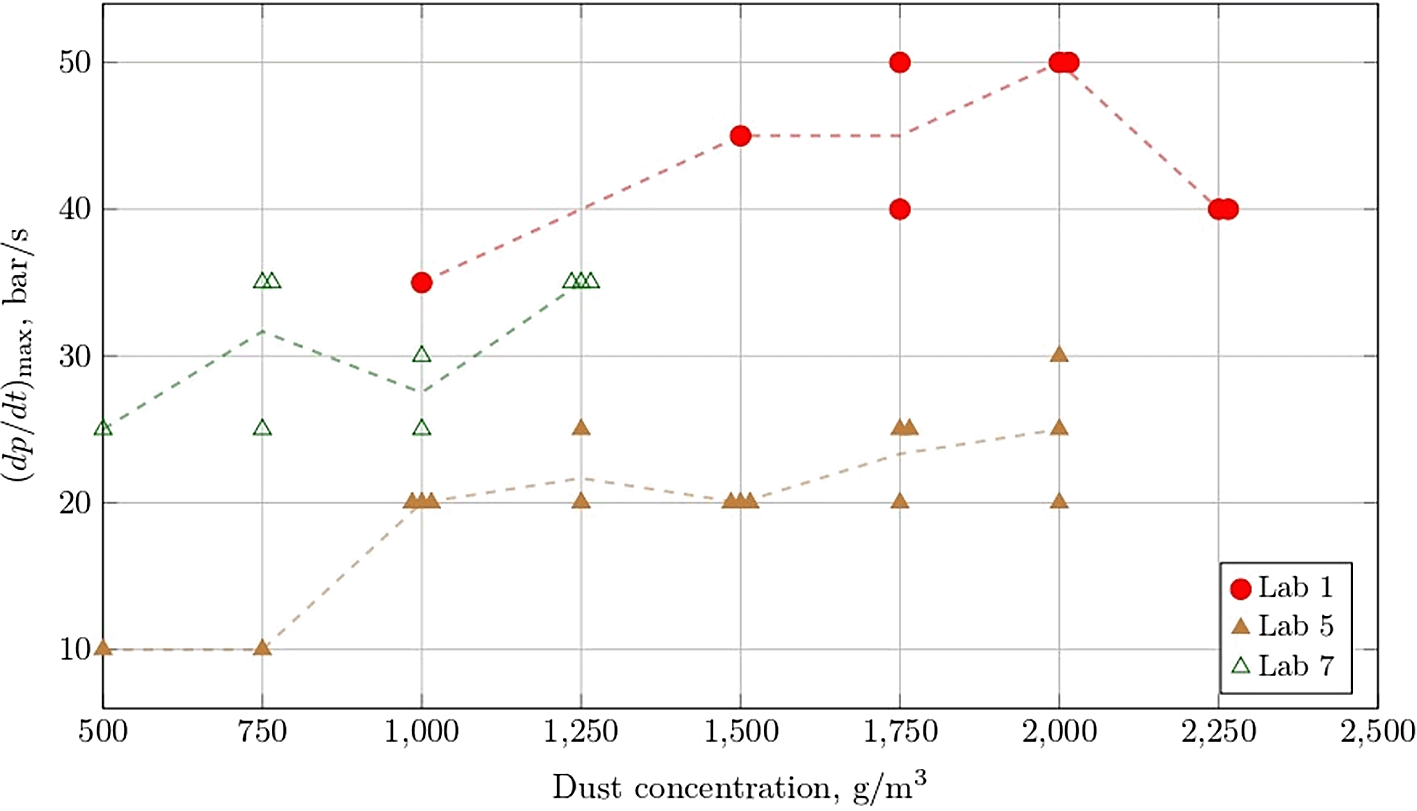
Figure 19. Rate of pressure rise
for MT63reg as a function of dust concentration measured by Lab. 1, 5, 7.
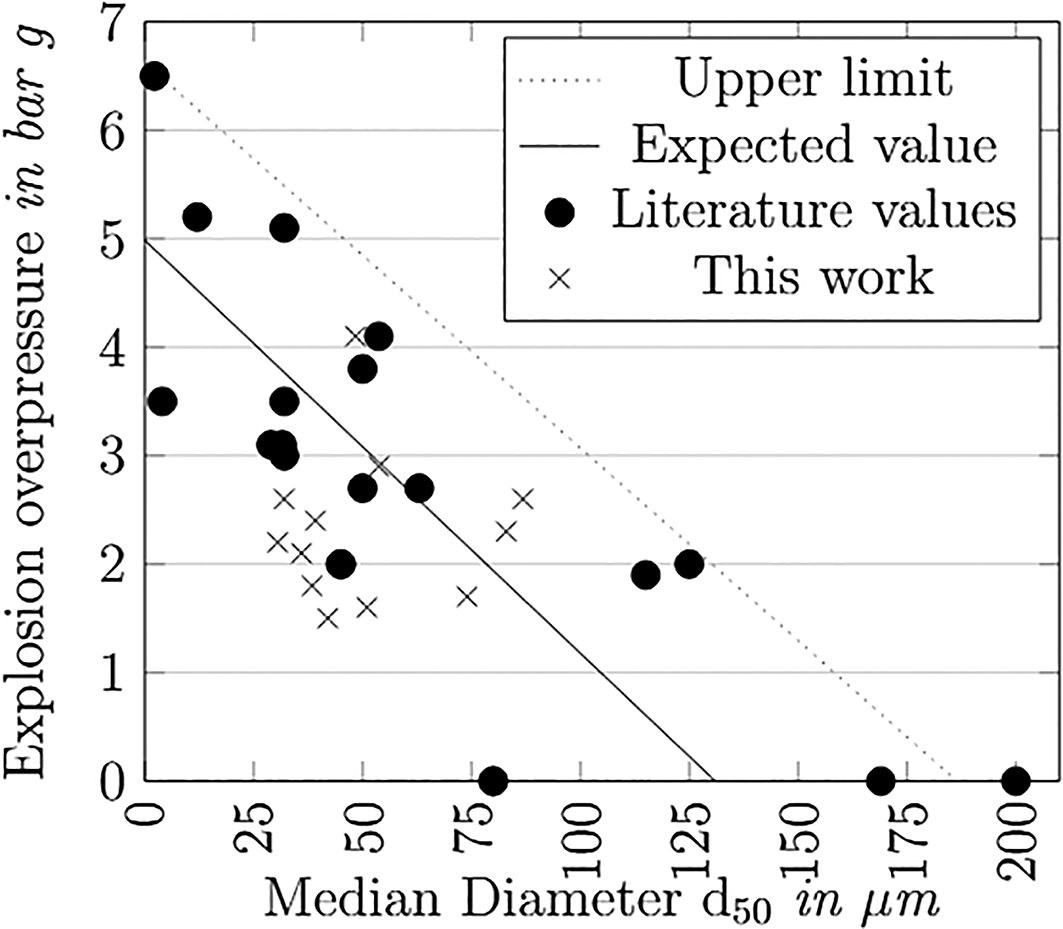
Figure 20. SIE-Chart: Explosion pressures for several iron dusts against the stated d50, Data taken from.39,40,76
Overall, all powders exhibited similar levels of explosion overpressure (
), with average maximum values of approximately 3 bar, regardless of whether the material was regenerated or not. Although it was expected that the regenerated samples would show higher explosion severity due to changes in particle morphology and structure,72 this effect is not clearly observed in the results.
The same applies to the rate of pressure rise
, for which the average maximum values are around 30 bar/s across all samples, with no significant differences between regenerated and non-regenerated powders. This suggests that, despite morphological changes, the overall explosion severity remains comparable.
In summary, the round-robin test revealed variability in the determination of explosion parameters for weakly explosive iron dust, despite consistent sample properties and standardized procedures. These findings highlight the limitations of the current testing procedure, particularly for low-reactivity dusts. They show that variations in the safety characteristics of different iron dust samples with different properties may be overshadowed by the limited reproducibility of the test methods.
As long as these limitations in the explosion standard persist, the establishment of general safety concepts for a standardized, non-explosive iron energy carrier — intended for large-scale distribution across Europe — remains a challenge. One way to overcome this difficulty is to classify all iron dusts as St 1 (
< 200) or to use an a-priori approach as suggested previously39 (see Figure 20) in which the expected value is the linear regression for all the data points, the upper limit is the linear plot between the highest observed data points. The theoretical value was calculated with the assumption that a full conversion from Fe to Fe2O3 at the stoichiometry with air takes place when the particles are infinitely small and are evenly suspended in air. Further assumptions/values for the calculation were a constant heat capacity for iron of 0,55 kJ/kg/K and 1,01 kJ/kg/K for air, and a latent heat of melting for iron of 13,8 kJ/kg.
Further work is required to populate this plot with additional data, but eventually it may allow a classification without the need for further testing of iron energy carriers. Simultaneously, a better understanding of dispersion, turbulence, and combustion/explosion in a 20-liter vessel - for instance, through comparison with numerical simulations, as demonstrated in32- could help explain the observed variation and support the development of an improved standard.