Introduction
The circular economy is implemented at different levels through Industrial Symbiosis (IS), and in a broader way via Urban Industrial Symbiosis (UIS), which includes urban areas and their activities in symbiotic value chains, considering methodological, managerial, and other non-technological aspects. The Hubs4Circularity (H4C) concept emerges, proposing systemic solutions beyond environmental engineering, technical or specific, and limited non-technical aspects, by integrating local spatial aspects and multiple regional stakeholders and by introducing a variety of different operational models, owing to the different regional and sector settings and needs.1 Previous work on identifying and facilitating IS and UIS synergies has been conducted, creating a matchmaking framework using multi-criteria methods, mainly focusing on waste stream types, treatment methods, and stakeholder compatibility, creating valorization matches2 or other frameworks that are more specialized and dedicated to specific resources such as water and sludge.3 To support the H4C concept, there is a need to align the UIS synergy identification and implementation with regional development strategies and relevant regional science methods. Thus, this work focuses on the integration of regional settings, including the region’s local characteristics, strategies, resources, waste, and special requirements or challenges, called as “Regional Scenery” in this study, into the matchmaking framework. The term region in this study is referred to Nomenclature of territorial units for statistics (NUTS) 24 level. As shown in
Figure 1, the proposed framework comprises three levels: the development of a regional profile followed by two prioritization procedures applied to the identified synergies.

Figure 1. Integration of regional dimension in the matchmaking framework logic.
The proposed matchmaking framework is integrated into the IS2H4C project’s central digital end-user platform as a separate functionality. All the aforementioned prerequired data of Level 1 regarding entities and their resources -input or output flows- will be collected upon the registration of the users within the platform and thus are considered as given. The regional data will be collected using a digital version of a proposed questionnaire which will be exposed as a mandatory action to the users at a certain point before using the matchmaking functionality. The questions concern a specific region; therefore, it is sufficient to be filled by at least one user that refers to this region, while other users -other organizations within the same region- can update, if necessary, the existing answers.
Level 1 regional scenery
Level 1 includes the collection of all the required data to operate the matchmaking and prioritization features., This includes basic information about the entities/industries such as domain activities (NACE), their input (raw materials) or output (waste, subproducts) flows in terms of quantity, quality seasonality etc., relevant services, or information about entity’s maturity on UIS as displayed in previous frameworks.2,3 This study builds upon previous research and goes beyond them by adding the collection of regional data via the dedicated questionnaire (
Figure 2) to transform this information into a regional profile, and especially two matrices that depict the regional scenery.
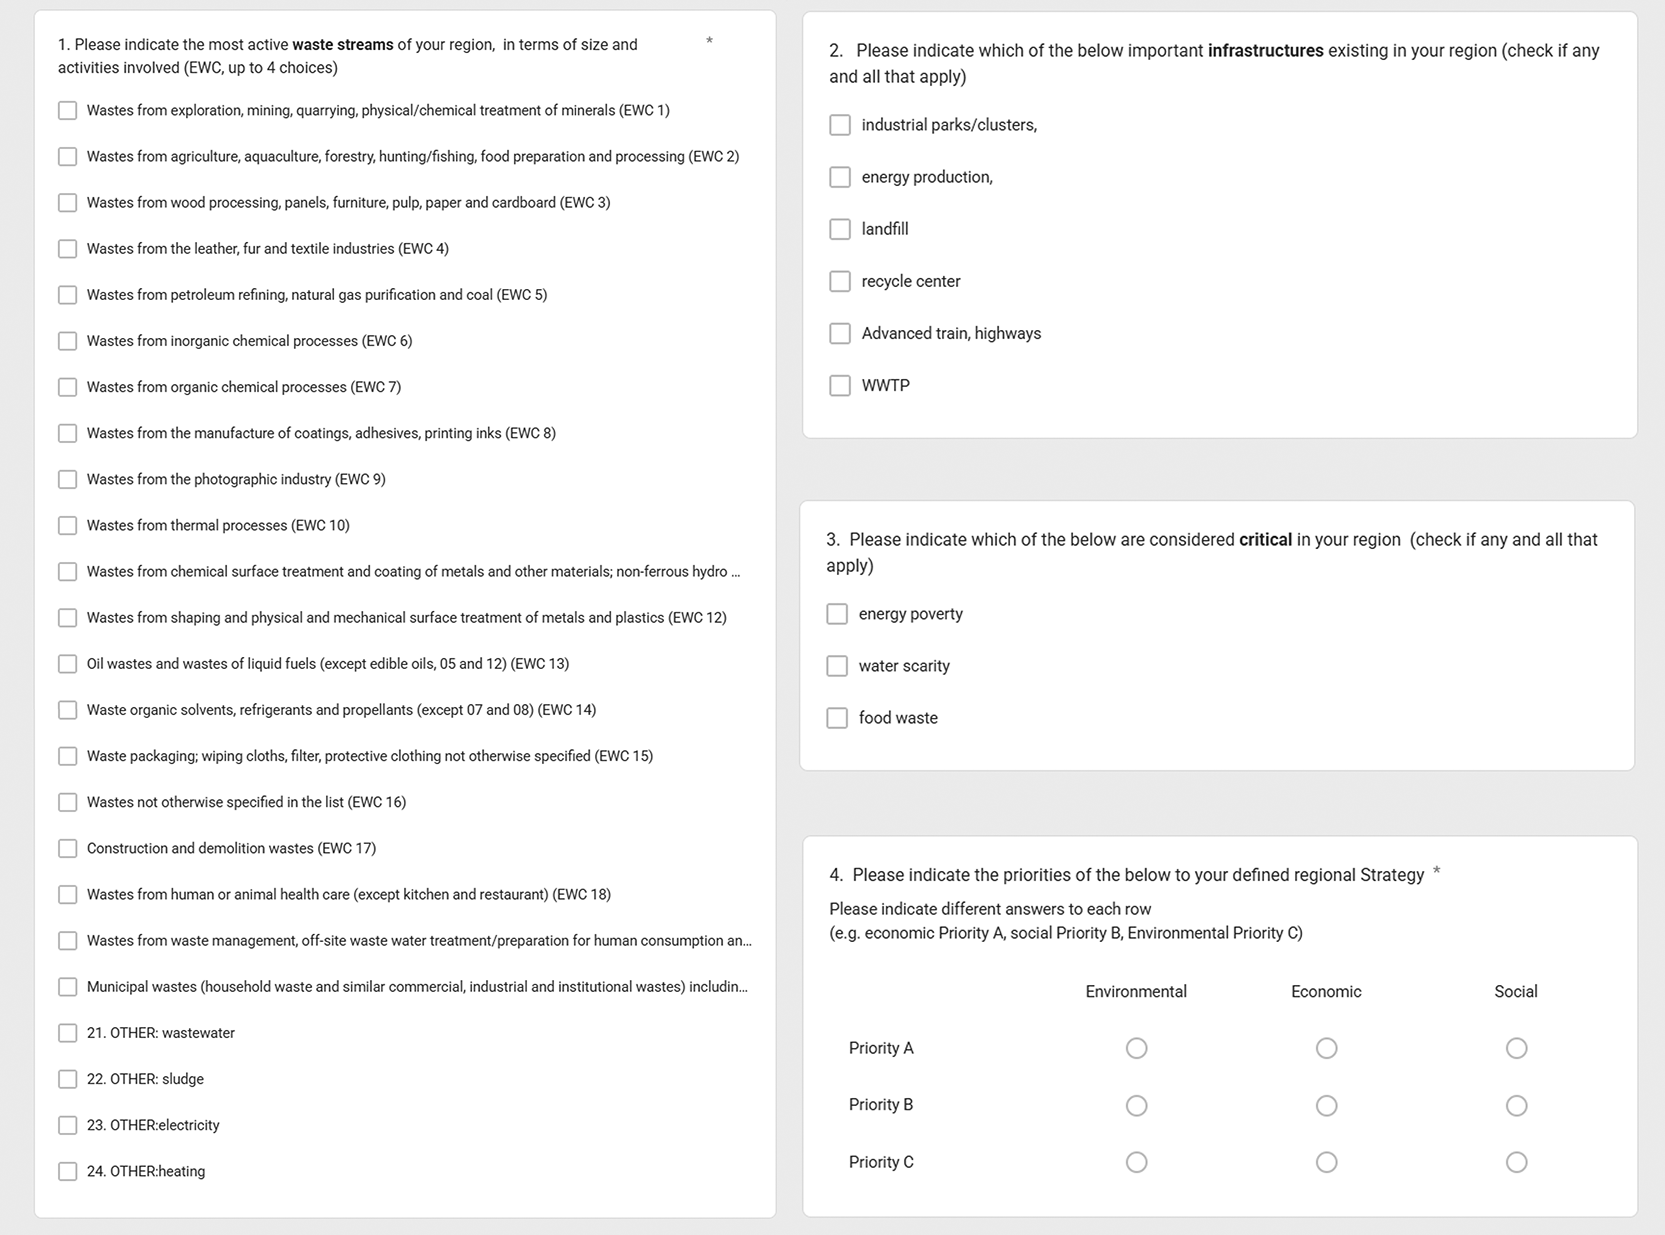
Figure 2. The regional questionnaire.
The questionnaire includes information related to:
I. Region type (coastal, non-coastal, island, predominantly rural, intermediate, predominantly urban).5
II. Most active waste flows in the region (based on EWC codes6,12 enhanced with water and energy options).
III. Important infrastructure (e.g., energy production facility, landfill, recycling center, wastewater treatment plant (WWTP)).
IV. Critical resources (e.g. due to energy poverty, water scarcity, food waste).
V. Regional Strategy (Priorities on environmental, economic and social Aspects).
The outcomes of Level 1: Based on the information collected through the questionnaire, two matrices are produced (Matrix A and Matrix B) depicting the regional scenery for each region studied, so they can be used in Level 2 and Level 3, respectively, for synergies scoring and relevant prioritization. Matrix A provides a quantitative representation of the scale and extent of the waste streams within the region, capturing their relative magnitude and spatial significance. Matrix B moves beyond size-based metrics and reflects the various effects generated by the proposed synergies within the region. Based on the answers, the two matrices are automatically calculated and assigned for each region by the system. The templates of the two matrices and the calculation rules are explained below.
Transforming questionnaire answers to scores and form Matrix A and Matrix B
Questionnaires’ answers were transformed into weights and factors and gathered into two matrices. The purpose is to define and provide a baseline approach that touches the regional dimensions and transforms them into something concrete and exploitable in terms of a matchmaking framework that can potentially be implemented and executed via digital tools; thus, it must be expressed via concrete parameters. The main objective of this transformation is to understand where the focus should be on each region and to create a baseline for the prioritization of the identified potential synergies (matches).
Matrix A calculation rules
Matrix A as per
Table 1 includes the exact values that are calculated based on the answers to the questionnaire for all regions to be included in each use case. Regions are identified mainly by NUTS2, and optional can be specialized to even smaller region classifications; thus, NUTS3 (NUTS2 region includes several NUTS3 regions).
The detailed calculation rules for each of the regions are the below:
• The value 0.5 is set for all columns named 1 to 24 for that region.
• For each selected Flow in Question 1, the value to 1.0.
• Set value to 1.0 (if not already) in cells 23,24 if energy poverty was selected question 3.
• Set value to 1.0 (if not already) in cells 21,22 if water scarcity was selected question 3.
• Add values according to the following answers in question 2 as per
Table 2.
Table 1. Template for Matrix A.
| REGION’S NAME
| - |
| NUTS24 | - |
| NUTS3 (if applicable) | - |
| COUNTRY
| - |
| 1. EWC112 | - |
| 2. EWC2
| - |
| 3. EWC3
| - |
| 4. EWC4
| - |
| 5. EWC5
| - |
| 6. EWC6
| - |
| 7. EWC7
| - |
| 8. EWC8
| - |
| 9. EWC9
| - |
| 10. EWC10
| - |
| 11. EWC11
| - |
| 12. EWC12
| - |
| 13. EWC13
| - |
| 14. EWC14
| - |
| 15. EWC15
| - |
| 16. EWC16
| - |
| 17. EWC17
| - |
| 18. EWC18
| - |
| 19. EWC19
| - |
| 20. EWC20
| - |
| 21. WASTEWATER
| - |
| 22. SLUDGE
| - |
| 23. ELECTRICITY
| - |
| 24. HEATING
| - |
Table 2. Question 2 extra values for Matrix A.
| Answered selected |
Value added if selected |
|---|
| Recycle center | +0.2 to cells 2,17,20 |
| Energy production | +0.2 to cells 23,24 |
| WWTP | +0.2 to cells 21,22 |
For industrial parks/clusters and advanced trains, highway answers to question 2, the answers collected were not used for the current framework, but they will be used in future studies.
Matrix B calculation rules
Matrix B includes the exact values that are calculated based on the answers to the questionnaire for all regions to be included in each use case, as displayed in
Table 3. Regions are again identified mainly by NUTS2, and optional can be specialized for NUTS3. The calculation rules for each region are based on the following
Table 4,
Table 5 and
Table 6. It should be noted that factors X1, X2, X3, and X4 are considered environmental factors, whereas X5 is social and X6 is economic.
Table 3. Template for Matrix B.
| REGION’S NAME
| - |
| NUTS24 | - |
| NUTS3 (if applicable) | - |
| COUNTRY
| - |
| ENERGY CONSUMPTION (X1)
| - |
| RECLAIMED WATER (X2)
| - |
| LANDFILL REDUCTION (X3)
| - |
| GHG EMISSIONS (X4)
| - |
| JOBS CREATED (X5)
| - |
| GDP GROWTH (X6)
| - |
Table 4. Impact factor initiation according to strategy paths.
| Social | Economic |
Environmental |
|---|
| Priority A | X5 =1.0 | X6 =1.0 * | X1,2,3 = 0.8, Χ4 = 1.0 |
| Priority B | X5 =0.7 | X6 =0.7 | X1,2,3 = 0.5, Χ4 = 0.7 ** |
| Priority C | X5 =0.4 *** | X6 =0.4 | X1,2,3 = 0.2, Χ4 = 0.4 |
Table 5. Impact factors type.
| Impact Factor | Factor’s magnitude |
Type |
|---|
| Energy consumption (X1) | F1
| Environmental (Energy) |
| Reclaimed water (X2) | F2
| Environmental (Water) |
| Landfill reduction (X3) | F3
| Environmental |
| GHG emissions (X4) | F4
| Environmental |
| Jobs created (X5) | F5
| Social |
| GDP growth (X6) | F6
| Economic |
Table 6. Questions 2 and 3 extra values for Matrix B.
| Answered selected in question 2 and 3 |
Value added if selected |
|---|
| Recycle Center | +0.1 to X3 |
| Energy Production | +0.1 to X1 |
| WWTP | +0.1 to X2 |
| Energy Poverty | +0.1 to X1 |
| Water Scarcity | +0.1 to X2 |
Based on the strategic priorities of Question 4, the initial values of the magnitudes of the factors are defined as follows: For example, if a region has Economic, Environmental and Social priorities (sorted in this order),
• X6 will be initiated to 1.0 as Economic is Priority A*.
• X1, X2, and X3 are set to 0,5, as environmental is priority B**.
• Finally, X5 is initiated at 0.4, as Social is priority C***.
X4, X5, and X6 are not further updated within the current framework; this is why they start slightly higher than environmental X1, X2, and X3, which will be further enhanced based on the answers selected in questions 2 and 3, as displayed in
Table 6.
Again, for industrial parks/clusters and advanced trains, highway answers to question 2, the answers collected were not used for the current framework, but they will be used in future studies.
For both Matrices, the rationale underlying these rules is to ensure that weight and factors’ magnitudes values are around 0.5 and 1.0, while allowing individual elements to introduce modest adjustments to specific weights or factors’ magnitudes without large deviations. The proposed rules establish baseline values that can be systematically refined through empirical validation.
Level 2 reuse priority – Matrix A – 1st prioritization process
In Level 2 all potential synergies are identified by matching the input/output streams and services. For example, if a waste of an industry can be used as secondary raw material -directly or after a treatment (service)- of another industry, this is indicated as a potential synergy or “match.” The exact matching method is beyond the current scope, and it has been analyzed in previous studies.2,3 To meet the needs of this study, it is assumed that there is already a set of identified synergies (matches) that will be prioritized via levels 2 and 3.
This set of synergies is sorted based on Matrix A results within level 2, so the synergies involving value chains with greater weights will be ranked higher, indicating a higher reuse priority. Prioritization is based only on the calculated weighs indicating the “magnitude,” or “capacity” or “importance” of waste streams generally in the region. Thus, if water (flow #21,
Table 1) has greater weight than municipal waste (flow #20,
Table 1) for a particular region, then the synergies related to water will be prioritized and visualized first.
Because of the way it is calculated, Matrix A is already normalized, quantifying the “importance” of the waste type for the region, regardless of the quantity and unit of measurement of each dedicated synergy identified.
Level 3 regional impact – Matrix B – 2nd prioritization process
Level 3 applies a second prioritization to the sorted list produced by Level 2. The total regional impact factor = sum (Xi*Fi) was calculated based on Matrix B, and the identified synergies were sorted based on this factor.
Fi (F1-F6) are the impact factors indicating the importance of the corresponding Xi (X1-X6), functioning in fact as weights, calculated automatically by the system from the answers of the questionnaire, and they are stored in Matrix B
The Fi values, in many cases, can be directly calculated, such as energy consumption (X1), reclaimed water (X2), landfill reduction (X3), or jobs created (X5). In contrast, a complex parameter such as GHG emissions (X4) or GDP growth (X6) can be calculated via standardized and commonly accepted methods such as LCA methods and/or emission factors. Given that they will somehow be estimated, Xi values are normalized (e.g., using Min–Max or Z-score normalization or transforming them to common equivalent units) to ensure that all of them contribute equivalently (to the extent of their Fi values/weights) to the total regional impact factor, irrespective of their original units and scales.
Final double prioritization after level 2 and level 3
The result of this double prioritization in Levels 2 and 3 follows different approaches. A simple sequential prioritization in this case would be useless, as it could only be applied to synergies that have the same score within Level 2. The impact on the region is crucial in our field; therefore, it cannot be applied too narrowly. A scoring weighted total matrix is a better option; therefore, it is the proposed method. The total priority factor which will be the final and only criterion for the final prioritization, is calculated as A × wA + B × wB (where wA is the weight that expresses the extent to which A will be considered and wB respectively the extent to which Β will be considered το the final prioritization) while:
• wA + wB = 1
• N are the identified synergies
• A = N for 1st synergy, A = N-1 for 2nd synergy, A = N-2 for 3rd synergy …. after prioritization of level 2
• B = N for 1st synergy, B = N-1 for 2nd synergy, B = N-2 for 3rd synergy …. after prioritization of level 3
A simple equally weighted approach (wA = 0,5 and wB = 0,5) can be proposed as an initial assumption; however, it can be open and adaptable depending on the user's needs and scenarios. For example, as displayed in
Table 7, if there are e.g. 5 identified synergies.
Table 7. Double prioritization example.
| Synergy | Level 1 priority | A | Level 2 priority | B | Calculation | Total | Final priority |
|---|
| Synergy #1 | 1st | 5 | 3rd | 3 | 0,5 X 5+0,5 X 3 | 4 | 2nd |
| Synergy #2 | 2nd | 4 | 2nd | 5 | 0,5 X 4+0,5 X 5 | 4,5 | 1st |
| Synergy #3 | 3rd | 3 | 1st | 4 | 0,5 X 3+0,5 X 4 | 3,5 | 3rd |
| Synergy #4 | 4th | 2 | 5th | 1 | 0,5 X 5+0,5 X 1 | 3 | 4th |
| Synergy #5 | 5th | 1 | 4th | 2 | 0,5 X 1+0,5 X 2 | 1,5 | 5th |
Demonstration of the framework in the four (4) hubs of IS2H4C project
To demonstrate the proposed framework, the questionnaire was shared with relevant partners to fill in the regions hosting the four IS2H4C hubs. For this demonstration, the questionnaire was shared via Google Forms,9 as the digital platform has not yet been developed, and the answers are displayed in
Table 8.
Table 8. IS24HC regions answers to regional questionnaire.
| Region and country | 1. Most active waste streams12 | 2. Important infrastructures | 3. Criticalities | 4. Strategic priority A | 4. Strategic priority B | 4. Strategic priority C |
|---|
| Basque Country | EWC3, EWC5, EWC20 | industrial parks/clusters, WWTP | - | Economic | Environmental | Social |
| Frankfurt Rhein Main | EWC7, EWC10, EWC19, EWC20 | industrial parks/clusters, energy production, recycle center, advanced trains, highways, WWTP | energy poverty | Economic | Environmental | Social |
| Izmir | EWC1, EWC5, EWC12, EWC19 | industrial parks/clusters, recycle center, WWTP | energy poverty, water scarcity | Economic | Environmental | Social |
| Overijssel | EWC2, EWC19, EWC20 | industrial parks/clusters, advanced trains, highways | energy poverty | Social | Environmental | Economic |
Based on the formulation rules, the matrices for the regions in IS24HC are formed in
Table 9.
Table 9. IS2H4C regions calculated Matrix A.
| REGION’S NAME | Basque Country | Frankfurt Rhein Main | Izmir |
Overijssel |
|---|
| NUTS24 | ES21 | DE71 | TR31 | NL21 |
| NUTS3 (if applicable) | - | DE712 | - | - |
| COUNTRY
| SPAIN | GERMANY | TURKEY | NEDERLANDS |
| 1. EWC112 | 0,5
| 0,5
| 1,0
| 0,5
|
| 2. EWC2
| 0,5
| 0,7
| 0,7
| 1,0
|
| 3. EWC3
| 1,0
| 0,5
| 0,5
| 0,5
|
| 4. EWC4
| 0,5
| 0,5
| 0,5
| 0,5
|
| 5. EWC5
| 1,0
| 0,5
| 1,0
| 0,5
|
| 6. EWC6
| 0,5
| 0,5
| 0,5
| 0,5
|
| 7. EWC7
| 0,5
| 1,0
| 0,5
| 0,5
|
| 8. EWC8
| 0,5
| 0,5
| 0,5
| 0,5
|
| 9. EWC9
| 0,5
| 0,5
| 0,5
| 0,5
|
| 10. EWC10
| 0,5
| 1,0
| 0,5
| 0,5
|
| 11. EWC11
| 0,5
| 0,5
| 0,5
| 0,5
|
| 12. EWC12
| 0,5
| 0,5
| 1,0
| 0,5
|
| 13. EWC13
| 0,5
| 0,5
| 0,5
| 0,5
|
| 14. EWC14
| 0,5
| 0,5
| 0,5
| 0,5
|
| 15. EWC15
| 0,5
| 0,5
| 0,5
| 0,5
|
| 16. EWC16
| 0,5
| 0,5
| 0,5
| 0,5
|
| 17. EWC17
| 0,5
| 0,7
| 0,7
| 0,5
|
| 18. EWC18
| 0,5
| 0,5
| 0,5
| 0,5
|
| 19. EWC19
| 0,5
| 1,0
| 1,0
| 1,0
|
| 20. EWC20
| 1,0
| 1,2
| 0,7
| 1,0
|
| 21. WASTEWATER
| 0,7
| 0,7
| 1,2
| 0,5
|
| 22. SLUDGE
| 0,7
| 0,7
| 1,2
| 0,5
|
| 23. ELECTRICITY
| 0,5
| 1,2
| 1,0
| 1,0
|
| 24. HEATING
| 0,5
| 1,2
| 1,0
| 1,0
|
Given the calculated matrix A of
Table 9, the same potential synergies would have different priorities in each of the four regions. Indicatively:
• Municipal waste (20) synergies were of high priority in Frankfurt Rhein Main, but this was not the case for Izmir.
• Wastewater (21) synergies are of high priority in Izmir; however, this is not the case for Overijssel.
• Electricity (23) synergies are of high priority in Frankfurt Rhein Main, but this is not the case in Basque Country.
Correspondingly, different conclusions can be drawn from the calculated Matrix B in
Table 10, according to the different impacts of the same synergies in the four regions. Indicatively:
• For Overijssel a synergy that contributes to job creation is of high priority.
• In Izmir, reclaimed water synergies are classified as slightly more important than landfill reduction.
Table 10. IS2H4C regions calculated Matrix B.
| REGION’S NAME | Basque Country | Frankfurt Rhein Main | Izmir |
Overijssel |
|---|
| NUTS24 | ES21 | DE71 | TR31 | NL21 |
| NUTS3 (if applicable) | - | DE712 | - | - |
| COUNTRY
| SPAIN | GERMANY | TURKEY | NEDERLANDS |
| Energy consumption (X1)
| 0,5
| 0,7
| 0,6
| 0,6
|
| Reclaimed water (X2)
| 0,6
| 0,6
| 0,7
| 0,5
|
| Landfill reduction (X3)
| 0,5
| 0,6
| 0,6
| 0,5
|
| GHG emissions (X4)
| 0,7
| 0,7
| 0,7
| 0,7
|
| Jobs created (X5)
| 0,4
| 0,4
| 0,4
| 1,0
|
| GDP growth (X6)
| 1,0
| 1,0
| 1,0
| 0,4
|
Potential use cases of proposed matchmaking framework
The proposed regional matchmaking framework can be exploited mainly at the two user levels as follows:
Industry/organization perspective use case
User is a company representative e.g. process engineer, R&D manager, etc.
• Step 1: User registers and fills in the questionnaire for the region to which the organization belongs.
• Step 2: User fills in data for its resources/waste.
• Step 3: The user can search for recommendations of potential synergies based on their input(s)/output(s) waste/service (s). A list of all the “technical” feasible matches will be displayed, with a preliminary prioritization performed, based on the “magnitude” of the flows in the specific region (Level 2, Matrix A).
• Step 4: The user can request the calculation of the regional impact factor (Level 3, Matrix B) and have a relevant total prioritization of all available potential synergies resulting from Step 3.
Regional perspective use case
The user is a regional representative, for example, manager, government, and association. This case requires that at least some organizations in the region have already filled in data for their resources/waste/services (use case 1: Industry/Organizational level).
• Step 1: User registers and fills in data for the region user represents.
• Step 2: Users can search for recommendations for potential synergies between all the companies within the region, based on specific waste types or other criteria. A list of all the “technical” feasible matches is displayed, with a first prioritization performed, based on the “magnitude” of the flows in the specific region (Level 2, Matrix A).
• Step 3: The user can request the calculation of the regional impact factor (Level 3, Matrix B) and have a relevant total prioritization of all available potential synergies resulting from Step 3.
The difference here is that the user has an overview of all the potential synergies between all the companies within the region and makes decisions based on the total strategic regional criteria,
not based on the interest of a specific company.
Discussion and conclusion
This study aims to introduce local and regional dimensions that enhance the matchmaking framework developed in previous studies to identify and pre-assess UIS synergies, so that they can be aligned and to support the systemic regional approach of Hubs4Circularity. The same synergies in terms of waste streams and technological aspects may have different priorities, results, and impacts in different regions that have their specific development strategies, regional settings, local characteristics, resources and waste, and special requirements and challenges. To depict these different regional settings, two matrices were proposed, which were calculated for each region based on regional information retrieved by a relevant questionnaire, and they were used by the matchmaking framework to prioritize the recommendations of potential synergies. The proposed framework was demonstrated in four regions of the IS2H4C project.
There are several assumptions made and limitations in the proposed framework concerning the accuracy with which we approach regional factors, flow quantities, priority of uses, and other technical aspects such as the potential correlation and overlap of variables and prioritization between the different levels. Concerning the double prioritization attempted via Level 1 (Matrix A) and Level 2 (Matrix B), there are two main challenges: (1) If the weights have a wide range of different values, the prioritization may downgrade solutions that are much larger in volume/quantity than others; (2) the special case in which a specific resource has a small presence in a region may not necessarily indicate less importance of this flow, but the opposite, a criticality. Furthermore, there is extensive research on regional factors, including economic, environmental, and social aspects, as the three main dimensions of regional development that affect a region’s status and development path.7,8 This discussion, referring mainly to regional science, goes beyond the scope of this study, but at the same time creates great potential for future research to enhance the questionnaire approaching regional dynamics to a deeper and more accurate level. The aim of this study was to create a first simplified form setting a baseline, as an introduction of regional and local aspects to matchmaking frameworks; therefore, only some specific indicative and commonly recognized aspects related to resource and waste management, infrastructure, challenges, and strategy dimensions are taken into consideration.
Future research should clearly prioritize expanding this regional context while maintaining an equilibrium between the quality of granular data and practical issues (e.g., unavailability of data, resistance, challenges in depicting strategy aspects into parameters) to collect valuable information. The overall approach will be improved in terms of which parameters are considered and how the two matrices are calculated by further research and validation within the IS2H4C Horizon Europe project and other projects beyond. Additionally, there are several domains -beyond regional dimensions- that this study can be enhanced in future research, such as: (1) specializing and improving the double prioritization of the potential synergies; (2) considering the volume of the potential synergies as well beyond the prioritization of level 2, including comparison of flows’ sizes using mapping between different units (applying normalization using Min–Max or Z-score, or transforming the commonly recognized units, tons for solid waste, m3 for water, and kWh for energy to common equivalent units such as tons, or in the future based on a common output such as quantity per ton of produced product); (3) integrating the dimension of time (e.g., duration and exchange rate of the waste) and seasonality of resources.
Hub 4 Circularity is expanding IS and UIS beyond environmental engineering, integrating regional and social sciences into studies concerning circular transition. Local and regional dimensions are crucial for successful implementation, sustainability, and maximization of the impact of UIS synergies. The main purpose of this study is to define a baseline approach that touches these regional dimensions, transforms them into something concrete and exploitable in terms of digital tools, and creates a pathway for further specialization and improvements in this domain.
Ethics and consent
The four participants, upon answering the questionnaire, have checked the mandatory box of statement as “I understand and agree to the above” to consent text: "This form does not contain personal and sensitive data. The responses relate to regional data and will be used for research purposes and potential scientific publications related to synergies based on regional needs on I-US, under the project IS2H4C funded by EC. Data will be stored to online sheets. Users can request the data. Data will be available upon publication. Data do not contain sensitive and personal information. Answers are anonymous and refer to regions." No other ethical approval and consent were required.







