1. Introduction
In recent years, the quest for sustainable industrial practices has intensified, fuelled by growing environmental concerns and the need to replace conventional petrochemical-based products with eco-friendly alternatives. Rhamnolipids, a type of biosurfactant produced by certain bacterial species, have garnered significant attention for their potential in sectors like cosmetics, pharmaceuticals, agriculture, and environmental remediation, due to their biodegradability, low toxicity, and efficacy across various environmental conditions.1–3 Structurally, rhamnolipids are composed of rhamnose sugar molecules linked to fatty acid chains, endowing them with both hydrophilic and hydrophobic properties, which enables them to reduce surface and interfacial tension in diverse formulations.4–6
Pseudomonas aeruginosa is traditionally the primary bacterium used for rhamnolipid production, but its pathogenic nature poses challenges for large-scale applications, necessitating biosafety protocols and complicating commercialization.7,8 To address this, researchers have explored alternative, non-pathogenic microorganisms capable of producing rhamnolipids efficiently. These alternatives include strains such as Pseudomonas putida and Pseudomonas gessardii, both of which exhibit promising rhamnolipid yields and show adaptability to different carbon sources, including renewable substrates like lignocellulosic sugars.9–11 Using such alternative strains can not only reduce health risks but also facilitate regulatory approval and lower production costs by enabling the use of agricultural by-products as feedstocks.12–14
Among non-pathogenic hosts, P. putida KT2440 is particularly attractive because it is a certified safety strain with robust central metabolism, high tolerance to solvents and stress, and a growing synthetic biology toolbox. However, P. putida does not naturally produce rhamnolipids; production requires heterologous expression of rhamnolipid biosynthetic genes, commonly implemented on plasmids in early-stage strain development. Plasmid-based expression can deliver relatively high titers but depends on antibiotics for plasmid maintenance, which is incompatible with industrial-scale production due to regulatory, environmental, and cost constraints.11,15,16 Consequently, industrially viable processes must eventually rely on chromosomally integrated, antibiotic-free strains, which generally exhibit lower titers than their plasmid-based predecessors.17–19 This trade-off between biosafety/regulatory compliance and productivity is central to the present work.
Optimizing the fermentation process for each strain is crucial for enhancing rhamnolipid yield while managing operational challenges such as foaming, a common issue in biosurfactant production. Precise control over factors like pH, temperature, and nutrient concentrations is essential to stabilize the process and maximize yields.20–22
Carbon source selection adds a further layer of complexity. Many of the highest rhamnolipid titers reported to date are achieved with mixed sugar–oil systems, in which vegetable oil or other lipid-rich substrates supplement or replace sugars, directly feeding fatty acid precursors and alleviating metabolic bottlenecks.23–27 In contrast, industrial processes based on glucose as the sole carbon source are attractive from a logistics, control, and downstream processing perspective, especially when future feedstocks may include second-generation lignocellulosic sugars. However, glucose-only fermentation makes rhamnolipid synthesis metabolically more demanding: both the rhamnose and fatty acid moieties must be derived from a single substrate, typically resulting in lower titers and yields.11,28 Understanding the environmental and economic consequences of such glucose-only, non-pathogenic processes is therefore critical if they are to compete with mixed-substrate routes.
To date, most rhamnolipid studies focus either on strain engineering and fermentation performance—often using plasmid-based systems and antibiotics—or on process-level assessments that implicitly assume industrially idealized configurations without explicitly addressing how realistic strain properties and antibiotic use influence sustainability. In this context, P. putida KT2440 emerges as a non-pathogenic workhorse whose engineered derivatives can be evaluated under conditions that approximate industrial processes, while still relying on plasmid-based expression systems during pilot development. This creates an inherent mismatch between the experimental reality (plasmid + antibiotics) and the industrial target (genome-integrated, antibiotic-free), which must be clearly acknowledged and analysed.
To further evaluate the environmental and economic sustainability of rhamnolipid production, LCA and LCC are employed. LCA identifies environmental hotspots, such as stages with high water consumption or greenhouse gas emissions, while LCC assesses economic hotspots, such as costs linked to raw materials and labour. This dual approach provides a comprehensive view of the sustainability profile of rhamnolipid production, highlighting opportunities for resource efficiency, energy management, and automation to reduce both environmental and financial impacts.
A key component of scaling rhamnolipid production is process simulation. Pilot data collected for strains of P. putida provide a foundation for simulating production at various scales. These simulations help determine the production scale at which economic viability aligns with sustainability targets, thereby supporting data-driven decisions for industrial-scale production.
Rhamnolipids, although promising as eco-friendly biosurfactants, face several challenges when it comes to sustainable, large-scale production. The production process is notably resource-intensive, both in terms of environmental impact and economic cost. One of the main environmental challenges stems from the fermentation stage, where microbial cultures are cultivated to produce rhamnolipids. This stage requires significant inputs of water, energy, and specific substrates, often derived from agricultural sources, which contribute to greenhouse gas emissions and water scarcity concerns.20,29 The heavy reliance on energy throughout the fermentation process, for controlling temperature, pH, and dissolved oxygen (DO) levels, further adds to the carbon footprint, making it a critical area for environmental impact mitigation.30–32
Another major hurdle lies in the downstream processing, particularly the purification of rhamnolipids. Purification involves several steps, including centrifugation, extraction, and drying, each of which demands additional energy and generates waste. Solvent extraction, commonly used to isolate rhamnolipids from the fermentation broth, not only consumes significant quantities of chemicals but also results in solvent waste, which presents disposal and environmental challenges.33 Moreover, due to the high foaming tendency during fermentation, antifoam agents are often required, which adds complexity to the process and increases the need for further separation steps, complicating the sustainability of the purification stage.34
From an economic perspective, the high operational costs associated with both fermentation and purification represent significant barriers to commercial feasibility. The requirement for specialized equipment to maintain precise fermentation conditions, alongside the labour-intensive nature of the purification steps, drives up production costs. Additionally, the cost of substrates and raw materials, many of which are derived from agriculture or petroleum, can fluctuate, further impacting economic sustainability. Costly antifoam agents and solvents add to operational expenses, creating an economic burden that must be addressed to make rhamnolipid production competitive with synthetic surfactants in the market.
Given these environmental and economic hurdles, addressing resource and cost efficiency in both the fermentation and purification stages is essential. By identifying these critical challenges, researchers and industry stakeholders can explore alternative microbial strains, renewable feedstocks, and advanced technologies to reduce both resource consumption and operational costs, thereby advancing rhamnolipids as a truly sustainable alternative to conventional surfactants.
This study aims to evaluate the sustainability and economic feasibility of rhamnolipid production using engineered P. putida KT2440 and glucose as the sole carbon source, integrating Life Cycle Assessment (LCA) and Life Cycle Costing (LCC). Pilot-scale fermentation data from 30 L and 150 L runs—performed with a plasmid-based system and antibiotics for plasmid maintenance—are used to parameterize process simulations that represent an idealized industrial scenario without antibiotics and with chromosomally integrated rhamnolipid pathways. The resulting discrepancy between experimental and simulated configurations is treated as a key limitation and as a framing element for discussion and future work. Although the generic process flow description includes sugar–oil mixtures to reflect literature-typical rhamnolipid processes, the core of this manuscript is the glucose-only P. putida process. The central scientific and process challenges addressed are therefore: (i) achieving competitive rhamnolipid titers with a non-pathogenic, engineered P. putida strain on glucose-only media, and (ii) understanding how the required transition from plasmid-based, antibiotic-dependent pilots to antibiotic-free, genome-integrated industrial strains affects process design, economics, and environmental performance.
2. Methodology
2.1 Experimental process overview
The experimental process for rhamnolipid production involved pilot-scale fermentation trials under controlled conditions, designed to replicate near-industrial production settings. Data collected during these trials informed both LCA and LCC analyses, establishing a robust Life Cycle Inventory (LCI) that includes input resources, operational conditions, and output emissions.
All pilot fermentations were performed with an engineered, non-pathogenic P. putida KT2440 A2B1 strain carrying the rhamnolipid biosynthetic genes on a plasmid. To ensure plasmid stability, antibiotics for plasmid maintenance were added to the culture media throughout seed train and production fermentations. This configuration is suitable for pilot development but is not acceptable for long-term, large-scale industrial operation. In the present work, these antibiotic-containing pilot runs provide the empirical basis for process modelling (mass and energy balances, kinetic parameters, yields), whereas the simulated industrial scenarios assume a future, plasmid-free, antibiotic-free strain in which the rhamnolipid pathway is integrated into the genome. The implications of this mismatch are explicitly addressed in the LCA/LCC assumptions and in the discussion.
2.1.1 Pilot-scale setup and conditions
2.1.1.1 Fermentation
The pilot-scale fed-batch fermentations were conducted in 30 L and 150 L Frings stainless steel bioreactors, with maximum working volumes of 22 L and 100 L, respectively. These systems were equipped with bottom-mounted rotors featuring three Rushton impellers with six blades each to ensure adequate mixing and mass transfer and with controlled conditions to optimize microbial growth and rhamnolipid production.
Fermentations were maintained at a constant temperature of 30°C and a pH of 6.8, controlled via automated addition of NH4OH (Sigma-Aldrich Cat# 221228 - Ammonium hydroxide solution, ACS reagent, 28.0-30.0% NH3 basis, CAS: 1336-21-6) and H3PO4 (Sigma-Aldrich Cat# 695017 - Phosphoric acid, ACS reagent, ≥85 wt. % in H2O, CAS: 7664-38-2). The dissolved oxygen (DO) level was maintained at a setpoint of 40% saturation through a control cascade involving agitation speed, aeration rate, and bioreactor head pressure. Rhamnolipid production was induced at approximately 4 hours Elapsed Fermentation Time (EFT) by the addition of m-toluic acid (Sigma-Aldrich Cat# T36609 - m-Toluic acid ReagentPlus®, 99%, CAS: 99-04-7). To ensure stability and avoid ethanol toxicity at scale, the inducer was prepared by first dissolving it in ethanol (Sigma-Aldrich Cat# E7023 - Ethanol, pure ≥99.45%, for molecular biology, 200 proof, suitable for RNA/DNA extraction, CAS: 64-17-5) at a high concentration, followed by dilution in a carbon-free batch medium before being pumped into the fermenter. All fermentation and downstream processing trials were carried out at the Bio Base Europe Pilot Plant facilities in Belgium.
Table 1 showcases the essential operational parameters maintained during the trials, including specific settings for aeration, agitation, and sterilization.
Table 1. Summary of pilot-scale setup and experimental conditions.
| Parameter | Description |
Value/Range |
|---|
| Bioreactor Volume | Capacity of pilot bioreactors | 30-150 L |
| Temperature | Optimal temperature for microbial growth | 30°C |
| pH | Controlled pH level | 6.8 ± 0.2 |
| DO | Maintained through aeration | 40% saturation |
| Aeration Rate | Air supply rate to maintain oxygen levels | 0.5 vvm |
| Agitation Tip Speed | Stirring rate to ensure even nutrient distribution | 0.74 – 5.91 m/s |
| Inoculum Preparation | Pre-cultured under sterile conditions for 24 hours | 5% of total volume |
| Antifoam Agent | Added as needed to control foaming | 0.1-0.5% v/v batch volume |
The microbial strain used for all pilot-scale production runs was the engineered, non-pathogenic P. putida KT2440 A2B1 carrying a plasmid-borne rhamnolipid pathway. Antibiotics for plasmid maintenance were added to the seed and production media in all pilot runs. A standardized, two-stage inoculum train was employed to ensure a consistent physiological state of the cells prior to inoculation of the main bioreactors. The first seed stage was initiated in 500 mL shake flasks containing 100 mL of culture medium, which were incubated under optimal growth conditions. Following this initial cultivation, a second seed step was performed to generate the required volume for the main fermentation. The final inoculum, constituting 5% (v/v) of the initial batch volume, was then transferred aseptically to the production bioreactors.
The use of antibiotics and a plasmid-based expression system is acceptable and common practice at pilot scale, but it is not representative of an industrially deployable process due to regulatory, cost, and environmental constraints. In this study, these pilot fermentations serve to generate quantitative data on growth, substrate consumption, foaming behaviour, and rhamnolipid titers under glucose-only feeding. These data underpin the kinetic model and the process simulation, which are then adapted to represent a future industrial scenario with a genome-integrated, antibiotic-free production strain. The consequences of this transition, particularly the typically lower titers observed after chromosomal integration, are discussed qualitatively in the context of process economics and environmental performance.
These conditions ensured consistent microbial activity and rhamnolipid yield while minimizing contamination risks. For instance, antifoam agents were intermittently added to control high foaming during fermentation, helping to maintain stable operation and prevent overflow.
The production of rhamnolipids in this study relies on glucose as the sole carbon and energy source for P. putida KT2440 A2B1. Glucose (Dextrose Monohydrate M, Tereos, Aalst, Belgium, CAS: 50-99-7) provides carbon and energy for both biomass formation and rhamnolipid biosynthesis.
Table 2 summarizes the substrate utilization and biomass formation parameters observed during the fermentations.
Table 2. Initial conditions and yield.
| Strain | Substrate | Initial concentration (g/L) | Biomass yield
(CDW, g/L) |
Rhamnolipid yield (g/L) |
|---|
| P. putida KT2440 A2B1
| Glucose | 20 | 21.6–38.6 | 1.9–2.21 |
Biomass formation involves substrate assimilation into cellular components and energy generation through central metabolic pathways. The stoichiometric reaction for biomass production used in our simulations is represented as follows:
(Eq. 1)
For rhamnolipid production, the process involves converting the carbon source into rhamnose sugar moieties and hydroxyalkanoyl fatty acids, which form the rhamnolipid structure. The stoichiometric equations for rhamnolipid biosynthesis are as follows:
(Eq. 2)
The conversion efficiencies varied across different experimental runs, yielding a conversion efficiency between 1.29% and 11.05%. The fermentations were conducted under controlled conditions to optimize biomass and rhamnolipid production. Key operating parameters included a temperature of 30°C for P. putida, a pH of 6.8, and DO levels set at 40%. Fed-batch strategies were employed to maintain substrate availability and avoid inhibitory effects. Excessive foaming was managed using antifoam addition and pressure adjustments.
2.1.1.2 Downstream processing
Upon completion of the fermentation, the broth was subjected to a multi-step downstream processing (DSP) cascade designed to separate the rhamnolipids from biomass, proteins, and other media components. The entire DSP train was designed to address the well-known bottlenecks in biosurfactant purification, such as stable emulsions and high-water content.
Cell Removal (Microfiltration): The initial biomass removal was performed using a Sani Vibro pilot-scale vibrating membrane filtration unit equipped with a 0.45 μm polyethersulfone (PES) membrane. To maximize the recovery of extracellular and cell-associated product, the microfiltration was operated with continuous diafiltration, washing the retentate with three volumes of reverse osmosis (RO) water.
Protein Removal (Ultrafiltration): The cell-free permeate from the microfiltration step was then directed to an ultrafiltration (UF) unit. This step was conducted using a cross-flow filtration system fitted with a 10 kDa molecular weight cut-off (MWCO) PES spiral wound membrane. The primary objective of this UF step was the removal of high molecular weight proteins. This pre-purification was critical not only for increasing final product purity but also for improving the processability of the stream by preventing the formation of stable emulsions during the subsequent solvent extraction phase.
Product Concentration (Nanofiltration): Following protein removal, the rhamnolipid-containing UF permeate was concentrated using nanofiltration (NF). This was performed on the same cross-flow filtration unit, employing a membrane designed to retain the rhamnolipid micelles while allowing water and salts to pass through. This step served to significantly reduce the process volume, thereby decreasing the required quantity of solvent for the final extraction step.
Solvent Extraction: The primary purification method involved liquid-liquid extraction of the aqueous NF concentrate with ethyl acetate. To facilitate phase separation and break any residual emulsions, anhydrous magnesium sulphate (MgSO4) was added to the mixture. After separation, the organic phase containing the rhamnolipids was collected, and the ethyl acetate was removed by vacuum distillation at a controlled temperature of 40°C to yield a viscous, crude rhamnolipid extract.
2.1.2 Data collection for LCI
Comprehensive data collection during the pilot trials provided the foundation for the LCI, covering all inputs, outputs, and monitoring tools essential for accurate LCA and LCC analyses.
Table 3 summarizes the types of data collected, including resource inputs like water and energy, fermentation outputs such as waste streams and emissions, and additional operational conditions like fermentation time and inoculum preparation. The table also lists monitoring tools and procedures used to ensure precision in data collection.
Table 3. Data collection for LCI – Inputs, outputs, and monitoring procedures.
| Category | Component | Description |
Measurement method |
|---|
| Inputs | Water | Used for media preparation and cooling | Measured continuously |
| Energy | Power for aeration, stirring, temperature control | Monitored by energy loggers |
| Substrates | Primary and secondary feedstocks for microbial growth (e.g., sugars) | Quantified per batch |
| Nutrients | Micronutrients essential for microbial metabolism | Tracked per batch addition |
| Antifoam Agents | Added to manage excessive foaming | Volume recorded per addition |
| Outputs | Rhamnolipid Yield | Total rhamnolipids produced per batch | Quantified post-fermentation
|
| Waste Streams | Spent broth and other by-products | Collected and quantified |
| Emissions | CO2 from microbial respiration | Measured using gas sensors |
| Operational Conditions | Fermentation Time | Duration of each fermentation run | 48-72 hours |
| Inoculum Preparation | Pre-cultured inoculum added to bioreactor | Sterile conditions, 24 hours |
| Monitoring Tools & Procedures | Data Logging Equipment | Continuous monitoring of water, energy, and nutrient inputs | Standardized data loggers |
| Broth Sampling | Regular sampling for microbial and product analysis | Performed every 6 hours |
| Post-Process Analysis | Product purity verification post-fermentation
| Chromatography & spectrometry |
This data collection methodology established a detailed LCI that captured all significant resources, operational parameters, and emissions. The information in
Table 3 is integral to the LCA and LCC analyses, providing a basis for understanding the environmental and economic impacts of rhamnolipid production at pilot scale.
2.2 Process simulation for scale-up
The process simulation for rhamnolipid production aims to evaluate the feasibility of scaling the process from pilot to larger production volumes under an industrially relevant, antibiotic-free configuration. Using both experimental pilot data and modelling tools, the simulation provides insights into the environmental and economic impacts at various production scales for a glucose-only P. putida process. This section outlines the simulation approach, software tools used, key assumptions, and scenarios considered for scale-up. Simulation Setup and Software Tools
This study employs SuperPro Designer v14 (Intelligen, USA) to simulate the pilot-scale production of rhamnolipids using P. putida KT2440 A2B1. The simulation, based on experimental data from fermentations conducted at 30 L and 150 L scales with plasmid-based expression and antibiotic selection, was designed to model an industrial process in which the rhamnolipid pathway is stably integrated into the chromosome and no antibiotics are used. Python was utilized to develop custom scripts for data processing, enabling efficient analysis and scenario testing. Together, these tools provided a flexible and accurate modelling framework that integrated substrate utilization, stoichiometric reactions, yields, and process conditions, allowing for simulation of multiple production scales based on pilot-scale data. P. putidaIndustrial-Scale Assumptions
To bridge between the plasmid-based, antibiotic-dependent pilot runs and an industrially acceptable process, several assumptions were introduced:
• The simulated industrial process assumes a P. putida KT2440-derived production strain with chromosomally integrated rhamnolipid biosynthetic genes.
• No antibiotics are included in the culture media or utilities at industrial scale; antibiotic use is restricted to pilot-scale development and is not propagated into the LCA/LCC inventory.
• Fermentation yields, foaming behaviour, and process kinetics are based on the pilot data, which were obtained with plasmid-based expression. In practice, titers are typically lower for genome-integrated strains, meaning that the present simulation likely overestimates productivity and underestimates the environmental and economic burdens of a fully industrial, antibiotic-free process.
• The carbon source strategy for all quantitative simulations is glucose as the sole carbon source. Where mixed sugar–oil media appear in generic flow descriptions, these are treated as literature-typical comparators and not as the basis for the glucose-only LCA/LCC results presented in this work.
These assumptions define an idealized industrial scenario that serves as a baseline for assessing the potential of glucose-based P. putida processes, while explicitly acknowledging the limitations introduced by using plasmid-based, antibiotic-containing pilot data for parameterization.
2.2.1 Fermentation
Figure 1 shows a generic biotechnological process for the continuous production of rhamnolipids via aerobic fermentation, as implemented in the SuperPro Designer flowsheet. The process is structured into four main blocks: media preparation, fermentation broth preparation, biomass production (seed train), and main production fermentation, followed by transfer to downstream processing. P. putida
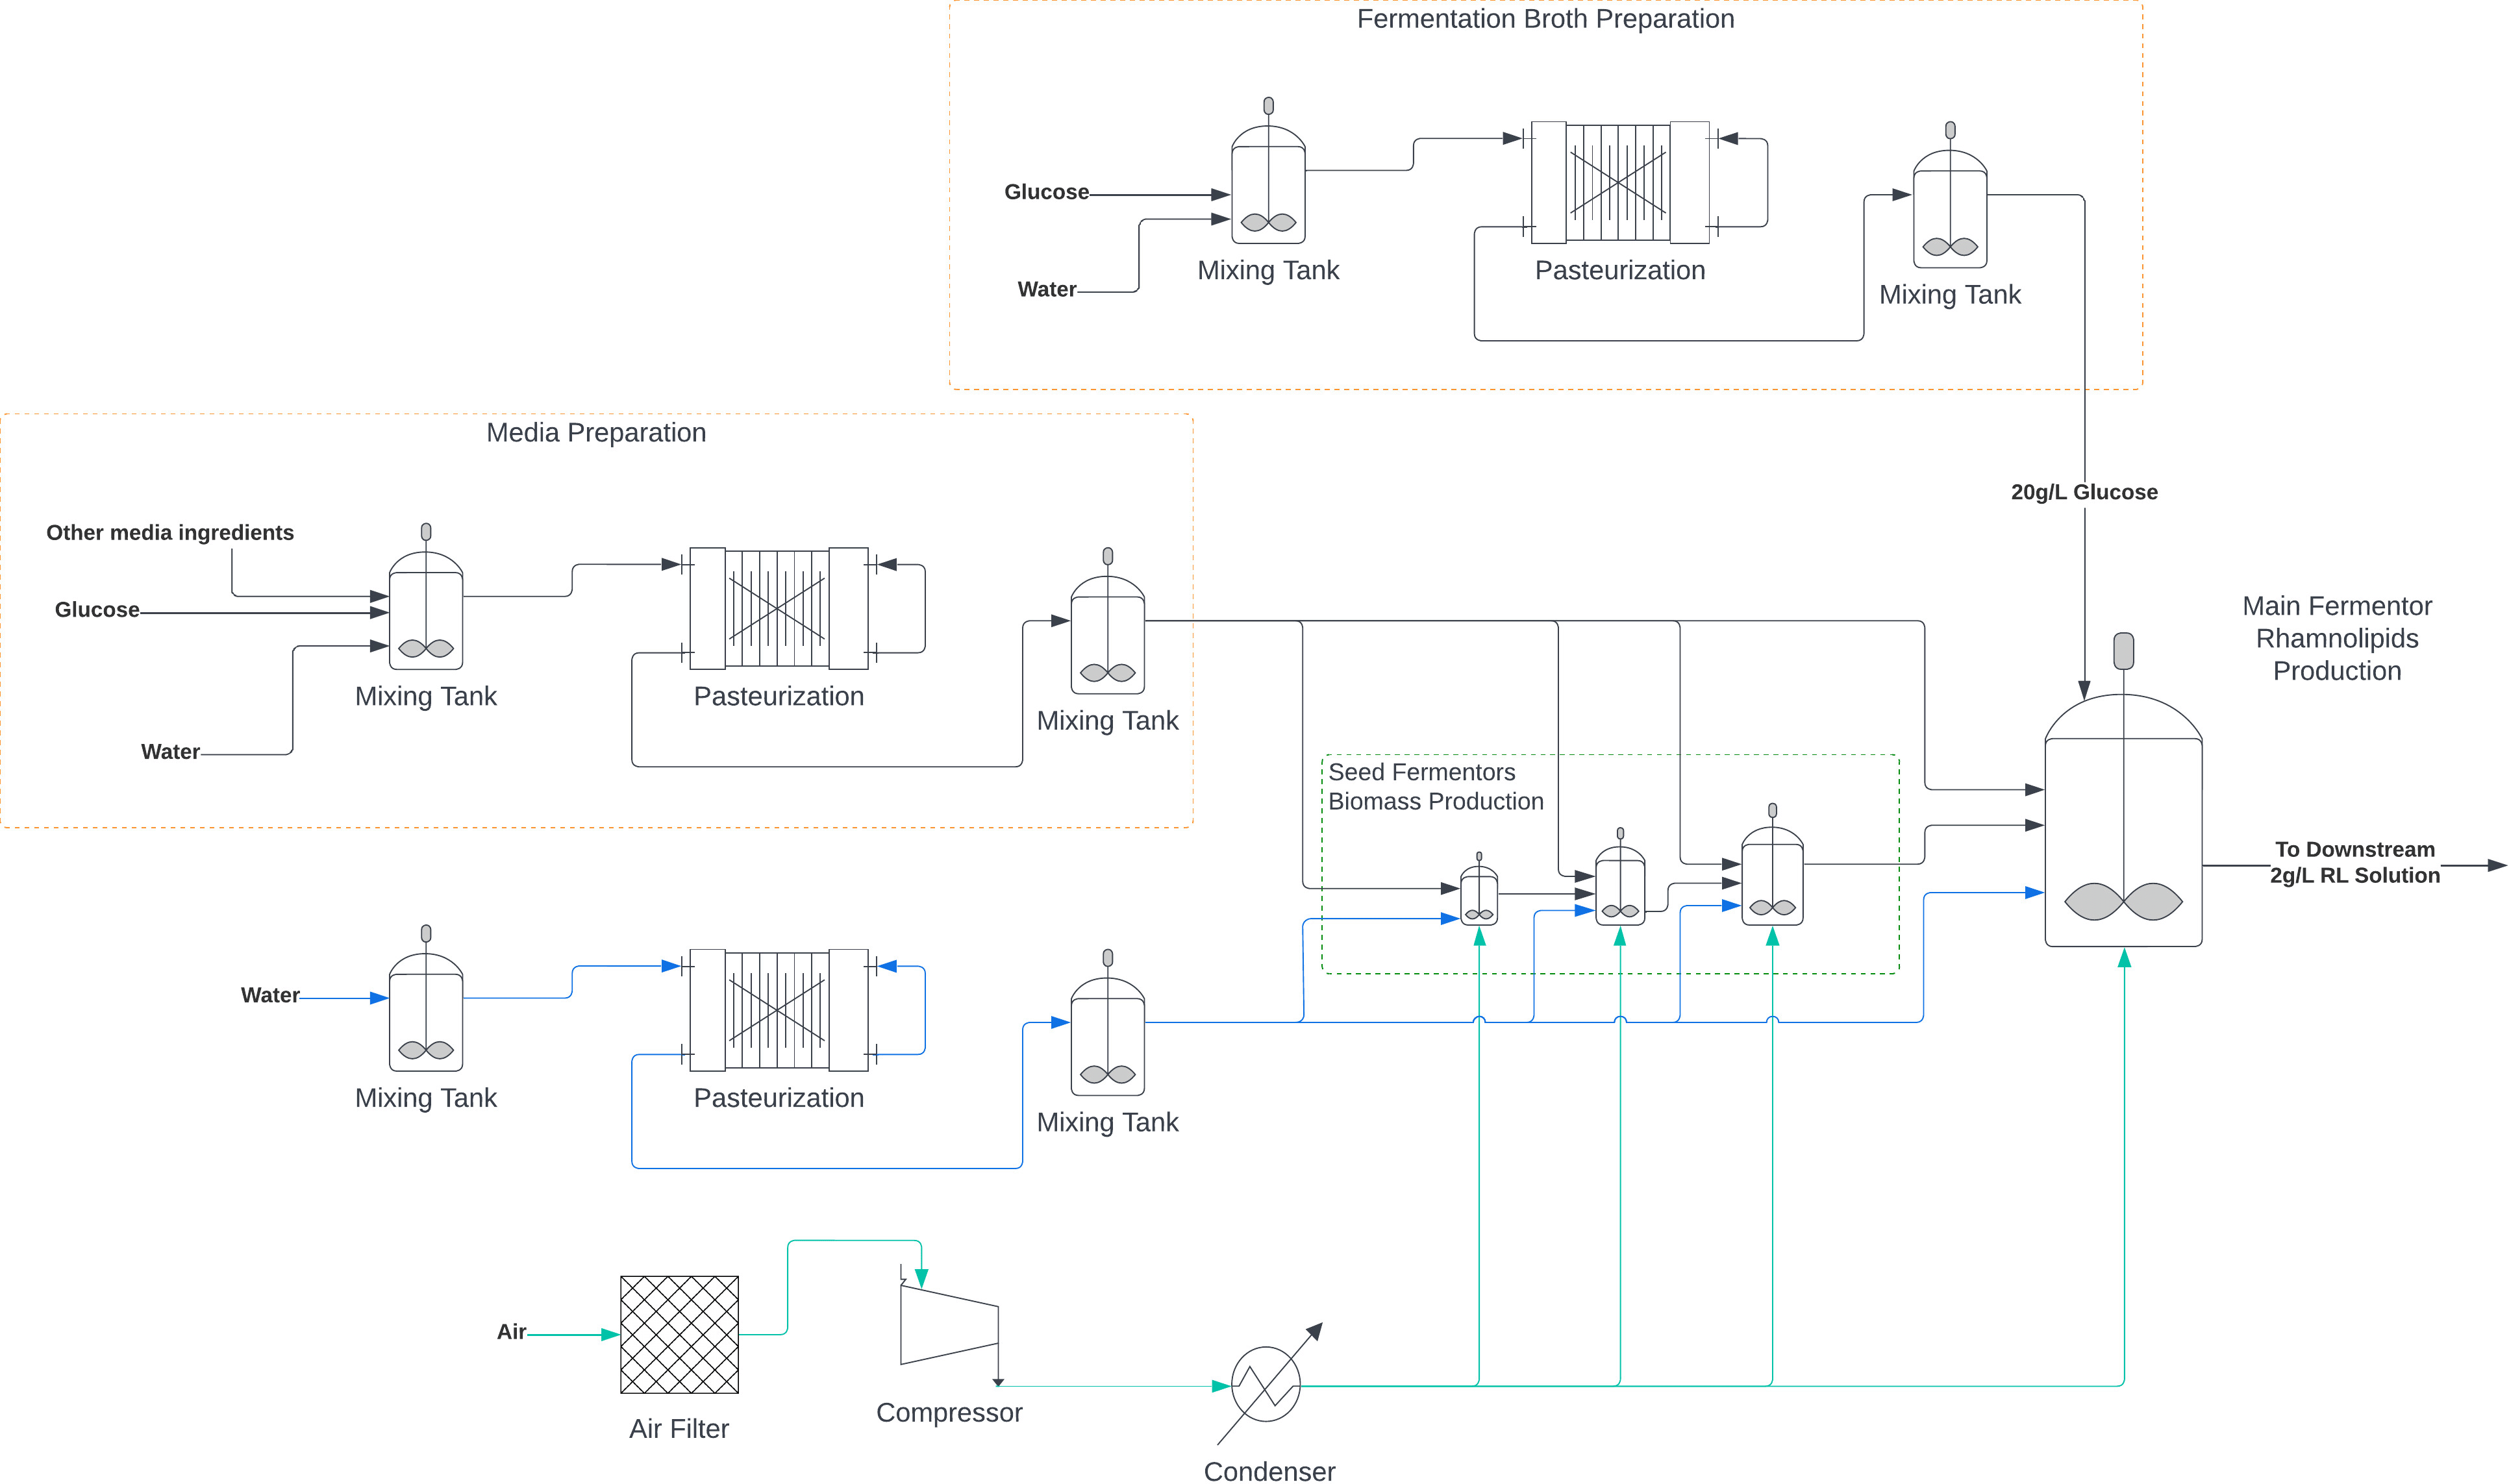
Figure 1. Process flowchart for the continuous production of rhamnolipids via fermentation using P. putida.
In the media preparation step, glucose, process water, and mineral nutrients (only in the pre-inoculum) are mixed in dedicated vessels and subjected to thermal treatment (pasteurization or sterilization, depending on the operation) to ensure sterility before use. In parallel, a fermentation broth preparation line conditions additional glucose-based medium required to sustain the fed-batch and continuous operations. For the fed-batch phase, the concentrated feed stream contains 600 g/L of glucose. Both media preparation and broth preparation are modelled as continuous operations with residence times aligned to the overall plant takt time, ensuring a steady supply of sterile, glucose-based feed to the seed and production fermenters.
The biomass production section consists of three sets of four seed bioreactors of increasing volume. This stepped seed train is designed to generate sufficient biomass under controlled conditions to inoculate the main production fermenters. Each individual seed reactor operates in batch mode over a 50-hour cycle, but the reactors within each set are staggered so that, at the plant level, a quasi-continuous inoculum stream is available for the main fermentation block. The main fermentation, in which rhamnolipid production predominantly takes place, is modelled as a set of eight parallel stirred-tank reactors operating in fed-batch mode, each with a cycle time of 50 hours. Glucose is the sole carbon and energy source in these reactors, supplying both biomass growth and rhamnolipid biosynthesis. Aeration, agitation, and temperature and pH control are configured to match the pilot-scale operating window, scaled appropriately for industrial volumes. The operation of the main fermenters is synchronized with the continuous media and broth preparation steps, such that at any given time a subset of reactors is in the production phase, another in turnaround (cleaning, sterilization, filling), and another nearing harvest, thereby ensuring a continuous flow of fermentation broth to downstream processing.
Auxiliary utilities, including treated water, steam, and compressed air, are integrated into the flowsheet to support media preparation, sterilization, aeration, and cooling. Water streams are conditioned and, where appropriate, pasteurized before entering the process, while air is filtered and compressed to meet oxygen transfer requirements.
This design represents a hybrid between continuous media/broth preparation and staggered fed-batch fermentation, which is commonly adopted in industrial bioprocesses to balance operational robustness with high equipment utilization.
2.2.2 Kinetic modeling of fermentation
To quantitatively analyze the fermentation dynamics and establish a predictive framework for process scale-up, a kinetic model was developed and calibrated against the pilot-scale experimental data. An unstructured kinetic growth model was selected, as this approach effectively captures the macroscopic behavior of the system—namely the concentrations of biomass, substrate, and product—without requiring detailed intracellular metabolic flux information. This modeling choice is particularly suitable for the engineered P. putida KT2440 A2B1 strain, which, unlike the native producer Pseudomonas aeruginosa, is engineered to circumvent complex native regulatory networks such as quorum sensing, thus simplifying the kinetic behavior of product formation.
The model is formulated as a set of ordinary differential equations (ODEs) that describe the mass balances for biomass (
), rhamnolipid product (
), and the primary carbon substrate, glucose (
), within the fed-batch bioreactor.
The rate of change in biomass concentration is described by:
where
is the biomass concentration
,
is the specific growth rate
,
is the specific death rate
, and
is the dilution rate
from the fed-batch
feed.
Rhamnolipid production is modeled using a Luedeking-Piret-type expression, which accounts for both growth-associated and non-growth-associated synthesis:
Here,
is the specific product formation rate
,
is the growth-associated product yield coefficient
, and
is the non-growth-associated maintenance coefficient for product formation
. This formulation provides the flexibility to capture product synthesis during both the exponential and stationary phases of cultivation, a dynamic often observed in biosurfactant fermentations.
Substrate consumption is linked to the metabolic requirements for biomass growth, product formation, and cellular maintenance, as shown in the following equation:
where
is the substrate concentration in the feed
,
and
are the yield coefficients for biomass and product on substrate
, respectively, and
is the maintenance coefficient for substrate consumption
.
The specific growth rate
for P. putida was modeled using a modified Monod equation that incorporates terms for substrate and product inhibition, as well as an initial lag phase, reflecting the observed process dynamics. The inclusion of these terms was empirically driven to accurately represent the experimental data, where high initial substrate concentrations and accumulating product are known to influence microbial physiology. The complete expression for the specific growth rate is:
In this equation, the first term represents standard Monod kinetics for substrate limitation, where
is the maximum specific growth rate
and
is the substrate affinity constant
. The second term
is the inhibition function.
2.2.3 Rhamnolipids purification and solvent recovery
Figure 2 depicts a process flow diagram for the purification of rhamnolipids and recovery of solvent, following the output from the fermentation process. The process can be described in the following steps:
1.
Biomass Separation: Initially, the output stream from fermentation undergoes biomass separation through centrifugation to remove the biomass. The solid biomass is then washed with water and centrifuged again. The supernatants from both centrifugations are subsequently directed through microfiltration to remove any remaining biomass, ensuring a clearer liquid stream.
2.
Drying of Biomass: The separated and washed biomass proceeds to a rotary dryer where it is dried, resulting in dried biomass and an airstream that exits the process.
3.
Protein Hydrolysis: The stream that is rich in rhamnolipids, which is the focus of the process, enters a plug flow reactor (PFR) where it is treated with the enzyme alcalase to hydrolyse any proteins present in the stream.
4.
pH Adjustment: After hydrolysis, the pH of the stream is adjusted using hydrochloric acid (HCl) to prepare for the extraction phase.
5.
Liquid-Liquid Extraction: This step involves the extraction of rhamnolipids using ethyl acetate as a solvent. This process helps separate rhamnolipids from the aqueous phase into the solvent phase.
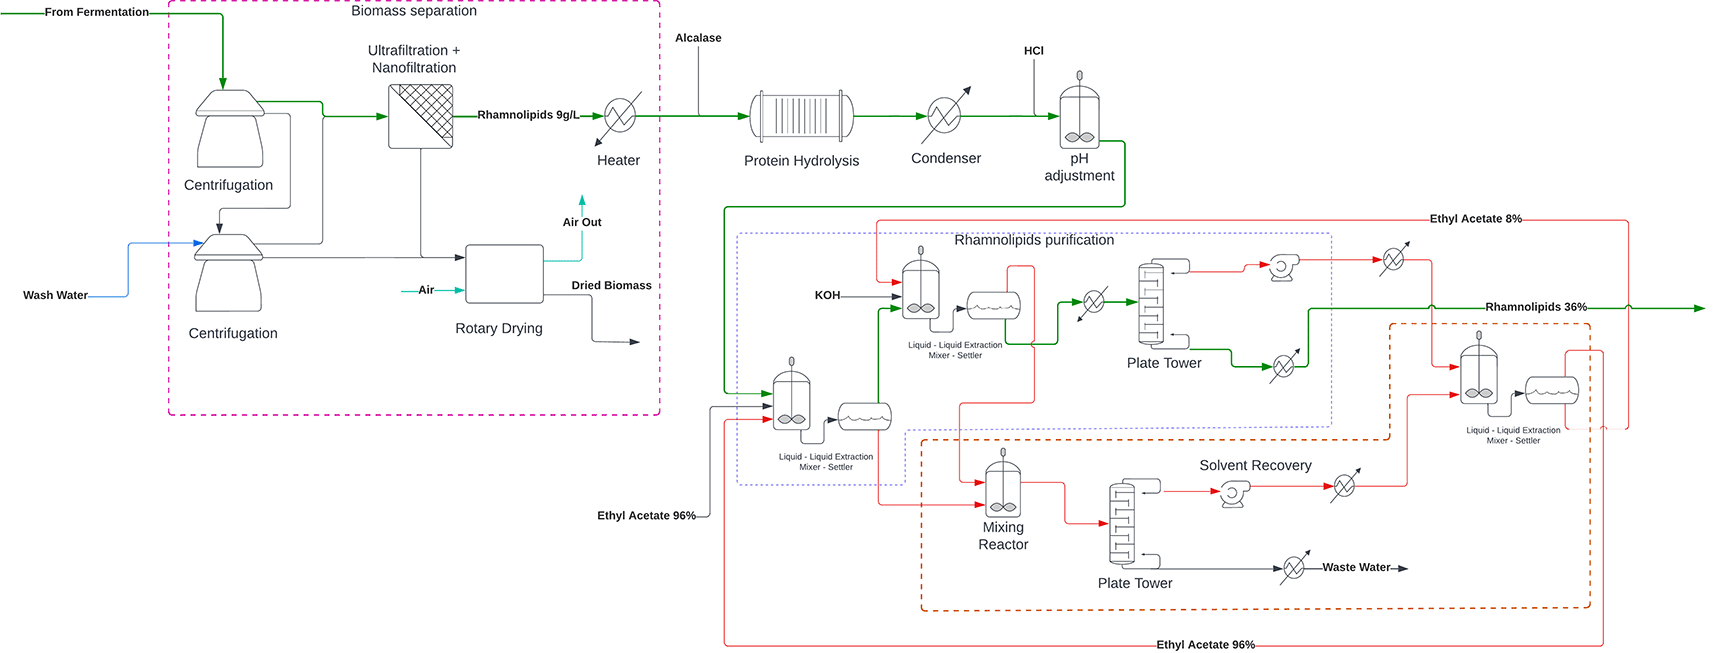
Figure 2. Rhamnolipids purification and solvent recovery.
The downstream processing model is directly aligned with the pilot-scale DSP train described above and does not include any steps specific to antibiotic removal or plasmid-related components, consistent with the assumption of an industrial, antibiotic-free production strain. In reality, an industrial process starting from a plasmid-based system would require additional containment, treatment, and monitoring measures for antibiotic residues and plasmid DNA, which would increase both environmental and economic burdens. These additional requirements are not captured in the present flowsheet and are discussed as a limitation and opportunity for future work.
2.3 LCA
This study assesses the environmental performance of rhamnolipid production via microbial fermentation using a LCA in accordance with ISO 14040 and ISO 14044. The objective is to quantify the environmental impacts associated with producing 1 kg of purified rhamnolipids at the factory gate, identify environmental hotspots, support process optimization, and enable sustainability benchmarking against conventional and bio-based surfactants.
A cradle-to-gate system boundary is applied, covering raw material extraction and production, feedstock cultivation and transport, fermentation, and downstream processing, including separation, purification, and drying. Infrastructure, capital equipment, distribution, use-phase, and end-of-life stages are excluded. The functional unit of 1 kg of purified rhamnolipids ensures comparability across scenarios and scales.
Primary data originate from pilot-scale fermentations conducted in bioreactors of up to 150 L working volume and were scaled to an industrial scenario using SuperPro Designer v14.1. The simulated facility processes 5,000 kg per batch and operates 632 batches per year. Rhamnolipid biosynthesis is based on a genetically engineered Pseudomonas putida KT2440 A2B1. The process model includes full mass and energy balances for media preparation, sterilization, fermentation, centrifugation, extraction, and drying. Life cycle inventories capture raw materials, process water, utilities (electricity and steam), chemical additives, and emissions to air and wastewater.
Background data are sourced from Ecoinvent 3.9, and impact assessment is performed in SimaPro 9.6 using the Environmental Footprint 3.1 (EF 3.1) method. Impacts are characterized at the midpoint level across 16 categories, including climate change, eutrophication, toxicity, water use, resource depletion, acidification, and land use, using datasets representative of average European conditions unless stated otherwise.
Normalization is applied using EF 3.1 global per-capita factors (2010), allowing impacts to be interpreted as shares of average global annual burdens. Uncertainty is assessed through the pedigree matrix approach implemented in SimaPro 9.6, which evaluates data quality across reliability, completeness, temporal, geographical, and technological representativeness, and sample size. Resulting lognormal distributions are used to quantify uncertainty ranges, reported as normalized impact scores with error bars.
Key assumptions include the scalability of pilot-scale yields and recovery efficiencies, climate neutrality of biogenic CO2 emissions in line with EF guidance, and representative estimates of industrial energy demand. No allocation is required, as rhamnolipids are the sole product. Main limitations relate to scale-up uncertainty, the exclusion of site-specific water scarcity indicators, and the omission of infrastructure and capital equipment.
2.4 LCC
The LCC analysis evaluates the economic performance of rhamnolipid production, focusing on material, utility, and labour costs across all process stages. The objective is to identify cost hotspots and assess opportunities for cost reduction while maintaining production efficiency. The system boundary and functional unit are aligned with the LCA, covering media preparation, fermentation, product purification, and solvent recovery, and defined as 1 kg of rhamnolipids (kg RL).
The cost inventory is based on detailed pilot-scale data scaled to an industrial scenario. Material costs include key inputs such as glucose and ethyl acetate, with prices obtained from market databases and project-specific procurement records. Antibiotic and plasmid-related costs are assumed to be zero, reflecting an industrially relevant, chromosomally integrated, antibiotic-free strain. While consistent with the LCA scope, this assumption implies that the LCC underestimates the costs of the pilot-scale configuration, where antibiotics were required. Any industrial process retaining antibiotics would therefore incur additional material and waste-management costs beyond those reported here.
Utility costs are calculated from electricity, steam, and water consumption, using unit prices from EUROSTAT and operational data. Labour costs are estimated from the time requirements of each process stage and standard hourly wages for comparable industrial settings. Fixed costs, including equipment depreciation, are excluded to concentrate on variable costs and better isolate stage-specific economic drivers.
Costs are attributed to individual production stages to highlight their relative contributions. Media preparation is driven primarily by glucose costs, whereas product purification is dominated by labour intensity and utility demand. Sensitivity analyses are performed to examine the influence of key parameters, such as glucose price and solvent recovery efficiency, on overall production costs, providing insight into the economic robustness of the process under changing market conditions.
3. Results
3.1 Process simulation
3.1.1 Fermentation kinetics and model validation
The predictive capability of the kinetic model was validated through direct comparison with the time-series data collected during the pilot-scale fermentation run.
Figure 3 presents an overlay of the model simulation results (solid lines) and the discrete experimental measurements (data points) for the concentrations of biomass, glucose, and rhamnolipids over the 50-hour cultivation period.
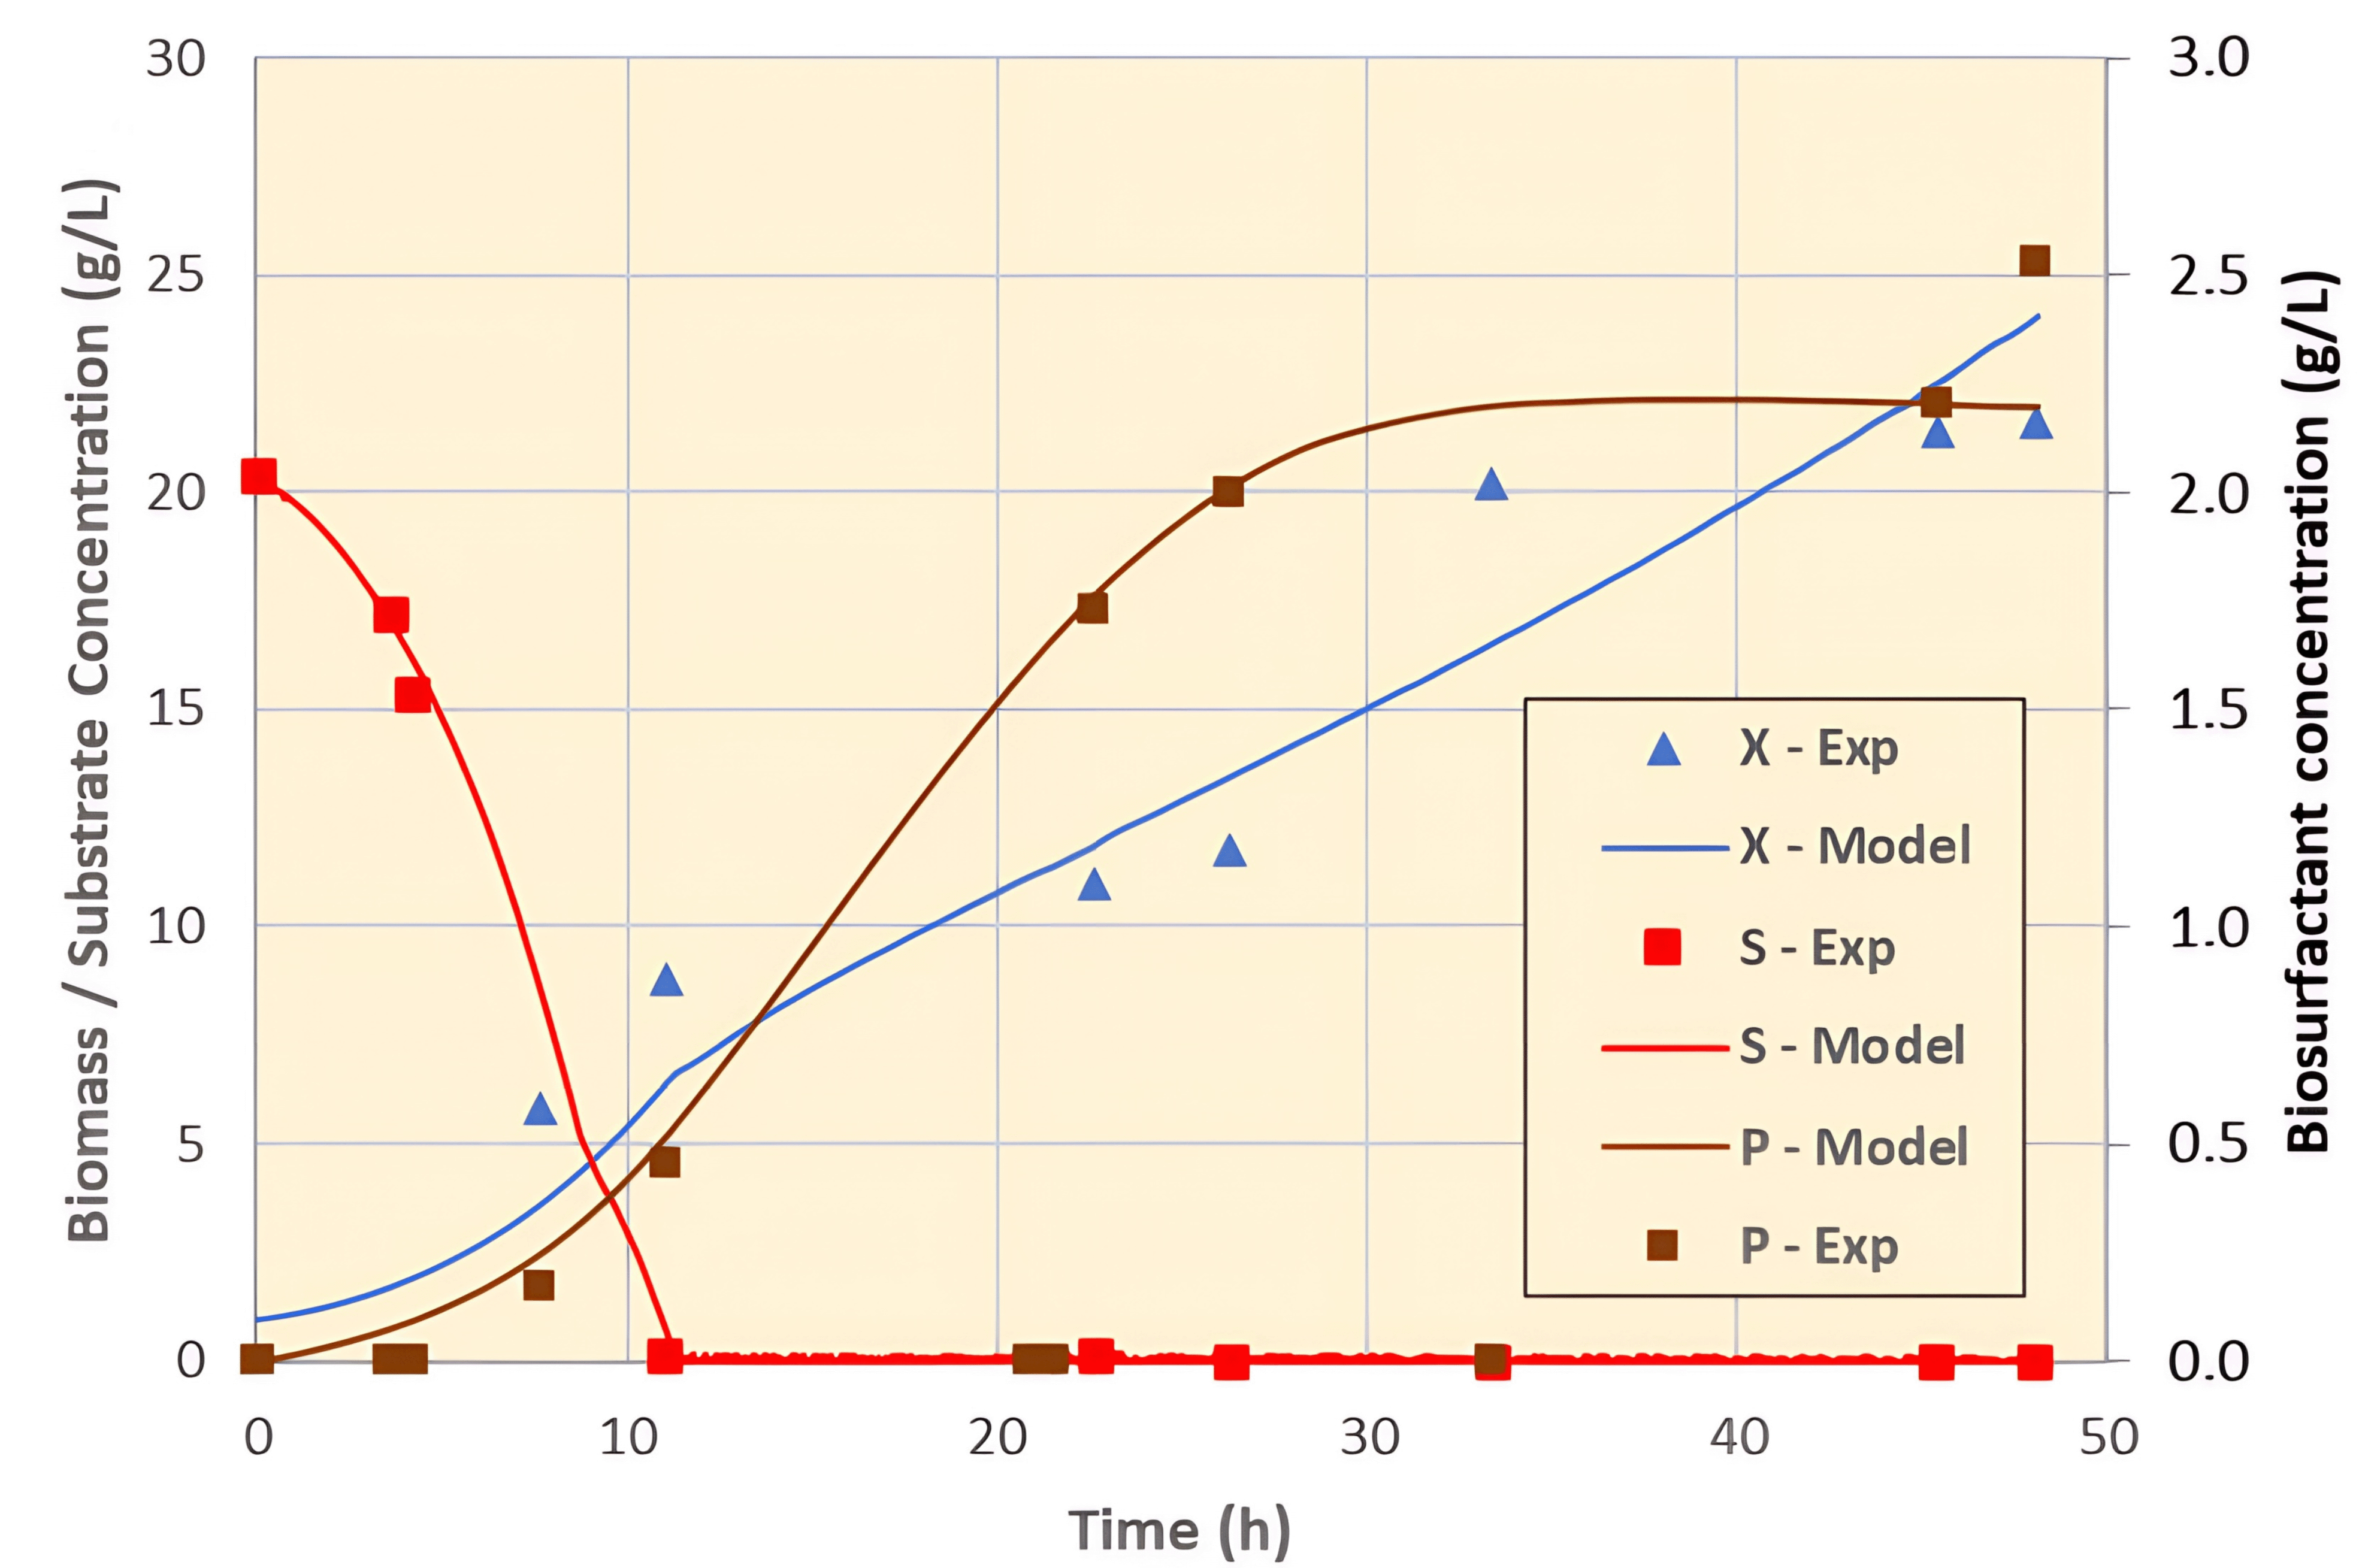
Figure 3. Comparison of experimental data and model results for process fermentation.
A detailed analysis of the graphical comparison reveals a strong agreement between the model and the experimental data across all three key process variables.
•
Biomass Concentration (X): The model demonstrates an excellent fit with the experimental biomass data. It accurately captures the initial lag phase of approximately 8 hours, followed by a period of exponential growth that culminates in a stationary phase. The simulation correctly predicts the final cell density, which reaches approximately 25 g/L, aligning closely with the final experimental measurements.
•
Substrate (Glucose) Concentration (S): The model accurately simulates the profile of glucose consumption throughout the fermentation under glucose-limiting fed-batch conditions. The predicted consumption curve follows the experimental data points, showing a rapid decrease during the exponential growth phase. During the fed-batch phase, glucose is supplied via a controlled feed and is instantaneously consumed, resulting in near-zero residual glucose concentrations in the broth at all times. The initial glucose concentration of approximately 25 g/L is therefore rapidly depleted, and substrate availability remains limiting throughout the run, consistent with its conversion into biomass and rhamnolipids and with the absence of glucose accumulation in the system.
•
Product (Rhamnolipid) Concentration (P): The model successfully reproduces the overall trend of rhamnolipid accumulation. Product formation initiates concurrently with biomass growth and continues into the stationary phase, which empirically validates the use of a mixed-growth-associated model structure. The simulation predicts a final rhamnolipid titer of approximately 2.5 g/L, which is in good general agreement with the experimental endpoint.
Overall, the model provides a robust and quantitatively reliable representation of the pilot-scale fermentation dynamics. While the overall trends are well-captured, minor deviations are observable, particularly for the rhamnolipid concentration, where the model appears to slightly under-predict accumulation in the early exponential phase and slightly over-predict it in the late stationary phase. These small discrepancies may suggest that the precise relationship between growth and production is more dynamic than can be captured by constant yield and maintenance parameters. Nevertheless, the model is deemed to satisfactorily predict the fermentation process, serving as a valid basis for further process analysis and discussion.
3.2 Scenarios and scale variations
A comprehensive scale-up analysis was carried out to evaluate how operational costs evolve as a function of batch size for the production of the main product (MP). The results of this analysis are illustrated in
Figure 4, which presents the operational cost per kilogram of MP (€/kg MP) across a range of batch sizes, from laboratory to full industrial scale.
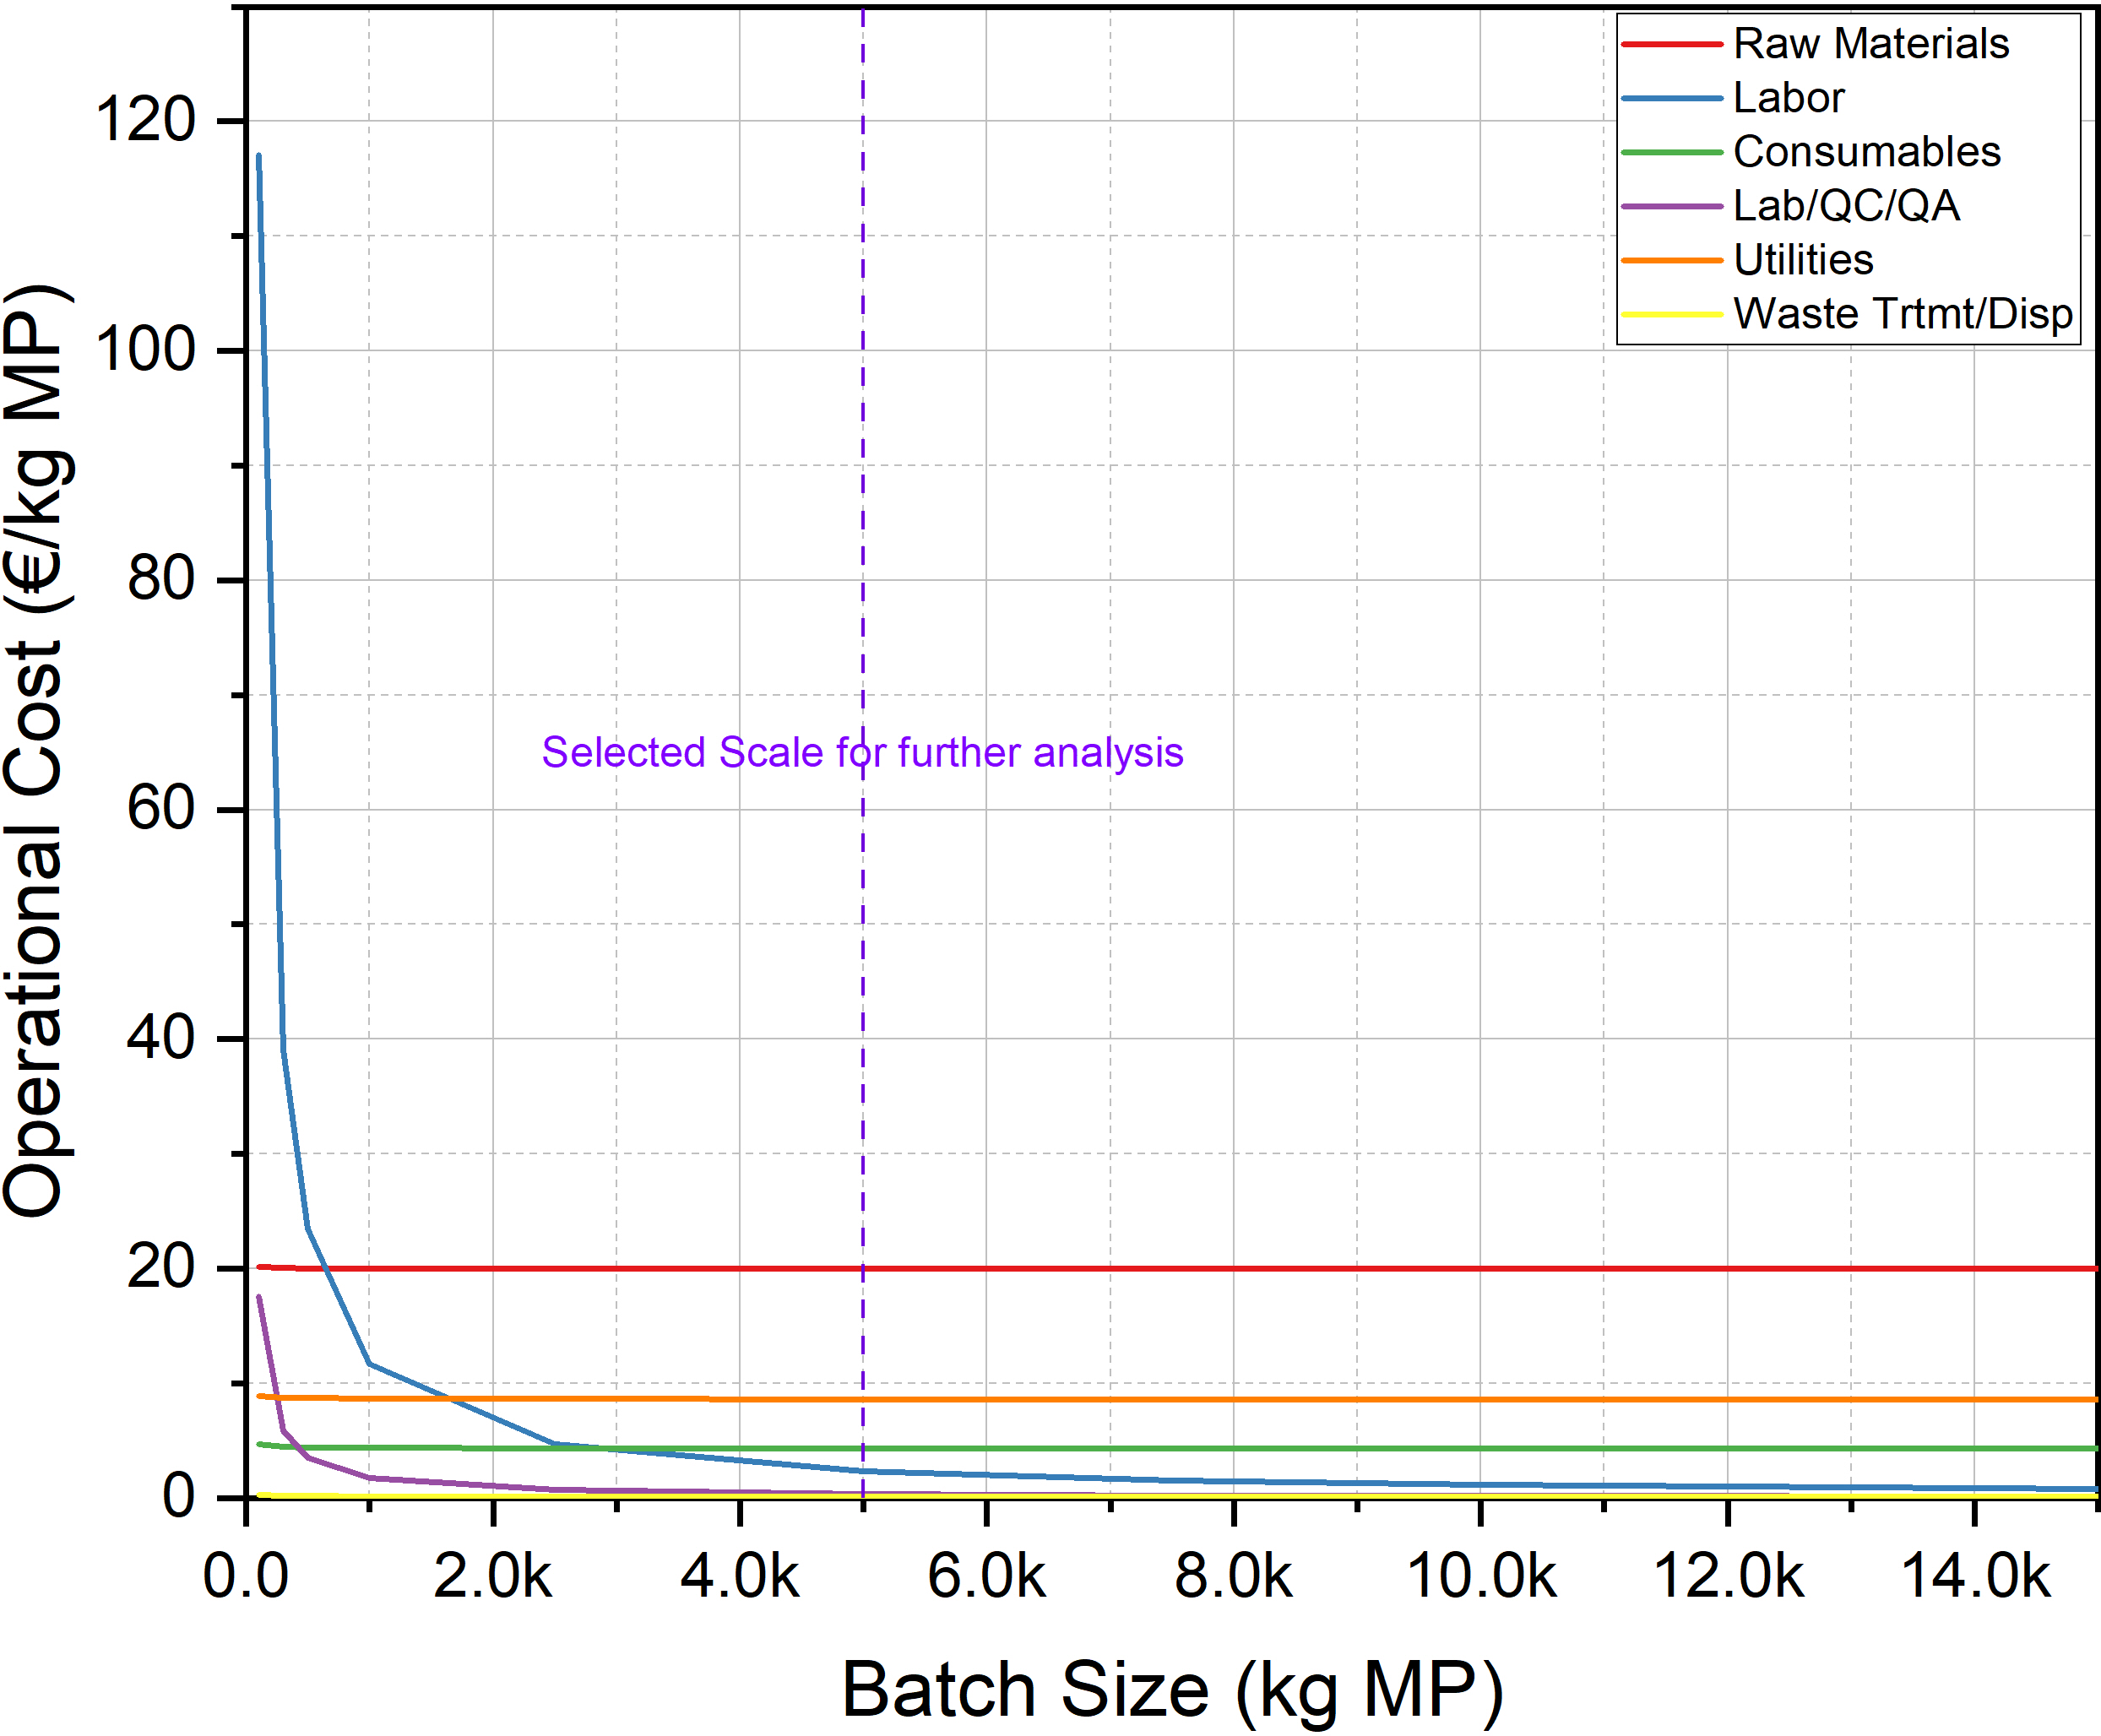
Figure 4. Scale-up cost assessment.
The cost components considered in the analysis include raw materials, labour, consumables, quality control and assurance (Lab/QC/QA), utilities, and waste treatment/disposal. Each cost category is individually represented in the graph to highlight their relative contributions at different production scales.
From the cost trends observed, it is evident that economies of scale play a significant role in driving down operational costs. At smaller batch sizes (e.g., <1,000 kg MP), costs are substantially higher, with a steep decline as batch size increases. This is primarily due to the dilution of fixed or semi-variable costs—particularly labour and quality control—over a larger quantity of product. As batch size increases beyond approximately 3,000–4,000 kg MP, the cost curve begins to plateau, indicating that the majority of scale-related cost reductions have already been achieved, and further increases in batch size provide marginal benefits in terms of cost per unit.
Among all cost categories, labour emerges as the dominant cost driver, especially at smaller scales. As shown in
Figure 3, the labour cost remains relatively constant in absolute terms, which leads to a high cost per unit of product at low production volumes. Even at higher scales, while the impact of labour diminishes proportionally, it still remains a significant contributor to the overall operational cost. This underscores the importance of process automation or labour efficiency improvements when designing for scale-up.
Based on the trends in
Figure 4 and the marginal gains observed beyond a certain point, a batch size of 5,000 kg of main product (MP) has been selected as the reference scale for full industrial analysis. This value, marked in the figure with a vertical dashed purple line, represents a realistic and technically viable industrial production scenario. At this scale, the operational cost has reached a stable range where further scale increases would yield minimal cost improvements, while potentially introducing additional complexity in logistics, equipment sizing, and investment requirements.
A critical implication of using pilot data from plasmid-based, antibiotic-dependent fermentations to parameterize an antibiotic-free industrial model is that the reported cost per kilogram, and the selection of 5,000 kg batch size as an economically attractive scale, are likely optimistic with respect to a realistic genome-integrated strain. If titers decrease upon chromosomal integration—as generally observed in industrial strain development—the same plant design would yield fewer kilograms of product per batch, increasing the apparent cost per kilogram and exacerbating resource-use and environmental burdens. This limitation is further analysed in the discussion.
3.3 LCA
The LCA analysis presented herein was conducted using the SimaPro software version 9.6 (PRé Sustainability, The Netherlands), incorporating the Ecoinvent 3.9 database (Ecoinvent, Switzerland) to model the environmental impacts associated with the production process of rhamnolipids. The data input for this analysis was derived from the mass and energy balances outlined in the previous section. Furthermore, the assembly of the process was systematically divided according to the process sections previously mentioned, ensuring a detailed and structured assessment of each stage within the production lifecycle.
Figure 5 showcases a stacked column chart breaks down the relative environmental impacts of different steps in the rhamnolipid production. Each column represents an impact category, and the coloured segments show the percentage contribution from each process step: Media Preparation, Fermentation, Product Purification processing, and Solvent Recovery.
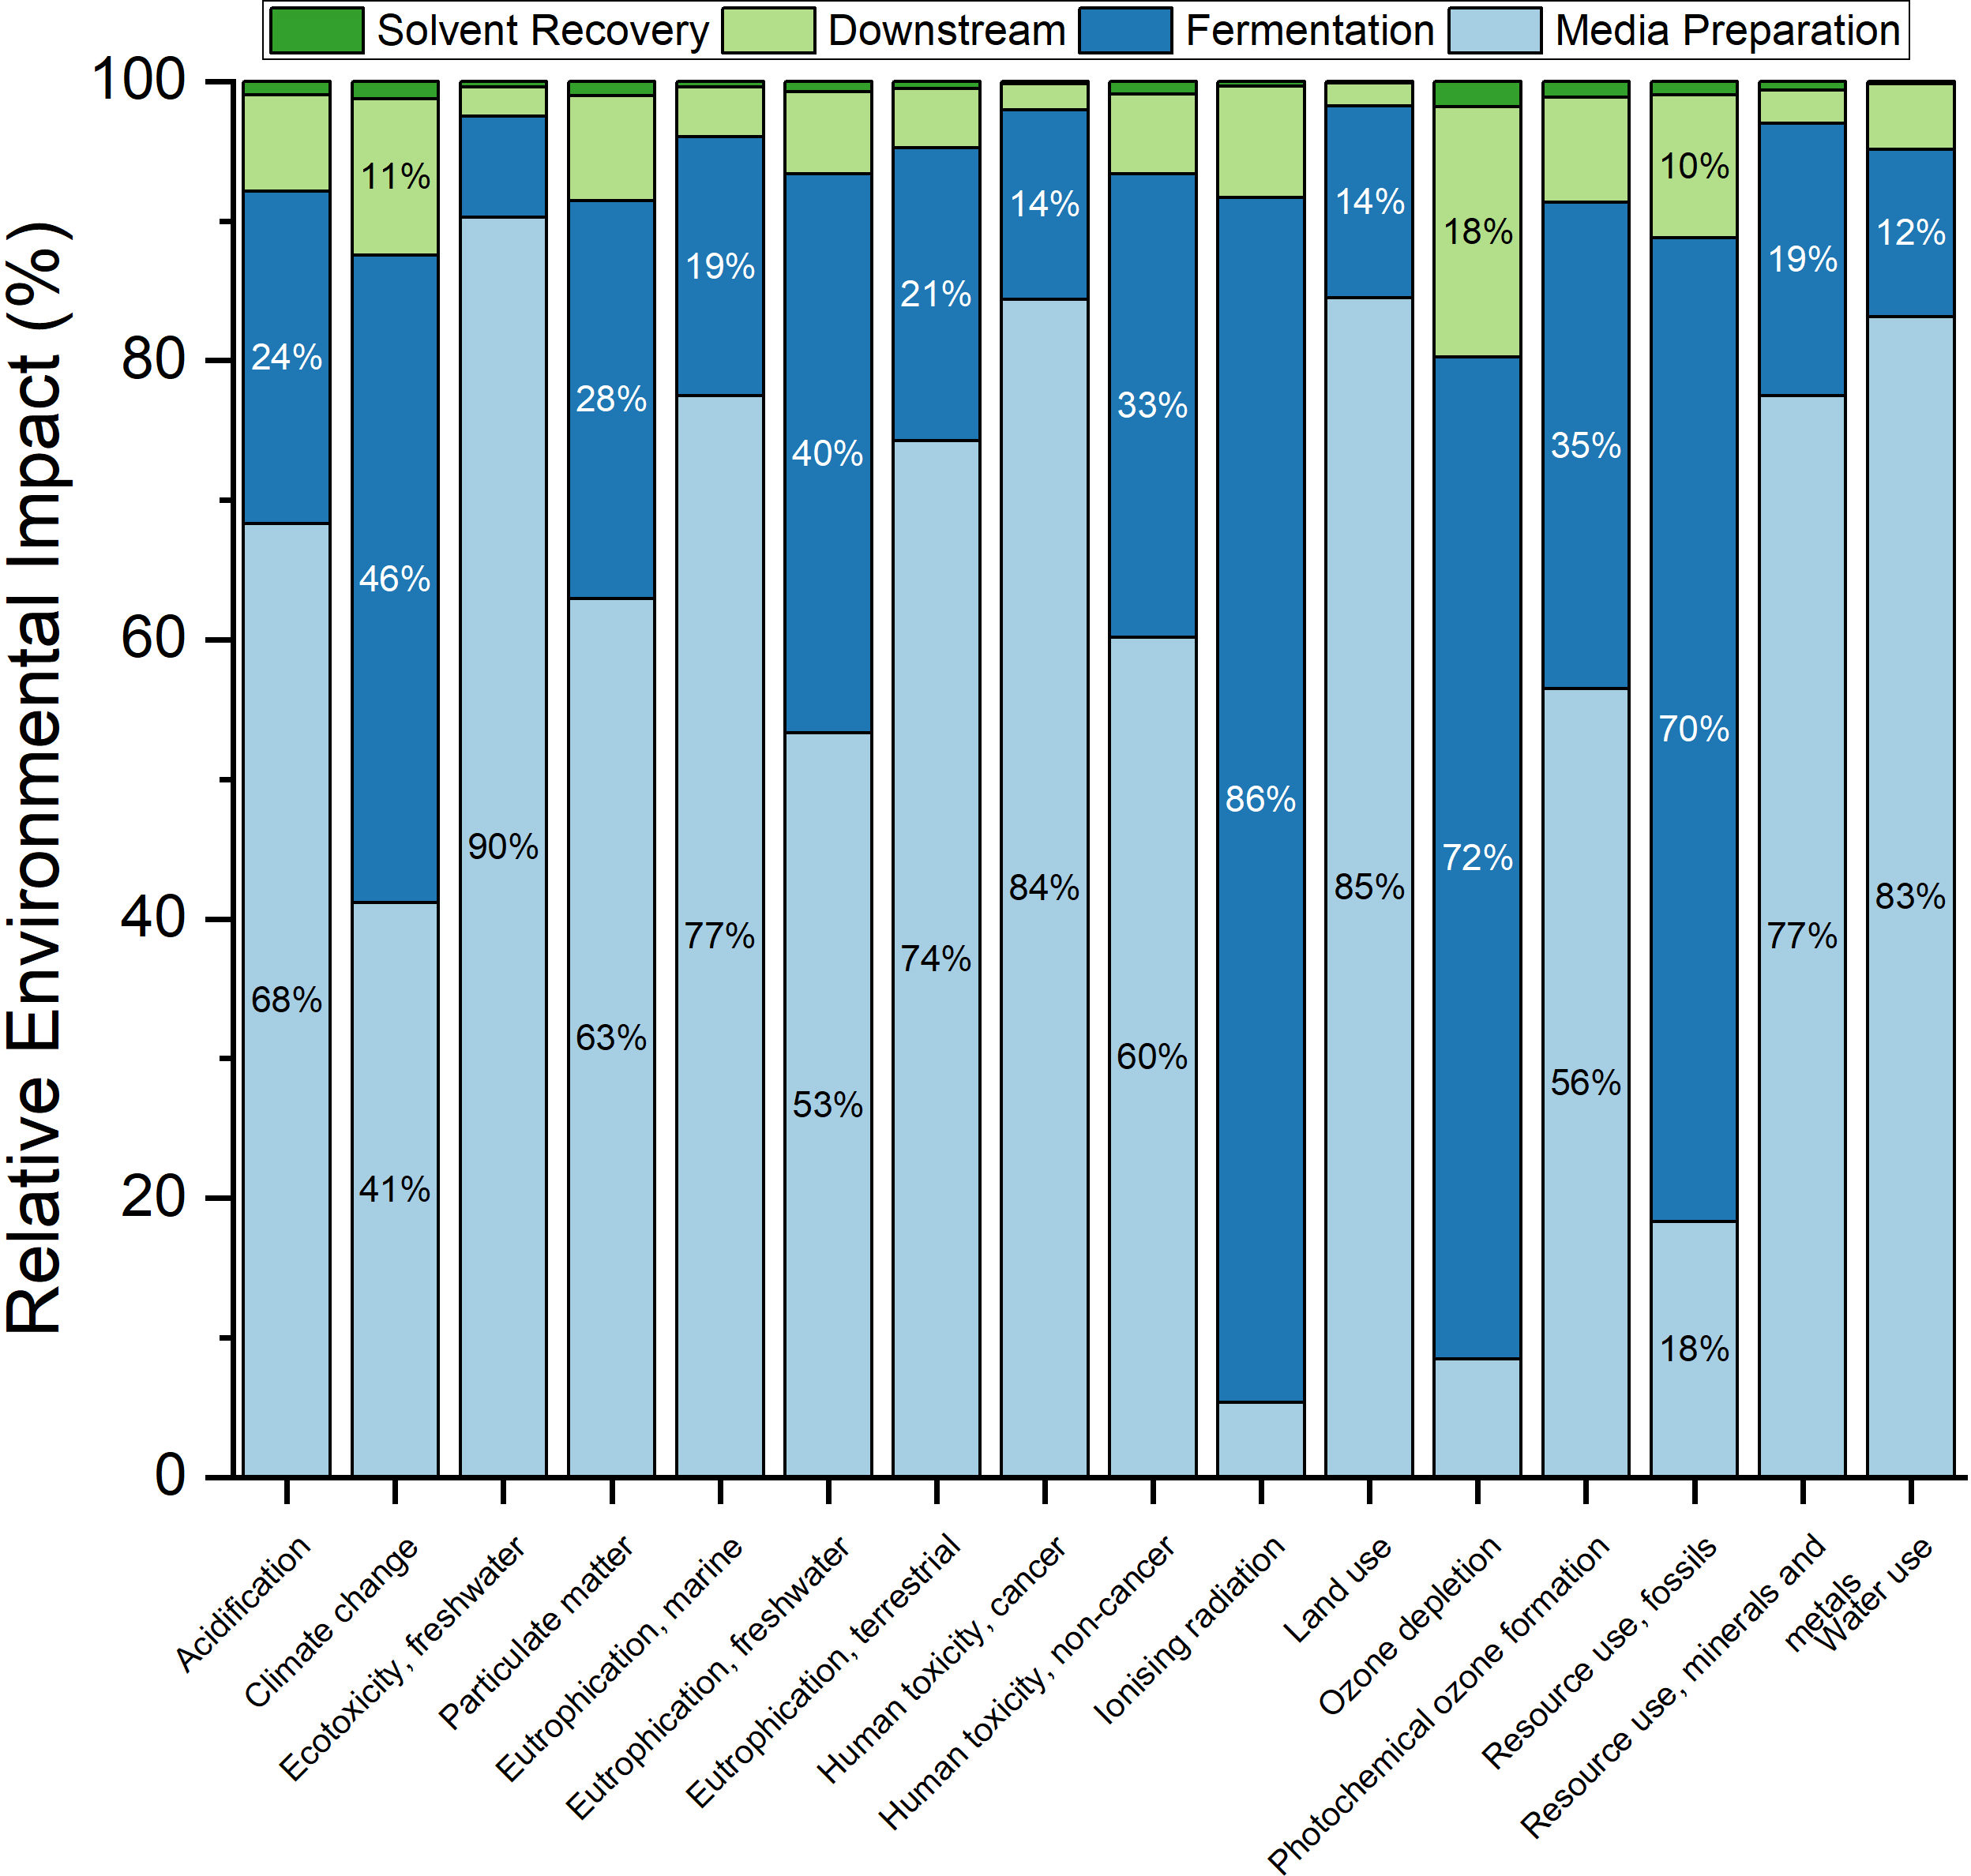
Figure 5. Relative contribution of process steps to environmental impact categories in rhamnolipid production.
In terms of global warming potential (GWP), Media Preparation is the primary contributor, indicating significant emissions are associated with the production and procurement of raw materials used in media, such as agricultural inputs and associated processing. This is followed by the Product Purification process, which suggests that the purification and extraction steps are also energy-intensive, likely due to the use of heat, electricity, and potentially environmentally impactful chemicals. Solvent Recovery and Fermentation have smaller but still notable impacts, with Fermentation contributing the least. This might be due to the efficiency of the bioreactors used or possibly the management of emissions from the fermentation process itself.
For terrestrial ecotoxicity, Media Preparation alone accounts for most of the impact, indicating the use of agricultural products or chemicals that may have downstream effects on terrestrial habitats. This underscores the potential benefits of exploring alternative, less ecotoxic media components or improving the agricultural practices associated with raw material production.
Land use is overwhelmingly dominated by the Media Preparation phase, reflecting the space required to grow the biological inputs, like crops for vegetable oil and glucose. This impact could be mitigated by sourcing materials from more sustainable agriculture with higher yield per area or by using waste streams as alternative feedstocks.
Interestingly, Mineral resource scarcity is relatively low across all process steps, indicating efficient use of these resources or low reliance on minerals in the production process.
For fossil resource scarcity, both Media Preparation and the Fermentation process are major contributors, which could be attributed to the energy sources used being derived from fossil fuels. These insights point to opportunities for using alternative energy sources and solvents that are less dependent on fossil resources.
When it comes to water consumption, Fermentation takes the lead, which might reflect the water required for the biological processes, as well as the cleaning and maintenance of bioreactors. This highlights an area where water use efficiency can be significantly improved, perhaps through the recycling of process water or the use of water-saving technologies.
Table 4 enumerates the environmental impact of the rhamnolipid production process previously described.
Table 4. Quantitative environmental impact of rhamnolipid production by process step per kg of rhamnolipids produced.
|
Category |
Unit |
Total |
Media preparation |
Fermentation |
Product purification |
Solvent Recovery |
|---|
| Acidification | mol H+ eq | 0.55
| 0.37 | 0.13 | 0.04 | 0.005 |
| Climate change | kg CO2 eq | 109.30
| 44.96 | 50.70 | 12.30 | 1.35 |
| Ecotoxicity, freshwater | CTUe | 1236.07
| 1115.90 | 89.46 | 25.90 | 4.81 |
| Particulate matter | disease inc. | 4.75E-06
| 2.99E-06 | 1.35E-06 | 3.59E-07 | 4.85E-08 |
| Eutrophication, marine | kg N eq | 0.20
| 0.15 | 0.04 | 0.01 | 0.001 |
| Eutrophication, freshwater | kg P eq | 0.03
| 0.02 | 0.01 | 0.001 | 2.5E-05 |
| Eutrophication, terrestrial | mol N eq | 1.70
| 1.26 | 0.36 | 0.07 | 0.009 |
| Human toxicity, cancer | CTUh | 2.48E-07
| 2.09E-07 | 3.36E-08 | 4.58E-09 | 4.36E-10 |
| Human toxicity,
non-cancer
| CTUh | 8.71E-07
| 5.24E-07 | 2.90E-07 | 4.99E-08 | 7.90E-09 |
| Ionising radiation | kBq U-235 eq | 83.82
| 4.48 | 72.36 | 6.68 | 0.30 |
| Land use | Pt | 2830.47
| 2391.96 | 388.23 | 46.76 | 3.52 |
| Ozone depletion | kg CFC11 eq | 1.04E-05
| 8.83E-07 | 7.49E-06 | 1.87E-06 | 1.90E-07 |
| Photochemical ozone formation | kg NMVOC eq | 0.291129
| 0.164411 | 0.101474 | 0.021992 | 0.003 |
| Resource use, fossils | MJ | 2896.252
| 530.5287 | 2040.745 | 297.2161 | 27.76175 |
| Resource use, minerals and metals | kg Sb eq | 0.000774
| 0.0006 | 0.000151 | 1.87E-05 | 4.78E-06 |
| Water use | m3 depriv. | 185.2806
| 154.0305 | 22.22582 | 8.7127 | 0.311605 |
In the interpretation of
Figure 4 and
Table 4, media preparation emerges as the primary contributor in most impact categories, dominated by the production and supply of glucose. This is consistent with the glucose-only carbon source strategy adopted for the simulated industrial process. In literature-typical sugar–oil processes, a substantial share of impacts can instead be driven by vegetable oil production, land use, and associated fertilizer and pesticide use. By focusing on a glucose-only process, this study isolates the burden of sugar-based feedstocks and highlights how switching to second-generation glucose (e.g. lignocellulosic hydrolysates) could improve the environmental profile. At the same time, it must be recognized that the present LCA does not include any burdens associated with antibiotics, which were used during the pilot fermentations. Inclusion of antibiotic production, usage, and disposal would increase toxicity-related categories and, to a lesser extent, climate change impacts, thereby reinforcing the importance of transitioning to antibiotic-free, genome-integrated strains at industrial scale.
3.3.1 Normalized environmental impact assessment
The normalized results of the environmental impacts associated with the production of 1 kg of rhamnolipids, calculated with the Environmental Footprint (EF) 3.1 methodology, are shown in
Figure 6. Each bar represents the magnitude of the impact in a given EF midpoint category as a fraction of the average per-capita environmental burden worldwide (reference year 2010). In other words, every value indicates which share of one person’s annual global environmental impact is attributable to the production of 1 kg of rhamnolipids.
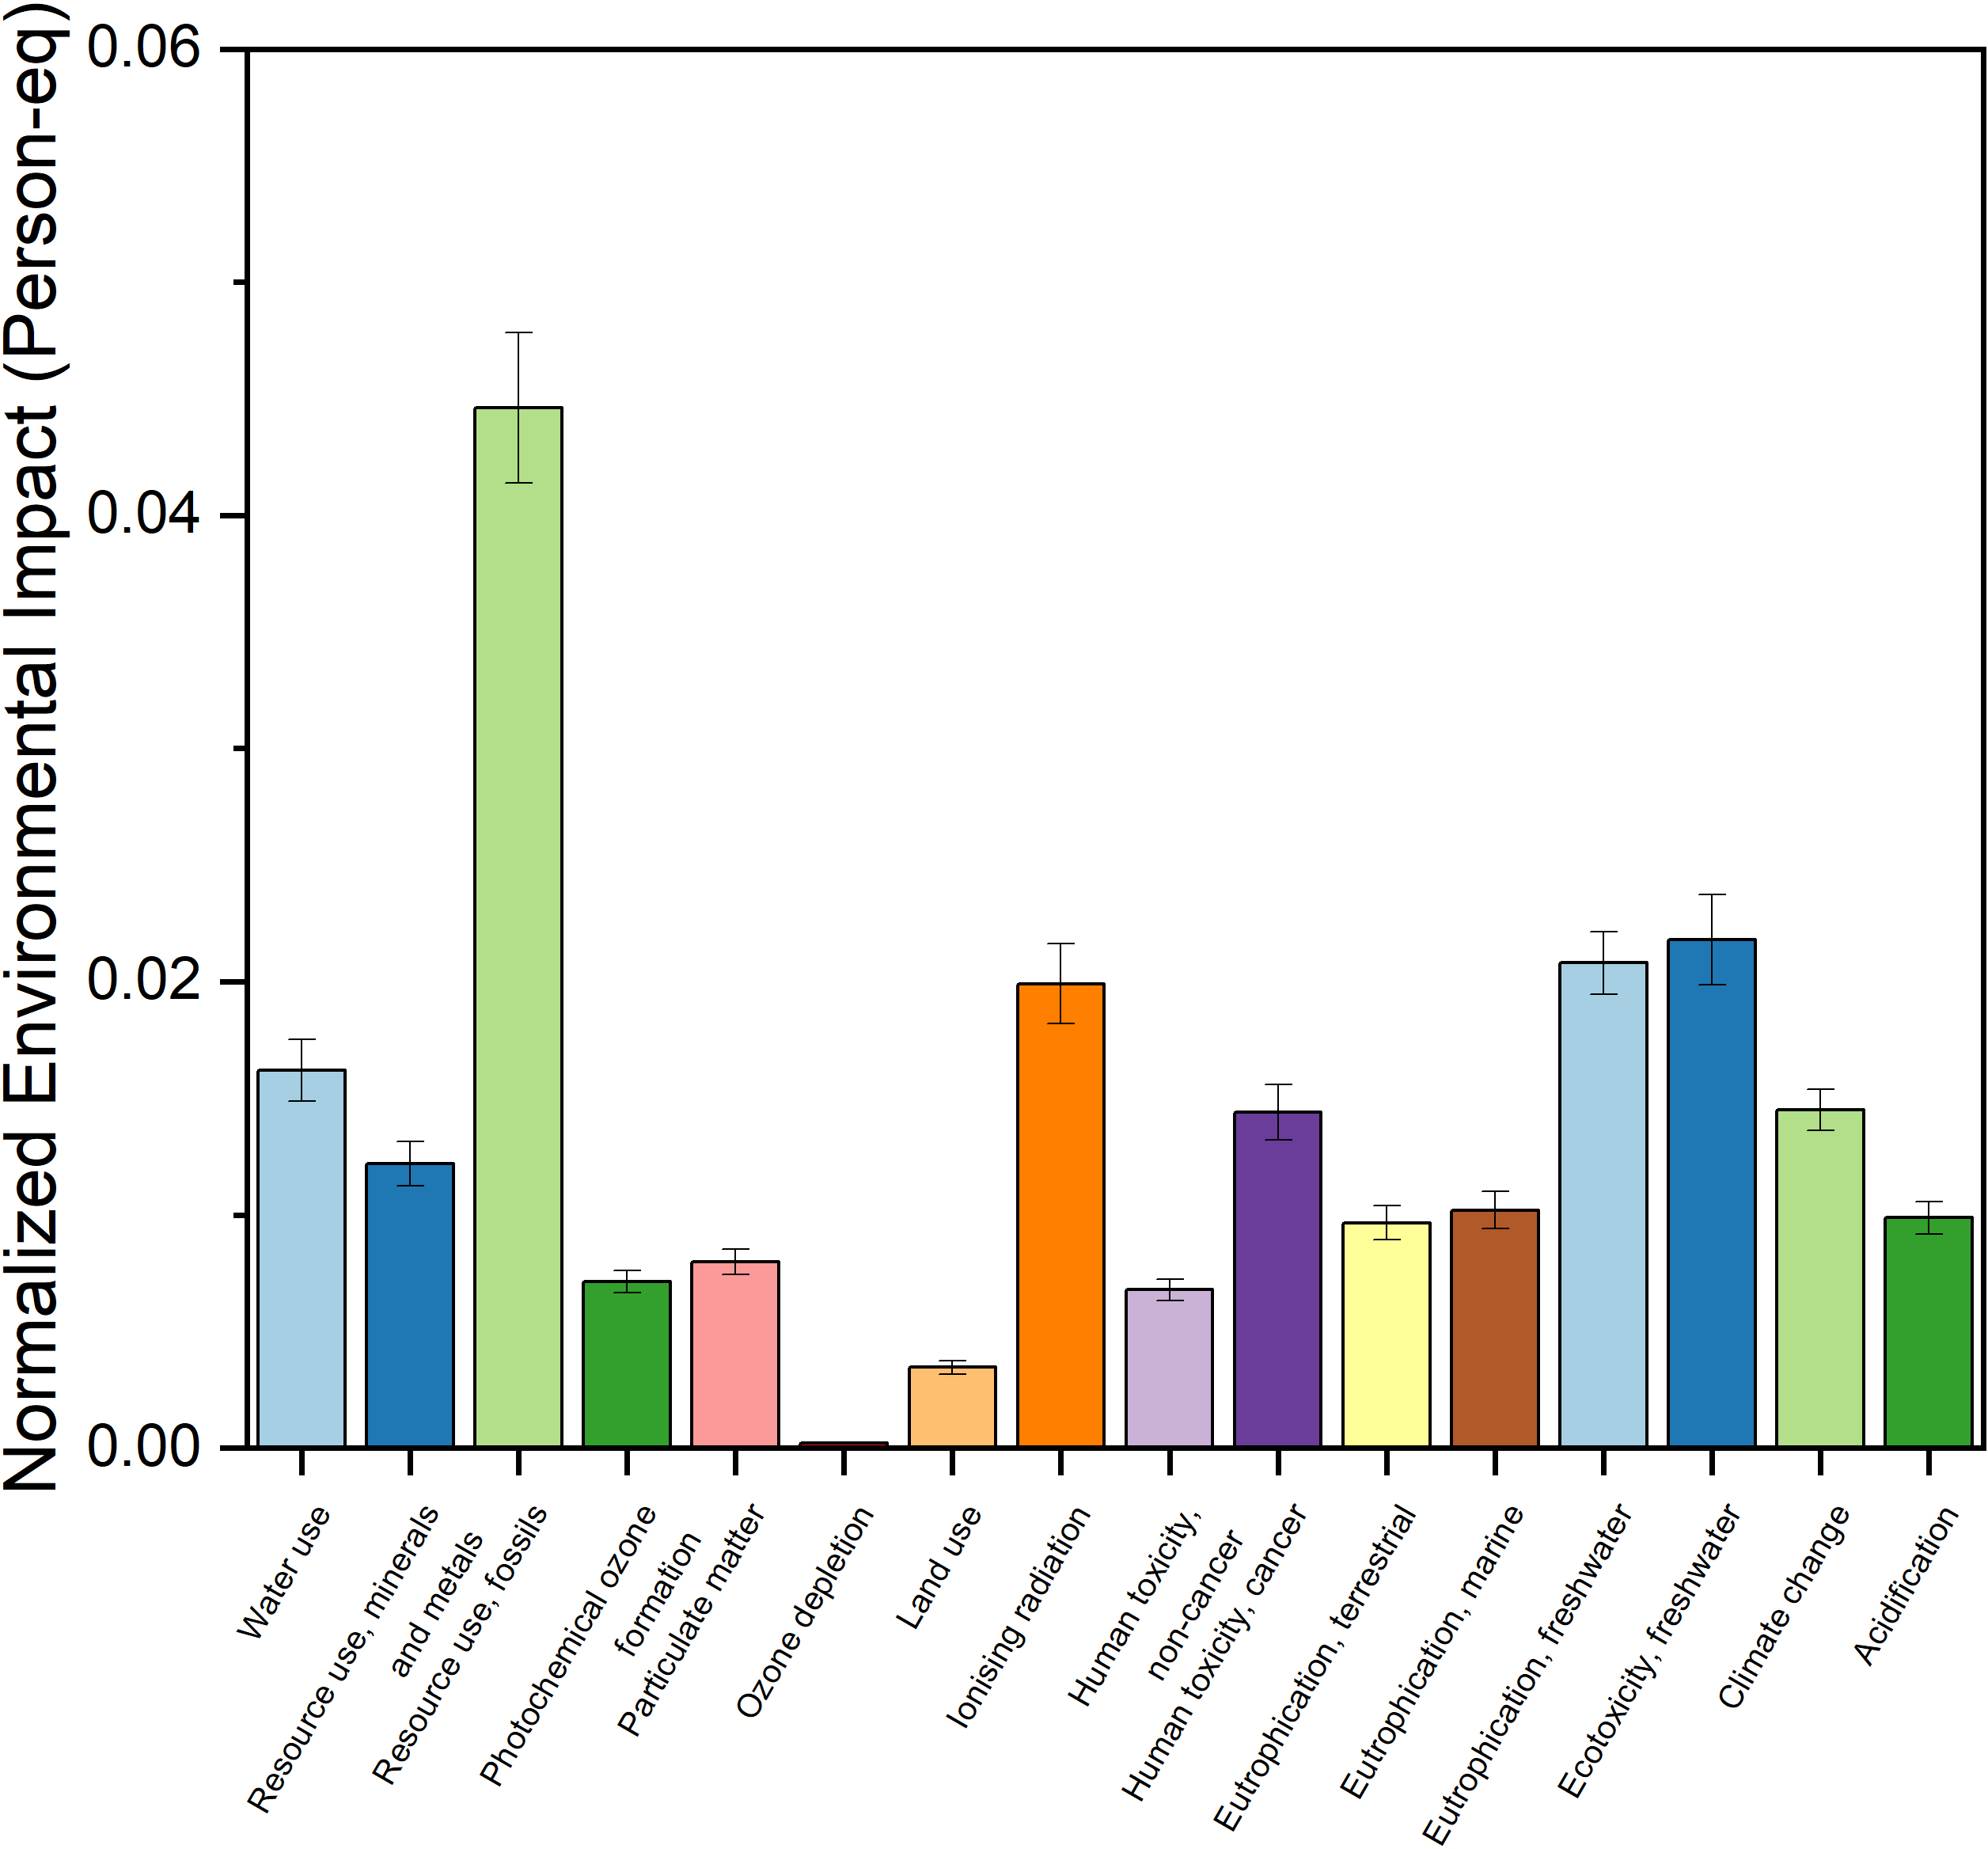
Figure 6. Normalized environmental impact.
The most prominent impact category is resource use, fossils, with a normalized value of about 0.045 person-equivalents. This means that producing 1 kg of rhamnolipids accounts for roughly 4.5 % of an average person’s yearly fossil resource use. This high contribution reflects the dependence of the system on fossil-based energy carriers and upstream fossil-derived inputs across the supply chain, including electricity generation, heat production and the manufacture of key raw materials.
The next largest contributions are found for freshwater ecotoxicity (≈0.022 person-eq), freshwater eutrophication (≈0.021 person-eq) and ionising radiation (≈0.020 person-eq). Together, these categories highlight the sensitivity of aquatic environments and the influence of the background energy mix. Freshwater eutrophication points to emissions of phosphorus-containing substances along the life cycle, for instance from cultivation of feedstocks and wastewater management. Freshwater ecotoxicity indicates potential toxic effects of chemical releases to water—such as residual process chemicals, cleaning agents or by-products. The relatively high score for ionising radiation is mainly linked to electricity production in regions where nuclear power contributes significantly to the grid mix.
A further group of categories with substantial but slightly lower scores includes water use (≈0.016 person-eq), climate change (≈0.015 person-eq), human toxicity, cancer (≈0.014 person-eq) and resource use, minerals and metals (≈0.012 person-eq). Water use shows that, despite not being the single dominant category, the process still exerts a noticeable pressure on water resources through fermentation, cleaning and cooling operations. For climate change, the normalized value of around 0.015 person-equivalents indicates that 1 kg of rhamnolipids corresponds to about 1.5% of an average person’s annual greenhouse-gas footprint. Using the EF 3.1 normalization factor for climate change (≈7,550 kg CO2-eq per person), this translates to an overall impact on the order of 110 kg CO2;-eq per kilogram of product. Human toxicity (cancer) and mineral/metal resource use suggest that the life cycle also relies on materials and emissions that may affect human health or draw on non-renewable mineral resources, for example through the production of catalysts, infrastructure and certain chemicals.
An intermediate contribution band, with normalized scores roughly between 0.007 and 0.011 person-equivalents, comprises marine eutrophication, terrestrial eutrophication, acidification, particulate matter, photochemical ozone formation and human toxicity, non-cancer. These impacts are typically associated with emissions of nitrogen and sulphur compounds (e.g. NOX, NH3, SO2) and organic precursors of ozone, arising from fertilizer use in agriculture, combustion processes for heat and power, and upstream chemical production. Although none of these categories dominates the overall profile, together they signal a non-negligible contribution to air-quality related and nutrient-related pressures.
At the lower end of the spectrum, land use (≈0.0035 person-eq) and ozone depletion (≈2×10⁻⁴ person-eq) exhibit the smallest normalized values. This suggests that the direct land occupation attributed to rhamnolipid production and the use of ozone-depleting substances are relatively minor concerns in the process.
The normalized results indicate that fossil resource use, freshwater ecotoxicity, freshwater eutrophication, and ionising radiation are among the most prominent categories. Given that antibiotics are not included as inputs and that titers are assumed equivalent to those achieved with a plasmid-based pilot strain, the reported normalized scores should be interpreted as optimistic for an antibiotic-free, genome-integrated strain. Any residual use of antibiotics at scale would further increase fossil resource use (via energy-intensive synthesis) and ecotoxicity, thereby narrowing the environmental performance gap between rhamnolipids and conventional surfactants.
3.4 Economic analysis
The economic performance of rhamnolipid production was assessed by analysing the main cost drivers across raw materials, utilities, waste treatment, and labuor. The analysis is based on a scaled-up production process modelled using pilot-scale data and assumes a batch capacity of 5,000 kg of rhamnolipids with 632 batches per year. The economic indicators are presented per kilogram of product, enabling a direct link with the environmental indicators in the LCA and ensuring consistent benchmarking potential.
3.4.1 Raw material costs
Raw material consumption is the main contributor to the direct operating costs of rhamnolipid production, with a consolidated cost of around €36 per kg of product (
Table 5). Media preparation clearly dominates these costs, accounting for almost all raw material expenditure. This stage requires large amounts of glucose (61.80 kg/kg product), which alone contributes €33.25/kg, representing about 95% of the media preparation cost. Water is the second input in this stage, but its contribution is comparatively minor (€1.68/kg), reinforcing glucose as the main economic hotspot in the raw material inventory.
Table 5. Consolidated raw material costs per kilogram of Rhamnolipids.
| Stage | Key material | Amount (kg/kg MP) | Cost (€/kpMP) |
% of Total stage cost |
|---|
| Media Preparation | Glucose | 61.80 | 33.25 | 95.19% |
| Water | 406.14 | 1.68 | 4.81% |
| Fermentation | Ammonia (2%) | 5.36 | 0.03 | 33.36% |
| Water | 14.79 | 0.06 | 66.64% |
| Product Purification | Water | 137.34 | 0.16 | 97.52% |
| Alcalase | 0.00029 | 0.01 | 2.06 |
| Solvent Recovery | Ethyl Acetate | 0.12804 | 0.13 | 95.8% |
| Water | 1.33 | 0.01 | 4.2% |
| Total (All Stages) | | | ~€36
| |
In contrast, the remaining stages—fermentation, product purification, and solvent recovery—have only a marginal impact on overall raw material costs. Fermentation relies on inexpensive Ammonia and relatively small amounts of water, resulting in raw material costs below €0.10/kg product. Product purification is dominated by water use, with only trace amounts of Alcalase enzyme, while solvent recovery is driven mainly by the limited use of ethyl acetate. Together, these downstream stages contribute only a small fraction of the total ~€36/kg, underlining that cost-optimisation efforts should primarily focus on the media preparation stage, particularly on reducing glucose-related costs or partially replacing it with more affordable carbon sources.
Raw material costs are dominated by glucose, which reflects the glucose-only feeding strategy. In mixed sugar–oil processes, a significant share of raw material costs can be transferred from refined sugars to cheaper lipid substrates, but this comes at the price of a more complex downstream separation. In the present study, the sole use of glucose simplifies DSP but results in a high per-kilogram contribution from the carbon source. Antibiotics and plasmid-related costs are not included, in line with the assumption of a genome-integrated industrial strain. If an industrial process were to retain plasmid-based expression and antibiotics, both raw material costs and waste treatment costs would increase relative to the values reported here.
3.4.2 Waste treatment costs
Waste management constitutes a small, yet non-negligible cost factor in the process (
Table 6). During fermentation, a total of 446.7 kg of waste is generated per kilogram of product. Most of this (440.45 kg) consists of gaseous emissions, likely CO2, which are assumed to carry no treatment cost in this model. However, this volume may still have regulatory implications depending on the region and should be considered in broader environmental compliance assessments.
Table 6. Waste generation and treatment cost.
| Stage | Waste type | Volume (kg/kg MP) |
Treatment cost (€) |
|---|
| Fermentation | Aqueous Waste | 6.25 | 0.02588 |
| Emissions | 440.45 | 0.00 |
| Solvent Recovery | Aqueous Waste | 23.34 | 0.09657 |
The only monetized waste stream in fermentation is aqueous waste (6.25 kg/kg product), contributing €0.02588 per kg of rhamnolipids. In contrast, solvent recovery and reuse—though cost-efficient in terms of material use—generates 23.34 kg/kg of aqueous waste, adding €0.09657/kg to the cost. Despite being non-hazardous, the sheer volume of effluent from this stage makes it the most expensive in terms of waste treatment. This suggests a potential benefit from implementing internal water reuse, membrane filtration, or other low-cost liquid treatment options to reduce effluent volume and associated costs.
3.4.3 Utility costs
Utilities constitute a significant share of operational costs, particularly electricity, steam, and chilled water (
Table 7). The most expensive utility is chilled water, totalling €4.28/kg, mainly due to high cooling demands during fermentation (92.34% of chilled water costs). This reflects the exothermic nature of microbial fermentation, where heat must be rapidly dissipated to maintain optimal bioreactor conditions. The high cost signals a need to explore alternative reactor designs (e.g., continuous systems), improved insulation, or thermal integration strategies to offset refrigeration requirements.
Table 7. Utility consumption and costs per kilogram of product.
| Utility type | Total cost (€/kgMP) | Main contributor
(Stage) |
% Contribution of stage |
|---|
| Chilled Water | 4.28 | Fermentation | 92.34% |
| Steam | 2.17 | Product Purification | 84.94% |
| Electricity | 1.97 | Fermentation | 87.67% |
| Cooling Water | 0.18 | Fermentation | 71.52% |
| Steam LP | 0.02 | Solvent Recovery | 100% |
Electricity costs total €1.97/kg, with fermentation again dominating (87.67%) due to the intensive energy requirements of aeration, agitation, and process control. Product purification follows, contributing 11.5% of electricity use. Steam requirements (totalling €2.17/kg) are primarily driven by downstream purification (84.94%), which likely includes thermally intensive steps such as distillation or enzymatic inactivation. This suggests opportunities for heat recovery or process intensification (e.g., microwave-assisted purification or alternative solvents).
Cooling water use is extensive (up to 3.13 MT/kg in fermentation) but economically less significant due to its low cost. Nonetheless, the large volumes used may raise sustainability concerns and could be addressed through closed-loop or cascade cooling systems.
3.4.4 Labour costs
Labour is another substantial contributor to the overall cost, totalling €2.34/kg of product (
Table 8). Product purification is the most labour-intensive stage, consuming 0.02414 h/kg and accounting for over 63% of the labour cost. This aligns with its complexity, involving multiple separation and treatment steps. Fermentation and solvent recovery require moderate labour input, while media preparation is comparatively light in operational demand.
Table 8. Labour cost by stage.
| Stage | Labour hours (h/kgMP) | Cost (€/kg) |
% of Total labour cost |
|---|
| Media Preparation | 0.00409 | 0.23 | 10.76% |
| Fermentation | 0.00722 | 0.41 | 19.01% |
| Product Purification | 0.02414 | 1.38 | 63.57% |
| Solvent Recovery | 0.00557 | 0.32 | 14.67% |
| Total | 0.04101 | 2.34 | 100% |
These labour estimates assume a standard operator cost of €57.1/h. While adequate for a European context, costs could vary substantially depending on production location. Moreover, these estimates do not account for supervisory, maintenance, or QA/QC personnel, which could increase overall labour burden. Automation and process simplification in purification offer the greatest potential for labour savings.
Utilities and labour costs are heavily influenced by the strong aeration, agitation, and cooling demands of aerobic rhamnolipid production and by the complexity of the purification train. These drivers are independent of plasmid vs genome integration but are sensitive to fermentation titer; lower titers in genome-integrated strains would require processing larger broth volumes per unit of product, thereby further increasing utility and labour burdens.
3.5 Integrated analysis
The integration of the LCA and LCC analyses provides a comprehensive perspective on the sustainability and economic feasibility of rhamnolipid production. Both assessments reveal distinct environmental and economic hotspots that, while interrelated, require targeted strategies for improvement.
The LCA results show that media preparation is the main source of environmental impacts in most categories. It dominates acidification, ecotoxicity, eutrophication (marine, freshwater and terrestrial), human toxicity, resource use of minerals and metals, and water use, where it often accounts for more than half of the total impact. This pattern reflects the heavy reliance on glucose production, which requires large energy and material inputs. Fermentation also plays a major role, especially for climate change, fossil resource use, land use and ozone depletion, where its contribution is similar to or higher than that of media preparation. Downstream operations and solvent recovery only add a small share across categories, with solvent recovery almost negligible.
From an economic point of view, the LCC confirms that raw material purchases during media preparation are the main cost driver, with glucose clearly standing out. Product purification remains the most expensive downstream step because of its labour demand, even if raw material use is modest. Fermentation has relatively low direct material costs, but the need for utilities such as high-pressure steam and electricity still shapes part of the cost structure. Economies of scale help dilute fixed costs as production increases, but without parallel gains in process efficiency they may also intensify some of the environmental pressures highlighted in the LCA.
The integration of the LCA and LCC analyses confirms that media preparation (driven by glucose use), utilities, and labour-intensive downstream processing are the dominant drivers of both environmental and economic impacts. In the current model, these drivers are evaluated for a process that is conceptually antibiotic-free and plasmid-free at industrial scale but numerically parameterized with pilot data from plasmid-based, antibiotic-dependent fermentations. This creates a systematic optimism in the reported indicators: the impacts of antibiotics are neglected, while the benefits of plasmid-level titers are retained. As a result, the present analysis should be viewed as a best-case baseline for an industrial glucose-only P. putida process, against which more realistic scenarios—such as genome-integrated strains with lower titers and potentially different foaming behaviour—must be benchmarked in future work.
A critical trade-off emerges between minimizing environmental impacts and controlling production costs. For instance, substituting conventional glucose with sustainably sourced alternatives could reduce GWP and resource depletion but might entail higher unit costs or require process adaptations that affect overall yield. Similarly, automation of the labor-intensive purification stage presents an opportunity to reduce costs and improve process consistency; however, such interventions may necessitate capital investments and may alter energy consumption patterns, thus impacting the environmental footprint.
The sensitivity analyses further underscore these trade-offs. Variations in feedstock prices, energy consumption, and labor inputs directly affect both the LCA and LCC outcomes. This interdependency suggests that optimization efforts should not focus solely on cost reduction or environmental mitigation but rather on an integrated strategy that balances both objectives. Several key drivers have been identified from the analyses:
•
Raw Material Sourcing: The environmental and cost burdens associated with glucose underscore the importance of exploring alternative, renewable feedstocks. The literature supports the use of agricultural by-products or lignocellulosic sugars as viable alternatives that could simultaneously lower environmental impacts and mitigate cost volatility. Future assessments should explicitly combine such substrate shifts with realistic titers from genome-integrated, antibiotic-free P. putida strains to quantify how strain engineering and feedstock strategy jointly shape environmental and economic outcomes.
•
Energy and Water Management: Fermentation’s high-water usage and the energy demands during purification and solvent recovery call for process innovations such as water recycling and the integration of renewable energy sources. Enhanced water management practices, including condensate recovery, could significantly reduce the water footprint, while the use of renewable energy could lower GWP.
•
Process Intensification and Automation: Reducing labor dependency in product purification via process automation offers a clear path for cost savings. Although automation requires upfront investment, economies of scale achieved at larger production volumes could offset these costs over time. Furthermore, process intensification strategies, such as improved aeration systems or optimized solvent recovery techniques, have the potential to enhance both environmental performance and economic efficiency.
4. Discussion
The industrial viability of any biotechnological process is fundamentally anchored in its upstream fermentation performance. In this context, the simulated rhamnolipid production using the engineered P. putida KT2440 A2B1 strain establishes a critical baseline for a non-pathogenic production platform. The observed rhamnolipid titer, ranging from 1.9 to 2.21 g/L with a corresponding product-on-substrate yield of 0.01 to 0.11 g/g from glucose, represents a foundational proof-of-concept. However, when contextualized within the broader landscape of rhamnolipid research, these figures underscore the well-documented trade-off between biosafety and productivity, and between glucose-only feeding and mixed sugar–oil strategies. The decision to employ P. putida KT2440, a certified safety strain, strategically circumvents the significant regulatory and health-related hurdles associated with the opportunistic pathogen Pseudomonas aeruginosa, the most prolific native rhamnolipid producer.14 At the same time, the experimental work underpinning this study relies on plasmid-based expression and antibiotics, whereas the industrial scenario assumes a genome-integrated, antibiotic-free strain. This dual trade-off—plasmid vs chromosome and glucose-only vs sugar–oil co-feeding—has profound consequences for process design, economics, and environmental performance.
A direct comparison with other studies utilizing engineered P. putida strains reveals that the performance metrics of the current simulation are situated within the expected range for early-stage development on defined sugar media. For instance, the foundational work by Wittgens et al. (2011) on engineering P. putida KT2440 for rhamnolipid production from glucose reported a yield of approximately 0.15 g of rhamnolipid per gram of glucose, with final titers in a comparable range to our simulation.11 This alignment suggests that our model accurately reflects the inherent capabilities of this host-substrate combination at its current stage of engineering. It is noteworthy, however, that substrate choice can dramatically influence productivity even within the same host species. Kaskatepe et al. (2017) demonstrated that a wild-type P. putida strain could achieve a significantly higher titer of 8.5 g/L when cultivated on hazelnut pulp, a complex and nutrient-rich substrate.23 This highlights that while our glucose-based process offers downstream purification advantages, exploring alternative or co-fed renewable feedstocks presents a potent strategy for enhancing upstream yields.
To fully appreciate the scope for improvement, it is imperative to benchmark our results against the high-performance native producer, P. aeruginosa. The performance gap is substantial and multifaceted, as illustrated in
Table 9. Studies using wild-type P. aeruginosa on glucose have reported titers far exceeding those of our engineered P. putida. Wu et al. (2008), for example, achieved a titer of 8.6 g/L in single-factor experiments, which was subsequently optimized to an impressive 12.6 g/L using response surface methodology (RSM) with a mixed glucose-glycerol feed.24 This demonstrates that even in simple batch cultures, the native producer's metabolic and regulatory machinery is inherently better adapted for high-flux rhamnolipid synthesis.
Table 9. Comparative Rhamnolipid production performance across different strains and process conditions.
|
Strain |
Carbon source |
Fermentation mode |
Titer (g/L) |
Yield (g/g substrate) |
Productivity (g/L/h) |
Scale |
Ref. |
|---|
| P. putida KT2440 A2B1 (This Study) | Glucose
| Batch
| 0.26–2.21
| 0.01-0.11
| N/A
| Pilot (30-150L)
| -
|
| P. putida KT2440 (Engineered) | Glucose | Batch | ~2-3 | 0.15 | ~0.03 | Lab | 11 |
| P. putida (Wild-type) | Hazelnut Pulp | Batch | 8.5 | N/A | N/A | Lab | 23 |
| P. aeruginosa EM1 | Glucose/Glycerol | Batch (Optimized) | 12.6 | ~0.41 | N/A | Lab | 24 |
| P. aeruginosa PA1 | Glycerol | Fed-Batch
| 10.9 | N/A | 0.047 | Lab | 25 |
| P. aeruginosa (Engineered) | Soybean Oil | Fed-Batch
| 36.97 | 0.80 | 0.308 | Lab | 26 |
| P. aeruginosa HK02 | Sunflower/Soya Oil | Continuous | 201 | 0.92 | 1.64 | Lab (1-5L) | 27 |
The performance disparity becomes even more pronounced when advanced fermentation strategies are employed. Fed-batch cultivation of P. aeruginosa, which mitigates substrate inhibition and maintains optimal nutrient levels, has consistently yielded high titers, with reports of 10.9 g/L on glycerol25 and up to 36.97 g/L with engineered strains on oily substrates.26 The frontier of rhamnolipid production is being pushed further by continuous fermentation processes. A recent study by Diba et al. (2024) reported an extraordinary titer of 201 g/L and a volumetric productivity of 1.64 g/L/h using a continuous chemostat system with an oily feedstock.27 These figures, while representing the pinnacle of current laboratory achievements, clearly define the long-term performance targets that non-pathogenic platforms must aspire to. This performance gap is further accentuated when one considers that the titers used in the current simulation correspond to a plasmid-based configuration. Chromosomal integration of the rhamnolipid pathway, which is essential to remove antibiotics and stabilize the genotype for industrial use, typically leads to lower expression levels and reduced titers relative to plasmid-based systems. Although the present study does not quantify this reduction, it is reasonable to anticipate that an industrial genome-integrated P. putida strain operating on glucose-only media would produce less rhamnolipid per unit of substrate than the pilot-scale plasmid-bearing strain used here. Consequently, the current economic and environmental indicators should be interpreted as optimistic bounds for a future antibiotic-free process. The analysis reveals that the highest titers are not merely a function of the host organism but arise from a synergistic combination of an optimized host (P. aeruginosa), a lipid-rich substrate that directly provides fatty acid precursors, and an advanced fermentation mode (fed-batch or continuous) that maintains high cell density and productivity over extended periods. Our study's use of a safe host (P. putida), a simple sugar substrate (glucose), and a basic batch process model naturally places it at a lower performance tier. This reframing of our results—not as a failure, but as a methodologically sound baseline—validates the study's approach while simultaneously leveraging the literature to construct a clear and evidence-based roadmap for future improvements, beginning with the implementation of fed-batch feeding strategies and the exploration of co-substrates.
Having established the performance gap between our pilot plant results and simulated process and literature benchmarks, it is crucial to dissect the underlying biological and engineering factors responsible for these discrepancies. The transition from acknowledging “what” the performance is to understanding “why” it is so provides a foundation for targeted improvement strategies. The modest yield in our results is likely not due to a single limiting factor but rather a confluence of metabolic bottlenecks inherent to heterologous production and persistent process-level challenges.
The metabolic constraints underlying this performance are particularly acute under glucose-only feeding. The need to derive both dTDP-L-rhamnose and β-hydroxyalkanoyl-alkanoic acid (HAA) from a single carbon source amplifies precursor imbalances in a heterologous host lacking native regulatory networks.11 The rhamnose moiety originates from the upper glycolysis intermediate glucose-6-phosphate, while the HAA lipid tail is synthesized from acetyl-CoA, a key node connecting glycolysis, the pentose phosphate pathway, and fatty acid metabolism. In a heterologous host like P. putida engineered with only the rhlA and rhlB genes, the complex native regulatory networks that govern flux partitioning in P. aeruginosa are absent.14 Consequently, the host's metabolism, though described as being robustly “driven by demand”,35 may not interpret the pull from the synthetic rhamnolipid pathway as a balanced signal. This can lead to a suboptimal flux distribution, where one precursor pathway (e.g., glycolysis towards rhamnose) outcompetes the other (flux towards acetyl-CoA for fatty acids), resulting in the accumulation of one intermediate and a stoichiometric deficit of the other. This precursor imbalance is a well-recognized bottleneck in the engineering of microbial cell factories for complex, multi-component secondary metabolites and is a probable cause of the limited titers observed in our simulation.36
Mixed sugar–oil systems alleviate this by providing fatty acid precursors directly from lipids, which explains the higher titers reported with oily feeds. In a genome-integrated, antibiotic-free P. putida strain operating on glucose-only media, these metabolic constraints will remain, and overcoming them will require targeted strain engineering (e.g. balancing precursor supply, introducing dynamic regulation) combined with process-level innovations (e.g. modified feeding profiles, co-feeding simple fatty acids) that remain compatible with industrial biosafety and regulatory standards. This metabolic challenge is compounded by the choice of glucose as the sole carbon source. While advantageous for downstream processing, relying exclusively on glucose forces the cell to generate both the sugar and lipid precursors from a single metabolic pool. This creates a critical metabolic fork where flux must be precisely partitioned. In contrast, many high-yield processes reported in the literature utilize oily substrates (e.g., vegetable oils, waste frying oil) or co-feed a sugar with a lipid.26,27 This strategy effectively decouples the precursor supply chains; the oily substrate can directly feed the fatty acid synthesis pathway to generate HAA, while a co-fed simple sugar like glucose or glycerol can be dedicated to producing the rhamnose moiety. This approach alleviates the metabolic burden on central carbon metabolism and simplifies the challenge of balancing flux, which is reflected in the consistently higher titers achieved with such feeding strategies. Therefore, the modest yield in our simulation is not merely a consequence of the host strain but is intrinsically linked to the substrate choice. Future metabolic engineering efforts should be developed in concert with advanced feeding strategies, such as the co-feeding of glucose with a simple fatty acid, to directly address this precursor supply imbalance.
From a process-engineering perspective, the current work highlights operational challenges such as foaming, high oxygen demand, and intensive cooling requirements, which are largely independent of the plasmid vs chromosome status of the strain. However, lower titers in genome-integrated strains would exacerbate their impact: for a fixed plant capacity, more fermentation time and greater broth volumes must be processed per kilogram of product, increasing cumulative aeration, agitation, chilled water demand, and antifoam consumption.37 The economic ramifications of this challenge are clearly captured in our LCC analysis, which identifies high utility costs for electricity (to power compressors and agitators) and chilled water (to dissipate the immense metabolic heat generated during rapid aerobic growth) as major operational expenditures. This explicit link between a physical process challenge (foaming), a fundamental biological requirement (oxygen), and a tangible economic outcome (high utility cost) represents a key strength of our integrated analytical approach. It demonstrates that engineering solutions to mitigate foaming—such as the development of foam-free reactors, advanced process control strategies, or strains engineered for production under microaerobic conditions—are not just matters of operational convenience but are direct levers for improving the economic sustainability of the entire process.37
While the upstream fermentation performance presents a clear area for future improvement, the primary scientific and engineering contribution of this study lies in its methodological rigor and innovative process design. The discussion must pivot from acknowledging limitations to emphasizing the significant and novel advancements this work brings to the field of biosurfactant production. Specifically, the development of a holistic, plant-wide simulation and the proposal of a continuous downstream processing strategy address critical gaps in the existing academic literature.
A survey of the literature reveals that the vast majority of research on rhamnolipid production is narrowly focused on upstream fermentation, with performance metrics typically limited to titer, yield, and productivity achieved in laboratory-scale batch or fed-batch bioreactors.24 While essential for fundamental strain development, these studies often overlook the immense technical and economic challenges of purification and plant-wide integration. Our study's primary innovation is its departure from this paradigm. By constructing a comprehensive simulation that models the entire production chain—from raw material and utility provisioning, through media preparation and fermentation, to a complete multi-step downstream purification train—this work provides a far more realistic and industrially relevant assessment of feasibility. This holistic modelling approach is what enables the detailed Life Cycle Assessment (LCA) and Life Cycle Costing (LCC), forging a direct link between upstream process choices, downstream operational requirements, and overall process sustainability. This level of integrated analysis is exceptionally rare in academic literature and represents a significant step towards bridging the gap between laboratory discovery and industrial application.
The design of the downstream process (DSP) is another area of significant contribution. It is widely recognized that DSP is the principal economic bottleneck in biosurfactant manufacturing, frequently accounting for 60% to 80% of the total production cost due to product dilution, complex fermentation broths, and the need for high purity in many applications.38 Our study confronts this challenge directly by simulating a detailed and industrially coherent purification strategy. The proposed sequence—involving centrifugation and microfiltration for biomass removal, followed by enzymatic protein hydrolysis, pH adjustment for precipitation, and liquid-liquid extraction with ethyl acetate and subsequent solvent recovery—is a logical and robust process flow.
Furthermore, the strategic choice of glucose as the primary carbon source, while limiting upstream titer, is a key enabler of a more efficient DSP. Unlike hydrophobic substrates such as plant oils, which form complex emulsions and are difficult to separate from the rhamnolipid product, water-soluble glucose remains in the aqueous phase, vastly simplifying the initial product recovery steps. This demonstrates a thoughtful consideration of the entire process, where an upstream trade-off is made to gain a significant downstream advantage. While the selected purification method of solvent extraction is conventional, its detailed modelling provides a crucial baseline against which emerging DSP technologies—such as in-situ foam fractionation,15 advanced membrane filtration,39 or various precipitation techniques40—can be rigorously evaluated in future in silico studies.
Ultimately, the most profound value of this work is not the specific yield number generated from the pilot data, but the creation of a powerful and versatile in silico evaluation platform. This validated model functions as a “digital twin” of a potential rhamnolipid biorefinery. It can be used to rapidly and cost-effectively assess the system-wide impact of future innovations. For example, if a new metabolic engineering strategy reported in the literature were to double the fermentation yield, our model could be parameterized with this new data to immediately quantify the cascading effects on utility consumption, downstream equipment sizing, raw material logistics, waste generation, GWP, and overall process profitability. This capability transforms the model from a static report of a single process into a dynamic tool for accelerated, data-driven research and development. This study, therefore, should be viewed not just as a report on a specific fermentation run, but as the delivery of a validated bioprocess evaluation framework that can guide the entire field toward more sustainable and economically viable rhamnolipid production.
From a techno-economic standpoint, the LCC analysis pinpoints raw materials as the dominant driver of operational costs, contributing approximately €20 per kilogram of purified rhamnolipid. Within this category, glucose is the single largest expense, accounting for over 52% of the material cost at €10.40/kg of product. This result is strongly corroborated by recent techno-economic analyses in the literature. Noll et al. (2024), for example, calculated a minimum selling price (MSP) of 58 USD/kg for rhamnolipids produced from glucose, a figure substantially higher than the MSPs for rhamnolipids from soybean oil (20 USD/kg) or stearic acid (10 USD/kg).41 This external validation underscores the prohibitive cost associated with using refined sugars as feedstocks and reinforces the conclusion that a shift toward cheaper, renewable substrates, such as agro-industrial residues, is paramount for achieving economic competitiveness.42 Our analysis also identifies utilities (particularly chilled water for cooling and electricity for aeration/agitation) and labour (concentrated in the multi-step purification stage) as other major cost centres. This aligns perfectly with other techno-economic studies that highlight energy-intensive downstream processing and labour requirements as significant contributors to the final product cost,38 further validating the industrial relevance of our simulation.
The environmental performance assessment yields one of the most significant findings of this study. The cradle-to-gate LCA calculates a GWP of approximately 110 kg CO2-equivalent per kg of purified rhamnolipid. This value is remarkably favourable when compared to other figures in the literature. For instance, a gate-to-gate LCA by Kopsahelis et al. (2018) reported a GWP of 567 kg CO2-eq/kg for rhamnolipid production, half an order of magnitude higher than our result.43 While system boundaries and allocation methods can account for some variability, this stark contrast strongly suggests that our process, designed with integrated utility generation and high solvent recovery efficiency, represents a significantly more optimized and environmentally benign industrial scenario. This finding provides a new, more optimistic benchmark for the environmental footprint of rhamnolipid production. The LCA hotspot analysis further reveals that media preparation is the primary contributor to GWP, land use, and terrestrial ecotoxicity, driven by the agricultural production and processing of glucose and yeast extract. Conversely, the fermentation stage is the dominant hotspot for water consumption, reflecting the large volumes required for the bioreactors and cleaning cycles. These findings are consistent with LCAs of other bio-based products, where feedstock provision and the water intensity of fermentation are known to be major environmental burdens.44 This analysis provides clear, actionable targets for sustainability improvements: first, by sourcing feedstocks from less impactful origins, such as second-generation lignocellulosic biomass, and second, by implementing aggressive water recycling and management strategies throughout the facility.
A key methodological contribution of this study is the development of a holistic, plant-wide simulation coupled to LCA and LCC. The novelty of the approach lies in anchoring this integrated framework to a non-pathogenic, glucose-only P. putida process, while being explicit about the assumptions required to extrapolate from plasmid-based, antibiotic-dependent pilot data to an antibiotic-free industrial scenario. This level of transparency is essential for using the resulting “digital twin” to assess future strain improvements and process innovations under realistic constraints. Within this framework, future simulations can explicitly explore scenarios such as:
• A plasmid + antibiotic case, retaining pilot-level titers while fully accounting for antibiotics and their associated waste-treatment and regulatory burdens, enabling quantification of the environmental and economic penalties of plasmid-based systems at scale.
• A genome-integrated, low-titer
case, eliminating antibiotics at the cost of reduced titers, providing a realistic lower bound for an industrial P. putida process.
•
Mixed sugar–oil versus glucose-only
cases, balancing higher titers against increased downstream complexity and differing feedstock impacts.
Such scenario-based analyses are largely absent from the literature and are critical for identifying trade-offs between biosafety, productivity, and sustainability.
The LCA and LCC results further indicate that, under the assumptions adopted here, the glucose-only P. putida process can achieve relatively favourable environmental performance compared with literature benchmarks, despite modest titers. This underscores the role of plant-wide design choices—such as energy integration, solvent recovery, and water recycling—in partially offsetting biological inefficiencies. When the costs and impacts of antibiotics are explicitly included, as required for realistic assessments of plasmid-based systems, the case for antibiotic-free, genome-integrated strains becomes even stronger. The main challenge for future work is therefore to recover plasmid-level titers in such strains through advanced metabolic engineering, while continuing to improve process integration and resource efficiency.
Taken together, the biological, economic, and environmental results reveal a striking sustainability paradox: a biologically inefficient process, as reflected by low fermentation titers, can nevertheless outperform alternatives environmentally. Although low yields would normally increase feedstock use and GWP, the low overall GWP observed here indicates that plant-scale design—particularly energy integration, heat recovery, and near-complete solvent recycling—can more than compensate for poor carbon conversion in the bioreactor. This leads to a clear conclusion: sustainable biomanufacturing depends not only on improved microbial performance, but equally on holistic, resource-efficient process design. This study demonstrates that substantial environmental gains are achievable even with a sub-optimal biocatalyst, highlighting the power of integrated biological and process engineering.
5. Conclusions
This study presents an integrated process simulation, LCA, and LCC for rhamnolipid production using an engineered P. putida KT2440 strain on glucose as the sole carbon source. The work is grounded in pilot-scale data from 30 L and 150 L fermentations, in which rhamnolipid biosynthesis was driven by a plasmid-based expression system maintained with antibiotics. These pilot data were used to parameterize an industrial process model that assumes a future production strain with chromosomally integrated rhamnolipid genes and completely antibiotic-free operation. This necessary projection from plasmid-based, antibiotic-dependent experiments to a genome-integrated, antibiotic-free industrial scenario creates an inherent tension that is central to the interpretation of the results.
The main limitations of the process remain the modest rhamnolipid titers (0.26–2.21 g/L) and yields (0.01–0.11 g/g) and the fact that the simulated industrial performance is likely optimistic, as it implicitly assumes that these titers can be preserved after chromosomal integration. Antibiotics, which were used in all pilot fermentations for plasmid maintenance, are not included as explicit inputs in the LCI or LCC and therefore underestimate the environmental and economic burdens of the experimental configuration. Any industrial process that retains plasmid-based expression and antibiotic selection would perform worse than reported here in both economic and environmental terms.
Despite these limitations, the study makes several important contributions. It establishes a glucose-only rhamnolipid production platform based on a non-pathogenic P. putida safety strain, develops a comprehensive plant-wide simulation spanning upstream fermentation and a realistic downstream purification train, and integrates this model with LCA and LCC to identify environmental and economic hotspots. The results show that media preparation (dominated by glucose), utilities (driven by aeration, agitation, and cooling), and labour-intensive downstream processing are key levers for improvement. They also demonstrate that careful process integration can deliver relatively low greenhouse gas emissions per kilogram of product compared with literature values, even at modest titers.
Looking forward, the transition to plasmid-free, antibiotic-free production strains is imperative for industrial deployment, not only from a regulatory and biosafety perspective but also in terms of long-term cost and environmental performance. Future research should therefore proceed along four interlinked directions:
1.
Antibiotic-free strain development and benchmarking
Systematic development and characterization of genome-integrated P. putida KT2440 strains for rhamnolipid production on glucose-only media are needed. These strains should be evaluated under the same fermentation and downstream conditions as the current pilot configuration, with explicit measurement of titers, yields, foaming behaviour, and robustness. The resulting data should be integrated into the existing simulation framework to create realistic “genome-integrated, antibiotic-free” scenarios, directly comparable to the plasmid-based baseline.
2.
Trade-off analysis between plasmid-based and genome-integrated systems
Future simulations should explicitly incorporate scenarios that contrast high-titer plasmid + antibiotic configurations with lower-titer genome-integrated, antibiotic-free strains. These scenarios must include antibiotics and plasmid-related infrastructure in the LCI/LCC for the former and reduced titers for the latter, allowing a quantitative assessment of how biosafety and regulatory compliance trade off against productivity and how this balance affects unit costs, greenhouse gas emissions, and other environmental indicators.
3.
Substrate and process strategy comparisons
Scenario analyses should be extended to compare glucose-only operation with mixed sugar–oil feeds. This includes assessing whether higher titers achievable with sugar–oil co-feeding can compensate for more complex downstream processing and different feedstock impacts. Such analyses should also explore second-generation glucose sources and simple fatty acids derived from waste streams, framed within the same LCA/LCC methodology.
4.
Metabolic and process intensification
Advanced metabolic engineering strategies (e.g. dynamic control of precursor supply, re-balanced central metabolism, improved secretion systems) should be explored to recover or surpass plasmid-level titers in genome-integrated strains. In parallel, process intensification approaches targeting foaming, oxygen transfer, and downstream purification (e.g. foam fractionation, improved membrane processes, in-situ product removal) should be evaluated within the digital twin to identify combinations of strain and process innovations that deliver step changes in both economic and environmental performance.
By explicitly distinguishing between the plasmid-based, antibiotic-dependent pilot experiments and the antibiotic-free, genome-integrated industrial scenarios assumed in the simulations, and by focusing on glucose-only fermentation with a non-pathogenic host, this work provides a transparent and actionable baseline for future development. The framework presented here can be used to systematically explore the trade-offs between biosafety, productivity, cost, and environmental impact, guiding the design of next-generation rhamnolipid processes that are not only technically and economically viable, but also aligned with regulatory and sustainability requirements.








