Background
Virtual reality (VR) is a fully computer-generated environment that, through the use of head-mounted stereo displays (HMDs) and spatial tracking of the head, aims to provide a sense of immersion in the generated environment (XR Safety Initiative, 2025). Although the spatial, spectral and temporal fidelity of HMDs continues to advance, all current commercially available HMDs remain constrained by a single fixed focal plane, limiting natural depth perception. In natural stereoscopic vision, accommodation (the ability to focus and maintain clear vision) and vergence (coordinated eye movements to maintain single vision) are complementary and necessary to fuse the two retinal images into a single stereoscopic percept. The HMD’s stereoscopic displays can generate appropriate binocular disparities that initiate vergence responses consistent with the simulated depth of virtual objects. However, because the display has a fixed focal distance, the accommodation demand remains constant and fixed regardless of the simulated depth. Thus, VR technologies suffer from a vergence-accommodation conflict (VAC) (Wann & Mon-Williams, 1996). The VAC has been linked to increased subjective discomfort such as visual fatigue and cybersickness symptoms (Kim et al., 2014; Saredakis et al., 2020), disrupted depth perception (Naceri et al., 2015), slower decision-making, and changes in oculomotor functions (Szpak et al., 2019).
Beyond gaming and entertainment, immersive technologies have advanced in areas such as education, healthcare and the military (Perkins Coie, 2024). The use of VR technologies has also shown promising results in vision therapy, including treatment of amblyopia (reduced vision caused by abnormal visual development) (Shao et al., 2023), treatment of accommodative and vergence dysfunction (Li et al., 2022), and recovery of stereovision (Vedamurthy et al., 2016). However, individuals with common vision problems, such as refractive errors (Williams et al., 2015), anomalous binocular vision (Garcia-Munoz et al., 2016; Gomes & Franco, 2024; Hagen et al., 2020), poor or absent depth perception (Hess et al., 2015), or uncorrected refractive errors (Vision Loss Expert Group of the Global Burden of Disease et al., 2024; Yekta et al., 2022) may find it difficult to adapt to a VR environment. Common vision problems are affecting more than half of the population (Williams et al., 2015), and many of these can be corrected with prescription eyeglasses or contact lenses (Hess et al., 2015). Nevertheless, even individuals with no difficulties in the physical world may still experience symptoms of cybersickness (Pladere et al., 2022) or changes in visual or oculomotor functions following a VR task (Sumarokova et al., 2024). Studies have reported both improvement (Munsamy et al., 2020) and deterioration (Szpak et al., 2020) of oculomotor functions post-VR, even within the same experiment (Banstola et al., 2022), and no change in visual function (Tychsen & Foeller, 2020). These findings suggest that the use of VR technologies may affect visual and oculomotor functions differently across individuals, possibly due to differences in baseline visual and oculomotor capabilities, or characteristics of the VR environment.
As the use of VR technologies is predicted to increase (Alsop, 2024), it is important to understand how the use of VR technologies affects visual and oculomotor functions in individuals with and without common vision problems, as well as how common vision problems affect performance and user comfort during and following VR exposure. A clear understanding of the interaction between visual and oculomotor functions and use of VR is essential for designing inclusive VR technologies that ensure accessibility and user comfort. Existing research on this topic remains inconclusive, with findings reporting both improvements and deteriorations in oculomotor functions following VR exposure. This inconsistency suggests gaps in current knowledge and underscores the need for an overview of existing evidence.
Review objective and questions
The primary objective of this scoping review was to map the current knowledge on the interaction between visual and oculomotor functions and the use of VR technologies.
Review questions were:
- How do visual and oculomotor factors impact performance and user comfort during and following VR exposure?
- How does the use of VR technologies affect visual and oculomotor functions?
- What are the current knowledge gaps of the interaction between visual and oculomotor functions and the use of VR?
Methods
The scoping review was conducted in accordance with the Joanna Briggs Institute (JBI) Manual for Evidence Synthesis (Peters et al., 2020) and followed the Preferred Reporting Items for Systematic Reviews and Meta-Analyses extension for Scoping Reviews (PRISMA-ScR) reporting guidelines (Tricco et al., 2018). A preliminary search in the Cochrane Database of Systematic Reviews and JBI Evidence Synthesis in January 2025, confirmed that no existing scoping review protocols on the topic were available. However, one systematic literature review on vergence and accommodation changes post-VR was identified (Gomez-Patino et al., 2024), but the present scoping review aims to explore broader contexts, such as the interaction between visual and oculomotor functions and VR use. A protocol was developed prior to conducting the review but was not registered or published.
Eligibility criteria
Eligibility criteria were defined using the Participants, Concept and Context framework proposed by JBI (Peters et al., 2020). The review included studies that examined the interaction between visual and oculomotor functions and the use of VR technologies. Studies on human participants of any age were included. To be included, the studies had to report measurements of vision parameters, such as assessment of visual acuity, accommodation, binocular vision, or interpupillary distance, either before, during, or after the participants engage with VR. Studies conducted in experimental, clinical, or research settings, using fully immersive stand-alone or tethered stereoscopic VR headsets (Angelov et al., 2020), were included. Studies focusing on vision impairment, such as blindness, low vision, or eye diseases, and those focusing on vision rehabilitation or enhancement were excluded.
Only peer-reviewed studies published in English and available in full text were considered. Additionally, the review focused on studies published from 2016 onwards, as this period marks the introduction of accessible consumer headsets (VR Space, 2024; Wang et al., 2022).
Information sources
The review included quantitative studies with experimental and epidemiological designs, such as randomized and non-randomized trials, quasi-experimental, pre-post, cohort, case-control, and cross-sectional studies. Qualitative studies, reviews, letters, editorials, conference proceedings, and abstracts were excluded.
Search strategy
To identify relevant studies, a systematic search was performed. Controlled vocabulary terms, synonyms, and related terms for the concepts visual or oculomotor functions and virtual reality technologies were mapped and reviewed by the authors. The search strategy was adapted for each database and its thesaurus, in consultation with specialist librarians. Searches were conducted in Medline (Ovid), Web of Science, and Scopus on May 1, 2025, while an updated search was performed on December 4, 2025. Backward citation chaining was conducted on December 8, 2025, by screening the reference lists of all included studies. The detailed search strategy for each database and the protocol for backward citation chaining are available in the DataverseNO repository (Krastina et al., 2026).
Source of evidence selection
After the search was conducted, all records were imported into EndNote (Clarivate, 2013). Duplicate removal was performed in EndNote using the built-in duplicate detection function, followed by a manual duplicate check based on titles, journal names, and other metadata. Title and abstract screening was performed independently by two reviewers (IK, LAH) using Rayyan (Ouzzani et al., 2016). Disagreements were resolved by consulting a third reviewer (ES). Full-text screening of potentially eligible studies was performed by the first reviewer (IK).
Data extraction
Data extraction was performed by the first reviewer (IK) using a data extraction table developed to match the review objectives. The extracted data included:
•
Study characteristics: Authors, title, publication year, journal, and country of data collection. The country of data collection was determined from the location given in the methods section or, if not stated, from the country where ethical approval was obtained.
•
Participant characteristics: Sample size, age and sex/gender distribution, and eligibility criteria for each study related to vision parameters.
•
VR intervention characteristics: Type of VR headset and its specifications (as provided in the study), type and duration of the VR task.
•
Vision data: Type of vision measurements performed, vision measurement outcomes, vision-associated comfort measures (visual fatigue, eyestrain, cybersickness recorded during or following VR exposure), as well as performance measures related to vision (distance and size perception, task-solving ability).
•
Main outcome: The main results on the interaction between visual and oculomotor functions and VR exposure, as reported in the study.
Analysis and presentation of results
A PRISMA flow diagram (Tricco et al., 2018) was used to illustrate the study selection process, and Microsoft Excel for Mac V.16.100.1 (Microsoft Corporation, Redmond, Washington, USA) was used for evidence mapping and to perform descriptive analysis.
Study, participant, and VR intervention characteristics were summarised to highlight areas where current research may be incomplete or lack diversity. The remaining findings were presented in two sections. The first section included studies that evaluated how visual and oculomotor factors affected performance and user comfort during and after the use of VR technologies. The second section included studies that assessed how the use of VR technologies affected visual and/or oculomotor functions.
Results
The study selection process is illustrated in the PRISMA flow diagram (Tricco et al., 2018) in
Figure 1. The search identified 2917 records, of which 1342 were duplicates, resulting in 1575 records for screening. Of these, 1531 were excluded in the title- and abstract-screening stage. For full text review, 44 reports were assessed, of which one was not possible to retrieve in full text. Seventeen studies were excluded for one of the following four reasons: (1) did not use fully immersive stereoscopic VR headsets; (2) did not report the type of VR HMD used; (3) did not report measurements of vision parameters; (4) was out of scope. After full-text review, 26 studies were included in the scoping review for data extraction. Two additional reports were identified and included through updated search and citation chaining.
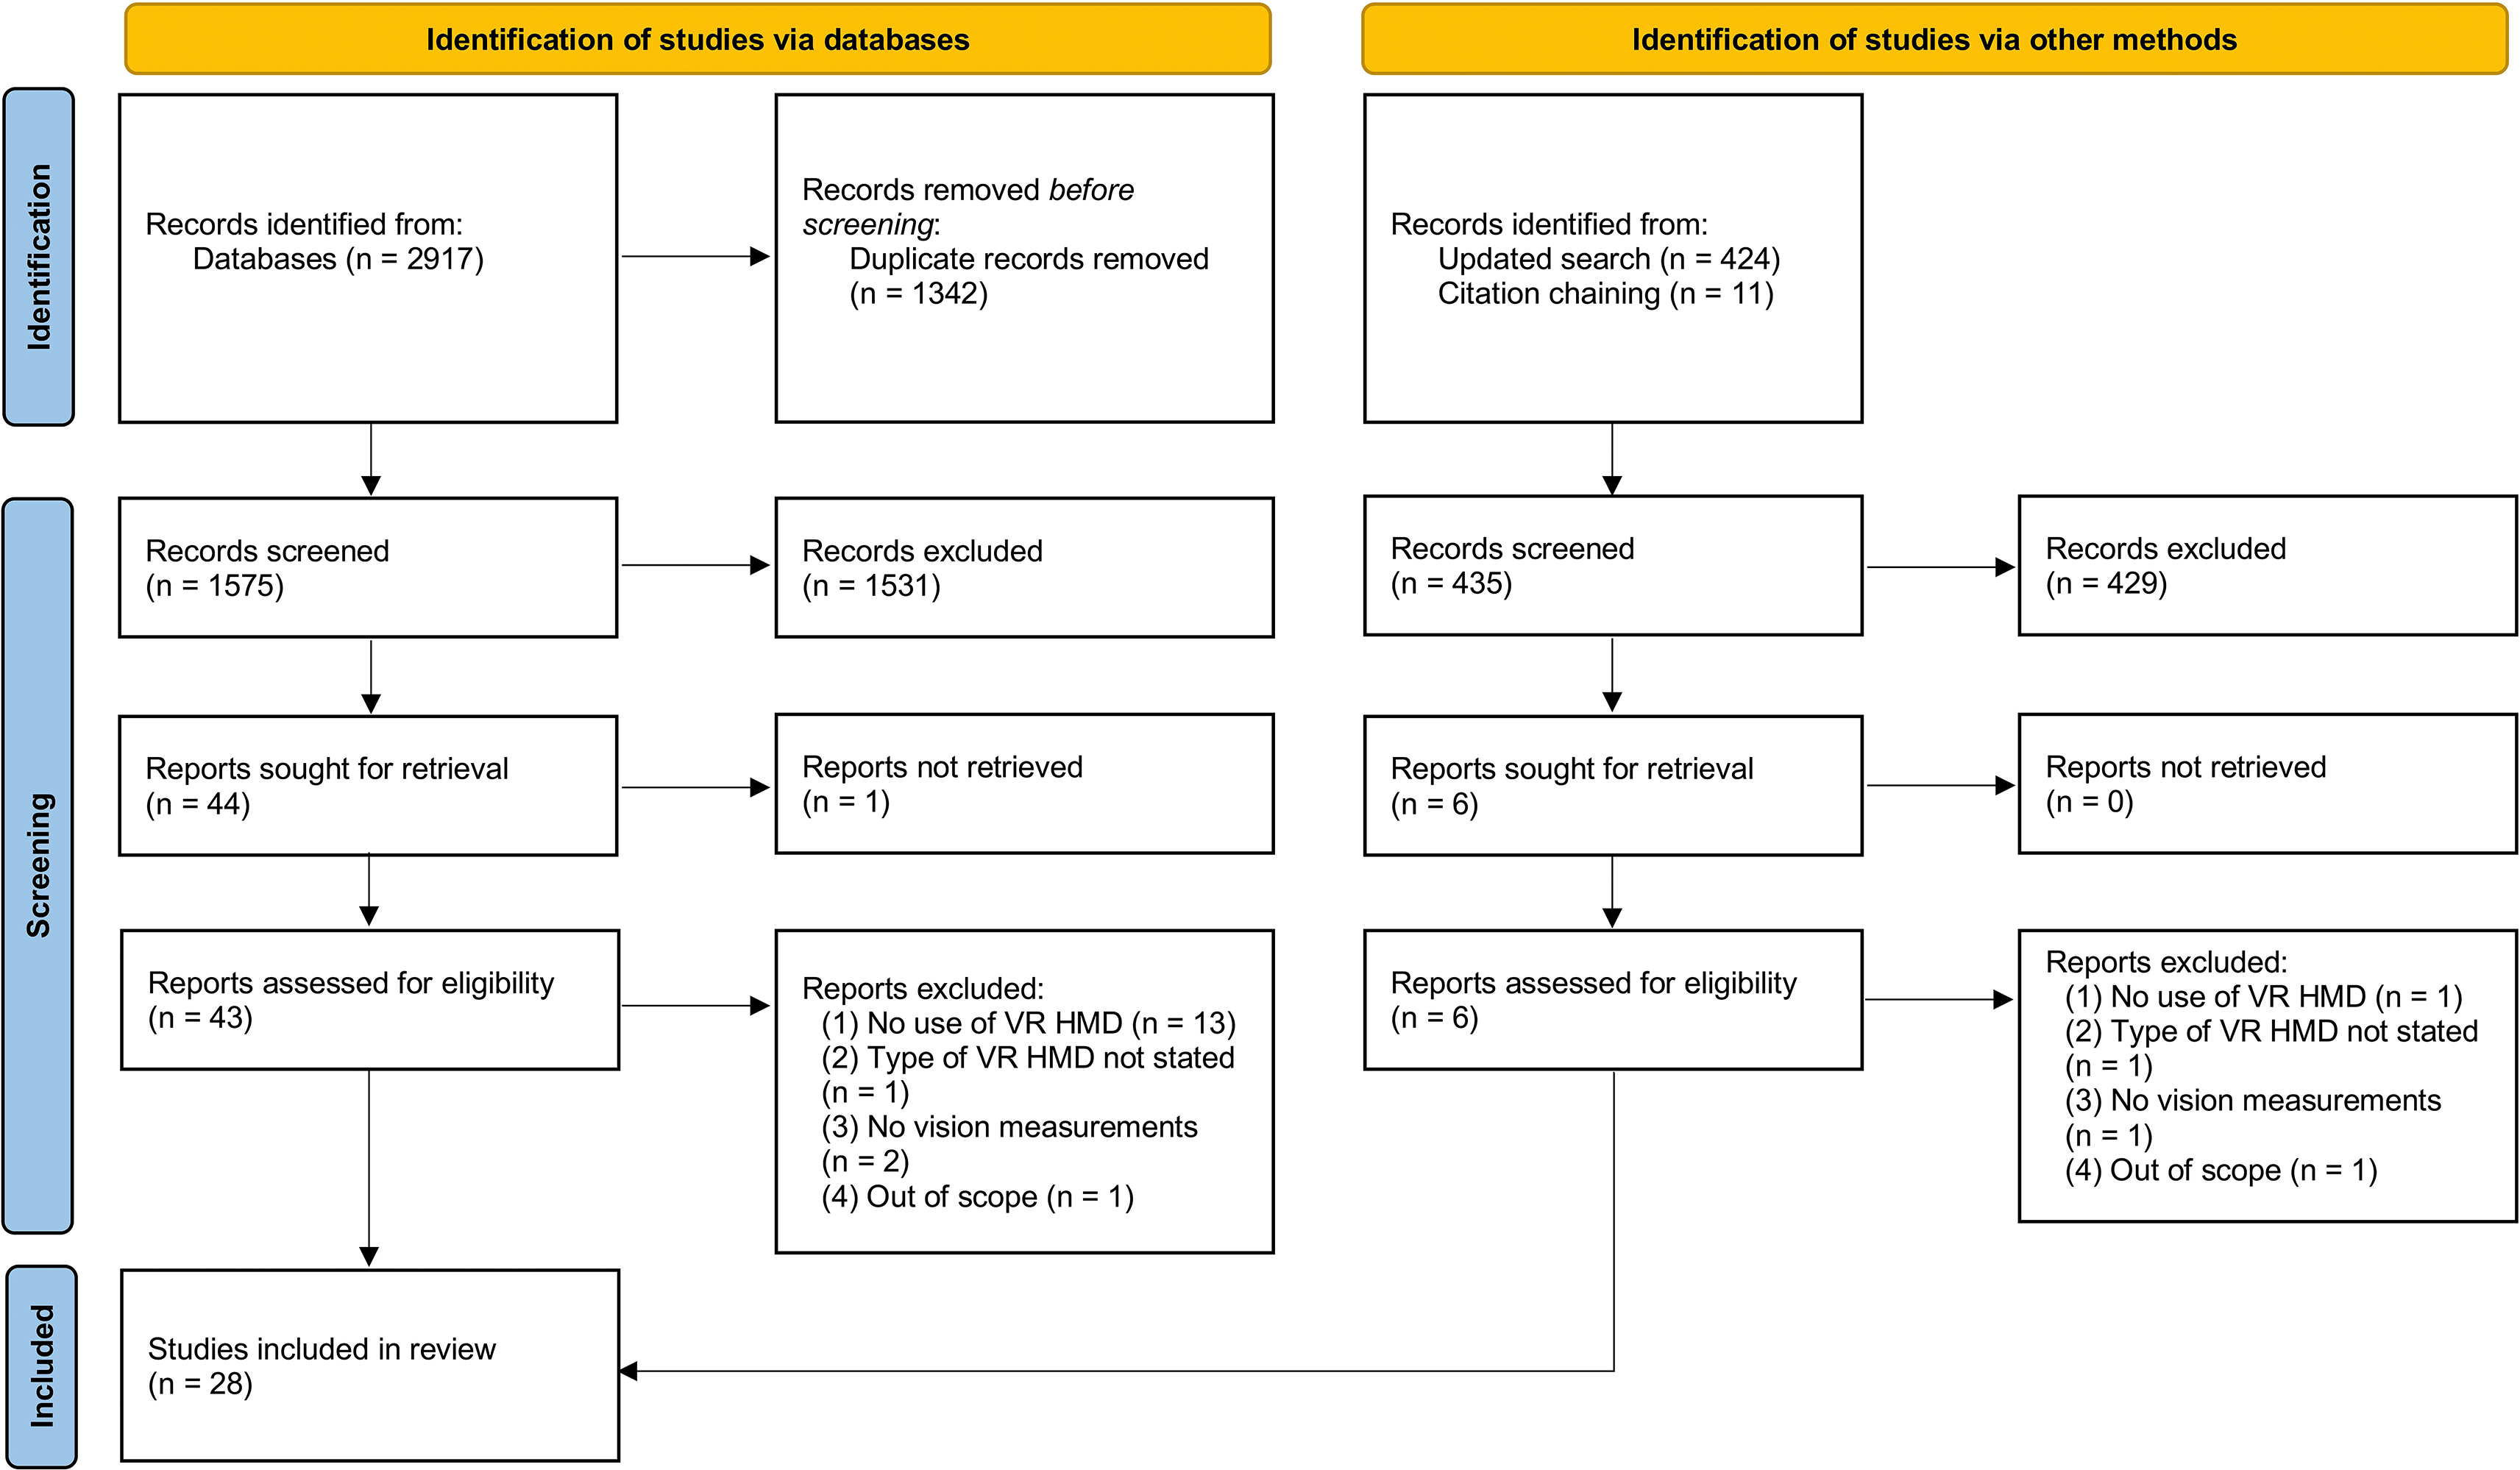
Figure 1. PRISMA flow diagram.
PRISMA flow diagram illustrating the study selection process, including records identified from Medline (Ovid), Web of Science, and Scopus as well as from updated search and backward citation chaining.
Study characteristics
A total of 28 studies from 13 countries were included, the majority of which were from Australia (n = 5) and Canada (n = 5), followed by the Republic of Korea (n = 4). The scoping review included studies published since 2016, the majority being published in 2021 (n = 7) and 2020 (n = 6). Distribution of studies by country of data collection and publication year is shown in
Figure 2.
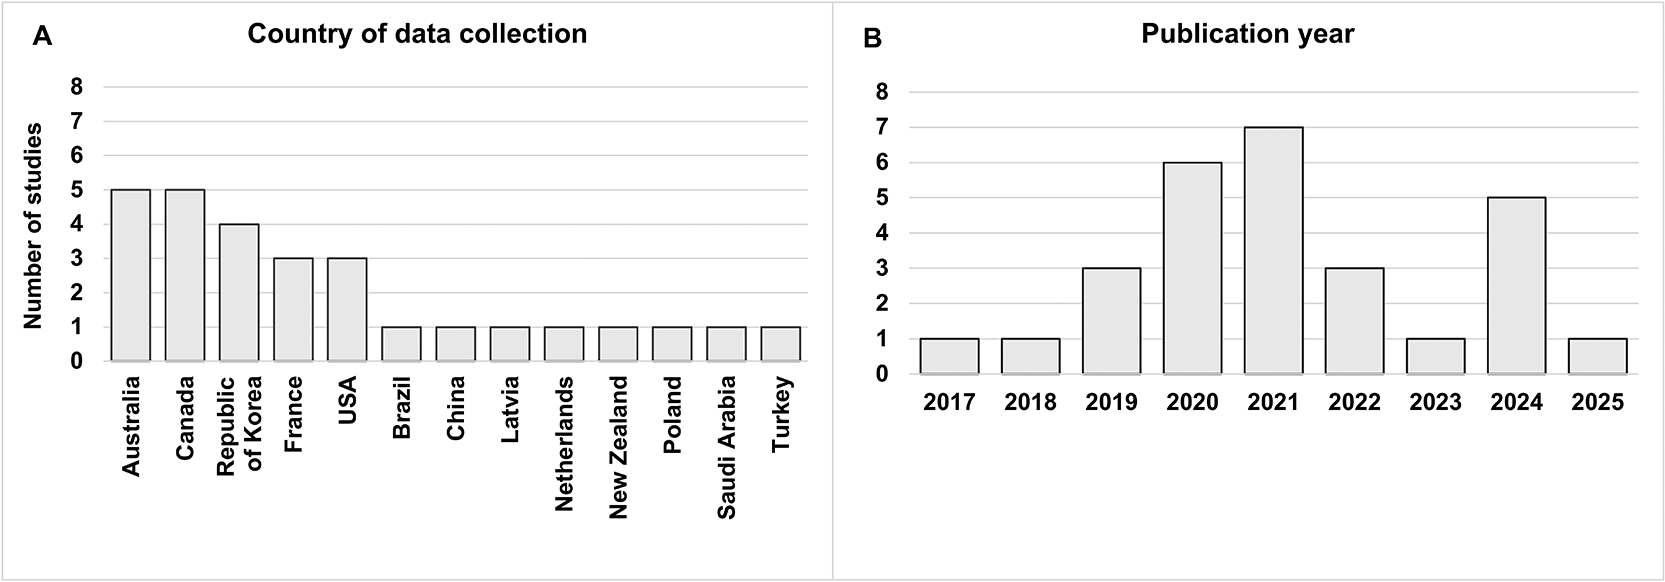
Figure 2. Characteristics of reviewed studies.
Number of studies by (A) country of data collection, and (B) publication year.
Participant characteristics
Figure 3 shows an overview of sample size, age and sex/gender distribution of the reviewed studies. The sample size varied from eight (Hartle & Wilcox, 2021) to 140 participants (Wainman et al., 2020), with the majority (46%) having 11 to 30 participants (Figure 3A). Most studies (64%) conducted their research with participants aged 18 to 32 years (Figure 3B). Regarding sex/gender distribution, 54% of the studies reported having between 40% and 60% female participants (Figure 3C). Two studies (7%) included fewer than 40% females, whereas five (18%) studies included more than 60% females. Three studies (11%) reported participant dropout due to discomfort, affecting 2% (Pala et al., 2021a), 6% (Tychsen & Foeller, 2020), and 4% (Yoon et al., 2020) of their participants. In another study (Sumarokova et al., 2024), 2% were unable to complete the VR task, but the reason was not specified.
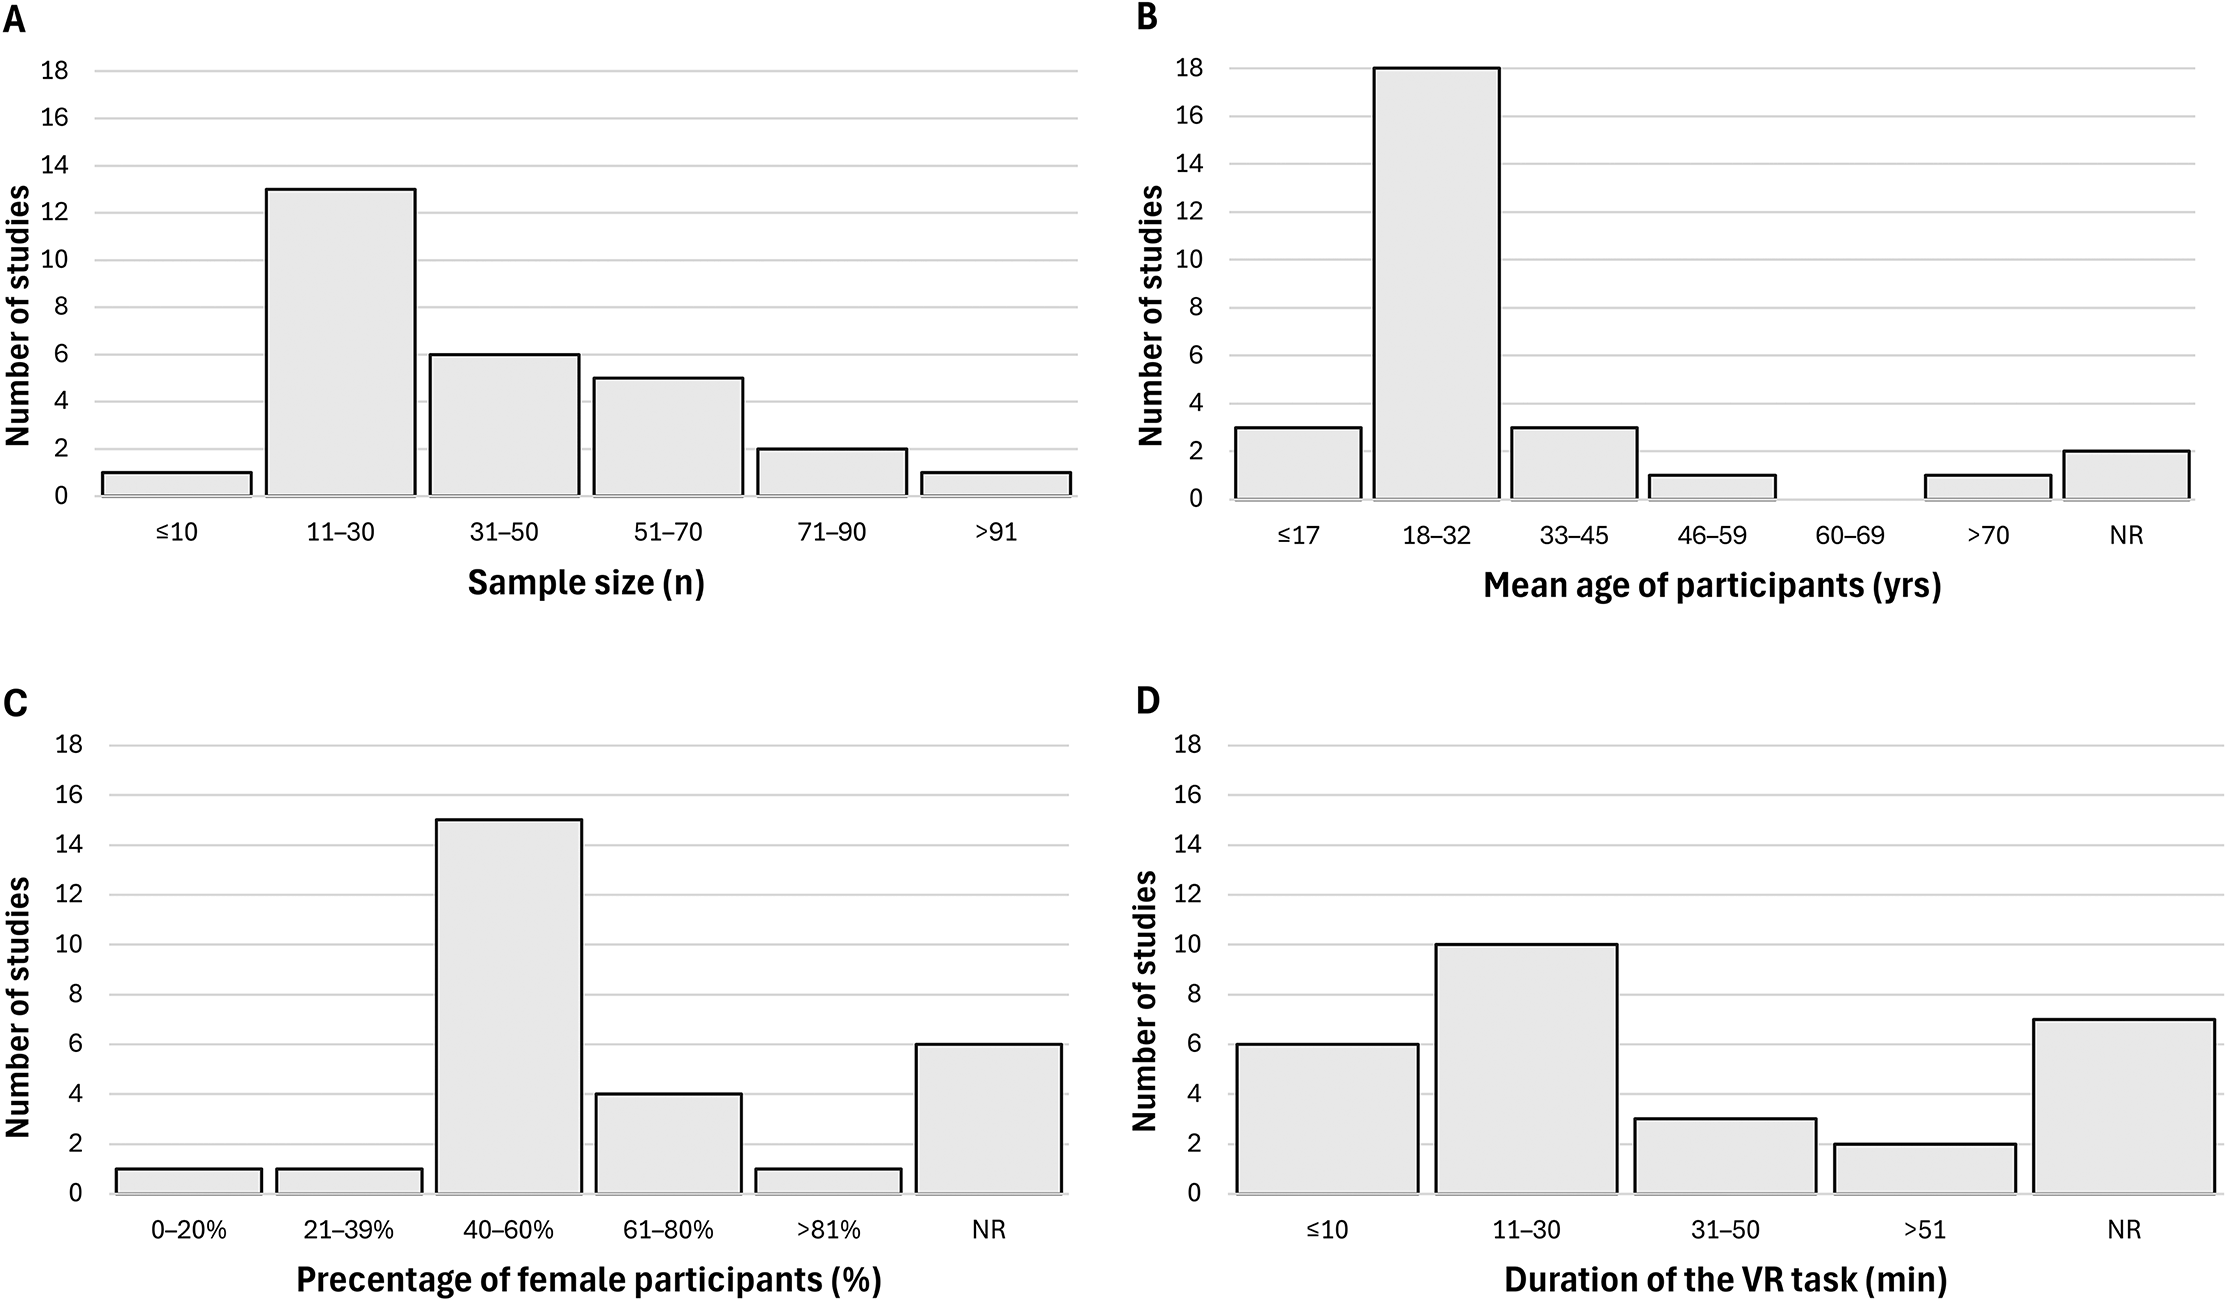
Figure 3. Participant characteristics and duration in VR across studies.
Participant characteristics, including (A) sample size, (B) age, and (C) sex/gender distribution presented as percentage of females (%), as well as (D) duration of the VR task performed. NR = not reported.
Eligibility criteria related to vision parameters
Of the 28 studies reviewed, 23 (82%) reported eligibility criteria related to vision parameters, as summarised in
Table 1. The most common inclusion criterion was normal or corrected-to-normal distance visual acuity (71%, n = 20), however, half of these studies did not define any threshold for normal visual acuity and/or relied on the participants’ subjective self-assessment.
Table 1. Eligibility criteria related to vision parameters.
Summary of inclusion criteria for vision parameters as identified in the reviewed studies (n = 23). Five studies did not report any eligibility criteria related to vision. NS = not specified.
VR intervention characteristics
Figure 3D summarises the duration of VR exposure across the studies. In ten studies (36%), the duration ranged from 11 to 30 minutes, while five studies (18%) reported sessions shorter than 11 minutes. In seven (25%) of the studies, duration was not reported, but task descriptions suggest most lasted less than 20 minutes. In four studies (14%), VR immersion was repeated at least twice, with visual and oculomotor functions measured after each session (Collet et al., 2025; Szpak et al., 2020; Turnbull & Phillips, 2017; Tychsen & Foeller, 2020). The remaining studies had one VR session. For the VR task, the studies used commercially available VR games (43%, n = 12), custom-made tasks designed for VR (39%, n = 11), playback of a 3D video (11%, n = 3), or learning simulations (7%, n = 2).
Impact of visual and oculomotor factors on performance and user comfort in VR
Eleven (39%) of the 28 reviewed studies evaluated how visual and oculomotor factors affected user comfort and performance during and after VR use.
Table 2 gives an overview of the five studies focusing on user comfort, addressing cybersickness and visual fatigue. Ten minutes of VR gameplay was found to be associated with greater cybersickness symptoms in participants who had slightly reduced stereoacuity or presence of exophoria (latent divergent misalignment of the eyes) (Dericioglu & Kubat, 2024), while 20–30 minutes of VR gameplay resulted in greater cybersickness symptoms in participants with smaller positive fusional vergence (Son et al., 2024) or a mismatch between the user’s interpupillary distance (IPD) and the inter-display distance in the VR headset (Stanney et al., 2020). Iskander and Hossny (2021) reported that the vergence-accommodation conflict may increase the load on the vergence system in VR, leading to changes in vergence eye movements and increased visual fatigue. Note that only one-third of the participants who habitually wore prescription glasses used them during this experiment (Iskander & Hossny, 2021). Lee et al. (2021) found that simulated anisometropia (difference in refractive error between eyes) of 1 D in individuals with otherwise normal visual function had minimal impact on visual fatigue during or post-VR exposure.
Table 2. Overview of studies on the impact of visual and oculomotor parameters on VR user comfort.
User comfort is here limited to cybersickness symptoms and visual fatigue. Sex/gender distribution is given as percentage of females (%F). NR = not reported. IPD = interpupillary distance. NPC = near point of convergence.
|
Study | Time in VR | VR task | Participant characteristics | Vision measurements | Summary of visual-oculomotor interaction with VR |
|---|
| n | Mean age (yrs) ± SD (range) |
%F |
|---|
| Stanney et al. (2020) | 20 min | Riding a virtual rollercoaster | 46 | 18 to 30 | 50 | Pre-VR: field of view, IPD | A larger mismatch between IPD and the inter-display distance in VR headsets was associated with higher levels of cybersickness. |
| Iskander and Hossny (2021) | ~10 min | Visually following a cube across different depths, and moving virtual balls between two height levels | 26 | 29.84 ± 7.28 (21 to 45) | NR | During VR: eye movements | Greater variability in vergence angle and reduced stability of eye movements in VR were associated with visual fatigue. |
| Lee et al. (2021) | 10 min | VR gameplay during simulation of 1D anisometropia | 34 | 35.3 ± 7.6 (21 to 50) | 47 | Pre-VR: dominant eye
Pre- and post-VR: accommodative micro fluctuation, maximum accommodative power, refractive error | Simulated anisometropia of 1D had minimal effect on visual fatigue during short exposure to VR. |
| Dericioglu and Kubat (2024) | 10 min | VR gameplay | 20 | 29.8 ± 0.57 | 55 | Pre-VR: refractive error, phoria
Pre- and post-VR: accommodation, stereoacuity, pupil size | Increased cybersickness symptoms post-VR were associated with poorer stereopsis and exophoria pre-VR. |
| Son et al. (2024) | 30 min | VR gameplay | 32 | 24.94 ± 4.20 | 63 | Pre-VR: refractive error
Pre- and post-VR: distance and near phoria, NPC, positive and negative fusional vergence at distance and near, vergence facility | Smaller positive vergence reserves at baseline were associated with increased cybersickness. |
Six studies explored how visual and oculomotor factors affected performance in VR. See
Table 3 for an overview. In these studies, the VR task was specifically designed for the purpose of the experiment. Based on the methods description, it was not possible to establish visual demand, however most studies required participants to have good distance vision and stereovision (Hartle & Wilcox, 2021, 2022; Rzepka et al., 2023; Wainman et al., 2020). Most studies (83%) did not report the time spent in VR. The presence of stereovision enhanced depth perception (Hartle & Wilcox, 2021, 2022) and learning outcomes (Wainman et al., 2020), whereas its absence led to poorer performance. However, in a object size perception task, participants relied more on their prior knowledge than binocular cues (Rzepka et al., 2023). Binocular vision conditions, such as exotropia (manifest divergent misalignment of the eyes), were associated with slower completion of block-building tasks (Chung et al., 2021). Hardware limitations, such as a mismatch between the user’s IPD and the inter-display distance in the VR headset, were associated with perceptual distortions (Tong et al., 2022).
Table 3. Overview of studies on the impact of visual and oculomotor parameters on performance in VR.
Performance refers here to distance and size judgement, as well as learning outcomes. Sex/gender distribution is given as percentage of females (%F). NR = not reported. IPD = interpupillary distance.
|
Study | Time in VR | Task in VR | Participant characteristics | Vision measurements | Summary of visual-oculomotor interaction with VR |
|---|
| n | Mean age (yrs) ± SD (range) |
%F |
|---|
| Wainman et al. (2020) | 10 min | Learning anatomy in physical, mixed and virtual environments with and without binocular cues | 140 | 18.9 ± 1.5 | NR | Pre-VR: stereoacuity | Removing binocular cues reduced learning more in VR than in physical or mixed environments. |
| Chung et al. (2021) | NR | Watching a car moving away and performing a block-building task | 76 | 6 to 12 | 45 | Pre-VR: stereoacuity, ocular deviation During VR: amount of divergence | Children with exotropia completed block-building tasks in VR more slowly than their peers. |
| Hartle and Wilcox (2021) | NR | Estimating depth in three conditions: (1) motion parallax alone, (2) binocular disparity alone, and (3) both combined | 8 | NR | NR | Pre-VR: IPD | Depth perception was more precise with binocular disparity alone or in combination with motion parallax, compared with motion parallax alone. Similar results were found in a physical environment. |
| Hartle and Wilcox (2022) | NR | Estimating depth at two distances (83 cm and 130 cm) in physical and virtual environments under both monocular and binocular viewing conditions | 16 | NR | NR | Pre-VR: IPD | Depth assessment was better under binocular than monocular viewing conditions, however, it was worse in VR than in physical environments. |
| Tong et al. (2022) | NR | Adjusting the angle between two surfaces to 90° under various viewing conditions and IPD settings | 14 | 33 | 50 | Pre-VR: IPD | Minor mismatches between IPD and inter-display distance in the VR headsets led to slant misperception. |
| Rzepka et al. (2023) | NR | Estimating the perceived size and distance of virtual objects in binocular and monocular conditions | 22 | 18 to 25 | NR | Post-VR: dominant eye, stereoacuity | Participants relied on familiar size despite available binocular cues in VR. |
Impact of VR technology use on visual and oculomotor functions
Twenty of the 28 reviewed studies (71%) evaluated the impact of VR technology use on visual and/or oculomotor functions, by performing vision measurements during or pre- and post-VR exposure.
Tables 4–7 provide an overview of the studies, categorized by the vision parameters assessed: vergence eye movements and accommodation (
Table 4), heterophoria (latent misalignment of the eyes) and heterotropia (manifest misalignment of the eyes) (
Table 5), stereoacuity (
Table 6), and refractive error and visual acuity (
Table 7).
Table 4. Overview of studies on the impact of VR technology use on vergence and/or accommodation.
Sex/gender distribution is given as percentage of females (%F). NR = not reported. IPD = interpupillary distance. NPA = near point of accommodation. NPC = near point of convergence.
|
Study |
Time in VR | Task in VR | Participant characteristics | Vision measurements | Summary of visual-oculomotor interaction with VR |
|---|
| n | Mean age (yrs) ± SD (range) |
%F |
|---|
| Turnbull and Phillips (2017) | 40 min + 40 min | Exploring real and virtual indoor and outdoor environments | 19 | 24.7 ± 4.0 (18 to 35) | 53 | Pre- and post-VR: fixation stability and disparity, accommodation amplitude, phoria, stereoacuity, choroidal thickness | No changes in amplitude of accommodation post-VR, nor between conditions. |
| Guo et al. (2019) | 60 min | VR gameplay with and without breaks compared to smartphone gameplay with and without breaks | 80 | 23.23 ± 1.78 | 34 | Pre- and post-VR: distance visual acuity, pupil size, accommodation response | VR use had minimal impact on accommodation compared to smartphone use, and taking breaks improved accommodation recovery. |
| Iskander et al. (2019) | ~3 min | Focusing on a cube changing position and depth, and following a slowly moving cube at a constant depth | 26 | 29.46 ± 7.5 (21 to 45) | NR | During VR: calculated vergence angles, fixation | Vergence angles varied more in VR than in physical environments, leading to visual fatigue. |
| Szpak et al. (2019) | 30 min | VR gameplay | 55 | 21.60 ± 3.13 | 40 | Pre-VR: stereoacuity, visual acuity
Pre- and post-VR: NPA, NPC | Poorer near point of accommodation post-VR, with no change in near point of convergence. |
| Drew et al. (2020) | ~30 min | VR gameplay | 41 | ≥ 18 | 46 | Pre-VR: stereoacuity, fixation disparity
Pre- and post-VR: vergence facility, binocular accommodation facility | Binocular accommodation and vergence facility improved post-VR, similar to after a comparable physical task. |
| Szpak et al. (2020) | 10 min (day 1) + 50 min (day 2) | VR gameplay | 36 | 20.55 ± 2.29 | 42 | Pre-VR: stereoacuity, visual acuity
Pre- and post-VR: NPA, NPC | Poorer near point of accommodation and convergence after 10- and 50-min VR gameplay. Results returned to baseline after approximately 40 min. |
| Yoon et al. (2020) | 30 min | VR gameplay in two settings: immersive (360-degree VR environment) vs. non-immersive (fixed, static VR environment) | 23 | 23.9 ± 3.7 (20 to 35) | 52 | Pre- and post-VR: refraction, accommodation response, NPA, NPC, stereoacuity, distance and near phoria | Poorer near point of accommodation and convergence post-VR. Similar decrease in near point of convergence as after non-immersive gameplay. No changes in other measurements of accommodation. |
| Alhassan et al. (2021) | 45 min | VR gameplay | 52 | 22.5 ± 2.0 (19 to 27) | 50 | Pre- and post-VR: monocular accommodation amplitude, accommodation accuracy, negative and positive relative accommodation, monocular and binocular accommodation facility, distance and near phoria, NPC, positive and negative fusional vergence ranges, vergence facility | Diminished monocular and binocular accommodation facility, accommodation accuracy, negative relative accommodation, fusional vergence at near, and vergence facility. No change in amplitude of accommodation, positive relative accommodation, NPC, or fusional vergence at distance. |
| Lee et al. (2021) | 10 min | VR gameplay during simulation of 1D anisometropia | 34 | 35.3 ± 7.6 (21 to 50) | 47 | Pre-VR: dominant eye
Pre- and post-VR: accommodative micro fluctuation, NPA, refractive error | Decrease in maximum accommodation power and increase in accommodative micro fluctuation post-VR, but no effect of simulated anisometropia. |
| Pielage et al. (2022) | NR | Fixating a target moving from periphery-to-centre or far-to-near | 29 | 25.9 (19 to 40) | 66 | During VR: pupil size | Pupil near response intact in VR, despite their direct link to vergence. |
| Dericioglu and Kubat (2024) | 10 min | VR gameplay | 20 | 29.8 ± 0.57 | 55 | Pre-VR: refractive error, associated and dissociated phoria
Pre- and post-VR: accommodation response, stereoacuity, pupil size | No changes in accommodation. Increase in pupil diameter. |
| Dymczyk et al. (2024) | 30 min | VR gameplay with simulation of two different levels of VAC: small and large | 18 | 22.5 (19 to 27) | 100 | Pre- and post-VR: accommodation response, associated and dissociated phoria, fusional vergence ranges, NPC | No change in accommodation response, NPC, or fusional vergence at near or distance post-VR, nor between the levels of VAC. |
| McAnally et al. (2024) | ~2 min | Alternating fixation between near (0.3 m) and far (100 m) targets | 30 | 27.2 | 67 | During VR: eye movements (vergence), pupil size | Frequent errors in vergence eye movements in VR, especially at near. |
| Son et al. (2024) | 30 min | VR gameplay | 32 | 24.94 ± 4.20 | 63 | Pre-VR: refractive error
Pre- and post-VR: distance and near phoria, NPC, positive and negative fusional vergence at distance and near, vergence facility | Diminished NPC, vergence facility, fusional reserves, and increase in exophoria at distance and near post-VR. |
| Sumarokova et al. (2024) | 20 min | VR gameplay for two groups: with and without binocular and/or accommodative disorders | 62 | 22 ± 4 | 79 | Pre-VR: subjective refractive error, stereoacuity, phoria, positive and negative fusional vergence, positive and negative relative accommodation, vergence facility, binocular accommodation facility
Pre- and post-VR: objective refractive error, NPA, NPC, accommodation response | Diminished near point of accommodation and convergence, and decrease in accommodation lag post-VR, with no significant effect of group. Accommodative micro fluctuations were more prevalent in the group with than without binocular and accommodative disorders. |
| Collet et al. (2025) | 20 min (day 1) + 40 min (day 2) + 60 min (day 3) | VR training simulation for pilots | 26 | 50.5 ± 4.6 (43 to 57) | 4 | Pre-VR: IPD, stereoacuity, visual acuity
Pre- and post-VR: NPA, NPC | No significant difference between NPA and NPC measurements taken pre- and post-VR sessions on any day. |
Table 5. Overview of studies on the impact of VR technology use on heterophoria and heterotropia.
Sex/gender distribution is given as percentage of females (%F). NR = not reported. IPD = interpupillary distance. NPA = near point of accommodation. NPC = near point of convergence.
|
Study | Time in VR | Task in VR | Participant characteristics | Vision measurements | Summary of visual-oculomotor interaction with VR |
|---|
| n | Mean age (yrs) ± SD (range) |
%F |
|---|
| Turnbull and Phillips (2017) | 40 min + 40 min | Exploring physical and virtual indoor environments, and physical and virtual outdoor environments. | 19 | 24.7 ± 4.0 (18 to 35) | 53 | Pre- and post-VR: fixation stability and disparity, amplitude of accommodation, phoria, stereoacuity, choroidal thickness | No differences in phoria or fixation disparity pre- vs post-VR or across conditions. |
| Kim et al. (2018) | NR | VR gameplay | 21 | 28.38 ± 6.87 | NR | Pre-VR: IPD, heterophoria
During VR: blink rate | Reduced blink rate in VR, associated with larger exophorias. |
| Tychsen and Foeller (2020) | 30 min + 30 min | VR gameplay | 50 | 7.2 ± 1.8 (4 to 10) | 42 | Pre-VR: IPD, visual-vestibulo-ocular reflex
Pre- and post-VR: visual acuity, refractive error, stereoacuity, associated and dissociated phoria | No change in heterophoria post-VR. |
| Yoon et al. (2020) | 30 min | VR gameplay in two settings: immersive (360-degree VR environment) vs. non-immersive (fixed, static VR environment) | 23 | 23.9 ± 3.7 (20 to 35) | 52 | Pre- and post-VR: refractive error, accommodation response, NPA, NPC, stereoacuity, distance and near phoria | No change in near heterophoria post-VR in any setting. |
| Alhassan et al. (2021) | 45 min | VR gameplay | 52 | 22.5 ± 2.0 (19 to 27) | 50 | Pre- and post-VR: monocular amplitude of accommodation, accommodation accuracy, negative and positive relative accommodation, monocular and binocular accommodation facility, distance and near phoria, NPC, positive and negative fusional vergence ranges, vergence facility | No change in phoria post-VR. |
| Chung et al. (2021) | NR | Watching a car moving away and performing a block-building task | 76 | 6 to 12 | 45 | Pre-VR: stereoacuity, ocular deviation
During VR: amount of divergence | Exodeviation increased during VR in participants with exotropia. |
| Dymczyk et al. (2024) | 30 min | VR gameplay with simulation of two levels of VAC conditions: small and large | 18 | 22.5 (19 to 27) | 100 | Pre- and post-VR: accommodation response, associated and dissociated phoria, fusional vergence ranges, NPC | Associated heterophoria shifted to eso-direction with large VAC and exo-direction with small VAC, but the difference was not significant. No change and no effect of small vs. large VAC for dissociated heterophoria. |
| Son et al. (2024) | 30 min | VR gameplay | 32 | 24.94 ± 4.20 | 63% | Pre-VR: refractive error
Pre- and post-VR: distance and near phoria, NPC, positive and negative fusional vergence at distance and near, vergence facility | Increase in exophorias at distance and near post-VR. |
Table 6. Overview of studies on the impact of VR technology use on stereoacuity.
Sex/gender distribution is given as percentage of females (%F). NR = not reported. IPD = interpupillary distance. NPA = near point of accommodation. NPC = near point of convergence.
|
Study | Time in VR | Task in VR | Participant characteristics | Vision measurements | Summary of visual-oculomotor interaction with VR |
|---|
| n | Mean age (yrs) ± SD (range) |
%F |
|---|
| Turnbull and Phillips (2017) | 40 min + 40 min | Exploring physical and virtual indoor environments, and physical and virtual outdoor environments | 19 | 24.7 ± 4.0 (18 to 35) | 53 | Pre- and post-VR: fixation stability and disparity, amplitude of accommodation, phoria, stereoacuity, choroidal thickness | No change in stereoacuity post-VR, and no differences between virtual and physical environments. |
| Tychsen and Foeller (2020) | 30 min + 30 min | VR gameplay | 50 | 7.2 ± 1.8 (4 to 10) | 42 | Pre-VR: IPD, visual-vestibulo-ocular reflex
Pre- and post-VR: visual acuity, refractive error, stereoacuity, associated and dissociated phoria | No change in stereoacuity post-VR. |
| Yoon et al. (2020) | 30 min | VR gameplay in two settings: immersive (360-degree VR environment) vs. non-immersive (fixed, static VR environment) | 23 | 23.9 ± 3.7 (20 to 35) | 52 | Pre- and post-VR: refractive error, accommodation response, NPA, NPC, stereoacuity, distance and near phoria | No change in stereoacuity post-VR in any setting. |
| Pala et al. (2021a) | 15 min | Street crossing task | 55 | 70.96 ± 4.83 (64 to 81), 32.67 ± 4.66 (25 to 42) | 44, 47 | Pre- and post-VR: stereoacuity | No change in stereoacuity post-VR. |
| Pala et al. (2021b) | 30 min | Street crossing task | 56 | 32.67 ± 4.66 (25 to 42), 11.90 ± 0.28 (11 to 12) | 53, 50 | Pre- and post-VR: stereoacuity | No change in stereoacuity post-VR. |
| Dericioglu and Kubat (2024) | 10 min | VR gameplay | 20 | 29.8 ± 0.57 | 55 | Pre-VR: refractive error, associated and dissociated phoria
Pre- and post-VR: accommodation response, stereoacuity, pupil size | Decrease in stereoacuity post-VR. |
Table 7. Overview of studies on the impact of VR technology use on refractive error and/or visual acuity.
Sex/gender distribution is given as percentage of females (%F). IPD = interpupillary distance. NPA = near point of accommodation. NPC = near point of convergence.
|
Study | Time in VR | Task in VR | Participant characteristics | Vision measurements | Summary of visual-oculomotor interaction with VR |
|---|
| n | Mean age (yrs) ± SD (range) |
%F |
|---|
| Guo et al. (2019) | 60 min | VR gameplay with and without breaks compared to smartphone gameplay with and without breaks | 80 | 23.23 ± 1.78 | 34 | Pre- and post-VR: distance visual acuity, pupil size, accommodation response | No change in visual acuity post-VR, no effect of breaks on accommodation results. |
| Tychsen and Foeller (2020) | 30 min + 30 min | VR gameplay | 50 | 7.2 ± 1.8 (4 to 10) | 42 | Pre-VR: IPD, visual-vestibulo-ocular reflex
Pre- and post-VR: distance visual acuity, refractive error, stereoacuity, associated and dissociated phoria | No change in visual acuity or refractive error post-VR. |
| Yoon et al. (2020) | 30 min | VR gameplay in two settings: immersive (360-degree VR environment) vs. non-immersive (fixed, static VR environment) | 23 | 23.9 ± 3.7 (20 to 35) | 52 | Pre- and post-VR: refractive error, accommodation response, NPA, NPC, stereoacuity, distance and near phoria | No change in visual acuity or refractive error post-VR gameplay in any setting. |
| Lee et al. (2021) | 10 min | VR gameplay during simulation of anisometropia (1 D) | 34 | 35.3 ± 7.6 (21 to 50) | 47 | Pre-VR: dominant eye
Pre- and post-VR: accommodative micro fluctuation and maximum accommodative power, refractive error | Myopic shift post-VR, but no effect of 1D simulated anisometropia. |
| Sumarokova et al. (2024) | 20 min | VR gameplay for two groups: with and without binocular and/or accommodative disorders | 62 | 22 ± 4 | 79 | Pre-VR: subjective refractive error, stereoacuity, phoria, positive and negative fusional reserves, positive and negative relative accommodation, vergence facility, binocular accommodation facility
Pre- and post-VR: objective refractive error, NPA, NPC, accommodation response | Hyperopic shift post-VR gameplay, with no effect of group. |
Vergence eye movements
Four studies reported a decline (1–2 cm) in near point of convergence (NPC, the closest distance at which single vision is maintained) following VR gameplay sessions lasting 10 to 50 minutes (Son et al., 2024; Sumarokova et al., 2024; Szpak et al., 2020; Yoon et al., 2020), and after repeated immersion (Szpak et al., 2020). Four other studies reported no significant change in NPC after 30 minutes (Dymczyk et al., 2024; Szpak et al., 2019), 45 minutes (Alhassan et al., 2021), or repeated exposures (Collet et al., 2025). All studies employed the same method (“push-up”) for NPC assessment in adult participants.
Two studies reported a reduction of 1–2 cycles per minute (cpm) in vergence facility (the ability to rapidly and precisely shift the gaze between near and far objects) after 30 (Son et al., 2024) and 45 minutes of VR gameplay (Alhassan et al., 2021), whereas one study reported an improvement after 30 minutes (Drew et al., 2020). Participants in all three studies were young adults with good binocular vision. In the study by Drew et al. (2020), an improvement in vergence facility was also observed in the control group that performed a similar activity in a physical environment. All three studies used a binocular flipper equipped with 3 prism dioptres (PD) base-in and 12 PD base-out to assess vergence facility. Drew et al. (2020) conducted the measurement over two minutes as opposed to one minute in the other studies (Alhassan et al., 2021; Son et al., 2024).
Three studies assessed positive and negative fusional vergences following VR exposure, using prism bars (Alhassan et al., 2021) or Risley prisms in a phoropter (Dymczyk et al., 2024; Son et al., 2024). Son et al. (2024) reported a decrease in both distance and near fusional vergences after 30 minutes in VR, with a reduction of up to 2 prism diopters (PD) at distance and 5.5 PD at near, while Alhassan et al. (2021) reported a decrease of 3 PD in near fusional vergence after 45 minutes. In contrast, Dymczyk et al. (2024) reported no significant change after 30 minutes, regardless of the degree of the simulated vergence-accommodation conflict in the VR task. None of the studies reported abnormal baseline fusional vergence levels, and baseline values were comparable across the studies.
Two studies explored vergence eye movements in VR and concluded that the use of VR increased the vergence load, leading to higher vergence angle variability (Iskander et al., 2019) and errors in vergence eye movements (McAnally et al., 2024). In the study by Iskander et al. (2019), approximately one third of the participants who usually wear prescription glasses wore them during the experiment (Iskander et al., 2019). The pupil near response is primarily coupled to vergence (Pielage et al., 2022), and, despite the vergence-accommodation conflict, pupil responses were found to be intact and unaffected in VR (Pielage et al., 2022).
Accommodation
Five studies (Lee et al., 2021; Sumarokova et al., 2024; Szpak et al., 2020; Szpak et al., 2019; Yoon et al., 2020) reported poorer accommodation measured either as diminished amplitude or near point of accommodation (nearest distance where focus is maintained), with a reduction of up to 1.5 cm after VR exposure. Poorer accommodation was observed after 10 minutes of viewing a 3D video in VR (Lee et al., 2021) as well as after 50 minutes of active VR gameplay (Szpak et al., 2020). The deterioration was slightly more evident in participants with binocular or accommodative disorders (Sumarokova et al., 2024) and in those with simulated 1D anisometropia (Lee et al., 2021), compared to their control groups. In contrast, three studies reported no change in accommodation amplitude following 45 minutes of VR gameplay (Alhassan et al., 2021) or following repeated immersion in VR (Collet et al., 2025; Turnbull & Phillips, 2017), as measured in adult participants with normal binocular vision.
Accommodation facility (ability to rapidly and precisely change focus between near and far) was evaluated using the standard optometric practice of ±2 D flipper lenses in two studies (Alhassan et al., 2021; Drew et al., 2020). Drew et al. (2020) reported an improvement in binocular accommodation facility of approximately 2 cpm following 30 minutes VR gameplay. This improvement was also observed in the control group that performed a similar activity in a physical environment (Drew et al., 2020). In contrast, Alhassan et al. (2021) observed a deterioration in both monocular and binocular accommodation facility of 2 cpm after 45 minutes of VR gameplay. Both studies were conducted on young adult participants with good visual acuity and binocular vision.
Accommodation response was assessed in four studies, measured with an autorefractometer (Dericioglu & Kubat, 2024; Dymczyk et al., 2024; Guo et al., 2019) or a photorefractor (Sumarokova et al., 2024), following VR gameplay. Of these, Sumarokova et al. (2024) reported a decrease in accommodation lag, indicating that the accommodation response more closely matched the image distance after 30 minutes VR gameplay, with greater changes observed in participants with binocular or accommodative disorders compared to those without. The other studies reported no change after 10 minutes (Dericioglu & Kubat, 2024) or up to 60 minutes of VR gameplay (Dymczyk et al., 2024; Guo et al., 2019).
Accommodation reserves were assessed in one study (Alhassan et al., 2021), which reported reduced negative relative accommodation following 45 minutes of VR gameplay.
Heterophoria and heterotropia
Seven studies analysed heterophoria and/or heterotropia following VR gameplay. Son et al. (2024) reported a significant exophoric shift of 2 PD after 30 minutes in VR in participants with mild exophoria and otherwise normal binocular vision, while Chung et al. (2021) reported a significant increase in exodeviation during VR gameplay in children with exotropia (Chung et al., 2021). In another study, large exophorias were associated with reduced blink rate in VR, and consequently increased dry eye symptoms (Kim et al., 2018). The five remaining studies (Alhassan et al., 2021; Dymczyk et al., 2024; Turnbull & Phillips, 2017; Tychsen & Foeller, 2020; Yoon et al., 2020) found no changes in heterophoria at distance or near, following 30 to 60 minutes VR gameplay, in young adults or children with normal binocular vision and distance visual acuity. Furthermore, no changes were observed in associated phoria (Dymczyk et al., 2024) or in fixation disparity (Turnbull & Phillips, 2017) in young adults after 40 minutes of immersion or across repeated sessions.
Stereoacuity
Changes in stereoacuity following VR gameplay were assessed in six studies. Five of these assessed stereoacuity with the Titmus Stereo Fly test (Turnbull & Phillips, 2017; Tychsen & Foeller, 2020; Yoon et al., 2020) or the Randot Stereotest (Pala et al., 2021a, 2021b; Tychsen & Foeller, 2020). No changes were observed in children or adults with good distance visual acuity and good binocular vision after up to 60 minutes VR gameplay (Pala et al., 2021a, 2021b; Tychsen & Foeller, 2020; Yoon et al., 2020), nor after repeated immersion (Turnbull & Phillips, 2017). One study (Dericioglu & Kubat, 2024) assessed stereoacuity using the TNO test and reported a significant deterioration of 30″ after 10 minutes VR gameplay in adult participants.
Refractive error and visual acuity
Four studies assessed measurements of refractive error following VR immersion in participants with normal distance visual acuity. Sumarokova et al. (2024) reported a mean hyperopic shift of 0.05 D, as measured by photorefractor, after 20 minutes of VR gameplay. The shift was consistent across participants with or without binocular or accommodative disorders. In contrast, Lee et al. (2021) reported a mean myopic shift of −0.14 D and − 0.17 D in the dominant and non-dominant eyes, assessed by subjective refraction, after 10 minutes of watching video in VR. This shift was the same with or without 1 D of simulated anisometropia during the VR session. Yoon et al. (2020) and Tychsen and Foeller (2020) found no significant changes in refractive error, as measured by autorefraction, in young adults or children with normal binocular vision following 30 or 60 minutes of VR gameplay. None of the studies performed the measurements under cycloplegia.
Two studies assessed visual acuity following VR immersion. Distance visual acuity remained unchanged after 60 minutes VR gameplay in both children (Tychsen & Foeller, 2020) and young adults (Guo et al., 2019).
Discussion
Here, a systematic review of the current knowledge on the interaction between visual and oculomotor functions and VR use was conducted. The reviewed studies suggested that binocular vision status and improper adjustment of the VR headset could influence user comfort and performance. Some studies reported improvements in vergence and accommodation facility following VR immersion, while others reported deteriorations in accommodation amplitude and near point of convergence. Most studies reported no change in visual acuity and stereoacuity. An important limitation across studies was the lack of comprehensive baseline assessments of visual and oculomotor functions, which limited the interpretation of the role of visual and oculomotor functions for user comfort and performance in VR and the impact of oculomotor changes post-VR.
Most of the reviewed studies focused on adults up to 45 years old, with limited research involving children (Chung et al., 2021; Tychsen & Foeller, 2020) and adults older than 45 (Collet et al., 2025; Pala et al., 2021a). Some studies explicitly excluded presbyopes, due to their age-related decline in accommodation ability (Dericioglu & Kubat, 2024) and concerns about increased susceptibility to cybersickness (Son et al., 2024). Studies reporting participant dropout included children (Tychsen & Foeller, 2020), adults over the age of 45 (Pala et al., 2021a), participants with binocular or accommodative disorders (Sumarokova et al., 2024), and young adults (Yoon et al., 2020). Although these studies did not explore the association between dropouts and visual and oculomotor functions, age-related or baseline differences in oculomotor functions might have contribute to these findings. For example, children’s vergence eye movements are not yet mature (Bharadwaj & Candy, 2008) and accommodation ability declines with age (Duane, 1922). Further research is needed to understand how the use of VR technologies interacts with visual and oculomotor functions across diverse groups.
Several studies defined eligibility criteria for normal baseline vision parameters. While this is suitable for controlled studies, these criteria limit the generalizability to wider populations. Consequently, the findings in this review primarily reflect VR users with good visual and oculomotor function, leaving gaps in understanding how common vision problems interfere with VR use. For instance, more than half of the European population has refractive errors (Williams et al., 2015), yet many do not use prescription correction, as reflected by uncorrected refractive errors remaining the leading cause of visual impairment in both children and adults (Vision Loss Expert Group of the Global Burden of Disease et al., 2024; Yekta et al., 2022). Furthermore, approximately 30% of the general population has poor or absent depth perception (Hess et al., 2015), and up to one-third of young adults have binocular vision and/or accommodative disorders (Garcia-Munoz et al., 2016; Gomes & Franco, 2024; Hagen et al., 2020). Despite this, only few studies have explored these problems in the context of VR use. Two studies reported that a third of participants who normally wear prescription correction glasses did not wear them during VR immersion (Iskander & Hossny, 2021; Iskander et al., 2019). However, they did not discuss the potential impact this might have on performance or oculomotor functions. Some studies excluded participants who wore prescription glasses due to concerns about prismatic effects that can create barriers to VR usability (Son et al., 2024). In summary, research exploring how common vision problems interact with VR use remains limited.
The reviewed studies demonstrated that even a brief 10-minute engagement in VR can lead to subjective discomfort (Dericioglu & Kubat, 2024; Szpak et al., 2020) and changes in oculomotor functions (Szpak et al., 2020). While short exposures may reveal initial effects, evidence suggests that symptoms intensify with prolonged use (Saredakis et al., 2020). Szpak et al. (2020) reported longer-lasting oculomotor changes following extended VR gameplay sessions, although these often returned to baseline approximately 40 minutes later (Szpak et al., 2020). However, adaptation and long-term effects remain unclear, as few studies have examined repeated exposures.
Headset characteristics, such as IPD adjustment, have an impact on user comfort in VR. Mismatch between the user’s IPD and the inter-display distance in the VR headset has been linked to cybersickness symptoms (Stanney et al., 2020) and perceptual distortions (Tong et al., 2022). Previously, studies have suggested associations between IPD mismatch and changes in accommodation (Livitcuka et al., 2023) and vergence (Hibbard et al., 2020; Livitcuka et al., 2023). This is particularly important for VR use in children and females, as their IPD is typically smaller than that of adult males (MacLachlan & Howland, 2002). Small IPDs may pose a limitation for proper VR headset fit in these populations (Pala et al., 2021b). Although studies often mentioned adjusting the headsets, they rarely reported whether the participants’ IPD were within the headset’s adjustable range or whether IPD mismatch could be related to the study results.
The type of VR task is another factor that needs to be considered when discussing the interaction between human vision and the use of VR technologies. While some studies used custom-designed tasks to investigate specific variables in VR, such as depth cues (Hartle & Wilcox, 2021, 2022; Rzepka et al., 2023), many studies relied on commercially available VR gameplays. VR tasks vary in visual demands, for example the degree of vergence-accommodation conflict, which depends on the difference between the distance to the focal plane and to the virtual image. However, the actual amount of the VAC is often not reported or unknown and varies during the task, as it depends on headset optics and task characteristics. The only reviewed study that examined the amount of vergence-accommodation conflict (Dymczyk et al., 2024) found no associations with oculomotor changes post-VR but reported higher levels of cybersickness when the vergence-accommodation conflict was greater. Importantly, their participants had normal binocular vision and accommodation, leaving a gap in understanding how the vergence-accommodation conflict would affect users with binocular vision or accommodative disorders.
While most studies reported no changes in distance visual acuity and stereoacuity post-VR, accommodation and vergence outcomes were more variable. The only study that reported a change in stereoacuity post-VR gaming used the TNO test for stereovision assessment (Dericioglu & Kubat, 2024). This stereo test contains no monocular cues, and depth cannot be perceived with poor or no stereovision (Fawcett & Birch, 2003). In contrast, studies reporting no change relied on the Titmus Stereo Fly test (Turnbull & Phillips, 2017; Tychsen & Foeller, 2020; Yoon et al., 2020) or the Randot Stereotest (Pala et al., 2021a, 2021b; Tychsen & Foeller, 2020), both of which use contour detection that may be detectable monocularly (Fawcett & Birch, 2003). These stereo tests measure different aspects of stereovision and are not directly comparable (Fawcett & Birch, 2003; Garnham & Sloper, 2006). Consequently, the observed stereoacuity outcomes and their interpretation might be influenced by the choice of stereo test. Several studies found deteriorations in near point of convergence (Son et al., 2024; Sumarokova et al., 2024; Szpak et al., 2020; Yoon et al., 2020), exophoria and exotropia (Chung et al., 2021; Son et al., 2024), fusional vergence reserves (Alhassan et al., 2021; Son et al., 2024) and amplitude of accommodation (Lee et al., 2021; Sumarokova et al., 2024; Szpak et al., 2020; Szpak et al., 2019; Yoon et al., 2020). In clinical practice, deterioration in these parameters are associated with binocular vision and accommodative disorders (Franco et al., 2022; Gantz & Stiebel-Kalish, 2022; Wajuihian, 2019), implying that the reported oculomotor changes post-VR may be associated with binocular vision problems exacerbated by VR use. Discrepancies in the reported outcomes may reflect methodological limitations. For example, in studies assessing refractive error changes (Lee et al., 2021; Sumarokova et al., 2024; Tychsen & Foeller, 2020; Yoon et al., 2020), none used cycloplegia, which is the gold standard for accurate assessment of refractive errors and is recommended not only for children but also for young adults (Hagen et al., 2023; Morgan et al., 2015; Sun et al., 2018). Consequently, in the absence of cycloplegic refraction, the reported changes in refractive errors (Lee et al., 2021; Sumarokova et al., 2024) may merely represent variations in accommodative responses (Morgan et al., 2015).
Emerging evidence from this review indicates that individuals with binocular vision or accommodative disorders (Sumarokova et al., 2024), exotropia (Chung et al., 2021), or anisometropia (Lee et al., 2021) experience greater oculomotor changes, poorer performance, and increased discomfort in VR. Yet substantial gaps remain in understanding the interaction between common vision problems and VR use. Incomplete baseline assessment of visual and oculomotor functions limits the interpretation of the observed changes post-VR and their clinical relevance. Vision parameters were not described in studies that reported reduced performance in VR when binocular vision was restricted or in studies that reported worse outcomes in VR compared to physical environments (Hartle & Wilcox, 2021, 2022; Rzepka et al., 2023; Wainman et al., 2020). Hence, poorer performance in VR may be linked to unknown underlying binocular vision problems or IPD mismatch due to poorly adjusted VR headsets. Small sample sizes in many of the reviewed studies may further reduce the statistical power and the reliability of the findings.
Even though VR technologies have demonstrated relevance in vision therapy (Li et al., 2022; Shao et al., 2023) and visuomotor skill assessment (Chung et al. (2021)), this review highlights several risks that must be considered to ensure effective VR implementation. User comfort may be reduced by increased dry eye symptoms due to reduced blink rate during VR immersion (Kim et al., 2018) or limitations in headset design for children and others with small head sizes and narrow IPDs (Pala et al., 2021b). It is important to note that changes in visual and oculomotor functions can occur after as little as 10 minutes of VR immersion (Dericioglu & Kubat, 2024; Szpak et al., 2020), and discomfort following VR use tends to worsen with prolonged immersion (Szpak et al., 2020). The findings underscore the need for further research and clear guidelines for VR use and adjustable headset designs to accommodate diverse users, as also promoted by the Code of Conduct for the Human-Centered and Ethical Development of Immersive Technologies (Bernabe et al., 2025).
Strengths and limitations
Strengths of this review include the systematic search and methodology, both conducted in accordance with JBI guidelines (Peters et al., 2020) and PRISMA-ScR standards (Tricco et al., 2018). The eligibility criteria were designed to ensure that the VR technologies studied were relevant and currently in use, thereby enhancing the generalizability of findings. Including only peer-reviewed journal articles in the search strengthens the quality of the reviewed studies and further enhances the power of this review. Meanwhile, limiting the search to three databases and including only peer-reviewed journal articles in English language, may have restricted the scope and comprehensiveness of the review.
Conclusion
The findings in this scoping review highlight potential disturbances in binocular vision following VR gameplay. However, the interpretation of these findings is limited by small sample sizes and lack of baseline visual and oculomotor functions assessments. Current research focuses mainly on young adults with no vision problems, leaving gaps in the knowledge about interaction between VR use and human vision across diverse populations. Understanding these gaps is important for accessible VR use, as common vision problems can affect user comfort, performance and safety. Future research should include comprehensive visual and oculomotor function assessments, exploring the effects in users with binocular or accommodative disorders, and examine long-term and repeated VR exposure to obtain robust conclusion on the interaction between human vision and the use of VR.







