1.
Introduction
Modern food systems are facing pressures, from growing demand and resource constraints to losses and waste along the chain. According to the Food and Agriculture Organization, about 14% of food is lost between harvest and sale (FAO, 2019). In 2022, 1.05 billion tonnes of food were wasted at the retail, food service, and household levels - about 19% of the food accessible to consumers, or 132 kg per person. Households were responsible for almost 60% of this loss (UNEP, 2024). In the 2010s, food loss and waste were responsible for about 8–10% of total anthropogenic greenhouse gas (GHG) emissions (IPCC, 2019). This review focuses on food-waste mitigation and sustainable food-related practices by examining which types of digital interventions are being used, in which contexts, and with what level of evidence. More specifically, it assesses whether reported outcomes relate primarily to awareness and comprehension, attitudes and intentions, or to observed behavioral change, food-waste reduction, purchasing shifts, and environmental indicators such as CO2e.
How is food waste measured in practice? Researchers and practitioners combine several approaches. Direct weighing and waste-composition analysis, diaries or logs, surveys or structured observations, mass-balance estimation, and inventory or transaction records. Evidence also shows that common household food-waste measurement approaches vary substantially in validity, with general survey questions often underestimating waste compared with diaries, photo coding, or kitchen caddies (Van Herpen et al., 2019). Harmonization frameworks set the rules of the road: the Food Loss and Waste Accounting and Reporting Standard (FLW Protocol) specifies how to quantify and report FLW transparently, while in the EU a common methodology with minimum quality requirements governs official food-waste measurement (Commission Delegated Decision (EU) 2019/1597) (
European Commission, 2019). These approaches clarify baselines and make results comparable across different settings (households, schools, hospitals, retail and food service).
Minimizing food waste is particularly crucial given the common misconception that recycling alone is enough to protect the environment. Research shows that many individuals often favor recycling or composting over waste reduction, despite the fact that minimizing waste is more important (Adams et al., 2024; Barnett et al., 2023; Papargyropoulou et al., 2014). This aligns with evidence that informational approaches are widely used in practice but often show limited effectiveness unless tested and designed as behavioural interventions (Stöckli et al., 2018). This is also evident in educational settings, where both students and teachers often place greater emphasis on recycling programmes than on upstream waste-prevention strategies (Karachalios et al., 2023a; Karachalios & Tantaroudas, 2025). Addressing these misconceptions through well-designed educational initiatives is important for encouraging sustainable practices and shifting attention toward waste minimisation; recent school-based interventions on waste management, for example, have demonstrated measurable gains in environmental awareness among primary pupils and more prevention-oriented attitudes (Bhoyar et al., 2024; Karachalios et al., 2023b).
Interactive tools (such as educational games and immersive or extended reality (XR) learning experiences, encompassing virtual, augmented and mixed reality environments) can raise awareness and shift attitudes, making explicit why prevention is more important than a recycling-only approach and supporting behaviour change in classrooms, special-education settings and organisations (Karachalios, 2024b). Beyond awareness, many tools surface real-time signals-expiry reminders, meal-planning prompts, purchase-history dashboards, or label/filter cues in online retail-that personalize feedback on likely waste points and lower-impact substitutions. To ground the evidence in live consumer interfaces, we also include three EU retailers as part of the corpus (3/201) under “retailer interface features”, appraised with the AACODS checklist as grey-literature entries; we use them as illustrative vignettes of labels/filters/defaults in live e-commerce contexts, and they do not report standardized outcome measures.
Integrating digital tools into food waste mitigation and sustainable consumption/supply-chain strategies offers a potentially transformative pathway. Spanning consumer-facing applications to advanced industrial systems, these technologies use data and connectivity to support decision-making and streamline food-system operations (Principato et al., 2023). For example, consumer apps that track expiration dates or provide meal-planning suggestions can help reduce household food waste, while predictive-analytics tools can optimise logistics and inventory management in industrial settings (Mastorakis et al., 2024; Tancredi et al., 2022). Overall, digital technologies can contribute to preventing food waste, improving distribution efficiency and enabling shifts towards more sustainable consumption patterns.
At the individual level, digital applications shape everyday choices, an essential lever for cutting food waste (Hedin et al., 2019). Using dietary-tracking and monitoring tools can raise awareness and support more sustainable food decisions (Chen et al., 2022). Real-time feedback on intake and discard patterns can nudge users toward more environmentally conscious habits (Urugo et al., 2024).
Along the supply chain and in industry, digital systems provide more sophisticated ways to oversee, regulate, and improve production and distribution. From farm to fork, technologies such as artificial intelligence and machine learning can forecast demand, fine-tune logistics, and limit overproduction and spoilage, key sources of waste (Principato et al., 2023). Furthermore, the spread of digital-twin and Industry 4.0 tools enables continuous monitoring and anomaly detection in processing plants, strengthening product quality and safety (Tancredi et al., 2022).
Despite these advantages, implementation is not straightforward. The digital divide-unequal access to modern information and communications technology-still hinders broad uptake (Pan et al., 2021). Closing that gap requires investment in infrastructure and targeted education to build digital literacy, especially in underserved communities. Robust data-privacy and security practices, together with reliable connectivity, are also essential. Progress further depends on interdisciplinary collaboration among technologists, food scientists, policymakers, and other stakeholders so that solutions are well designed, context-appropriate, and sustainable.
This review surveys the current landscape of digital tools for food-waste mitigation and for more sustainable consumption and supply-chain practices, assessing effectiveness, scalability, and barriers to wider use. The goal is to help researchers, practitioners, and policymakers harness these technologies for greater impact while setting a forward-looking agenda that both leverages innovation and addresses today’s urgent food-system challenges.
The review was conducted within the Horizon Europe CHOICE project (Grant Agreement No. 101081617), as part of Work Package 4 on immersive digital tools and specifically Task 4.1, which focuses on mapping impactful digital tools linked to CHOICE mitigation measures.
Specifically, this review addresses three questions. First, which categories of digital tools are currently used to tackle food-waste and sustainable-practice challenges across households, retail and the broader food supply chain? Second, what evidence exists on their effectiveness in reducing food waste, shifting purchasing patterns or supporting other sustainability-related outcomes? Third, which recurring design patterns, contextual factors and evidence gaps emerge across tools and settings, and how might these inform the design and evaluation of future interventions?
Building on prior reviews of digital interventions for food waste reduction and sustainable diets, this review makes three main contributions. First, it brings together three often separated families of tools—mobile and web-based apps, retailer-facing interfaces and platforms, and games/gamification and data storytelling—within a single, PRISMA-guided evidence map aligned with food-system mitigation pathways. Second, it systematically distinguishes between tools with empirical outcome evaluations and tools that are only described in implementation or grey-literature sources, clarifying where robust evidence currently exists and where it is lacking. Third, by openly cataloguing tools and their core design features in a public Zenodo dataset, the review provides a reusable resource for researchers, retailers, developers and policy-makers engaged in the CHOICE project and beyond.
2.
Materials and methods
Methodology and reporting standard
2.1.
Reporting guideline and flow diagram. This review is reported in accordance with PRISMA 2020 (Page et al., 2021). The flow diagram was generated with the PRISMA2020 Shiny app/R (Haddaway et al., 2022). The review focuses on food-waste mitigation and sustainable consumption/supply-chain improvements (hereafter, food-waste mitigation and sustainable practices). For analytical purposes, eligible tools were grouped into three broad intervention categories based on their primary mechanism of action: (i) online platforms and retailer interfaces, where users encounter labels, filters, defaults, recommendations, or availability cues close to decision points; (ii) games and gamified tools, where engagement is structured through challenges, feedback, rewards, simulation, or social comparison; and (iii) data storytelling and visualization tools, where information is communicated through dashboards, calculators, interactive stories, or other explanatory formats intended to improve understanding and inform decisions. This grouping was retained for synthesis because these intervention families differ not only in format but also in their primary mechanism of action, their decision context, and the types of outcomes they most commonly assess. The review protocol was not preregistered in PROSPERO or other registries.
Eligibility criteria (PICOS)
2.2.
Eligibility criteria were defined a priori using the Population–Intervention–Comparator–Outcome–Study design (PICOS) framework.
Population. We included studies focusing on consumers in households, retail or food-service customers, and actors along the food supply chain (e.g., retailers, caterers, logistics providers) whose decisions directly affect food purchasing, storage, preparation or disposal.
Interventions. Eligible interventions were digital tools explicitly designed to reduce food waste and/or promote more sustainable food-related practices. These included mobile apps, web platforms, e-commerce nudges and labels, dashboards, serious games and gamified tools, and other interactive systems providing feedback, recommendations, monitoring or decision support related to food planning, purchasing, storage, preparation or disposal.
Comparators. We included studies that compared the digital tool to usual practice or no intervention, to non-digital alternatives (e.g., paper diaries, static information campaigns), or reported pre–post outcomes for users of the tool.
Outcomes. Primary outcomes were food-waste quantities (e.g., kg or % reduction at household, retail or service level) and purchasing or basket shifts relevant to waste prevention. Secondary outcomes included indicators of supply-chain efficiency, environmental impact (e.g., carbon dioxide equivalent (CO2e) per item, meal or basket), and intermediate behavioural measures such as knowledge, attitudes, intentions, engagement and sustained usage.
Study designs. Randomised controlled trials, quasi-experimental studies (e.g., controlled before–after designs, interrupted time series) and observational studies with clearly described methods and outcome measures were eligible. Concept-only descriptions, opinion pieces and purely technical system descriptions without empirical outcome data were excluded.
Language and time window. We restricted inclusion to records published in English. The operational search and screening window covered 31 July 2023 to 15 June 2024.
Reasons for exclusion at full-text stage included: (i) not tool-focused (e.g., general reviews of food loss and waste without specific digital tools); (ii) no food-system relevance; (iii) lack of empirical outcomes; or (iv) insufficient methodological detail to judge impact. Counts for each exclusion reason are reported in Supplementary Table S2a and Supplementary Table S2b (Karachalios, 2026).
Information sources and time horizon
2.3.
Search on Web of Science, Scopus, and Google Scholar for English-language records was implemented from 31 July 2023 to 15 June 2024. To capture consumer-facing solutions not indexed as scholarly outputs, we additionally scanned the Apple App Store and Google Play across Greece/EU/worldwide storefronts and ran targeted web queries for retailer e-commerce features/dashboards. Full search strings, source-specific dates, and export details are available in Supplementary Appendix A (Table S1) (Karachalios, 2026). The complete tool catalogue is available on Zenodo (Karachalios, 2024a; DOI: 10.5281/zenodo.12742264).
Search strategy
2.4.
Queries combined terms for (digital tools) AND (food waste/ sustainable food systems/consumption/supply chain) AND (evaluation/impact). Database-specific full strings and limits (language, years) are provided in Supplementary Appendix A (Table S1) to ensure replicability (Karachalios, 2026). App-store scanning used predefined keyword blocks and screened the top-100 results per query on each store (duplicates removed). This threshold was selected as a pragmatic heuristic for feasibility, comparability across platforms, and transparency of retrieval, because app-store rankings beyond the first 100 results are often low in relevance, unstable across storefronts, and less likely to reflect tools that users would realistically encounter. However, this approach may still have missed lower-ranked or less visible tools and therefore introduces a potential visibility bias toward more prominent, better-optimised, or commercially established entries. To reduce arbitrariness within this constraint, we used multiple keyword blocks, searched across Greek, EU and broader storefront settings, removed duplicates, and applied the same screening logic and eligibility criteria across all operational sources, retaining only tools whose core functionality was directly related to food-waste mitigation or more sustainable food-use practices. Targeted web queries used site-limited searches on major EU retailers (e.g., Albert Heijn, Migros, DM) to inventory sustainability nudges/labels present in live interfaces.
Operational details for non-scholarly sources
2.5.
Non-scholarly sources were used to identify live tools and interfaces that are not always captured in bibliographic databases. First, we conducted structured scans of the Apple App Store and Google Play Store, querying EU and global storefronts with predefined keyword blocks related to food waste, food planning, leftovers and sustainable consumption. Candidate apps were screened on title, description and screenshots to identify tools whose core functionality was directly related to food-waste mitigation or more sustainable food-use practices.
Second, we carried out targeted web queries focusing on retail e-commerce features. Site-limited searches were run for selected EU retailers to inventory sustainability labels, carbon-footprint indicators and other “nudge” elements visible to consumers in live interfaces. For example, we used queries of the form (“CO2e” OR “carbon footprint” OR “eco label” OR sustainab*) site: ah.nl; (“CO2e” OR “Klimabilanz” OR “Nachhaltigkeit”) site: migros.ch; and (“CO2e” OR “climate” OR sustainab*) site: dm.at.
Operational dates, storefront settings and query logs for these scans are summarised in Supplementary Appendix A (Table S1) (Karachalios, 2026). Retailer interface cases identified through these operational scans were used as contextual illustrative examples of live design features rather than as a parallel stream of outcome studies entering the main PRISMA study-selection flow.
Study selection and PRISMA flow
2.6.
Records were exported and deduplicated in Google Sheets/Excel. Screening proceeded in two stages against the PICOS criteria: (i) titles/abstracts; and (ii) full texts. Screening across all categories was conducted primarily by one reviewer (I.K.), which should be considered a methodological limitation of this review. To partially strengthen consistency, a stratified 10% dual-screening check was applied within Games & Gamification, Retail websites, and Data Visualization & Storytelling Tools. Any disagreements were resolved by discussion and by revisiting the PICOS rules. Although this procedure improved internal consistency, it does not eliminate the possibility of missed records or subjective decisions during screening.
Inclusion criteria:
Digital tools (app, e-commerce nudge/label, dashboard/visualization, serious game/gamification, or platform) aimed at food-waste mitigation and/or more sustainable consumption/supply-chain practices.
Empirical outcomes on food waste, purchasing shifts, supply-chain efficiency, or environmental indicators (CO2e) or, for high-quality grey literature, transparent methods sufficient to judge impact.
English language.
Publications aligned with the search horizon (31 July 2023 to 15 June 2024 for operational searches, with backward citation chasing as needed).
Exclusion reasons (full text):
Concept-only descriptions without empirical data.
Wrong population/intervention/outcomes.
Non-English.
Insufficient methodological detail to appraise impact.
Duplicates/versions of the same record.
Exclusion reasons and dual screening. Full-text exclusion reasons are reported in Supplementary Table S2a (n = 66: Not tool-focused 24; No empirical validation 28; Not food-system relevant 14). A 10% stratified dual-screening check was conducted for Games & Gamification, Retail websites, and Data Visualization & Storytelling Tools; disagreements were resolved by revisiting PICOS rules (summary in Supplementary Table S2b) (Karachalios, 2026).
Quality appraisal
2.7.
We did not use user reviews as stand-alone evidence for inclusion; they served only to describe adoption/features. Appraisal judgements are reported alongside each included record and summarized in the results. Empirical studies were appraised using the Mixed Methods Appraisal Tool (MMAT), Version 2018 (Hong et al., 2018), while grey literature was appraised using the AACODS checklist (Tyndall, 2010).
Reporting transparency and materials
2.8.
To aid reproducibility, we provide: (i) the PRISMA 2020 flow diagram (
Figure 1); (ii) the complete search strings and operational logs (Supplementary Table S1); (iii) full-text exclusion reasons and the dual-screening note (Supplementary Table S2a and Supplementary Table S2b; available in Extended data on Zenodo: https://doi.org/10.5281/zenodo.18284371) (Karachalios, 2026); and (iv) the open catalogue of tools on Zenodo (Karachalios, 2024a). The PRISMA 2020 checklist and all extended materials are deposited on Zenodo (Karachalios, 2026) under CC0 1.0. This review follows PRISMA 2020 (Page et al., 2021); the flow diagram was produced with the PRISMA2020 ShinyApp/R package (Haddaway et al., 2022).
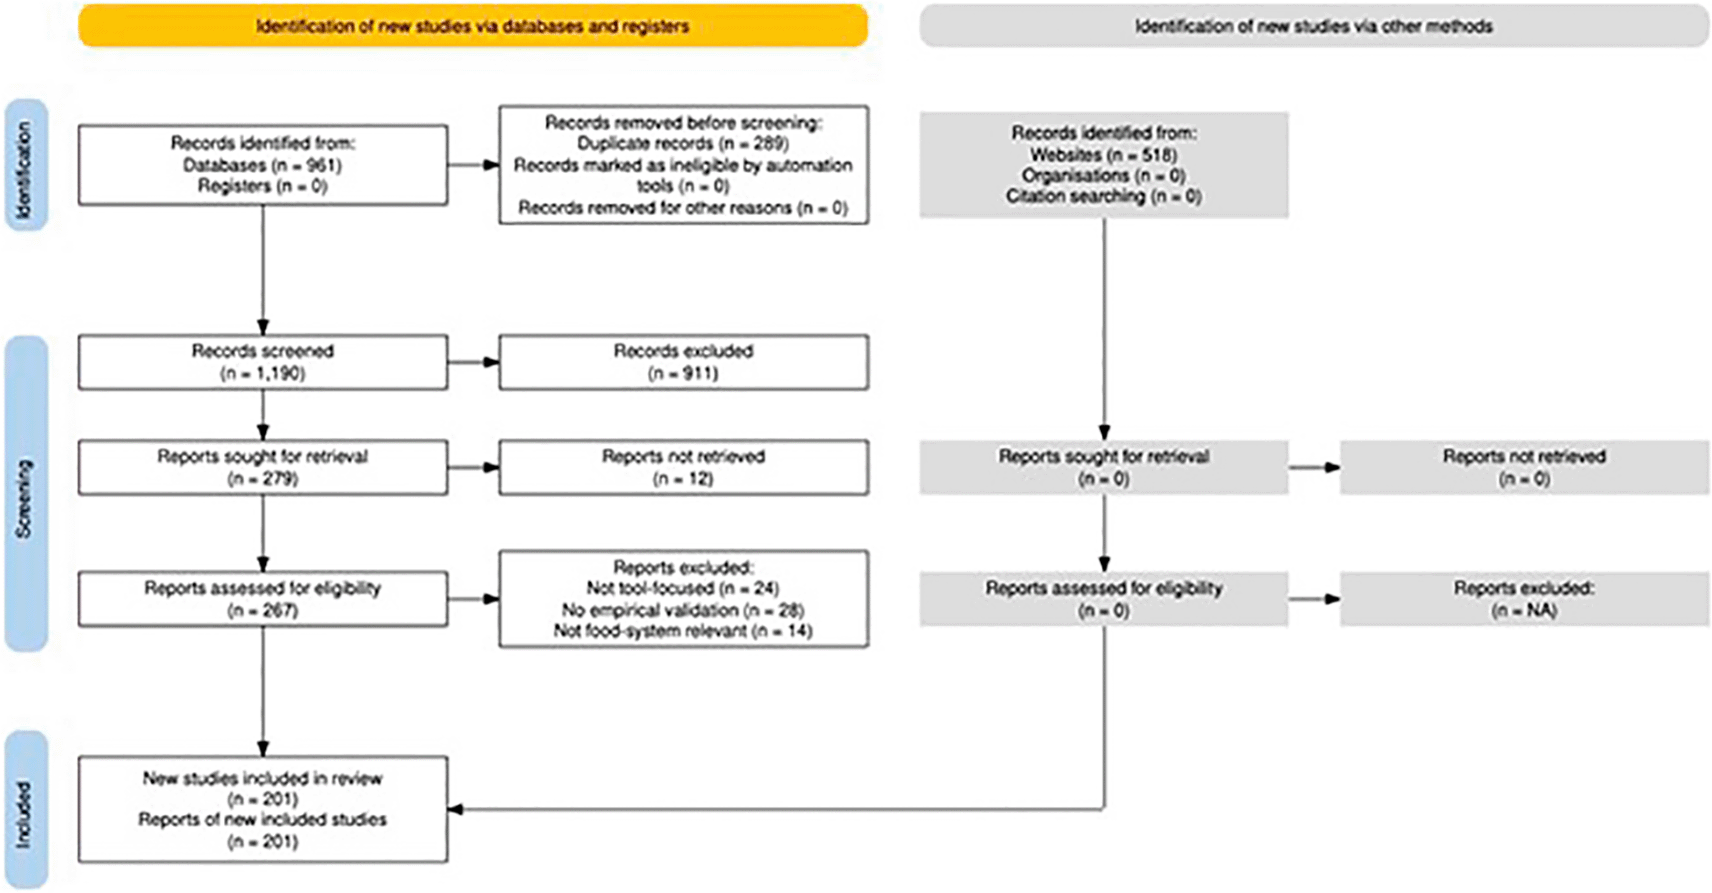
Figure 1. PRISMA 2020 flow diagram.
Records identified: 1,479 - Included: 201. Search window: 31 Jul 2023–15 Jun 2024. Diagram generated with the PRISMA 2020 ShinyApp.
Data extraction and synthesis
2.9.
We piloted a standardized extraction form capturing: bibliographic data; country/setting; population; study design; tool category; intervention components (e.g., nudges/labels, gamification elements, personalization/feedback, default sorting, promotions); exposure/dose; comparators; outcomes and measurement methods (food-waste metrics in kg or %, purchasing shifts, supply-chain efficiency indicators, environmental indicators such as CO2e); follow-up length; results (effect size where available, or direction of effect); usage/engagement analytics; quality appraisal judgements (MMAT/AACODS); and funding/competing interests.
Effect metrics and harmonization. Where studies reported absolute (kg) and relative (%) changes, we extracted both; where only absolute values were provided with a clear baseline, we computed percentage change. CO2e outcomes were extracted as reported (per product, per basket, or per kg) without cross-study conversion due to heterogeneity. When effect sizes were not computable, we coded direction-of-effect (↑ improvement/ ↓ deterioration/ → no clear change) with justification.
Synthesis approach. Given heterogeneity in designs, tools, and outcomes, we conducted a narrative synthesis, organizing evidence by tool category and outcome domain, and identifying cross-cutting design features associated with positive outcomes (e.g., nudge type, label framing, default effects, gamification mechanics). Thematic patterns were summarized using a transparent, stepwise thematic analysis approach. We did not perform a meta-analysis, as constructs and outcome measures were too heterogeneous for meaningful quantitative pooling; reporting follows PRISMA 2020, and the resulting evidence map is conceptually aligned with previous work mapping immersive digital tools in other sustainability domains, as well as with prior work on digital behaviour change interventions for sustainable food consumption (Hedin et al., 2019) and on consumer-level food-waste interventions (Liechti et al., 2024; Page et al., 2021).
Clarifications
2.10.
For clarity, we use the term digital tools as an umbrella category covering consumer-facing or decision-support digital interventions delivered through apps, web platforms, retailer interfaces, games, gamified systems, dashboards, calculators, and interactive storytelling formats. Within this review, gamification refers to the use of game-like mechanics - such as points, levels, rewards, feedback, challenges, or social comparison - in non-game contexts, whereas games refer to interventions designed primarily as playable experiences. Data storytelling refers to the structured communication of food-system information through visual, textual, or interactive data representations intended to improve comprehension, interpretation, or decision-making. Data visualization is treated here as one possible component of data storytelling rather than as a fully separate intervention family, unless it functions as the main mechanism of the tool.
To avoid overinterpretation, outcomes were interpreted at four distinct levels wherever possible: cognitive outcomes (e.g., awareness, knowledge, understanding, comprehension), affective outcomes (e.g., attitudes, concern, perceived importance), intentional outcomes (e.g., stated willingness, purchase intentions, self-reported plans), and behavioral outcomes (e.g., observed purchasing decisions, plate waste, household food waste, uptake of lower-impact options, or other directly measured actions). Environmental indicators such as CO2e were treated separately as system-relevant impact metrics rather than as proxies for behavior alone.
Three clarifications are important for interpreting the scope of this review. First, “digital tools” are defined broadly to include mobile and web-based apps, games and gamified experiences, retailer-facing interfaces, and data visualization/storytelling tools. In practical terms, this corresponds to all entries listed in the CHOICE digital tools catalogue (Excel-based tool list) that accompanies this review and is openly available on Zenodo (Karachalios, 2024a). Within this universe, a subset of tools is associated with empirical outcome evaluations, while others are documented only through implementation reports or grey literature. We include both types of tools but clearly distinguish between empirically evaluated tools and descriptive cases in the synthesis.
Second, for a tool to be counted as “empirically evaluated” in this review, it had to be linked to at least one study or report that (i) described a clear intervention component delivered via the tool, and (ii) provided outcome data collected from users or usage logs. Empirical validation in this sense includes peer-reviewed studies and transparent reports from public agencies or non-profit organisations (e.g. WRAP, FAO, UNEP, EU-JRC) but excludes sources that only offer usability testing, expert opinion, or purely technical performance metrics (such as algorithm accuracy) without behavioural or system-level outcomes.
Third, retailer interface cases (Albert Heijn, Migros and DM) were used as contextual illustrative examples of live design patterns rather than as included outcome studies. They were used to document concrete interface features-such as filters, labels, default options, feedback, and narrative framing-that recur across the wider evidence base. Any claims about effectiveness or impact in this review are based only on records that met the PICOS criteria and underwent the appraisal procedures described in Sections 2.2–2.9.
The synthesis therefore focuses on recurring design features, contextual factors and reported barriers or enablers, without attempting to be exhaustive with respect to all existing commercial tools or attributing causal effects to specific products beyond the underlying evidence.
Ethics and consent
2.11.
Ethical approval and consent were not required for this study. The review is based exclusively on published literature and publicly accessible digital tools and retailer interfaces; no primary data collection, experiments with human participants or processing of identifiable personal data were undertaken.
3.
Results
We included 201 eligible digital tools and studies after full-text screening (
Figure 1). These covered a broad range of interventions, from mobile apps and web platforms to retailer e-commerce features, games and gamified tools, and data visualisation or storytelling systems. Reasons for exclusion at the full-text stage and the distribution of records across categories are summarised in Supplementary Table S2a and Supplementary Table S2b (Karachalios, 2026). A curated catalogue of all included tools, with key metadata and links where available, is openly accessible on Zenodo (Karachalios, 2024a).
Across all categories, it is important to distinguish between tools that were only identified and descriptively characterised and tools that were accompanied by empirical outcome evidence. Many tools could be described in terms of interface, intended function, or design logic, but far fewer were evaluated through experiments, field studies, platform analytics, or measured waste-related outcomes. Accordingly, descriptive breadth in this review should not be interpreted as equivalent to strength of evidence.
Overview of Digital Tools (evidence map)
3.1.
We structure the evidence into three categories derived from the records that met the PICOS criteria: (i) online platforms and retailer websites; (ii) games and gamification; and (iii) data visualization and storytelling. This subsection provides a synthesis-first overview grounded in empirical studies and high-quality grey literature; it does not enumerate brand examples without evaluative evidence. A public catalogue compiled during the search window is cited separately (Karachalios, 2024a), but examples from that catalogue are only discussed here when supported by impact evaluations or transparent methods.
Typical intervention components observed across categories include: (a) filters, labels, default sorting, and promotion cues in online platforms/retail interfaces; (b) points, levels, challenges, feedback, and social comparison in games/gamification; and (c) calculators, dashboards, and narrative interactives in data visualization/storytelling. Reported outcomes span: (1) food-waste indicators (kg or %); (2) purchasing shifts or basket composition (including CO2e-based metrics where available); (3) knowledge, attitudes, and intentions; and (4) engagement/usage analytics. Where effect sizes were computable, we report them in the category-specific results; otherwise, we report the direction-of-effect with justification. Environmental reporting was especially sparse: only 26/201 included tools reported carbon- or greenhouse-gas-related figures in a form usable for synthesis.
To improve interpretability across highly heterogeneous interventions, the category-specific synthesis below reports, for each intervention family, the main outcome domains assessed and the overall direction of reported effects. This evidence map is descriptive rather than quantitative and should be interpreted alongside the narrative results for each category.
Table 1 summarizes the main outcome domains assessed across the three intervention families, the predominant direction of reported effects, the main evidence context, and the principal limitations affecting interpretation.
Table 1. Summary evidence map across the three intervention families.
|
Intervention family |
Typical digital features |
Main outcome domains assessed |
Predominant direction of reported effects |
Typical evidence context |
Main limitations |
|---|
| Online platforms and retailer interfaces | Labels, filters, default sorting, availability cues, product-level feedback | Purchasing shifts, basket composition, food-waste proxies, occasional carbon- or greenhouse-gas-related indicators | Mostly positive for short-term choice architecture effects; limited evidence for sustained household waste reduction | Retail and online decision environments; field studies, platform evaluations, and selected grey-literature interface observations | Short follow-up, heterogeneous metrics, limited direct waste measurement, moderate risk of bias |
| Games and gamified tools | Points, levels, challenges, rewards, feedback, simulation, social comparison | Awareness, engagement, attitudes, intentions; less often behavior or waste outcomes | Mostly positive for engagement and short-term learning; mixed or limited evidence for real-world behavior change | Educational, pilot, classroom, laboratory, and small-scale intervention settings | Lab-heavy evidence base, short intervention windows, weak behavioral follow-up, heterogeneous outcomes |
| Data storytelling and visualization | Dashboards, calculators, infographics, interactive stories, explanatory captions | Awareness, comprehension, attitudes, occasional intentions; rarely downstream behavior or waste outcomes | Mostly positive for comprehension and salience; limited evidence for persistent action or measurable waste reduction | Communication, educational, and public-information settings; descriptive and mixed evaluative designs | Few rigorous evaluations, high heterogeneity, limited behavioral endpoints, moderate reporting variability |
Quality of the included evidence.
Overall, MMAT appraisals indicated that most empirical studies were of moderate quality, with relatively few meeting all criteria for low risk of bias. Common limitations included small samples, short follow-up periods, reliance on self-reported outcomes, and incomplete reporting of comparators or attrition. Grey-literature sources appraised with AACODS typically scored well on authority and currency but sometimes lacked methodological detail, making effect attribution cautious. These quality patterns are considered when interpreting category-specific findings and in formulating the practice and research implications that follow.
Online Platforms & Websites
3.2.
Category synopsis. Across the included evidence, online platforms and retailer interfaces most commonly report purchasing shifts or basket composition outcomes, with fewer studies tracking household-level waste or CO2e at scale. Signals are context-dependent: salient, standardized labels/filters and availability/default cues can support modest shifts, whereas effects attenuate without clear framing. Study designs are heterogeneous and often short-term; risk of bias is frequently moderate, and causal inference is limited. We therefore report effect sizes where computable and otherwise the direction-of-effect, without meta-analysis. Within this category, the evidence base is uneven: some tools are supported by empirical studies or real-world retailer observations, while others are included primarily as descriptive examples of currently deployed interface strategies.
Purpose and scope of case examples.
This subsection describes interface features observed on three EU retailers—DM (Austria), Albert Heijn (Netherlands), and Migros (Switzerland)—which are included in the corpus (3/201) under “retailer interface features” and were appraised with AACODS as grey-literature entries. These are not outcome studies: we report publicly visible design elements (filters, labels, footprint displays) to contextualize how sustainability information is operationalized in live e-commerce interfaces. No claims are made about causal effects on consumer behavior here; such effects are considered only when supported by empirical studies in the literature.
DM (Austria). Category pages expose filters for dietary needs (e.g., vegan/vegetarian, gluten-free/lactose-free) and sustainability-related criteria (e.g., “Bio”, “More sustainable products”). Product pages display organic labels and country codes with brief explanatory text. Promotions and recommendation pages sometimes link educational content to featured items. These observations document UI placement only; we do not infer impact.
Albert Heijn (Netherlands). Category pages offer filters such as “Biological” (EU organic), “From the Netherlands”, vegetarian/vegan. Selected product pages display numeric CO2e values with an explanatory link describing calculation methods; animal-welfare labels (e.g., Beter Leven) are also present (Kühne et al., 2023). We describe availability and placement, without evaluating outcomes.
Migros (Switzerland). Category filters highlight vegan/organic/local (“Swiss product”) items. Product pages use the in-house M-Check sustainability label; hovering reveals an approximate CO2e range and a brief contextual comparison (e.g., ≈ 33 km car ride). We inventory interface features only and do not assess behavioral effects.
Synthesis of observed patterns. Across the three interfaces we observed: (i) category-level filters for organic/local/vegan; (ii) product-level sustainability labels or footprint displays (numeric or class/rating); and (iii) occasional educational content within promotions/recommendations. These case examples ground the synthesis with concrete UI patterns; design implications are discussed in the Discussion, and no evaluative claims are made in this subsection.
Games and gamification — evidence synthesis
3.3.
Category synopsis. The evidence base concentrates on knowledge/awareness and attitudes/intentions; measured behavior and waste outcomes are comparatively rare. Engagement tends to be high but may decay without sustained feedback or real-world prompts. Designs and endpoints are heterogeneous, follow-up is often short, and risk of bias is typically moderate; as such, we summarize effect sizes when available and otherwise report direction-of-effect only. Here too, the literature includes both empirically tested interventions and tools that are mainly discussed in terms of concept, format, or engagement logic rather than measured food-waste outcomes.
Scope. We synthesize empirical and high-quality grey-literature evidence on game-based or gamified interventions relevant to food-waste mitigation and sustainable consumption. Brand or title descriptions without evaluative evidence are excluded from this subsection; such examples are only considered elsewhere as context, not as outcome studies.
Outcomes and evidence base. Reported outcomes cluster primarily around knowledge/awareness and attitudes or intentions, with reported behaviors and direct waste metrics assessed much less frequently. A substantial share of the available evidence comes from classroom, pilot, laboratory, or otherwise highly controlled settings, where engagement and short-term learning effects are easier to observe. By contrast, evidence from real-world household, retail, or longer-duration settings remains comparatively limited. Entertainment and serious games often show strong engagement potential, but the translation of this engagement into sustained food-related behavior change or measurable waste reduction is still insufficiently demonstrated. (Douglas & Brauer, 2021; Engelstätter & Ward, 2022; Fernández Galeote & Hamari, 2021; Fernández Galeote et al., 2021; Lieberoth et al., 2018). Where effect sizes were computable, we report them in the category-specific results; otherwise, we code direction-of-effect (↑/→/↓) with justification, consistent with our Methods.
Design features linked to positive signals. Across studies, features repeatedly associated with beneficial signals include feedback-oriented mechanics, achievable goals, experiential/simulation elements, credible content, and social comparison or cooperative play—elements aligned with established engagement frameworks (Ouariachi et al., 2019). Clear calls-to-action and transparency about real-world steps appear important when aiming beyond awareness.
Evidence gaps. Few evaluations measure sustained behavior change or food-waste outcomes over time; heterogeneity in designs and outcomes prevents meta-analysis. Future studies should prioritize transparent reporting, adequate follow-up, and comparable metrics to strengthen inference (Reynolds et al., 2019).
Data storytelling
3.4.
Category synopsis. Most evaluations assess comprehension/awareness and, less frequently, attitudes or intentions; sustained behavior or waste reductions are seldom measured. Simpler focal metrics and clear explanatory captions tend to aid interpretation, but effects are context specific. Given heterogeneity and variable quality (often moderate), we refrain from meta-analysis and present computed effects where possible or direction-of-effect otherwise. In this category especially, descriptive and explanatory tools outnumber rigorously evaluated interventions, so interpretive caution is needed when discussing effectiveness.
Scope. We synthesize evidence on data-driven communication (infographics, dashboards, interactive stories) used to convey food-waste and food-system impacts. Illustrative artifacts are referenced only when accompanied by evaluative evidence or transparent methods; we do not enumerate brand examples here.
Outcomes and measures. Studies most commonly report knowledge/awareness and comprehension; fewer assess attitude/intentions, and only a minority track behavior change. Where baseline and post measures are available, effects tend to be short-term and context-dependent; heterogeneity precludes meta-analysis.
Design elements connected to increased engagement. Across the included evaluations, clarity of key statistics, informative captions and low cognitive load frequently facilitated understanding (Duarte, 2019). Sustainability-related data were generally easier to interpret when presented through simple, comparable metrics, such as CO2e per item or per basket, anchored to concrete reference points (for example, the amount of household waste). Studies highlighting fear-based messages without accompanying efficacy or agency cues sometimes reported defensive responses or disengagement, whereas combinations of salient facts with specific, feasible next steps were associated with more constructive reactions (Tannenbaum et al., 2015). In interactive formats, clean navigation structures and progressive disclosure of detail supported exploration without overloading users.
Evidence gaps. Rigorous studies that link data stories to persistent behavior or waste reduction are still sparse; reporting standards and agreed outcome criteria would increase comparability across settings (Garnett, 2011; Reynolds et al., 2019).
4.
Discussion
The evidence base spans heterogeneous digital tools-mobile apps, retailer interface features, serious games/gamification, and data-visualization platforms-evaluated with diverse designs (randomized/quasi-experimental, observational case studies) and outcomes (e.g., food-waste quantities, purchasing shifts/basket composition, CO2e indicators, engagement/knowledge). Because constructs, measures, and reporting units were not sufficiently comparable to support a meaningful pooled effect, we did not perform a meta-analysis. Instead, we undertook a structured narrative synthesis, in line with established guidance that discourages quantitative pooling under substantial methodological/clinical heterogeneity (Deeks et al., 2019; Page et al., 2021).
What works, where and for whom. Across categories, the features most consistently associated with positive results were not necessarily high technological complexity, but simpler behavioral design elements embedded in digital environments. In online platforms and retail interfaces, salient and standardized labels or filters, clearer availability cues, and default or pre-selected options appear more promising when they are positioned close to the point of decision and remain easy to interpret. In games and gamified tools, feedback-oriented mechanics, attainable goals, experiential or simulation elements, and social comparison or cooperation are more often linked to engagement and short-term learning gains, although sustained real-world behavior change remains underexamined (Douglas & Brauer, 2021; Fernández Galeote & Hamari, 2021).
In data visualization and storytelling, comprehension and awareness appear more likely to improve when focal metrics are simple, captions are explicit, and cognitive load remains low; fear appeals without clear agency cues may be less effective, whereas salience combined with actionable next steps appears more promising (Duarte, 2019; Garnett, 2011). Related design logics have also been discussed in adjacent digital-intervention domains (Tantaroudas et al., 2026), although these lie outside the direct evidence base of the present review. However, across all three categories, positive effects are more consistently documented for attention, understanding, engagement, or short-term choice than for sustained household food-waste reduction. These features should therefore be interpreted as promising mechanisms rather than universally validated solutions.
Limitations of the evidence base. Few evaluations measure household-level waste (kg/%) or CO2e at scale with adequate follow-up. Only 26 of the 201 included tools reported carbon- or greenhouse-gas-related figures in a form usable for this review, underscoring how uncommon transparent environmental impact reporting still is in this field. Comparator conditions vary, reporting is inconsistent, publication and selection biases are possible-particularly for positive cases-and overall study quality is frequently moderate.
Limitations of this review. Screening was conducted by a single reviewer with a stratified 10% dual check only in three categories; operational searches covered 31 July 2023–15 June 2024; English-language focus; and app-store scans used a top-100 heuristic across GR/EU/worldwide storefronts. We did not perform a meta-analysis due to heterogeneity. These factors may constrain generalizability and increase residual bias.
Implications for practice. For retailers and platform designers: ensure label consistency and placement near purchase decisions; couple labels/filters with defaults and availability cues; pre-specify outcomes (basket composition, waste proxies) and measure them routinely; disclose CO2e methods. For game developers/educators: embed credible content, feedback loops, and clear calls-to-action that bridge gameplay to real-world steps. For data communicators: prioritize minimal cognitive load, explicit captions, and comparable metrics; pair salience with agency.
Research agenda. The next phase of research should move beyond asking whether digital tools are broadly promising and instead test which intervention types are ready for larger and longer trials, under which conditions, and for which users. Retail and platform-based interventions that embed labels, defaults, and availability cues directly into purchase environments appear among the most ready for real-world scaling studies, because they can be tested close to actual decisions and linked to basket-level outcomes. By contrast, games, gamified tools, and data storytelling interventions appear especially suitable for trials that distinguish short-term gains in awareness or engagement from medium-term behavioral effects. Future studies should therefore pre-specify outcome level, setting, user group, and mechanism of action; use longer follow-up periods; report standardized food-waste and environmental indicators; and make protocols, materials, and code openly available. Such work would make it easier to identify not only whether digital interventions help, but which design patterns are worth scaling in households, retail environments, and public communication.
The findings also suggest that digital interventions should not be treated as context-neutral. Household-facing tools often aim to support planning, storage, meal decisions, or leftover use, whereas retail-facing tools typically intervene closer to the point of purchase through labels, defaults, recommendations, or promotional framing. Educational and gamified interventions are more often used with students, younger users, or awareness-raising contexts, while data storytelling and visualization tools are often oriented toward interpretation, reflection, or broader sustainability communication. This contextual variation matters because mechanisms that improve understanding in one setting may not translate directly into measurable waste reduction in another. Future evaluations should therefore differentiate more explicitly across setting, user group, and intervention logic.
5.
Conclusions
This review synthesised empirical studies and high-quality grey literature on digital tools designed to reduce food waste and support more sustainable food-related practices. Using PRISMA 2020 reporting and a PICOS-based protocol, we identified 201 eligible tools spanning mobile applications, web platforms, retailer e-commerce features, games and gamified interventions, and data visualisation or storytelling systems. Rather than treating these tools as a single intervention class, the review shows that digital food-system interventions operate through different mechanisms-such as decision cues, feedback, simulation, comparison, or interpretive communication-and that these mechanisms are associated with different levels of outcomes, from awareness and understanding to behavioral change and measurable waste reduction. In this sense, the review contributes not only an evidence map of available tools but also a more structured way of thinking about how digital interventions function within food-waste and sustainable-consumption research.
For practice, the synthesis suggests that digital tools are most useful when they embed simple, credible, and actionable design features into real decision environments-especially near purchasing, planning, or food-use decisions. For research, the main message is more cautious: the field now offers substantial descriptive breadth, but much less robust evidence on sustained behavior change, household food-waste reduction, and transparent environmental impact reporting. The inclusion of retailer interface vignettes illustrates how design patterns appear in live e-commerce environments, but these examples should not be interpreted as evidence of causal effectiveness. Overall, the reviewed evidence suggests that digital interventions are promising but unevenly supported, with substantially stronger evidence for awareness, engagement, and short-term decision support than for sustained behavioral change, measured household food-waste reduction, or transparent environmental impact reporting. The strongest next step is therefore not simply to expand the number of tools, but to conduct better targeted, longer-duration, and more context-sensitive evaluations using comparable behavioral and waste-related indicators. Within the Horizon Europe CHOICE project, these insights can help guide the selection, co-design, and testing of digital tools that are realistic candidates for scalable mitigation pathways.
Ethics and consent
Ethical approval and consent were not required for this study.
Data availability
Declaration of generative AI and AI-assisted technologies in the writing process
During the preparation of this manuscript, the authors used generative AI-based tools, specifically large language models such as ChatGPT (OpenAI), solely to assist with language editing and consistency checks in limited sections. All substantive decisions regarding the design of the review, screening, data extraction, analysis and interpretation were made by the authors. The authors carefully reviewed and edited all AI-assisted text and take full responsibility for the integrity and accuracy of the manuscript’s content.







