1. Introduction
The study of the plant microbiota is an emerging field that has helped clarify the beneficial, neutral, or deleterious roles of microbial communities in modulating plant health and growth. The importance of plant-associated microbes in shaping plant physiology, ecology, health, and evolution is now well established.1 The increasing interest in using microbiomes for applied agriculture has coincided with a surge in microbiome research over the last decade. Several microorganisms—particularly bacteria—are currently registered for use in open-field agriculture to reduce diseases or enhance crop productivity.2 One of the best-known examples is Bacillus thuringiensis, a bacterium producing Cry and Cyt toxins that control caterpillars, butterflies, mosquitoes, and various fly larvae.3 Current research is now focusing on identifying microbial strains or microbial consortia capable of protecting crops and improving yield under a wide range of environmental constraints.4 Although the potential is significant, microbe-based plant therapeutics often fail to transition successfully from laboratory or greenhouse conditions to the field.2,5 A major limitation in the development of effective microbial consortia is the lack of information on how these microbes influence their plant hosts over the long-term, or at least across several plant generations.6 Understanding plant–microbe interactions through an evolutionary perspective is therefore essential for designing microbial therapeutics that are robust and field-translatable.
With the advent of the holobiont concept—originally introduced by the German biologist Adolf Meyer-Abich in the 1940s7—evolutionary biology had to consider hosts and their associated microbes as “superorganisms” capable of evolving traits that neither partner could achieve alone. It is important to specify that the holobiont concept was introduced originally to described a host and a single inherited symbiont and was later extended to the host and the associated microbial communities. Studying plants as holobionts is therefore complex compare to simple symbiotic interactions and requires understanding how associated microbes influence key host traits related to health, growth, and fitness. In addition, holobiont partners not necessary co-evolve together as symbionts. Consequently, understand the limit between simple transient interactions and co-evolution in holobionts requires a consistent advance in approaches studies complex interactions. In the light of the holobiont complexity, the development of plant microbial therapeutics must take into account the interactions between hosts and microbes. It is now well established that plant genotype strongly shapes the associated microbial communities, through processes such as immune-mediated selection or secretion of metabolites that recruit specific microbes.8 Conversely, microbes can influence plant phenotypes by facilitating nutrient acquisition or stimulating host defences.9 However, holobiont research requires integrating multiple approaches that consider host genotype, natural variation, microbial diversity, and, critically, the dynamics of holobiont composition and phenotype across several host generations.10,11
To address these gaps in the plant–microbiota research and enable the rapid development of effective field-ready microbial therapeutics, we developed a coevolutionary experimental framework designed to study the evolution of plant traits under different microbial community assemblages. Our approach combines the diploid (AA; 2n = 2x = 10) Brassica rapa fast-cycling plants, having a ~ 40 days cycle,12 ad hoc-designed microbial communities, and the fungal pathogen Rhizoctonia solani,
13 enabling the assessment of microbial effects on plant hosts across multiple generations in presence or absence of a pathogen. B. rapa fast-cycling plants, also known as Wisconsin Fast Plants,12 represent a unique yet underutilized genetic resource for exploring plant evolution under controlled and contrasting environmental conditions. In addition to complete their entire life cycle (seed to seed) in approximately 40 days they are easy to cultivate and manage under greenhouse conditions. Their potential as a model for evolutionary studies is notable, as they are genetically diverse and predominantly out-crossing. In a recent unpublished work, we estimated Analyses of Linkage Disequilibrium (LD) in a population of 260 fast-cycling families and revealed a very high value at short physical distances, with an average (r2) value of approximately 0.7 within the first 5 kb, indicating that nearby genetic variants are strongly correlated and tend to be inherited together. LD then decreased rapidly, reaching values close to 0.25 at approximately 15 kb, suggesting that recombination efficiently breaks down associations between linked markers over relatively short genomic distances. Fast-cycling plants are then a valuable material for evolutionary and Genome-Wide-Association (GWA) studies.
Our objective is to develop a reliable method allowing the screening and selection of ad hoc-designed microbial communities, that persist through several plant generations. The produced biological material can be employed for evolutionary studies including joint GWA mapping.14 This framework is easy to implement and, aside from access to greenhouse space, requires only basic laboratory equipment and can be adopted to test the effect of a large number of microbial communities on both biotic and abiotic constraints.
2. Making an optimal pathosystem to study holobionts in plants
Studying plant holobionts under controlled ad hoc–designed microbial communities, requires the production of gnotobiotic plants and the establishment of a robust pathosystem to test the effects of microbial communities on plant traits such as disease resistance. The pathogen must be easy to grow and phenotype, and its interaction with the host should allow plants to reach flowering and complete seed production, mandatory for testing several plant generations. Here, we validated a B. rapa fast-cycling plant–R. solani pathosystem that enables rapid assessment of plant responses across multiple plant generations.
2.1 Validation of a method for producing germ-free B. rapa fast cycling plants
Producing gnotobiotic plants prior to inoculation with ad hoc–assembled microbial communities is essential for testing the effect of these microbes on the plant host across multiple plant cycles. For this purpose, we tested several seed-sterilization procedures to obtain germ-free fast-cycling plants (
Figure 1). Standard Wisconsin Fast Cycling Plants® seeds were purchased from the University of Wisconsin–Madison through the following website https://fastplants.org/product/standard-wisconsin-fast-plants/. The fast-cycling plants were developed by Professor Emeritus Paul H. Willimans (Department of Plant Pathology at the University of Wisconsin-Madison) in 1970 by Williams and Hill through a collection of up to 2, 000 Brassica accessions harbouring few varieties with a particular fast flowering.15 The fast-cycling plants purchased in our study were produced from a cultivar of B. rapa
L.
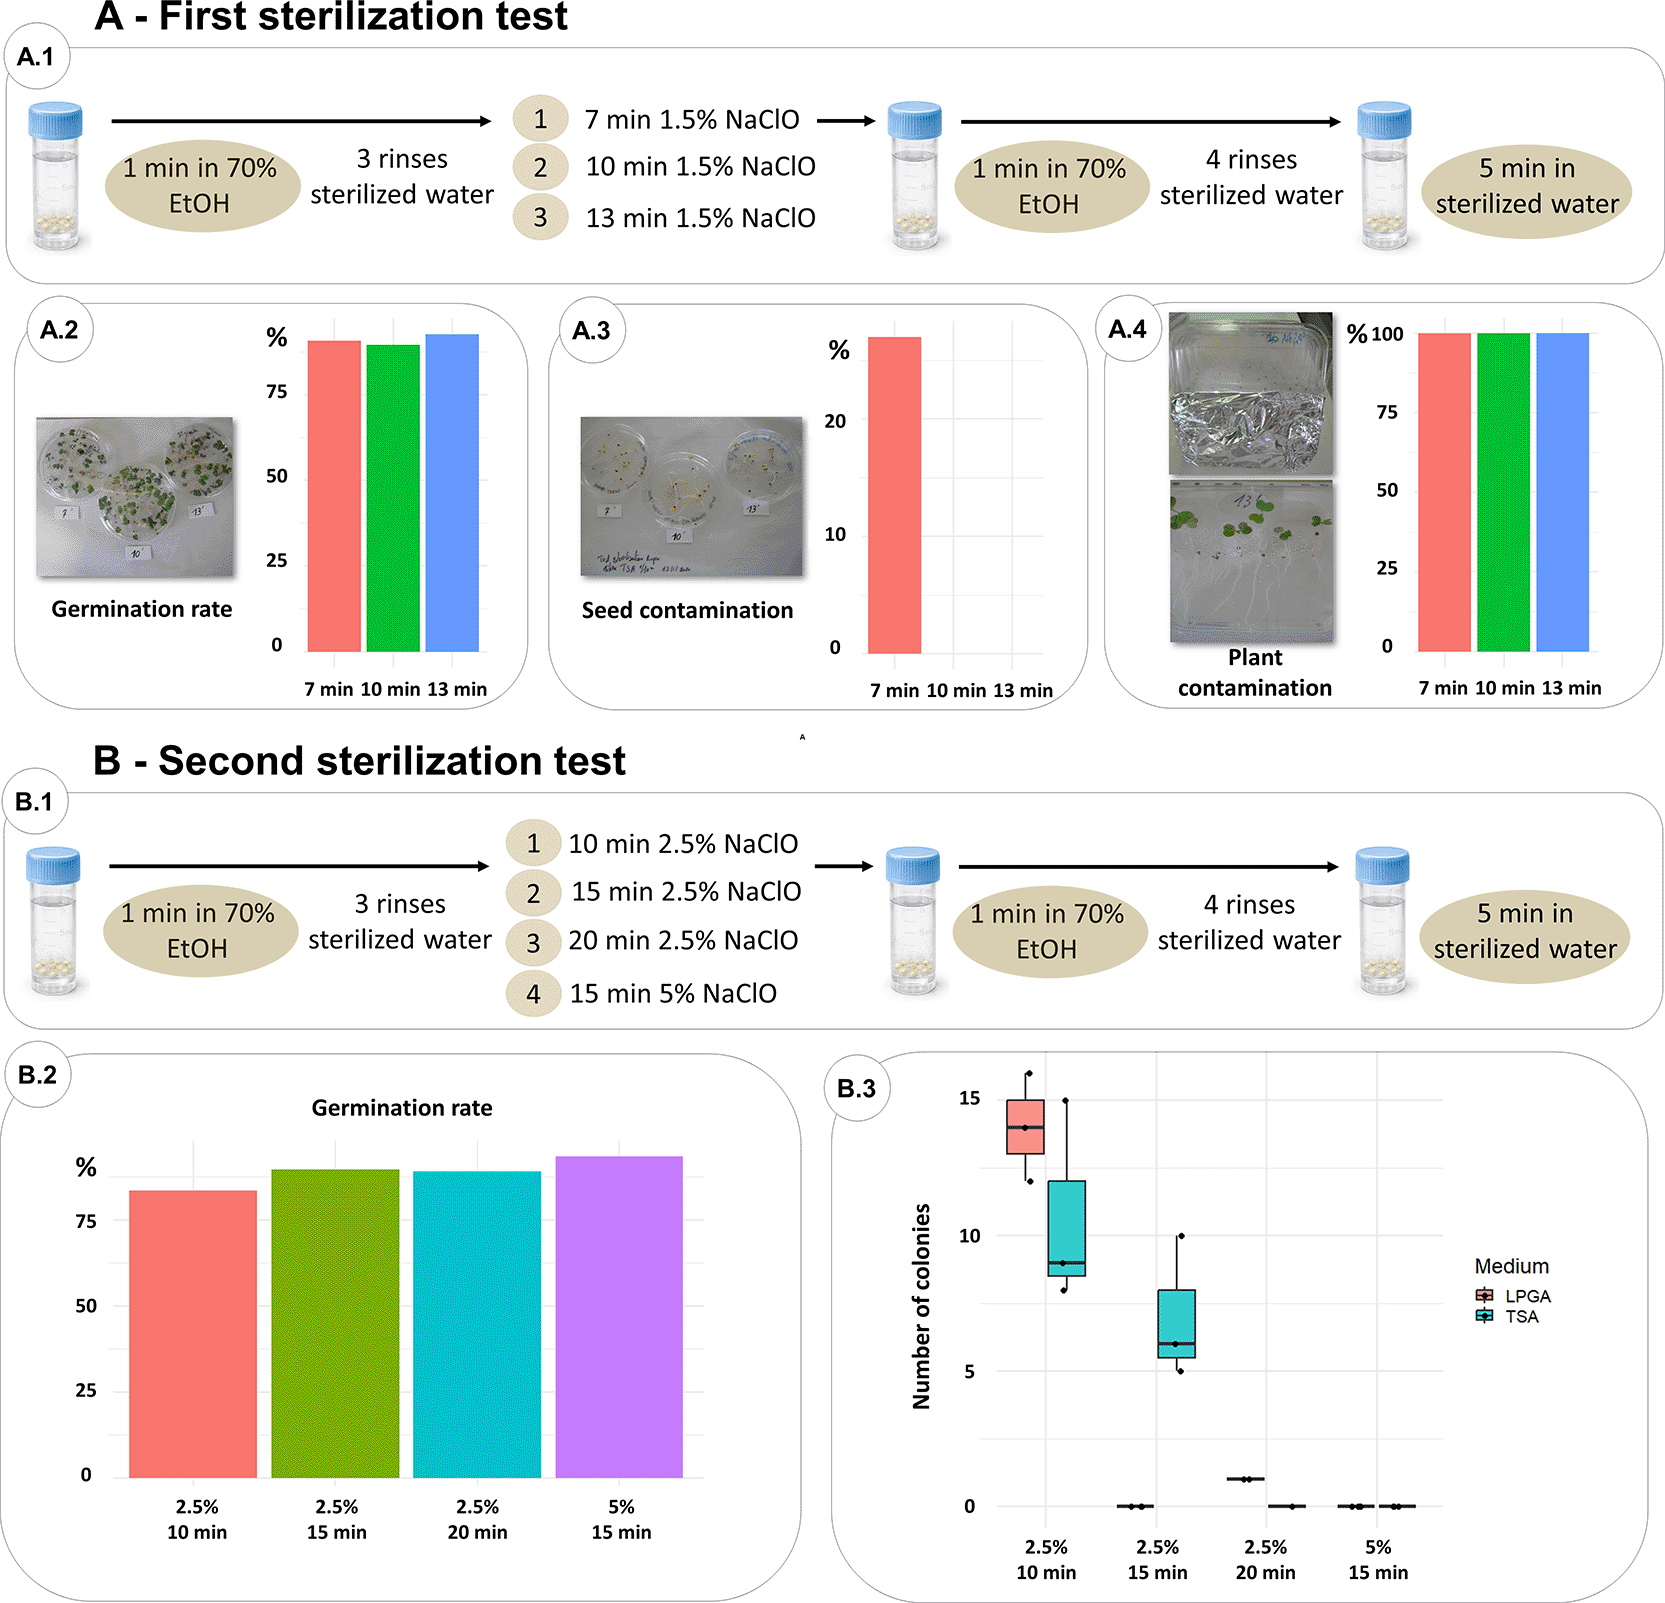
Figure 1. Methods tested to produce germ-free Brassica rapa fast-cycling plants.
(A) First sterilization test. (A.1) 1.5% sodium hypochlorite solution was tested by incubating seeds 7, 10 and 13 minutes. (A.2) Germination rate was comparable for all incubation conditions. (A.3) Contaminated seed were obtained for 7 minutes of incubation only, but plants showed bacterial colonies contaminations for the three conditions (A.4). (B) Second sterilization test. (B.1) 2.5% and 5% sodium hypochlorite solutions were tested under different incubation times. (B.2) Seeds incubated with 5% hypochlorite solution showed the best germination rate and no contamination on the developed plants.
All sterilization steps described below were performed under a laminar flow hood to maintain sterility (
Figure 1A.1). All the percentages of sodium hypochlorite are v/v. Thus, the 1.5%, 2.5% or 5% values correspond to the dilution factor of the stock solution at 9% of active sodium hypochlorite.
1. We placed ~350 fast-cycling seeds in 70% ethanol for 1 minute, followed by three rinses with sterilized distilled water.
2. Seeds were then transferred into a sterile 13-ml tube containing a 1.5% sodium hypochlorite solution, fully covering the seeds. To evaluate different sterilization conditions, seeds were incubated under agitation (120 rpm) for 7 minutes (first test), 10 minutes (second test), or 13 minutes (third test).
3. After incubation, the sodium hypochlorite solution was removed, and seeds were placed for 1 minute in 70% ethanol and rinsed four times with sterilized distilled water. Finally, seeds were then soaked for 5 minutes in sterilized distilled water.
To assess the impact of these sterilization conditions, we placed 100 seeds from each treatment onto Murashige-Skoog (MS) agar medium16 in Petri dishes and incubated them in a growth chamber (15-h photoperiod, 23°C/18°C day/night). After three days, we counted the number of germinated seeds (
Figure 1A.2). Germination rates were 90.72%, 89.52%, and 92.70% for the 7-, 10-, and 13-minute sodium hypochlorite treatments, respectively, indicating only minor effects of incubation time on germination. To evaluate sterilization efficacy, we plated 15 sterilized seeds on Tryptic Soy Agar (TSA) (reference 22091-500G, Merck) plates and 15 sterilized seeds on LPGA (7 g/L of yeast extract: reference 212750, Fisher Scientific (BD); 7 g/L of glucose: reference 16301-1kg, Merk; 15 g/L of agar: reference 20767.298, VWR) plates to follow potential bacterial and fungal seed contamination, respectively. This step was done in parallel on three pools of 10 crushed seeds. Plates were incubated at 27°C for 7 days. Bacterial colonies were observed only in the 7-minute sodium hypochlorite treatment (
Figure 1A.3) when seeds were crushed, whereas the 10-
and 13-minute treatments showed no colony growth. Finally, to determine whether the resulting plants were truly germ-free, we placed 12 seeds from each sterilization treatment onto square 120 × 120-mm MS agar plates. The lower half of each plate was wrapped in aluminium foil to keep roots in the dark. Plants were incubated for 15 days under the same growth-chamber conditions. Plants were then crushed with a Stomacher, plated onto TSA and LPGA, and incubated at 27°C for 7 days. A bacterial lawn was observed for all sterilization conditions (
Figure 1A.4), demonstrating that none of the tested protocols produced germ-free B. rapa fast-cycling plants. These results show that although no microbial growth was detected on seeds plated directly, microbial growth was observed on plant macerates, suggesting that seed endophytes, not growing at the seed stage, are capable of multiplying during plant development. It is important to note that even though seed sterilization eliminates external contamination (from 10 minutes), part of the seed’s microbiota is maintained at the endophytic seed compartment and therefore transmitted to the plant. Indeed, using 1.5% sodium hypochlorite solution is not efficient for a complete sterilisation of the B. rapa fast-cycling seeds.
To improve sterilisation efficiency, we tested four additional seed-sterilization conditions, using the same procedure while evaluating their impact on germination, in order to validate that the rate remains acceptable (
Figure 1B.1):
1. One minute in 70% ethanol followed by incubation in a 2.5% sodium hypochlorite solution for 10, 15, or 20 minutes.
2. One minute in 70% ethanol followed by incubation in a 5% sodium hypochlorite solution for 15 minutes.
For all four conditions, seeds were washed with both ethanol and sterilized water as described above. Germination rate was assessed using ~100 seeds on MS medium. Based on previous results showing the presence of endophytic bacteria in plants, sterilization efficiency was evaluated only on plants crushed with the stomacher, by plating plant juice on TSA and LPGA media. We observed germination rates of 83.46%, 89.65%, and 89.05% for seeds sterilized with 2.5% sodium hypochlorite for 10, 15, and 20 minutes, respectively, and 93.40% for the 5% sodium hypochlorite treatment applied for 15 minutes (
Figure 1B.2). Bacterial colonies were detected on crushed plants treated with 2.5% sodium hypochlorite for 10 and 15 minutes, while no colonies were observed after 20 minutes in 2.5% sodium hypochlorite or after 15 minutes in 5% sodium hypochlorite (
Figure 1B.3). As the latter condition showed the highest germination rate and complete sterilization, it was selected for the experimental evolution framework. Raw data about the seed sterilization methods are reported in Supplementary Table 1 – refer to data availability section.
2.2 Set up of the B. rapa fast-cycling – R. solani pathosystem
The R. solani (R5) strain used in our pathosystem belongs to anastomosis group (AG) 2–1. Strains from AG2–1 are known to cause severe pre- and post-emergence damping-off in oilseed rape.17,18 Once soil is contaminated, R. solani can survive saprophytically on plant debris and cause damping-off on the following culture.19 The R5 strain used in our experimental evolution framework was provided by Karima Bouchek (Inov3PT) and was originally isolated from potato tubers in France.20 The growth of R5 strain on Malt Agar 20/20 (20 g/L of maltose: reference 1.05910, Merck; 20 g/L of agar: reference 20767.298, VWR) at 20°C for three days is sufficient to colonize an entire Petri dish. In our experimental framework, we tested two R. solani inoculation methods on B. rapa fast-cycling plants, with the objective of identifying a reproducible and greenhouse-compatible method that reliably induces damping-off and is easy to apply. For both inoculation methods, B. rapa fast-cycling seeds were sterilized using the validated protocol described above. Seeds were then deposited on MS medium plates and incubated for three days in growth chamber (22°C, 16 h of photoperiod). Seedlings were then transferred in 7x7 cm pots with “Falienor” potting soil without fertilizer. All inoculations were then performed on 3-day-old seedlings, immediately after their transplanting.
For the first inoculation procedure, a mycelium plug of R. solani was removed with a sterilized loop from the fungal collection (at 4°C) and placed into a Malt Agar 20/20 plate for three days at 20°C in darkness. A plug of the grown mycelium was transferred onto sterilized cellulose nitrate membranes (47 mm diameter, 0.45 μm pore size: reference 13906–47-ACN, Sartorius) and incubated for an additional three days at 20°C. Before inoculation, the membrane was removed using a sterilized forceps and placed in a Petri dish. Fresh 3 mm mycelial plugs were then cut from the actively growing margin of the membrane using a sterile biopsy punch. For the soil inoculation, a 3-mm-wide, 15-mm-deep hole was made in the soil, approximately 10 mm from the plant. A mycelial plug was placed at the bottom of the hole, which was then covered with soil (
Figure 2A). Plants were watered with Hoagland hydroponic nutrient solution,21 and disease symptoms were scored one week after R. solani inoculation.
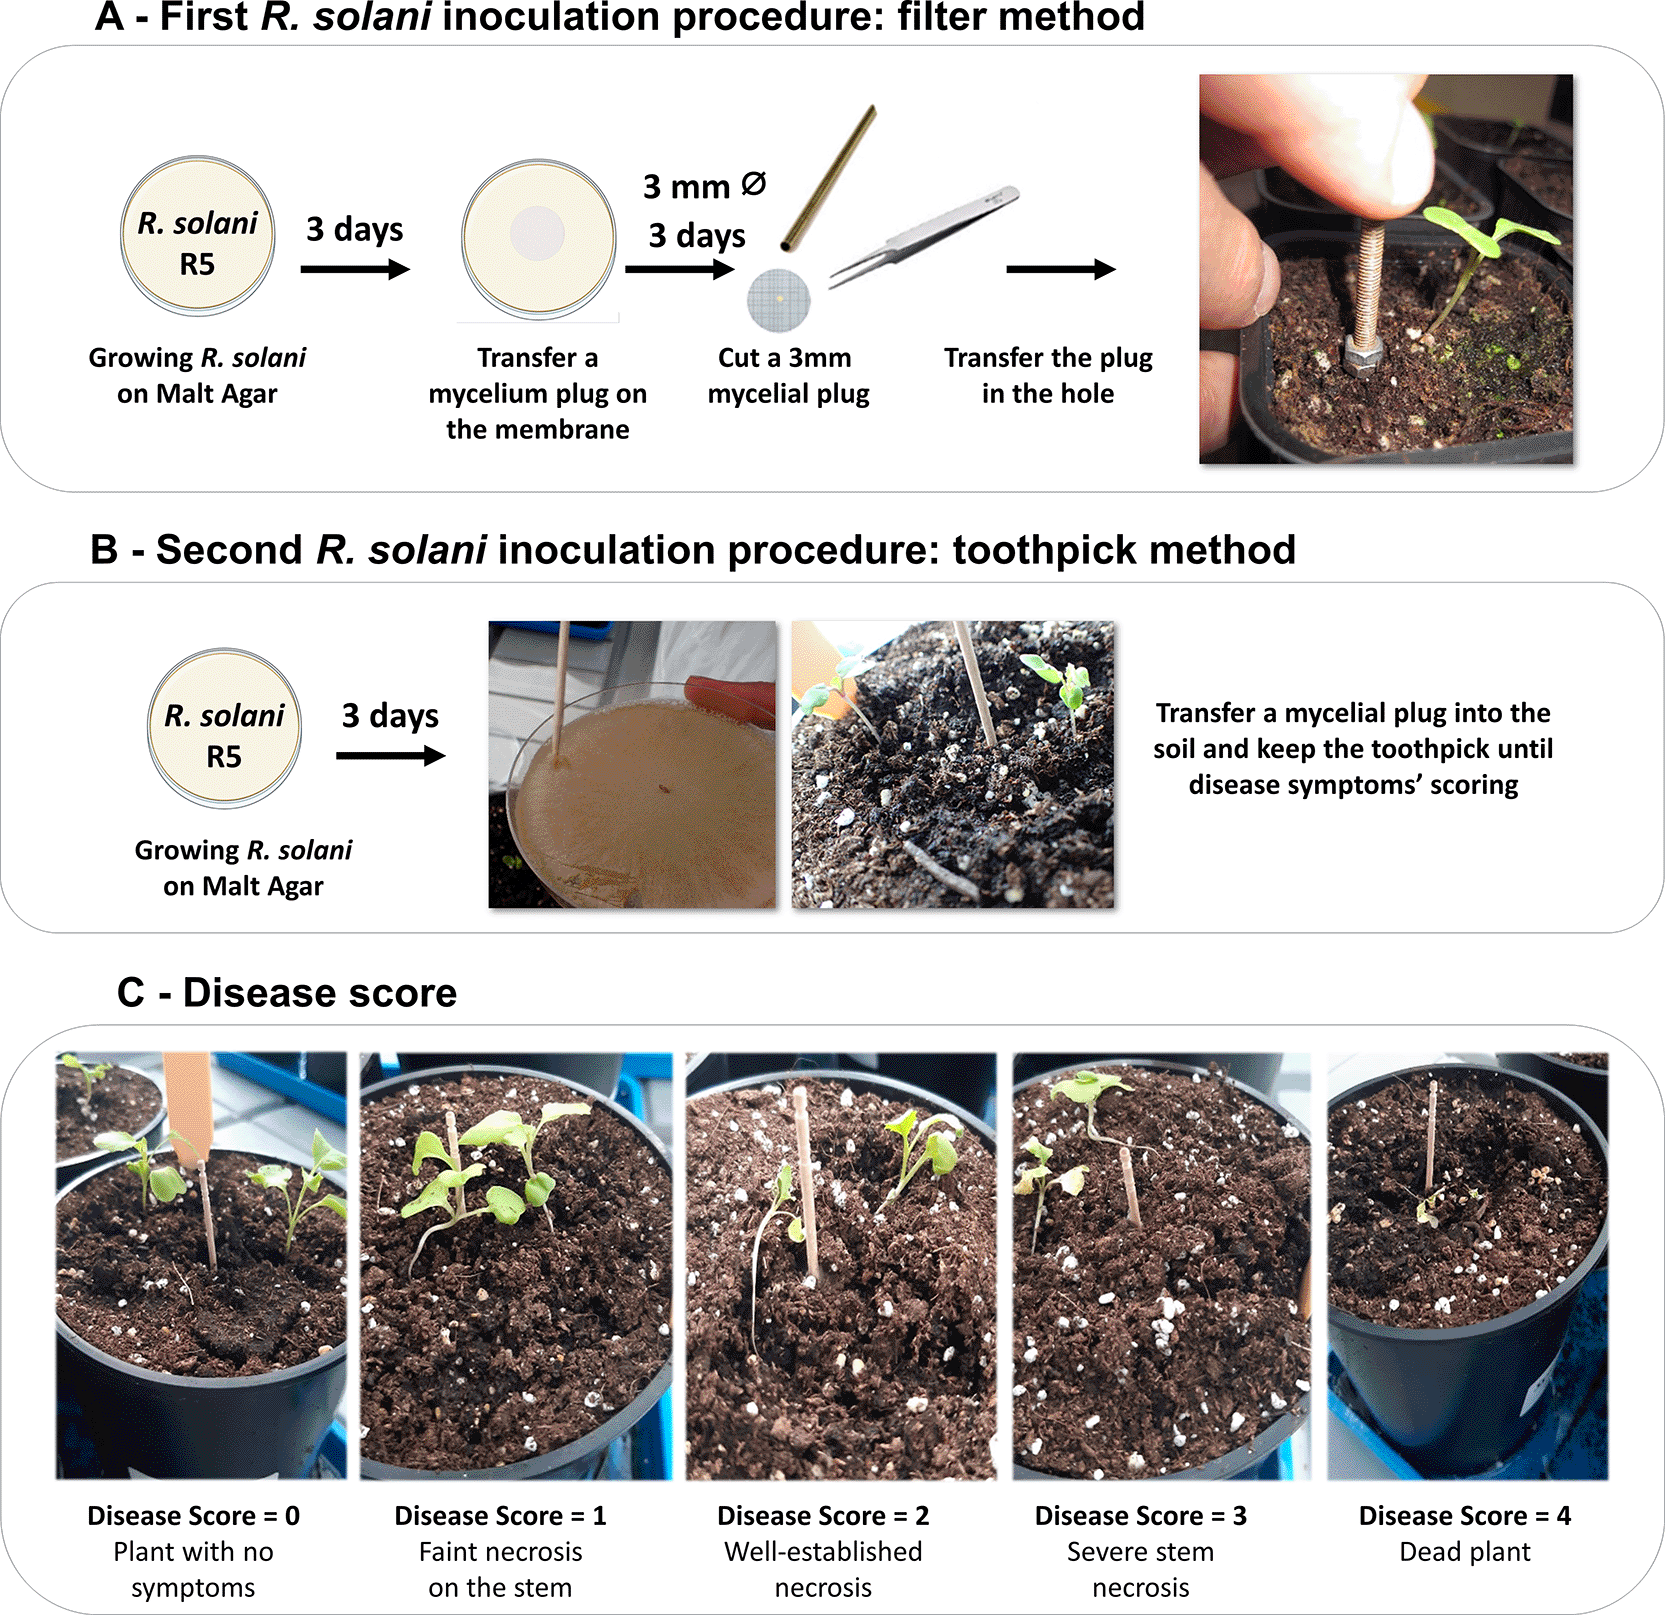
Figure 2. Methods tested to inoculate Rhizoctonia solani and disease scale.
(A) Inoculation of Rhizoctonia solani through a filter stab. (B) Inoculation of R. solani directly into the soil by using a toothpick. (C) Disease scale used to score symptoms one week post pathogen inoculation.
For the second inoculation procedure, R. solani was grown on Malt Agar 20/20 for three days at 20°C. Then a mycelium plug was removed with a sterilized toothpick and placed in the soil, 3 mm wide and 10 mm from the plant. The toothpick was left in the soil for one week, until disease symptoms were scored (
Figure 2B).
For both inoculation procedures, disease symptoms, corresponding to R. solani damping-off, were measured one week after R5 inoculation, using a disease scale ranging from 0 to 4, with (i) 0: no visible symptoms; (ii) 1: slight necrosis on the stem; (iii) 2: well-established necrosis of more than 2 cm; (iv) 3: severe necrosis of 3 cm or more; and (v) 4: dead plant with necrosis extending throughout the entire plant (
Figure 2C). For both procedures, three to six temporal blocks were performed, with an average of five plants per block. At each temporal block, negative controls were included and consisted of plants inoculated with either a filter or a toothpick in the absence of R. solani. A linear mixed-effects model was used to test differences between inoculation methods, with block and replicate included as random effects. Negative controls were excluded from the statistical analysis because they consistently showed no disease symptoms and because our objective was to specifically test the effect of the inoculation method on disease development. Both methods successfully reproduced R. solani damping-off symptoms (
Figure 3A, B). However, the linear model showed that the toothpick method was significantly more effective in inducing disease symptoms compared to the filter method (F = 7.43, P = 0.0111;
Figure 3C). In addition, disease severity was less variable with the toothpick method (residual variance = 2.06, residual SD = 1.43;
Figure 3C). Raw data on both inoculation procedures are reported in Supplementary Table 2-
refer to data availability section.
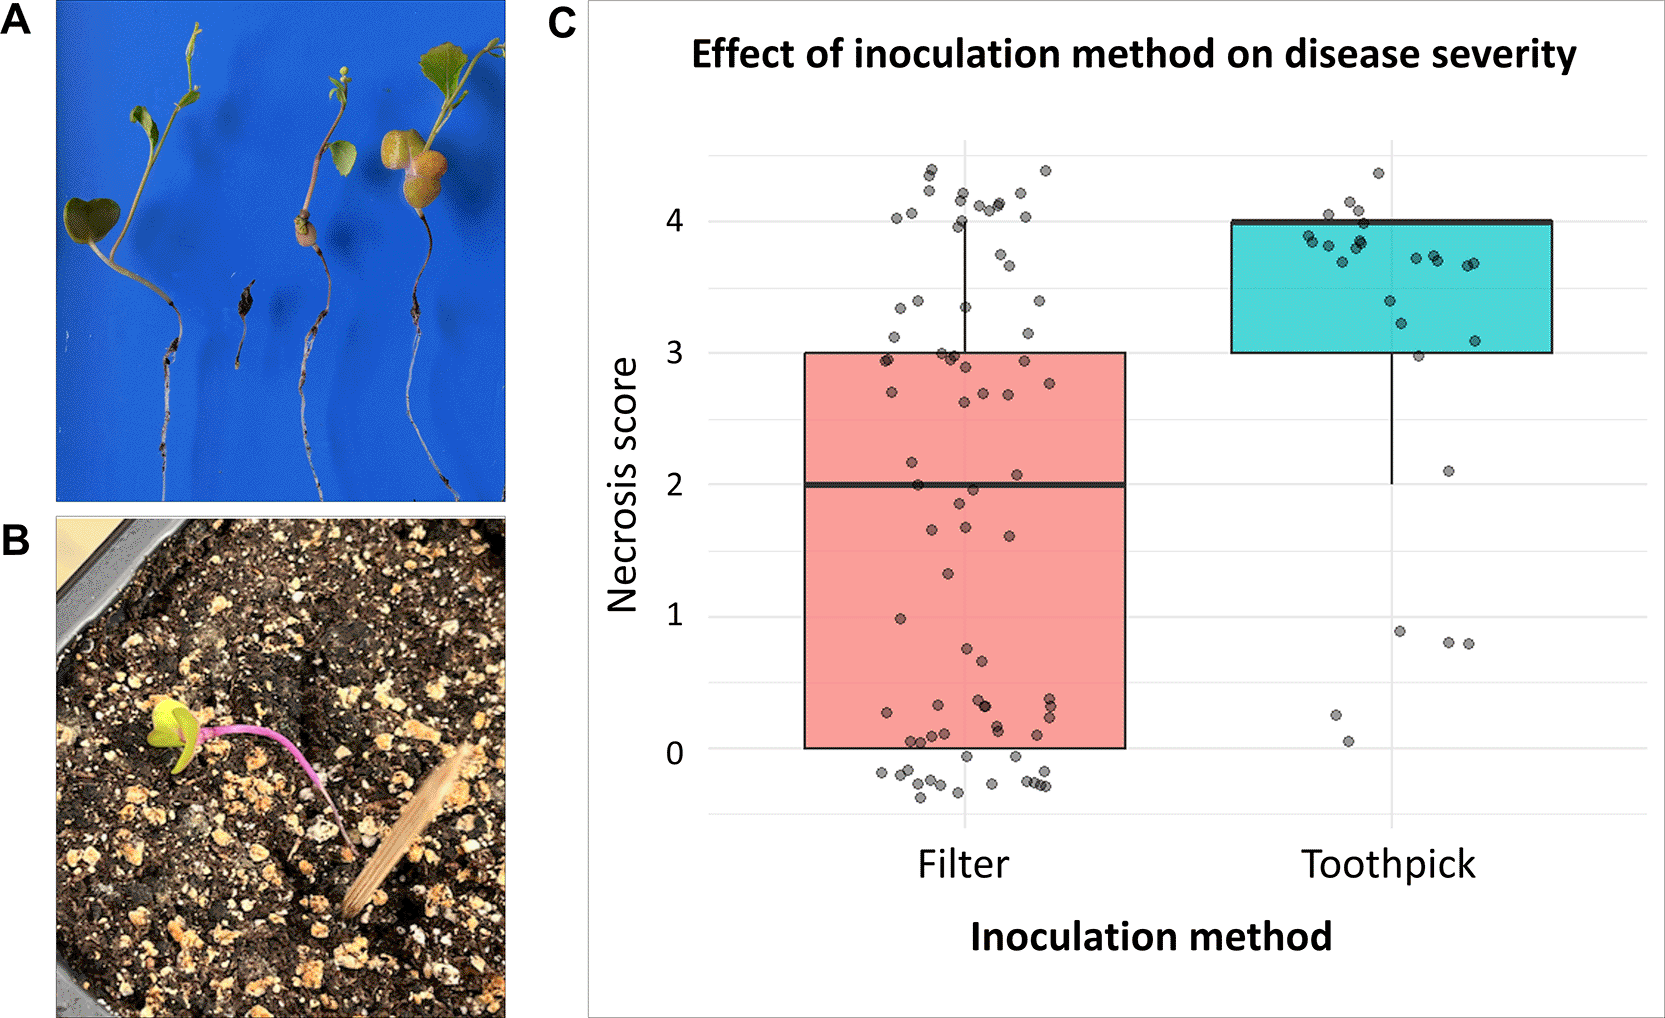
Figure 3. Comparison of disease severity obtained with two Rhizoctonia solani inoculation methods.
(A) Damping-off obtained after inoculation of Rhizoctonia solani with the cellulose membrane method. (B) Damping-off obtained after inoculation of R. solani with the toothpick method. (C) Bar-plot representing the disease score of plants inoculated with R. solani by using the two methods of inoculation.
In conclusion, the toothpick method was selected because it efficiently reproduced damping-off symptoms under greenhouse conditions and because it is easier to implement in large-scale experiments and less costly than cellulose membrane-based inoculation.
3. Building ad hoc-designed microbial communities for evolutionary studies
Three ad hoc–designed microbial communities were used in this study to validate the experimental evolution framework. The three communities differed in the number of microbial species they contained, following a nested design: microbial community 2 included all species present in community 1 plus additional species, and microbial community 3 included all species present in communities 2 plus further species unique to community 3 (Supplementary Table 3). The hypothesis behind this design was to test whether increasing microbial diversity differentially impacts host evolutionary traits, such as pathogen resistance, across multiple plant life cycles.
3.1 Preparation of bacterial communities
A total of 33 bacterial strains belonging to different species were used to construct three ad hoc–designed microbial communities. All strains were isolated from natural populations of B. rapa located in Italy and France.22 Both fungal and bacterial strains (
Figure 4A; Supplementary Table 3 - refer to data availability section) are free of Nagoya restrictions and were selected to cover a broad taxonomic diversity. Detailed information on the bacterial strains, is provided in Supplementary Table 3. Prior to community assembly, bacterial growth dynamics were characterized using a CLARIOstar® Plus plate reader (BMG Labtech, Germany) to determine the time required for each strain to reach the stationary phase. Other plate readers can also be used for this purpose. Each bacterial strain was first streaked onto Nutrient Agar23 supplemented with 40 g/L of CaCl2: reference C-3306-500G, Merk (Supplementary Text- refer to data availability section) and incubated at 28°C for four days. A fresh colony was then scraped with an inoculation loop, resuspended in 500 μl of distilled water, and 250 μl of this suspension were spread onto a new Nutrient Agar plate and incubated overnight at 28°C. Fresh colonies were subsequently scraped, resuspended in 1 ml of sterilized distilled water, and adjusted to an OD600 of 0.15 in a final volume of 200 μl. These suspensions were then dispensed into 96-well Greiner plates. Growth kinetics were monitored using the CLARIOstar® Plus plate reader under the following conditions: readings every 6 minutes for 96 hours at 25°C, with linear shaking at 700 rpm. Growth curves were analysed to determine the time required for each strain to reach stationary phase (Supplementary Table 3;
Figure 4B). The selected bacterial strains exhibited substantial variation in growth kinetics, with stationary phase reached as early as 8 hours for some strains and up to 24 hours for others (
Figure 4B). We observed that growth rates were not correlated with the bacterial genus (
Figure 4B). This observation was confirmed by performing a Kruskal-Wallis test by using the taxonomical affiliation as explicative factor. As expected, the test was not significant (chi-squared = 26.511, P = 0.3807) by confirming that the bacterial genus does not explain the growth kinetic.
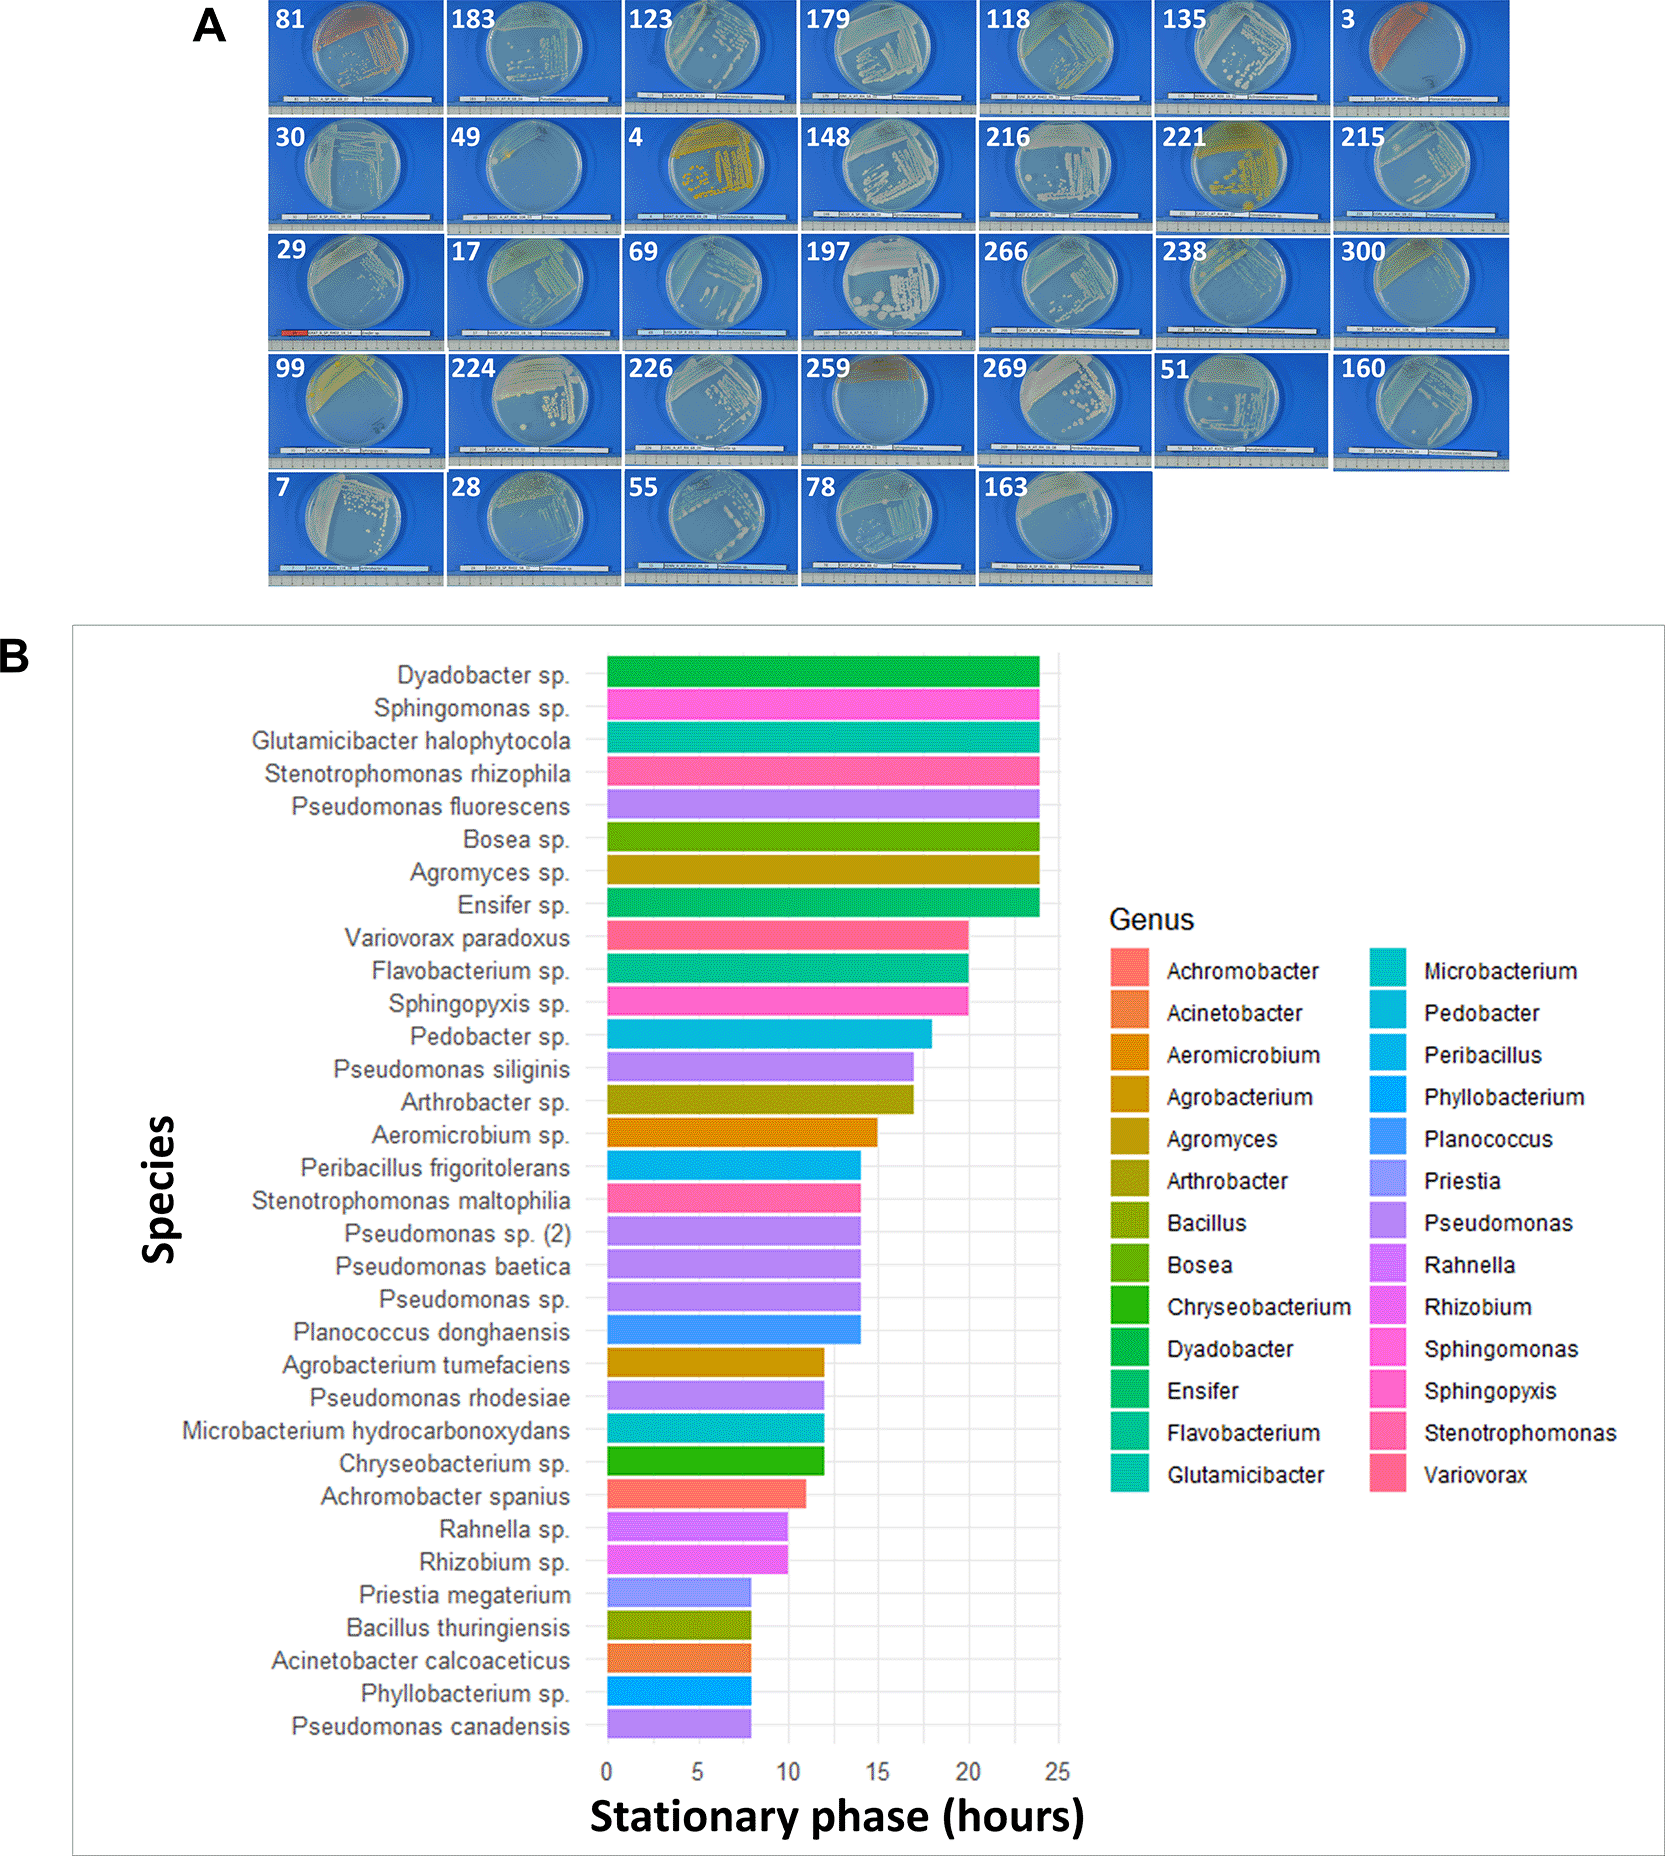
Figure 4. Bacterial strains used to produce ad hoc-designed communities for experimental evolution studies.
(A) bacterial morphologies on Nutrient Agar plates. (B) histogram of the time to reach the stationary phase for each bacterial species. The histogram shows that bacterial strains were not grouped by genus.
Based on growth kinetics, selected bacterial strains were prepared as follows:
1. Each bacterial strain was grown individually on Nutrient Agar and incubated at 20°C for four days. Strain purity was verified prior to further processing.
2. A single pure colony of each strain was resuspended in 10 μl of sterilized distilled water and used to inoculate 5 liters of Nutrient Agar. An important point is that inoculation time for each strain was adjusted according to its growth kinetics so that all strains reached the stationary phase simultaneously at the end of incubation. This step ensured homogenization of physiological growth status among strains within each microbial community.
3. This procedure was repeated independently for each strain composing the three ad hoc–designed bacterial communities.
4. Once the microbial mixtures reached stationary phase, each 5-liter culture was diluted in 20 liters of sterilized distilled water in 30-liter autoclaved carboys (Nalgene). One carboy was used per microbial community.
The three carboys containing the distinct microbial communities were subsequently used as bacterial inocula for the experimental evolution procedures described in the following section.
3.2 Preparation of fungal communities
A total of 14 fungal isolates (
Figure 5) belonging to different species and isolated from the natural populations of B. rapa22 have been used to reconstruct the three ad hoc-communities. Information about strain origin and sequences used to affiliate them taxonomically are available in Supplementary Table 3 refer to data availability section. As for the bacterial strains, all the fungal isolates are free of Nagoya restrictions and were selected to cover a broad taxonomic diversity. Prior to ad hoc-communities assembling, fungal strains were grown onto a modified Inhibitory Mold Agar medium24 described in Supplementary Text. A total of 20 plates per each fungal strain were prepared prior inoculation (
Figure 5) and incubated for 10 days at 20°C. Fungal purity was verified through visual observation prior ad hoc-community assembling.
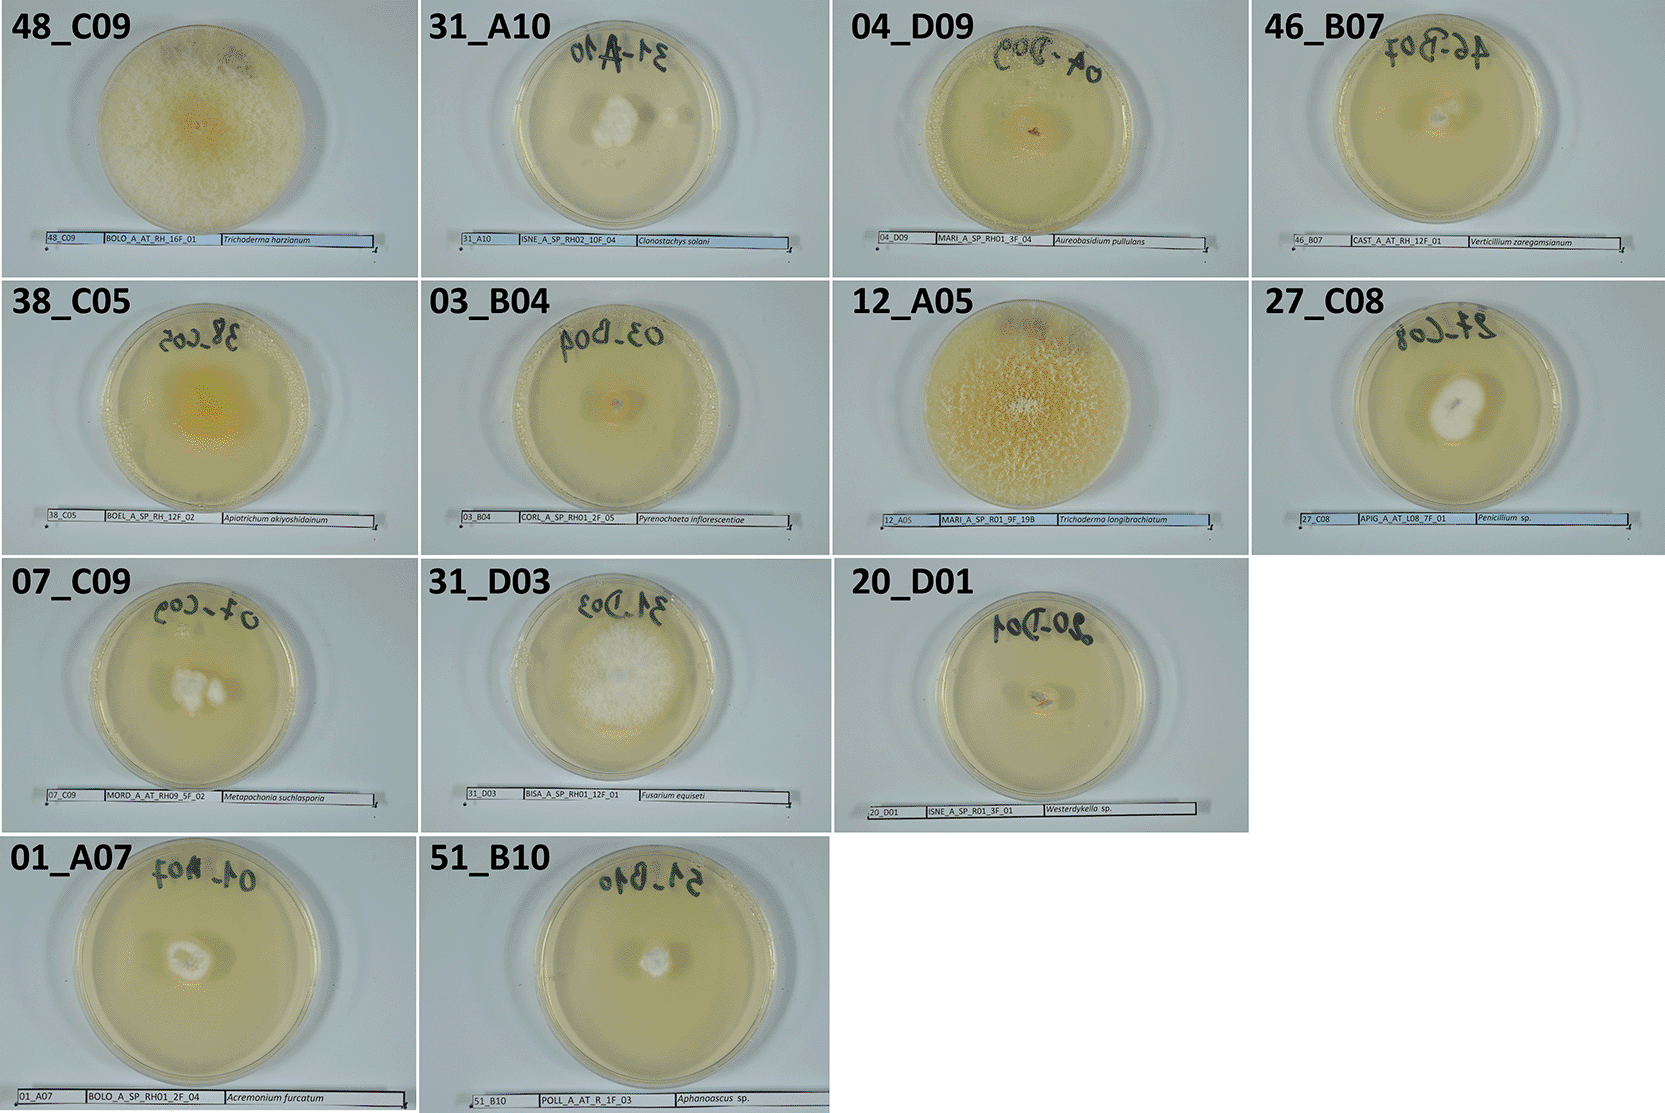
Figure 5. Fungal strains used to produce ad hoc-communities for experimental evolution studies. Morphology of the fungal strains inoculated onto Inhibitory Mold Agar.
4. Implementation of the plant /ad hoc-designed microbial communities’ experimental evolution
The experimental evolution study developed here relies on B. rapa fast-cycling plants, ad hoc–designed microbial communities assembled from a bacterial and fungal strain collection, and the soil-borne fungal pathogen R. solani. All experiments were conducted using potting soil sterilized by gamma irradiation by the French company Ionisos (https://www.ionisos.com/), with a minimum dose of 45 kGy and a maximum dose of 60 kGy. The sterilized potting soil was used four months after gamma irradiation to allow soil particles to stabilize. Indeed, in experiments requiring sterilized soil, it is critical to avoid autoclaving, as high temperatures alter soil carbon composition and increase nutrient availability, which can bias plant and microbial responses.25 The evolutionary experiment described here, encompassing four plant generations, was conducted at the IGEPP laboratory (INRAE, Rennes, France) in a controlled greenhouse environment (21°C, 16-h light photoperiod). An L2 greenhouse facility was used to ensure precise temperature regulation and to minimize environmental microbial contamination, which is a critical consideration for long-term evolutionary experiments. Although the use of an L2 facility was not strictly required, since neither the fast-cycling plants nor the microbial strains used were genetically modified or quarantine organisms, the L2 facility was chosen to guarantee optimal and stable environmental control throughout this experiment, which involved complex interactions between plants and microorganisms.
In addition, to prevent contamination originating from the watering system, tap water was sterilized using 0.45 μm PES Sartorius Sartopore® 2 filters (MidiCaps, 0.2 m2; polyethersulfone; reference: Sartorius 5445306G9G-SS—A). All watering was performed using either filtered water or sterilized modified Hoagland 1× solution (Supplementary Text- refer to data availability section). The quality of the filtered water (i.e. absence of microbes) was verified weekly on LPGA medium and the filter was autoclaved monthly.
4.1 Preparation of the B. rapa fast cycling families and set-up of the experimental evolution pipeline
Fifty full-sib families of B. rapa fast-cycling plants were used as the starting plant population in this study. These families were generated by manual crosses among 200 B. rapa plants grown in 2022 at the IGEPP L2 greenhouse facility, in order to minimize maternal effects from the original seed stock purchased from the University of Wisconsin–Madison. To challenge the 50 B. rapa families with the three ad hoc–designed microbial communities, in generation one, the 50 families generated were distributed to perform independent inoculations with the three communities, and these families were maintained as isolated lineages over four successive plant generations (
Figure 6). In detail, to propagate plants for the first generation, twenty seeds per plant family were sterilized using the validated method described above (
Figure 1 B.1) and incubated for two days on modified M medium agar plates (Supplementary Text) under 24 hours light at 22°C and 50% relative humidity. These conditions were only used to seed germination. Gamma-irradiated potting soil was placed into 300 one-liter pots (reference: 7007210 MIL CONT. SH ROSIER 1 L ROND G2 NOIR), which were previously sterilized by exposure to UV light for 30 minutes. Once two-day-old seedlings were obtained (
Figure 6A), the experimental evolution was set up as follows:
1. At day 0 of experimental evolution, each 1-L pot containing gamma-irradiated soil received two germ-free B. rapa fast-cycling plants from one sib-family, together with two stakes to support plant growth (
Figure 6B). Two plants per pot were used so that one plant could be harvested for early phenotyping, while the second was maintained for seed production for the next generation (see below).
2. Two hundred milliliters of the bacterial suspension corresponding to the ad hoc–designed microbial communities described in Section 3.1 were added to each pot using a sterile flask. Three distinct microbial communities were tested in the study (
Figure 6C). The fungal strains described in Section 3.2 and completing the ad hoc–designed microbial communities were introduced using a toothpick, following the same procedure as described for R. solani inoculation.
3. One day after inoculation of the ad doc-designed communities, R. solani was inoculated using the toothpick method (
Figure 6D), in order to test the ability of the three ad hoc–designed microbial communities to protect B. rapa fast-cycling plants across multiple generations. At day 7, disease severity was assessed using the scoring system described in Section 2.2.
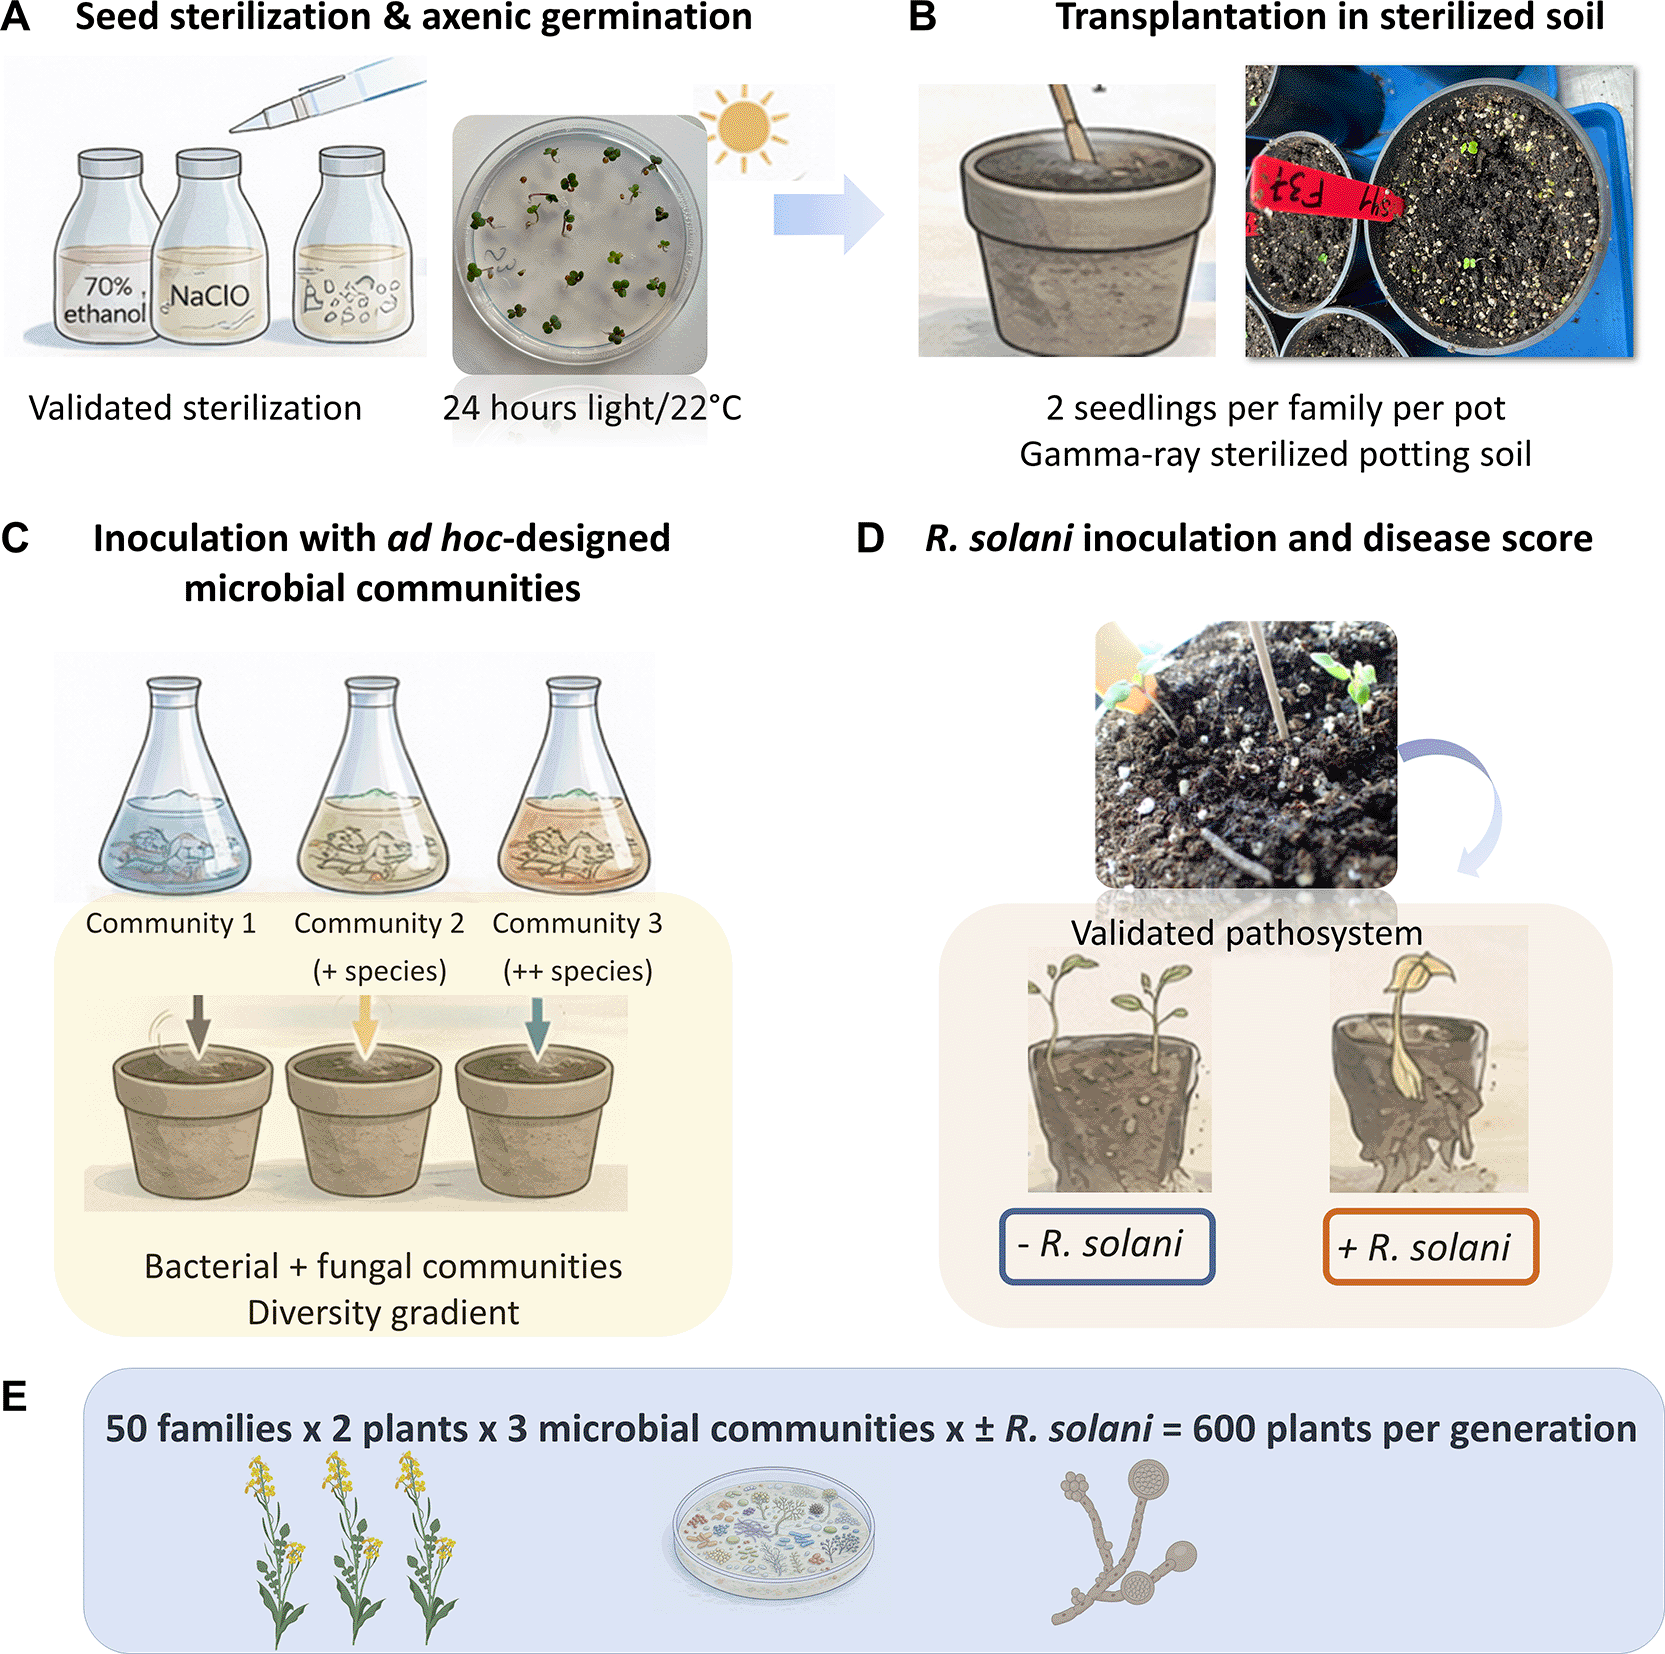
Figure 6. Schematic timeline of the experimental evolution set-up.
(A) Seeds from 50 full-sib families were surface-sterilized and germinated under axenic conditions. (B) Two-day-old seedlings were transplanted into gamma-irradiated soil and (C) inoculated with one of three ad hoc–designed microbial communities, and in absence or presence of Rhizoctonia solani (D). Seven days post inoculation disease score was recorded for all plant. (E) The same design was repeated across four generations, with plants grown in the presence or absence of the pathogen.
Importantly, two plants from each family were placed in a single pot, and 50 families were used per ad hoc–designed microbial community, resulting in 100 plants per community. In addition, the 50 families were grown both in the presence and absence of R. solani, resulting in a total of 600 plants per generation. This design reduced genetic drift and allowed direct comparison of the effects of the ad hoc–designed microbial communities with or without pathogen treatment. The overall experimental design, illustrated in
Figure 6E, was as follows:
This design was maintained across all generations. To minimize environmental effects, pots were randomized weekly after watering. This step was essential to reduce micro-environmental variation within the greenhouse and its potential effects on plant performance and microbial community dynamics. Plants were watered weekly with 200 ml of filtered water per pot, and once per month pots received 200 ml of modified Hoagland 1× solution (Supplementary Text- refer to data availability section).
4.2 Steps during each plant generation of the experimental evolution
The ad hoc–designed microbial communities were prepared and inoculated only once, at the beginning of the experiment. The final objective of the HoloE2Plant project is to study plant–microbe coevolution under biotic constraints such as pathogen attack. Therefore, after the initial inoculation at generation one, microbial communities are allowed to evolve together with the host plant. Similarly, seed sterilization was performed only at the start of the experimental evolution and, in subsequent generations, seeds were resown without sterilization. In contrast, several experimental steps were repeated at each generation (
Figure 7). Below, we describe the chronological sequence of the procedures carried out during each plant generation.
1.
Flowering time assessment
: From 9 to 13 days after sowing, flowering time was recorded for all plants. A flower bud was considered flowering when the pistil became visible and the flower was partially open. The range of flowering time (9–13 days) varied depending on the season and supplemental lighting in the greenhouse. Plants were monitored daily to accurately record flowering time.
2.
Hand controlled pollination
: From 18 to 20 days after sowing, plants were hand-pollinated within each treatment (ad hoc–designed microbial community, with or without R. solani). Pollination was performed treatment by treatment, and all materials and surfaces were thoroughly cleaned between treatments to avoid cross-pollination. For each plant, six flower buds were pollinated. The bud of the maternal plant was gently opened, and pollen from a randomly selected paternal plant was applied directly to the pistil. After pollination, each flower bud was marked with sewing thread. Open flowers were not used to prevent self-pollination or unintended pollen transfer; saturating the pistil during pollination further minimized external pollen contamination. Maternal and paternal plants were randomly chosen within each treatment, and all 50 families were pollinated at each generation. Only one of the two plants per pot were pollinated, while the second plant was reserved for phenotyping. The choice of the pollinated plant was random to avoid any unintentional selection based on plant morphology. In total, 300 plants were pollinated per generation (50
B. rapa families × 3
ad hoc–designed microbial communities × 2treatments [with/without R. solani]).
3.
Early phenotyping and biological sampling
: Between 25 and 30 days after sowing, the non-pollinated plant was used for the first phenotyping stage and biological material collection. The measured traits included primary shoot length, primary root length, and vegetative dry biomass (after drying the vegetative tissue at 80°C for two days). These measurements were performed on individual plants (N = 300) to maximize statistical power. At this stage, pooled root and rhizosphere samples were also collected (five pools per treatment). A total of 30 pools per generation was obtained. Samples were stored at −80°C for subsequent total DNA extraction and microbiota analyses, and at −20°C in 40% glycerol for future isolation of evolved bacterial and fungal strains. Collecting this material is essential for in-depth analyses of microbial community dynamics and evolution across generations.
4.
Late phenotyping and fitness estimation: Between 40 and 45 days after sowing, the pollinated plant was phenotyped. Measured traits included the number of secondary branches, the number of aborted flowers, and silique length. For each family and treatment, siliques were dried at 27°C for five days. Seeds were then counted to estimate plant fitness through the weight of 40 dried seeds.
5.
Setting up the next generation
: The next generation was established using the collected seeds. Plant fitness, estimated as total seed number, was the sole trait used to determine the contribution of each family to the subsequent generation. For each treatment, the total number of seeds was calculated, and the number of seeds contributed by each family was determined using the following equation, assuming that 120 seeds were required per condition to obtain 100 plants:
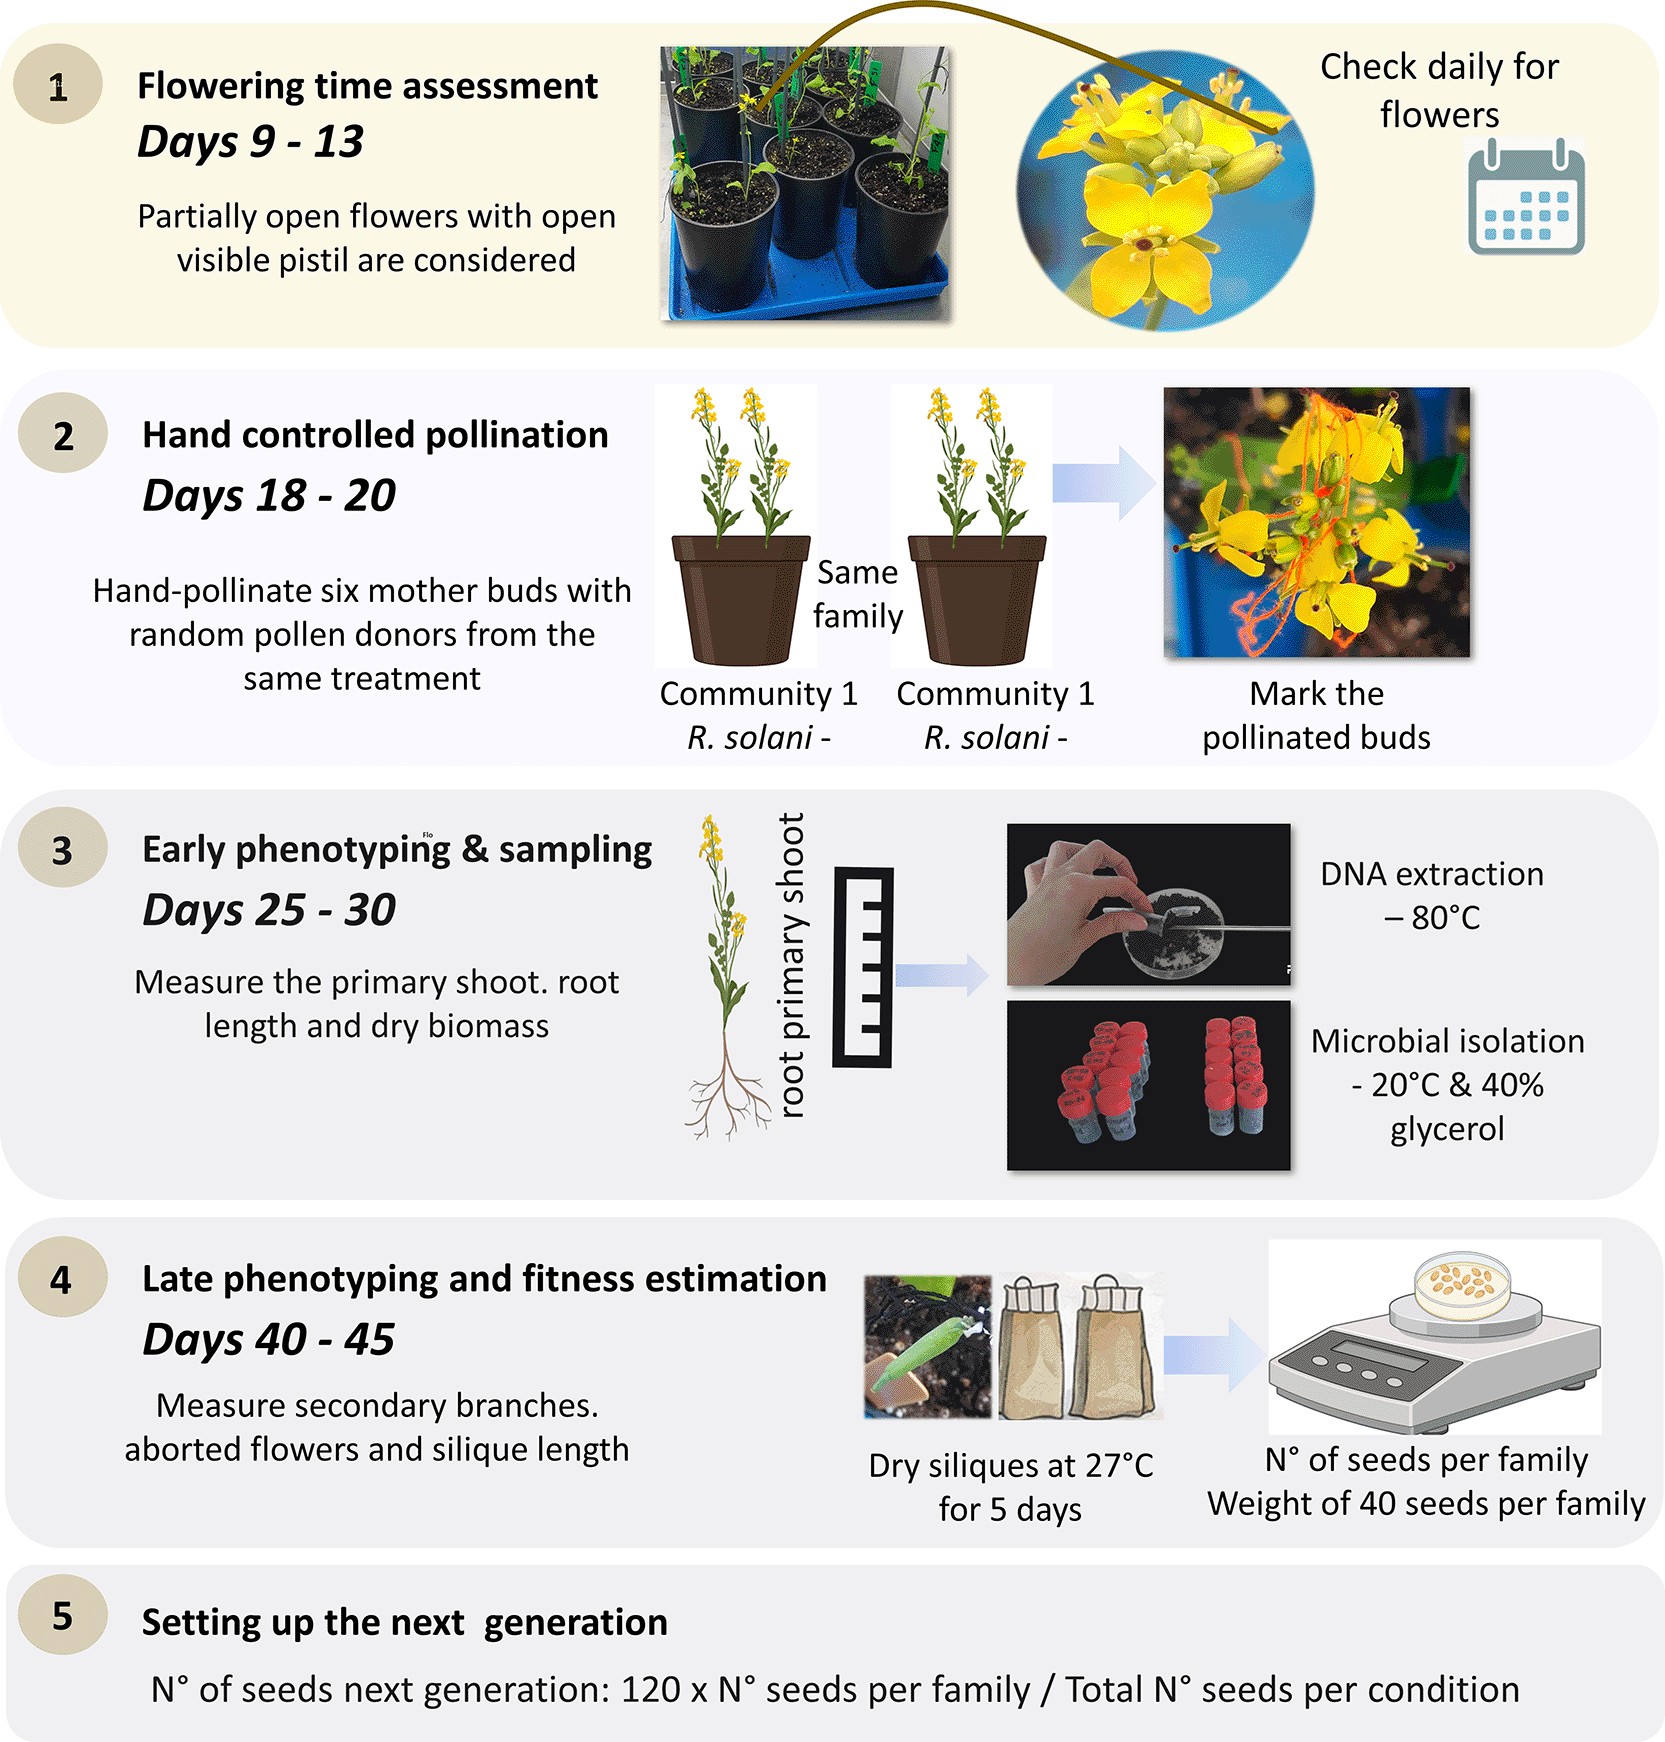
Figure 7. List of steps repeated at each generation.
The showed procedures allow to deep characterize plant populations over the generations and to collect important biological material for further studies.
Consequently, plants with higher fitness contribute proportionally more to the next generation. Seeds were imbibed in sterilized distilled water for 30 minutes and then placed on agar plates for germination under continuous light at 22°C for two days. Before transplanting seedlings, soil in each pot was gently mixed with a sterilized spatula to prevent moss development on the soil surface. The next generation was then initiated. These steps were repeated at each generation. Collecting extensive phenotypic data and biological material at every generation is crucial for future evolutionary analyses. A complete schematic overview of the experimental evolution design is provided in
Figure 7.
5. The impact of ad hoc-designed communities on the host resistance to R. solani over four generations
Our experimental evolution approach was implemented using B. rapa fast-cycling plants to investigate the effects of ad hoc-communities across plant generations on disease resistance. Fifty independent plant families were followed over four successive generations (G1–G4). Three distinct ad hoc-designed communities (S1, S2, S3), composed of defined bacterial and fungal isolates, were used to inoculate plants challenged with the soil-borne fungal pathogen R. solani. Following the experimental evolution procedure presented here we measured all the phenotypes. However, the complete dataset is going to be published further in a more complete article not only focusing on the methodology development. In fact, our intent here is to present the complete pipeline of the evolution experiment to illustrate the power of the method that can be extended to other plant-microbe interactions, with or without additional biotic or abiotic stresses. Here we added a biotic stress challenging the B. rapa - communities’ interactions with a pathogenic fungus, R. solani. Because disease severity was measured on an ordinal scale, data were analyzed using Cumulative Link Mixed Models (CLMMs) with a logit link function. The response variable was the disease score. The main model included: i) fixed effects (i.e. generation (ordered factor), ad hoc-designed communities, and their interaction; and ii) random effects (i.e. family, random intercept). Generation was treated as an ordered factor to explicitly model evolutionary trajectories across generations using orthogonal polynomial contrasts (linear, quadratic, cubic). Model fitting was performed using the clmm() function from the ordinal R package. Model assumptions and convergence diagnostics were carefully checked. Post-hoc
contrasts among ad hoc-communities within each generation were computed using estimated marginal means, and P-values were adjusted for multiple testing. All these analyses were conducted in R (version 4.5.0).
We found that, disease severity significantly changed across generations (Supplementary Table 4-
refer to data availability section;
Figure 8). The CLMM analysis revealed strong generation effects, with significant linear, quadratic, and cubic trends (
Table 1), indicating non-linear dynamics of disease resistance across the four plant generations. Overall, disease severity tended to decrease across generations, consistent with an adaptive response during experimental evolution. Microbial communities (S1, S2 and S3) identity significantly influenced disease severity. Using S1 as the reference level, plants inoculated with S2 showed significantly reduced disease severity (P < 0.05), whereas S3 did not differ significantly from S1 when averaged across generations (
Table 1). A significant interaction between generation and ad hoc-designed communities was detected, indicating that the effect of microbial communities on disease resistance depended on the plant generation. In particular, S2 showed a progressively stronger protective effect in later generations, with significant differences emerging in G3 and G4. S3 exhibited more variable effects, with transient differences in intermediate generations but no consistent evolutionary trend. These results demonstrate that microbial community composition not only affects disease resistance but also shapes its evolutionary trajectory over generations. Random effects (family) revealed substantial among-family variation in disease severity, confirming that genetic background contributed to differential disease outcomes. However, family-level variance was small relative to the fixed effects of generation and ad hoc-designed communities, indicating that microbial and temporal effects dominated disease dynamics in this experiment.
Figure 8. Model-based evolutionary trajectories of disease severity across generations for each ad hoc-microbial community.
Lines show predicted latent disease severity (CLMM, logit link), with shaded areas indicating 95% confidence intervals. Generation was inferred using orthogonal polynomial contrasts, revealing non-linear and community-specific evolutionary dynamics. Significance letters were estimated with Tukey’s test comparisons.
Table 1. Fixed-effect estimates from the cumulative link mixed model (CLMM) testing the effects of plant generation and ad hoc-communities on disease severity.
Disease score was analysed as an ordinal response using a logit link. Generation was considered as an ordered factor and decomposed into orthogonal polynomial contrasts (L = linear, Q = quadratic, C = cubic) to capture non-linear evolutionary dynamics across generations. Community 1 (S1) was used as the reference level for microbial community effects. Interaction terms describe how the effect of generation varies among microbial communities. Estimates are shown on the latent (log-odds) scale, with associated standard errors, Wald z-values, and two-sided P-values. Statistically significant effects in bold (P < 0.05) indicate changes in disease severity trajectories across generations and microbial communities.
| Coefficients | Estimate | Std.Error | z-value
| Pr(>|z|) |
|---|
| Generation.L | −1.54914 | 0.39741 | −3.898 | 9.69e-05
|
| Generation.Q | −1.40637 | 0.34184 | −4.114 | 3.89e-05
|
| Generation.C | −0.90534 | 0.27601 | −3.280 | 0.00104
|
| Community 2 | −0.52203 | 0.23463 | −2.225 | 0.02609
|
| Community 3 | 0.03504 | 0.22778 | 0.154 | 0.87774 |
| Generation.L:Community2 | 0.97448 | 0.51040 | 1.909 | 0.05623 |
| Generation.Q:Community2 | 1.47945 | 0.46869 | 3.157 | 0.00160
|
| Generation.C:Community2 | 0.38740 | 0.42226 | 0.917 | 0.35891 |
| Generation.L:Community3 | 1.42930 | 0.50585 | 2.826 | 0.00472
|
| Generation.Q:Community3 | 0.80245 | 0.45537 | 1.762 | 0.07804 |
| Generation.C:Community3 | −0.13811 | 0.39941 | −0.346 | 0.72950 |
6. Conclusions
In our study, we developed a controlled experimental evolution method to investigate how plant–microbiome interactions shape the evolutionary dynamics of disease resistance. The ultimate goal of our approach is to develop a method to study holobionts dynamic and evolution in a short time lapse. It is important to specify that, while the holobiont concept emphasizes the ecological and functional integration of hosts and their associated microorganisms, it does not inherently imply coevolution among all members of the assemblage. Indeed, coevolution is more specifically defined as reciprocal evolutionary change between interacting partners driven by mutual selective pressures.26 Consequently, the presence of consistent host–microbe associations should not be interpreted as evidence of coevolution per se as intended in symbionts. As discussed by Moran and Sloan (2015),27 the existence of host-associated microbial communities does not necessarily imply that hosts and microbes constitute a unified evolutionary entity. A specific microbe can colonize a host and impact its fitness without necessary coevolving with the host.27 Similarly, Douglas and Werren (2016)28 argued that many microbiome associations are shaped by ecological and transmission processes rather than by coevolutionary dynamics. More recently, the importance of distinguishing ecological interactions from evolutionary integration when evaluating host–microbiome relationships was discussed.29
The null hypothesis for the classical holobiont/hologenome theory is that the host and its associated microbial partners evolve independently, and that observed associations arise through ecological filtering, environmental acquisition, dispersal limitation, or shared responses to environmental conditions rather than reciprocal selection.27 Under this view, coevolution can only be inferred when evidence demonstrates reciprocal adaptation between partners, partner specificity beyond ecological expectations, congruent evolutionary trajectories, or other signatures indicating that selection acting on one partner has influenced the evolution of the other. In this methodological study, our use of the holobiont concept therefore does not assume coevolution among all interacting organisms but instead provides a framework for investigating when and under what conditions evolutionary coupling occurs.
By combining fast-cycling B. rapa plants with ad hoc-designed microbial communities and the soil-borne fungal pathogen R. solani, we were able to define plant–holobiont responses over multiple plant generations under standardized environmental conditions. Our results show that disease resistance is not a static trait but evolves dynamically across generations, and that its trajectory is modulated by microbial community composition. Distinct microbial communities generated divergent dieases outcomes, revealing that the microbiome can act as a selective environment that constrains or promotes adaptive responses to pathogen pressure. Importantly, these effects were non-linear through time, highlighting the necessity of explicitly modelling evolutionary dynamics rather than relying on single-generation analysis. While family-level variation (considered here as the random effect) contributed to disease outcomes, the dominant drivers were the plant generation and microbial community identity. Importantly, our methodological study does not demonstrate coevolution between the host plant and the experimentally assembled microbial communities. As discussed above, demonstrating coevolution requires evidence of reciprocal evolutionary change between interacting partners.29 To test this hypothesis, whole-genome sequencing of both ancestral and evolved plant populations and microbial communities would be necessary, coupled with joint-GWA analyses14,30 to determine whether changes in plant allele frequencies are associated with microbial genomic modifications, such as mutations, recombination events, or genome rearrangements. In parallel, monitoring microbial community dynamics through metabarcoding approaches would help identify which microbial taxa are consistently selected by the host and how these associations influence plant health and fitness. These questions are being addressed within the HoloE2Plant project,31 which combines nine generations of experimental evolution using the methodology presented here with whole-genome sequencing of both plant and microbial partners. By integrating genomic, metagenomic, and community-level data, the project aims to test whether host plants and their associated microbiota exhibit signatures of coevolution. More specifically, it will evaluate whether the holobiont can be considered a coevolving entity, whether evolutionary changes occur largely independently among partners, or whether only a subset of microbial taxa show evidence of evolutionary coupling with the host.
Beyond its biological insights, that will be addressed in a more detailed study, our work was intended to establish a robust methodological framework for studying host–microbiome dynamic under ecologically relevant biotic constraints. The ability to combine controlled microbial communities, multi-generational selection, and high-resolution phenotyping provides a powerful tool to address fundamental questions in evolutionary ecology.
Ethics and consents
Ethical approval and consent were not required.
Data availability
Supplementary Data of the paper “A Novel method and model system to investigate plant–microbiome coevolution”.32 In Open Reserch Europe. Zenodo. https://doi.org/10.5281/zenodo.17988014.32 This project includes the following data:
Supplementary Table 1. Raw data on the seed sterilization procedures.
Supplementary Table 2. Raw data on the Rhizoctonia solani inoculation procedures.
Supplementary Table 3. Information of bacterial and fungal strains used to reconstruct ad hoc-microbial communities.
Supplementary Table 4. Raw data of the experimental evolution concerning disease resistance to Rhizoctonia solani.
Supplementary Text. This includes protocols for media and solutions used in the study and scripts used to analyse data from experimental evolution.
Data are available under the terms Creative Commons Zero v1.0 Universal (CC-BY 1.0).
Sequences used to affiliate the bacteria strains used in the ad hoc-designed microbial communities are available in GenBank on the following NCBI link https://www.ncbi.nlm.nih.gov/nuccore?cmd=Search under the following accession numbers: PZ008482 (https://www.ncbi.nlm.nih.gov/nuccore/PZ008482), PZ008483 (https://www.ncbi.nlm.nih.gov/nuccore/PZ008483), PZ008484 (https://www.ncbi.nlm.nih.gov/nuccore/PZ008484), PZ008485 (https://www.ncbi.nlm.nih.gov/nuccore/PZ008485), PZ008486 (https://www.ncbi.nlm.nih.gov/nuccore/PZ008486), PZ008487 (https://www.ncbi.nlm.nih.gov/nuccore/PZ008487), PZ008488 (https://www.ncbi.nlm.nih.gov/nuccore/PZ008488), PZ008489 (https://www.ncbi.nlm.nih.gov/nuccore/PZ008489), PZ008490 (https://www.ncbi.nlm.nih.gov/nuccore/PZ008490), PZ008491 (https://www.ncbi.nlm.nih.gov/nuccore/PZ008491), PZ008492 (https://www.ncbi.nlm.nih.gov/nuccore/PZ008492), PZ008493 (https://www.ncbi.nlm.nih.gov/nuccore/PZ008493), PZ008494 (https://www.ncbi.nlm.nih.gov/nuccore/PZ008494), PZ008495 (https://www.ncbi.nlm.nih.gov/nuccore/PZ008495), PZ008496 (https://www.ncbi.nlm.nih.gov/nuccore/PZ008496), PZ008497 (https://www.ncbi.nlm.nih.gov/nuccore/PZ008497), PZ008498 (https://www.ncbi.nlm.nih.gov/nuccore/PZ008498), PZ008499 (https://www.ncbi.nlm.nih.gov/nuccore/PZ008499), PZ008500 (https://www.ncbi.nlm.nih.gov/nuccore/PZ008500), PZ008501 (https://www.ncbi.nlm.nih.gov/nuccore/PZ008501), PZ008502 (https://www.ncbi.nlm.nih.gov/nuccore/PZ008502), PZ008503 (https://www.ncbi.nlm.nih.gov/nuccore/PZ008503), PZ008504 (https://www.ncbi.nlm.nih.gov/nuccore/PZ008504), PZ008505 (https://www.ncbi.nlm.nih.gov/nuccore/PZ008505), PZ008506 (https://www.ncbi.nlm.nih.gov/nuccore/PZ008506), PZ008507 (https://www.ncbi.nlm.nih.gov/nuccore/PZ008507), PZ008508 (https://www.ncbi.nlm.nih.gov/nuccore/PZ008508), PZ008509 (https://www.ncbi.nlm.nih.gov/nuccore/PZ008509), PZ008510 (https://www.ncbi.nlm.nih.gov/nuccore/PZ008510), PZ008511 (https://www.ncbi.nlm.nih.gov/nuccore/PZ008511), PZ008512 (https://www.ncbi.nlm.nih.gov/nuccore/PZ008512).
Sequences used to affiliate the fungal strains used in the ad hoc-designed microbial communities are available in GenBank under the following accession: PZ012040 (https://www.ncbi.nlm.nih.gov/nuccore/PZ012040), PZ012041 (https://www.ncbi.nlm.nih.gov/nuccore/PZ012041), PZ012042 (https://www.ncbi.nlm.nih.gov/nuccore/PZ012042), PZ012043 (https://www.ncbi.nlm.nih.gov/nuccore/PZ012043), PZ012044 (https://www.ncbi.nlm.nih.gov/nuccore/PZ012044), PZ012045 (https://www.ncbi.nlm.nih.gov/nuccore/PZ012045), PZ012046 (https://www.ncbi.nlm.nih.gov/nuccore/PZ012046), PZ012047 (https://www.ncbi.nlm.nih.gov/nuccore/PZ012047), PZ012048 (https://www.ncbi.nlm.nih.gov/nuccore/PZ012048), PZ012049 (https://www.ncbi.nlm.nih.gov/nuccore/PZ012049), PZ012050 (https://www.ncbi.nlm.nih.gov/nuccore/PZ012050), PZ012051 (https://www.ncbi.nlm.nih.gov/nuccore/PZ012051), PZ012052 (https://www.ncbi.nlm.nih.gov/nuccore/PZ012052), PZ012053 (https://www.ncbi.nlm.nih.gov/nuccore/PZ012053).
Acknowledgements
The authors wish to thank the IGEPP greenhouse facility team, especially Frédérique Le Tertre for their kind support and help. A particular thank to Karima Bouchek from the Inov3PT, for providing the R5 R. solani strain used in our study. We also thank Mark Hurst for his suggestions to improve the text.
References
- 1.
Cordovez V, Dini-Andreote F, Carrión VJ, et al.:
Ecology and evolution of plant microbiomes.
Ann. Rev. Microbiol.
2019; 73: 69–88. Publisher Full Text
- 2.
Russ D, Fitzpatrick CR, Teixeira PJPL, et al.:
Deep discovery informs difficult deployment in plant microbiome science.
Cell.
2023; 186: 4496–4513. Publisher Full Text
- 3.
Sanahuja G, Banakar R, Twyman RM, et al.:
Bacillus thuringiensis: a century of research, development and commercial applications.
Plant Biotechnol. J.
2011; 9: 283–300. Publisher Full Text
- 4.
Jurburg SD, Eisenhauer N, Buscot F, et al.:
Potential of microbiome-based solutions for agrifood systems.
Nat. Food.
2022; 3: 557–560. PubMed Abstract
| Publisher Full Text
- 5.
Copeland C, Schulze-Lefert P, Ma K-W:
Potential and challenges for application of microbiomes in agriculture.
Plant Cell.
2025; 37: koaf185. PubMed Abstract
| Publisher Full Text
| Free Full Text
- 6.
Nunes PSO, Lacerda-Junior GV, Mascarin GM, et al.:
Microbial consortia of biological products: Do they have a future?.
Biol. Control.
2024; 188: 105439. 1049-9644. Publisher Full Text
- 7.
Baedke J, Fábregas-Tejeda A, Nieves Delgado A:
The holobiont concept before Margulis.
J. Exp. Zool. B Mol. Dev. Evol.
2020; 334: 149–155. Publisher Full Text
- 8.
Zhang J, Liu W, Bu J, et al.:
Host genetics regulate the plant microbiome.
Curr. Opin. Microbiol.
2023; 72: 102268. Publisher Full Text
- 9.
Trivedi P, Leach JE, Tringe SG, et al.:
Plant-microbiome interactions: from community assembly to plant health.
Nat. Rev. Microbiol.
2020; 18: 607–621. Publisher Full Text
- 10.
Ramos C, Calus M, Schokker D:
Persistence of functional microbiota composition across generations.
Sci. Rep.
2021; 11: 19007. Publisher Full Text
- 11.
Weckwerth W, Chaturvedi P, Ghatak A, et al.:
Natural variation of the holobiont for sustainable agroecosystems.
Trends Plant Sci.
2025; 30: 972–979. Publisher Full Text
- 12.
Wendell DL, Pickard D:
Teaching human genetics with mustard: rapid cycling Brassica rapa (fast plants type) as a model for human genetics in the classroom laboratory.
CBE Life Sci. Educ.
2007; 6: 179–185. PubMed Abstract
| Publisher Full Text
| Free Full Text
- 13.
Ajayi-Oyetunde OO, Everhart SE, Brown PJ, et al.:
Genetic structure of Rhizoctonia solani AG-2-2IIIB from soybean in Illinois, Ohio, and Ontario.
Phytopathology.
2019; 109: 2132–2141. PubMed Abstract
| Publisher Full Text
- 14.
Bartoli C, Roux F:
Genome-Wide association studies in plant pathosystems: toward an ecological genomics approach.
Front. Plant Sci.
2017; 8(8): 763. PubMed Abstract
| Publisher Full Text
| Free Full Text
- 15.
Williams PH, Hill CB:
Rapid-cycling populations of brassica.
Science.
1986; 232: 1385–1389. PubMed Abstract
| Publisher Full Text
- 16.
Conner AJ, Jacobs JM:
Defining the use of MS medium in plant science research.
Plant Cell Tissue Organ Cult.
2025; 162: 69. Publisher Full Text
- 17.
Gilligan CA, Bailey DJ:
Components of pathozone behaviour.
New Phytol.
2008; 136: 343–358. Publisher Full Text
- 18.
Jayaweera DP, Ray RV:
Yield loss and integrated disease control of Rhizoctonia solani AG2-1 using seed treatment and sowing rate of oilseed rape.
Plant Dis.
2023; 107: 1159–1165. PubMed Abstract
| Publisher Full Text
- 19.
Kataria HR, Verma PR:
Rhizoctonia solani damping-off and root rot in oilseed rape and canola.
Crop Prot.
1992; 11: 8–13. Publisher Full Text
- 20.
Fiers M, Edel-Hermann V, Héraud C, et al.:
Genetic diversity of Rhizoctonia solani associated with potato tubers in France.
Mycologia.
2011; 103: 1230–1244. PubMed Abstract
| Publisher Full Text
- 21.
Hoagland DR, Arnon DI:
The water-culture method for growing plants without soil. Californa agricultural experiment station.
Circular.
1950; 347.
- 22.
Maillet L, Norest M, Kautsky A, et al.:
Plant genetic bases associated with microbiota descriptors shed light into a novel holobiont generalist genes theory.
Environ. Microbiol.
2025; 27: e70108. PubMed Abstract
| Publisher Full Text
| Free Full Text
- 23.
Harrigan WF, McCance ME:
Laboratory methods in microbiology.
London:
Academic Press;
1966. 19–20. Publisher Full Text
- 24.
Scognamiglio T, Zinchuk R, Gumpeni P, et al.:
Comparison of inhibitory mold agar to Sabouraud dextrose agar as a primary medium for isolation of fungi.
J. Clin. Microbiol.
2010; 48: 1924–1925. PubMed Abstract
| Publisher Full Text
| Free Full Text
- 25.
Alves P, de Souza Y , Schloter M, et al.:
Deterministic development of soil microbial communities in disturbed soils depends on microbial biomass of the bioinoculum.
Microb. Ecol.
2023; 86: 2882–2893. PubMed Abstract
| Publisher Full Text
| Free Full Text
- 26.
O’Brien PA, Webster NS, Miller DJ, et al.:
Host-microbe coevolution: applying evidence from model systems to complex marine invertebrate holobionts.
mBio.
2019; 10. Publisher Full Text
- 27.
Moran NA, Sloan DB:
The hologenome concept: helpful or hollow?
PLoS Biol.
2015; 13: e1002311. PubMed Abstract
| Publisher Full Text
| Free Full Text
- 28.
Douglas AE, Werren JH:
Holes in the hologenome: why host-microbe symbioses are not holobionts.
mBio.
2016; 7(7): e02099. PubMed Abstract
| Publisher Full Text
| Free Full Text
- 29.
Henry LP, Bruijning M, Forsberg SKG, et al.:
The microbiome extends host evolutionary potential.
Nat. Commun.
2021; 12(12): 5141. PubMed Abstract
| Publisher Full Text
| Free Full Text
- 30.
Bartoli C, Guillerm-Erckelboudt AY:
Exploring the holobiont concept through a plant evolutionary experiment study. 2025. https://www.europeandissemination.eu/article/exploring-the-holobiont-concept-through-a-plant-evolutionary-experiment-study/22830
- 31.
Wang M, Roux F, Bartoli C, et al.:
Two-way mixed-effects methods for joint association analysis using both host and pathogen genomes.
Proc. Natl. Acad. Sci. U. S. A.
2018; 115(24): E5440–E5449. PubMed Abstract
| Publisher Full Text
| Free Full Text
- 32.
Bartoli C:
Supplementary Data of the paper “A Novel method and model system to investigate plant–microbiome coevolution”. [Data set].
Open Reserch Europe. Zenodo.
2025. Publisher Full Text








