Introduction
Demand for practical, effective, and sustainable crop protection practices remains, due to concerns about the risks that high reliance on pesticides pose to the environment (Sharma et al., 2019), human health (Kim et al., 2017; Wilson & Tisdell, 2001), and non-target species (Mata et al., 2024; Matson et al., 1997; Storkey et al., 2012). Transition away from pesticide centric crop protection programmes requires the application of multiple approaches to avoid and/or reduce the impact of pathogens, weeds or invertebrate pests (hereafter ‘pests’), following the principles of Integrated Pest Management (IPM). Effective implementation of IPM requires a holistic approach, as promoted by IPMWORKS (a pan-EU network focussed on identifying and developing sustainable and practicable IPM solutions, Grant Agreement 101000339); combining interventions across farming landscapes over multiple seasons through a range of techniques.
Establishment of holistic IPM strategies on farm can be challenging, as effective combinations and trade-offs of selected approaches will be unique to individual farms, and may require substantial perceived and actual investment in terms of both finance and time (Finger et al., 2024). A European Court of Auditors report found that 27 of the 33 farmers they interviewed were both “familiar with IPM and that they applied the principles on their farms” (
European Court of Auditors 2020). A randomised sample of UK and Irish arable farmers surveyed in 2020 found that “all” farmers were carrying out some level of IPM activity, but only 6.7% of the farmers scored above 85 out of a possible 100 on their level of IPM output, as set out in the author’s marking criteria (Creissen et al., 2021). In an EU wide survey of farmers and advisors across the IPMWORKS network in 2022, farmers across sectors reported that implementing more advanced IPM approaches had no, or positive impacts on pest management and profitability (IPMworks, 2025). While some approaches required a period of training and experience before becoming effective, farmers across the network were positive about the overall impact that IPM had on their farm (IPMworks, 2025). In France the DEPHY network, established in 2009, has supported sustainable crop protection across different production systems (Ecophytopic, 2023). Analysis of changes over time in cropping systems, crop management, and pesticide use in 913 farms within the network showed that pesticide use decrease was associated with changes in cropping system, but that there also appears to be a reduction associated with being part of the network (Nandillon et al., 2024). This network effect is greatest on farms joining with a relatively high pesticide use, reducing over time as the farmers learn from their peers and from network resources (Fouillet et al., 2022; Nandillon et al., 2024). While such networks are effective in supporting transition away from excessive application of pesticides, they need to be implemented in tandem with national strategies and support to address both financial and social barriers. Several other drivers of IPM uptake have been identified, such as farm size and attitudes to crop advice (Creissen et al., 2021), along with farm type, source of agronomic advice, farmer age, and farmer level of education (Creissen & Meador, 2022).
Despite evidence that IPM is broadly understood and implemented in Europe - along with specific examples of low pesticide use associated with more advanced IPM strategies - quantifying the impact of IPM uptake has been challenging. IPM principles are rarely quantified in farm assessments; when the European Court of Auditors visited several countries for its work evaluating the EU Plant Protection Products Regulation (EC) No 1107/2009, inspections did not check IPM use. One of the key tenets of the ability for farmers to adopt IPM principles is the perceived risks of doing so (Finger et al., 2024). The economic viability of enacting IPM principles can be unclear, with the success and costs being dependent upon the region, selected crops, and seasonal pest pressure (Doonan, 2017; Finger et al., 2024). There may also be trade-offs where yield potential is affected by IPM approaches selected, though this is often mitigated by the reduced costs of purchasing less pesticides (Finger et al., 2024). IPM strategies also provide a framework for more environmentally friendly inputs to be adopted more effectively (Hatt & Osawa, 2019), though the variety and trust in cost-effective alternatives to pesticides remains limited (Deguine et al., 2021). Changes in costs is a key perceived risk to adopting IPM, both financially and in additional time required to carry out the work (Bjørnåvold et al., 2022), and the investment in knowledge and upskilling required to carry out IPM (Creissen & Meador, 2022). Tight profit margins and responsive nature of established crop protection practices has cultivated a tendency among farmers to cherry-pick IPM practices to solve acute problems on their farms, rather than establishing more holistic IPM strategies that address chronic issues (Wustenberghs, Wigboldus & Triste, 2025). This is compounded by development and validation of novel approaches to pest management focusing on the efficacy of individual tools, rather than the benefits of integrated strategies as a whole (Stenberg, 2017). Holistic IPM (
Figure 1) was defined and promoted by the IPMWORKS project across a network of demonstration hubs to facilitate collaborative innovation and prove the cost-effectiveness of IPM. Commitment to addressing the pillars of holistic IPM enables farmers to embed more preventative approaches to pest management; reducing the need for pesticides, and improving targeted management activities for applying treatments according to need. National support through agri-environment schemes can provide the financial resources needed to initiate and maintain central components of advancing, innovative, farm specific IPM strategies.
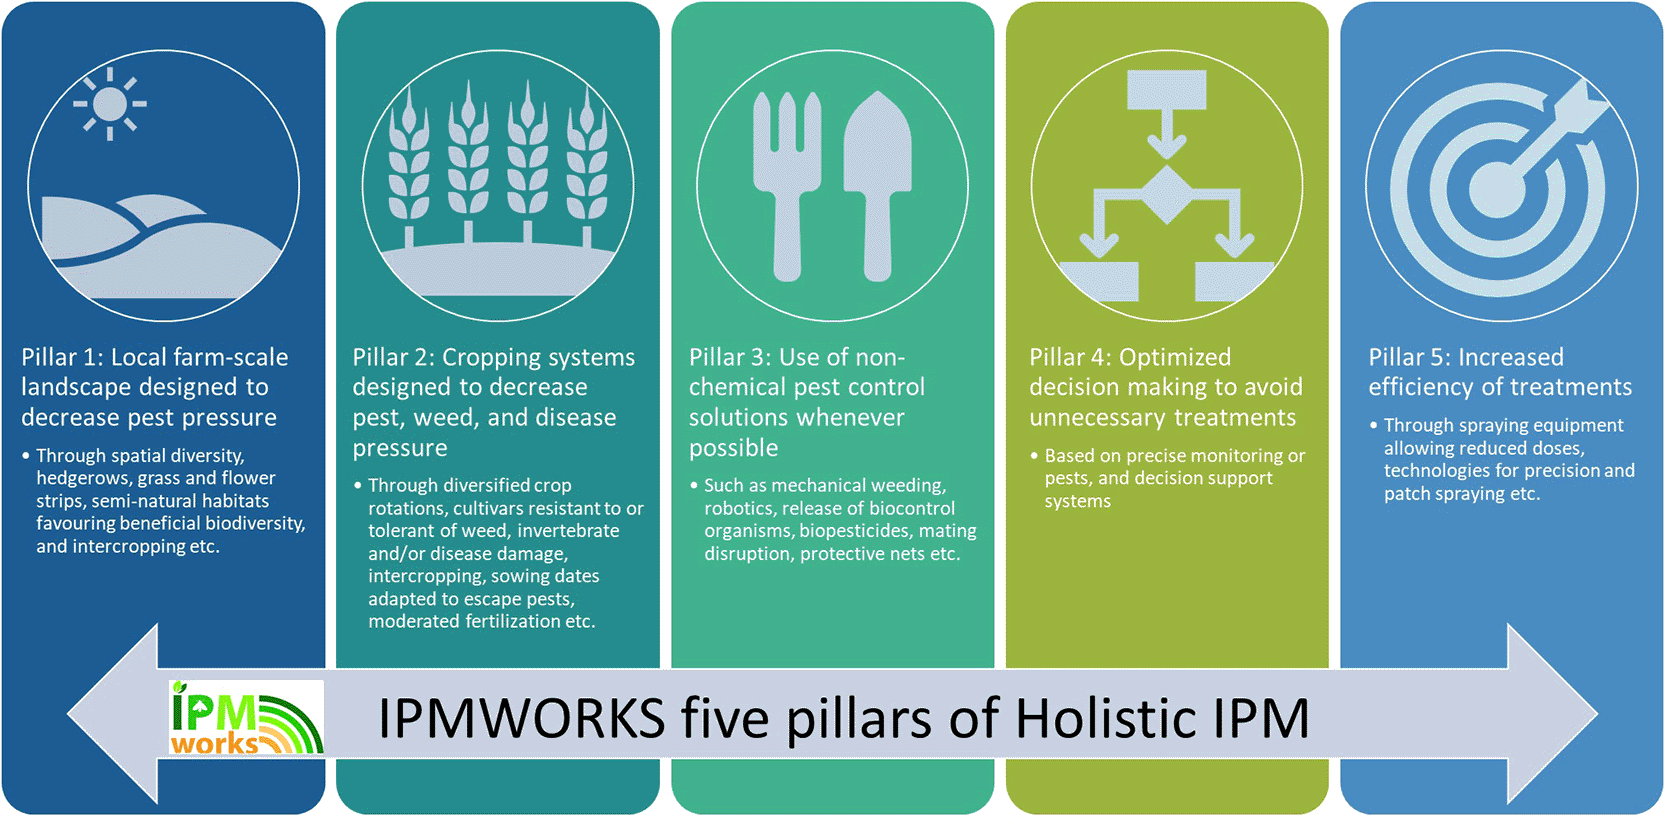
Figure 1. Summary of the five pillars of Holistic IPM, as developed by IPMWORKS, GA 101000339.
In the UK, the IPM Network (IPMnet) was established in 2023 as an open network to enable benchmarking of critical IPM metrics, and facilitate sharing of knowledge. IPMnet aims to improve the practical understanding and application of IPM for farmers, and inform policy design promoting IPM strategies. The network built on previous work in the UK and Europe, identifying barriers to effective, on-farm IPM planning (Walker et al., 2023), and collaborated with the AdvisoryNetPEST advisory network (Horizon Europe Grant number 101134122), which has a compatible pan-European approach to promoting sustainable crop protection practices. Within the IPMnet, and its sister network the Yield Enhancement Network (YEN; Sylvester-Bradley 2022), data has been collected from winter wheat (WW) and winter oilseed rape (WOSR) fields over a period of 10 years, detailing the agronomy and yield. Analysis of this data provides insight into the relationship between crop management inputs and performance and enables benchmarking of approaches for comparison in future studies. Here we present the results of the analysis of the relationship between crop agronomy, yield, and a partial cost-benefit analysis in WW fields in the UK spanning 8-years (2016–2024) from a total of 144 fields. The main aim of this work has been to provide baseline data on WW agronomy, to inform and promote future IPM initiatives. In this context, the data has been used to 1) provide benchmarks for pesticide use and crop yield, 2) identify IPM activities associated with herbicide, fungicide and insecticide use, and 3) identify any association(s) between IPM activities, pesticides use, and yield and/or profit margins.
Methods
Data collection
Field data was collected from two sources, IPMnet and YEN. Although the full dataset contained a broader diversity of crops, analysis focused on WW fields due to insufficient data in other crop types. During the 2023–2024 season, farmers joined the IPMnet and formed a pilot IPMnet Hub, providing agronomy details and yield for representative fields on their farm. Of the IPMnet entries received, 19 WW fields from 2024 were included in analysis. This data was combined with similar data collected from farmers during the YEN activities between 2016 and 2024, as part of an annual yield competition. For IPMnet data, a member journal was created to capture information about a grower’s field, based on the YEN entry forms (Ramsden, Bradfield & Knapp, 2025). This was completed by the farmer, in some cases with input from their advisor. Field information included field location, intended harvest area, yield, crop type, cultivar, sowing date, seed rate, previous cropping, soil type, cultivation strategy, history of catch crops, cover crops, grass or leys. Growers and agronomists were asked to provide agronomic information such as fertiliser applications (amounts and type applied), seed treatments used, and pesticides applied (product name, dose and in some cases the date or timing), as well as amounts spent on crop protection products. Some growers also stated molluscicides, plant growth regulators (PGRs), adjuvants, biostimulants and other products applied, this was not included in analysed.
The YEN database collected information on growers’ farming practices between 2010–2025. The YEN database includes field information asked in the IPMnet journals as well as additional data on metrics that influence yield. The focus of YEN is on yield and nutrition, so the YEN data does not include information on involvement in agri-environment schemes or the use of pesticides. However, many growers did state pesticide application information which has been used to calculate treatment frequency indices. Numerous YEN groups have been established for different crops (e.g. Cereal YEN, Oilseed YEN, Pea YEN); of the Cereal YEN entries received, 125 WW fields from 2016–2024 were included in analysis. This amounted to a combined total of 144 field data entries from IPMnet and YEN combined, spanning 8-years. Data received from each farmer was occasionally incomplete for certain variables, such as crop protection spend. Sample sizes therefore differed for each analysis, as given in the relevant methodology and figure legends.
Calculation of treatment frequency index
Pesticide usage data supplied by participating farmers was used to calculate Treatment Frequency Index (TFI) as a comparative measure of pesticide use, both overall and separated by herbicide, insecticide and fungicide. Maximum individual dose rates for each product in the year of application were obtained using the Pesticides Register (HSE, 2025). Where a product was no longer registered (as was often the case for products in historical YEN entries), expired notices were used. If there were no expired notices available, products were searched using Google and Agrobase (Agrobase, 2025) to determine the maximum individual dose at the time the grower applied the product. For some products, the maximum individual dose rate differs depending on growth stage or timing applied; the correct maximum dose was determined based on the date of application and/or descriptive notes provided by the farmer/advisor. Where it was not possible to identify the specific product applied, the data entry was excluded.
Total Treatment Frequency Index (TFI) for each field in each year was determined by calculating the proportion of the full label rate that each pesticide product was used at and summing the result for each field in each year, as shown in
Equation 1.
(1)
Partial cost-benefit analysis
To consider the economic costs and benefits associated with the fields in the study, two metrics were included; 1) the value of the crop, based on the value of grain in the given harvest year (£/t) and yield (t/ha), and 2) the amount spent on crop protection, provided by the farmer. Yield data was available for 125 WW fields and crop protection spend was available for 74 fields. Only fields for which yield data, crop spend and TFI were all available were used for the partial cost benefit analysis (n = 84). The value of WW fluctuated over the study period, an average price of £167 £/t was used across all years. Margin after crop protection spend was calculated using equation 2. This calculation does not include the cost of non-chemical management practices that may have been applied to the crop, or the cost of application of products, and so only provides a measure of margin over crop protection product costs as provided by the farmer.
(2)
Units: Yield = tonnes per hectare | Grain value = £ per tonne | Crop protection spend = £ per hectare.
Statistical analysis
Linear Mixed Effects Models (LMMs) were used to explore the relative importance of management actions for changes in herbicide, fungicide and insecticide TFI, as well as overall yield and margin after crop protection spend. These models have a high degree of statistical power and allow the inclusion of multiple predictors (fixed effects) and grouping factors (random effects) alongside one another and are therefore suitable for analysis of uneven data availability (Pinheiro & Bates, 2010). Fixed effects were selected as those factors expected to directly impact TFI/yield, such as variety selection, while random effects are grouping factors that are likely to influence the variation around the mean, such as whether the data came from the YEN or IPMnet networks.
LMMs for each response variable (TFI, yield, and profit margin) were fitted in R (R Core Team, 2025) using the package
lme4,
(Bates, 2015) starting from a full model containing all selected fixed effects. Details of all LMMs are given in
Table 1. Model simplification was performed using the package lmerTest (Kuznetsova et al., 2017) by iteratively removing non-significant fixed effects based on p-values obtained through Satterthwaite-approximated t-tests. This was repeated until only predictors approaching statistical significance (i.e. p < 0.05) remained in each model, leaving the minimum adequate model (MAM). This method was chosen instead of AIC-based model comparison to avoid the loss of excessive data due to missing values in different predictors. Residuals for all models were examined and found to meet assumptions of normality and homogeneity of variance (Zuur et al., 2010). Predictors remaining in the MAM represent the most important factors in driving each response variable. For each response variable modelled, fixed effects remaining in MAMs were plotted for visualisation using the package ggplot2 (Wickham, 2016). For correlations, trend lines and R2 values were added to plots; Other than this, no further analyses were carried out for individual plots in addition to the LMMs.
Table 1. Summary of IPMnet and YEN data including N (number of entries for each variable), the minimum and maximum values, and the median.
| Variable | Number of fields | Minimum value | Median value | Maximum value |
|---|
| Overall TFI | 144 | 3.27 | 7.50 | 14.15 |
| Insecticide TFI | 105 | 0.00 | 1.00 | 4.91 |
| Herbicide TFI | 144 | 0.75 | 2.79 | 9.01 |
| Fungicide TFI | 144 | 1.51 | 3.96 | 8.74 |
| Yield (t/ha) | 124 | 6.1 | 10.9 | 16.6 |
| Margin (£/ha) | 84 | 1,115 | 1,845 | 2,295 |
| Crop Protection Spend (£/ha) | 140 | 8 | 30 | 110 |
Results
Descriptive statistics
Descriptive summaries of the agronomic and pesticide-use data from IPMnet and YEN participants are shown in
Figure 2 and
Table 1.
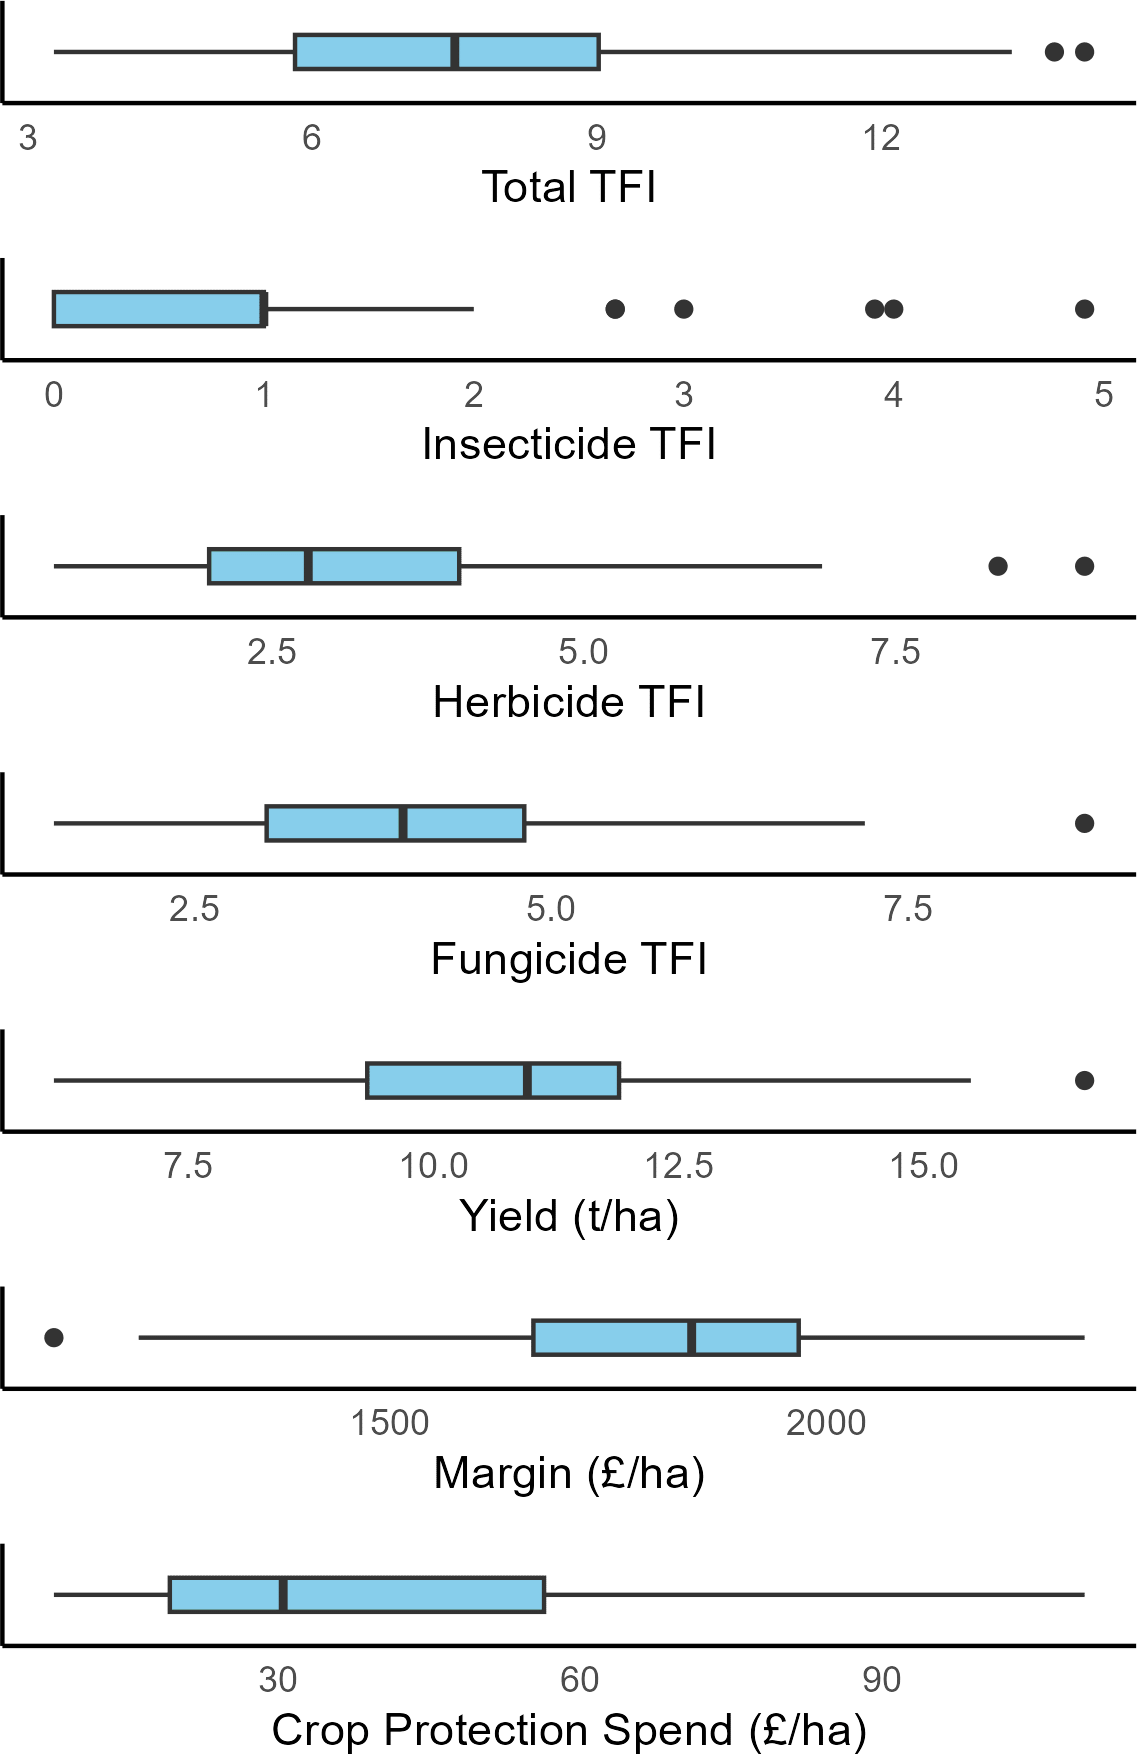
Figure 2. Boxplots showing the distribution of agronomic and pesticide-use variables in winter wheat from the IPMnet and YEN dataset.
Each box represents the interquartile range (IQR; 25th–75th percentile), with the horizontal line inside the box indicating the median value. The whiskers extend to the minimum and maximum values within 1.5 × IQR from the box, and individual points beyond this range (if present) represent outliers.
In the fields included in analysis, there was an average TFI of 7.5 (including insecticides, herbicides and fungicides, median overall TFI = 7.50, range = 3.27–14.15). Fungicides made up most of the overall pesticide treatment (median fungicide TFI = 3.96, range = 1.51–8.74), followed by herbicides (median herbicide TFI = 2.79, range = 0.75–9.01). Insecticide TFI was relatively lower and was not applied to all fields (median insecticide TFI = 1.00, range = 0.00–4.91).
Yield ranged from 6.13 t/ha to 16.64 t/ha in the fields included in this studied, with a median of 10.96 t/ha. Crop Protection spend varied from £8/ha to £110/ha,, with a median of £30/ha. After accounting for crop protection spend, profit margins also varied considerably, ranging from £1,1154/ha up to £2,295/ha, with a median of £1,845/ha.
Results of statistical analysis
Factors associated with herbicide treatments
Rotation score, cover crop use, resistance ratings (septoria, yellow rust and brown rust) and seed treatment use were included as fixed effects in the herbicide full LMM but subsequently removed during iterative model reductions. Cultivation method (plough VS non-plough) was identified as the only significant factor associated with variation in herbicide TFI (
Table 2). Inclusion of ploughing as part of field management was associated with reduced herbicide use (
Figure 3); LMM estimates show ploughing was associated with a 1.06-unit reduction in herbicide TFI compared with non-ploughing (estimate = −1.06 ± 0.28, p < 0.001) (
Table 2).
Table 2. Summary of response variables, random and fixed effects in full models and minimum adequate models (MAMs) from each linear mixed effects model (LMM).
Estimates, T-values and p-values are given for fixed effects remaining in MAMs. Estimates represent the predicted change in response variable for each unit change in fixed effects with standard error (SE).
| Model | Response variable | Random effects | Fixed effects (full model) | Fixed effects (MAM) | Estimate (SE) |
T-value
|
p-value
|
|---|
| 1 | Herbicide TFI | Data Source, Region, Year, Group | RS, PL, CC, SRR, YRR, BRR, ST | PL | −1.06 (0.28) | −3.76 | <0.001 |
| 2 | Fungicide TFI | Data Source, Region, Year, Group | RS, PL, CC, SD, SRR, YRR, BRR, ST | YRR | −0.14 (0.07) | −2.02 | <0.05 |
| SRR | −0.17 (0.12) | −1.39 | 0.17 |
| 3 | Insecticide TFI | Data Source, Region, Year, Group | RS, PL, CC, SD, SRR, YRR, BRR | CC | −0.92 (0.27) | −3.38 | <0.01 |
| 4 | Yield (t/ha) | Data Source, Region, Year, Group | RS, PL, CC, SD, SRR, YRR, BRR, ST, TTFI | TTFI | 0.15 (0.07) | 2.02 | <0.05 |
| 5 | Margin (£/ha) | Data Source, Region, Year, Group | TTFI | NA | NA | NA | NA |
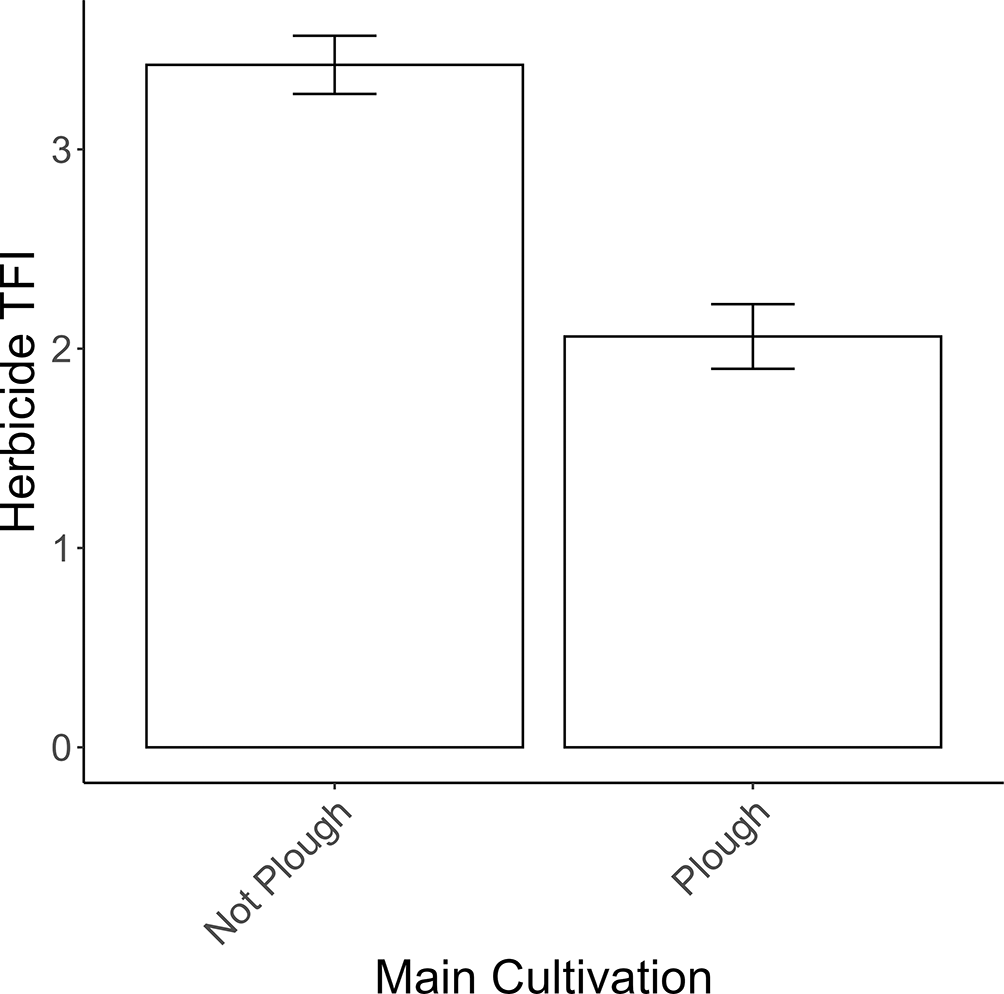
Figure 3. Mean herbicide treatment frequency index (TFI) in fields managed with plough versus no-plough cultivation.
Error bars denote standard error. N = 107, 36 for no-plough, plough respectively.
Factors associated with fungicide treatments
Rotation score, cultivation method, cover crop use, sow date, brown rust resistance rating and seed treatment were not identified as statistically important predictors of fungicide TFI, as these fixed effects were removed from the full model during iterative model reductions. Variation in fungicide TFI was best explained by varietal resistance ratings to yellow rust and septoria (
Table 2). Yellow rust resistance rating had a statistically significant effect, with higher yellow rust resistance ratings associated with lower fungicide TFI (estimate = −0.14 ± 0.07, p < 0.05). Higher septoria ratings were also associated with lower fungicide TFI (estimate = −0.17 ± 0.12, p = 0.17). Although this was not statistically significant at the level of p < 0.05, both yellow rust and septoria were retained in the simplified WW fungicide model (WW.Fun) due to their similar effect sizes (Estimates and T-values;
Table 2) and similar R2 values shown in
Figure 4.
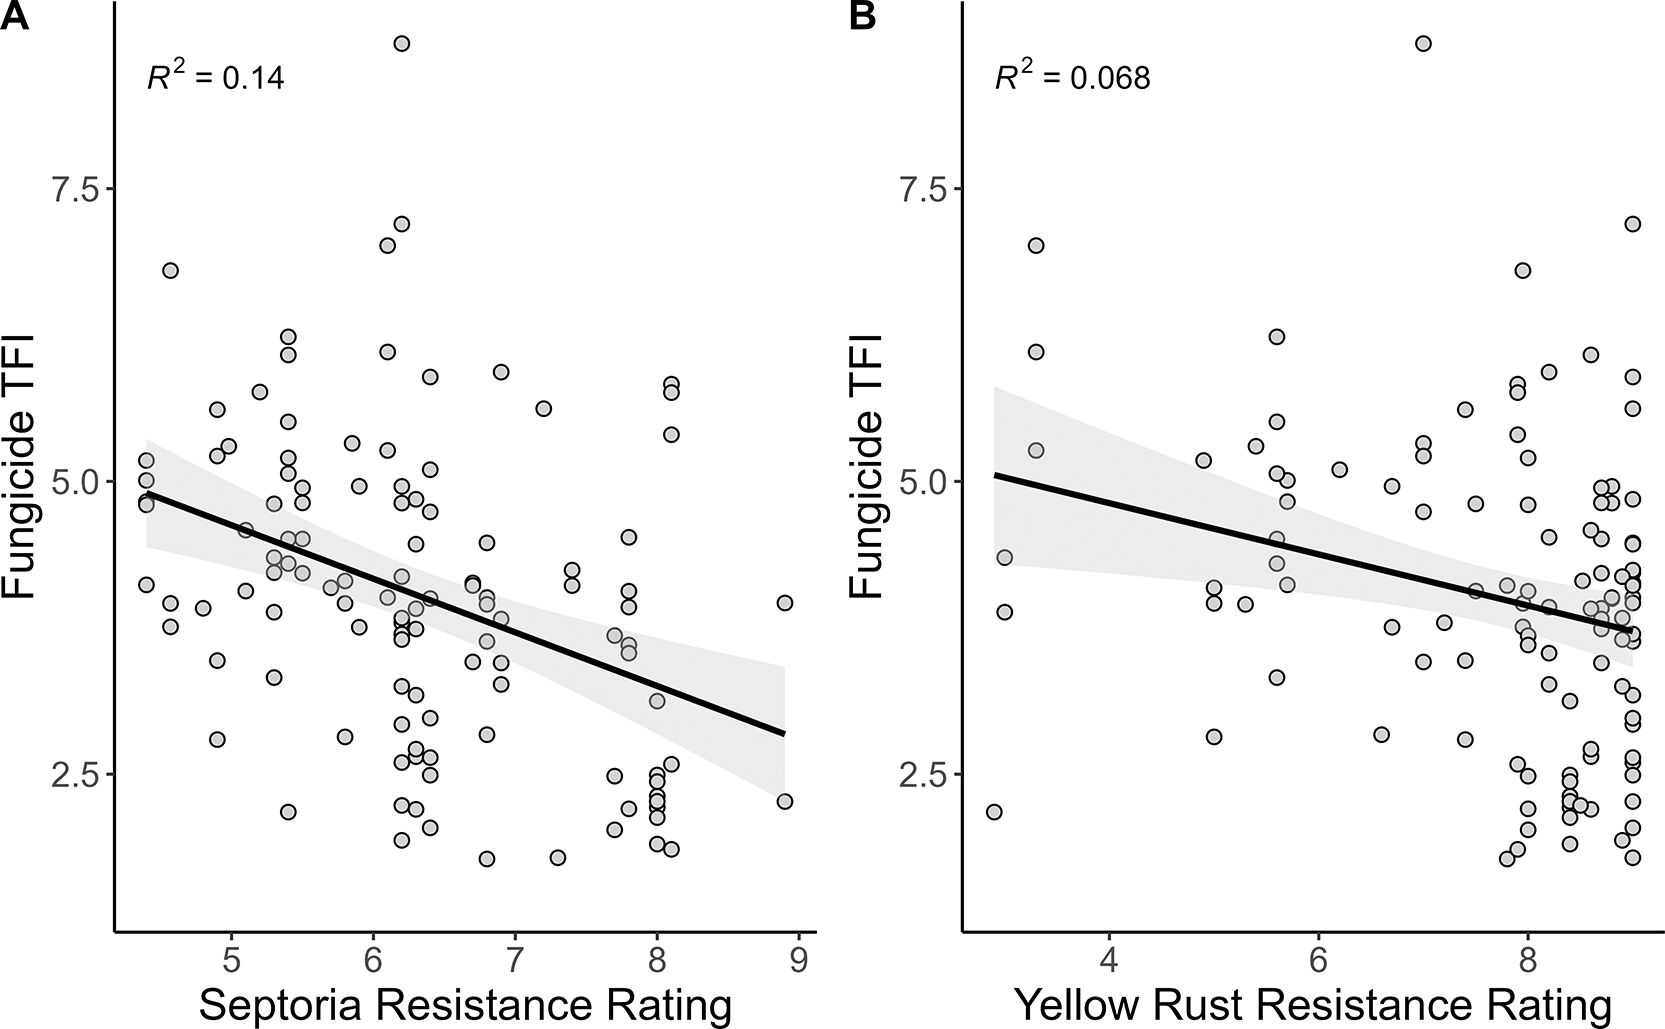
Figure 4. Relationship between fungicide treatment frequency index (TFI) and disease resistance ratings for A.
Septoria and B. Yellow Rust. Each point represents an individual field observation, with the fitted linear regression line (black) and 95% confidence interval (grey shading). N = 117 for both Septoria and Yellow Rust.
Factors associated with insecticide treatments
Rotation score, cultivation method, sow date and resistance rating (septoria, yellow rust and brown rust) were included in the full insecticide TFI model and subsequently removed during iterative model reductions, indicating limited importance for insecticide TFI. For insecticide TFI, the presence of a cover crop was the only factor identified as significant in explaining variation in insecticide TFI (
Table 2). The presence of a cover crop within the rotation was associated with a 0.92-unit reduction in insecticide TFI (estimate = −0.92 ± 0.27, p < 0.01), roughly equivalent to one full-rate insecticide spray per year (
Figure 5).
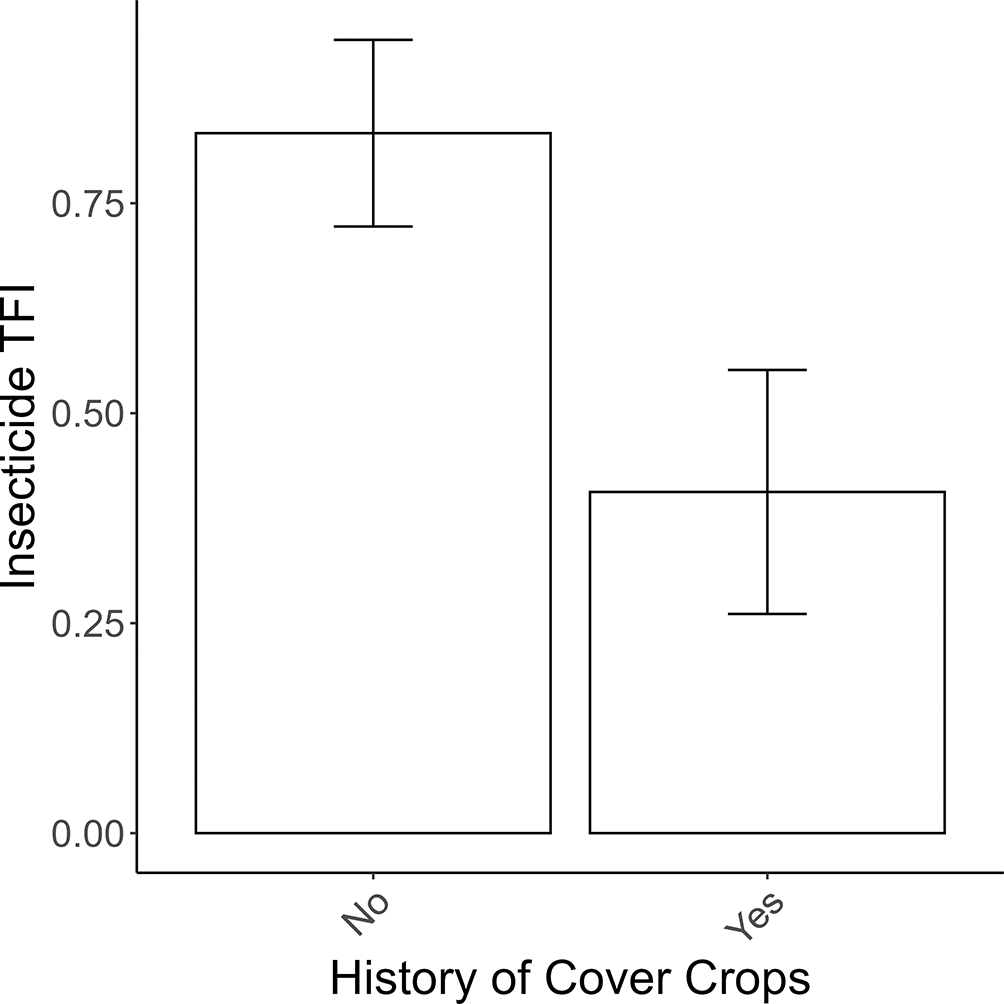
Figure 5. Mean insecticide treatment frequency index (TFI) in fields managed with or without cover crops.
Error bars denote standard error. N = 74, 23 for ‘No’ and ‘Yes’ respectively.
Factors associated with yield and marginal cost
Overall TFI was found to be associated with total yield (
Table 2; estimate = 0.15 ± 0.07, p < 0.05), indicating that relatively higher pesticide input correlated with relatively higher yields. Other factors, such as rotation score, cultivation method, cover crop use, sow date, resistance rating (septoria, yellow rust and brown rust) and seed treatment use were all included as fixed effects in the full model and subsequently removed during iterative model reductions, indicating neither positive nor negative impacts of non-chemical control options on yield. Based on the linear regression plotted in
Figure 6A, yield increased by 0.095 t/ha per +1 TFI (95% CI: −0.060 to 0.250). This amounts to a predicted increase of approximately 1.03 t/ha in yield between the lowest TFI of 3.27 and highest TFI of 14.15.
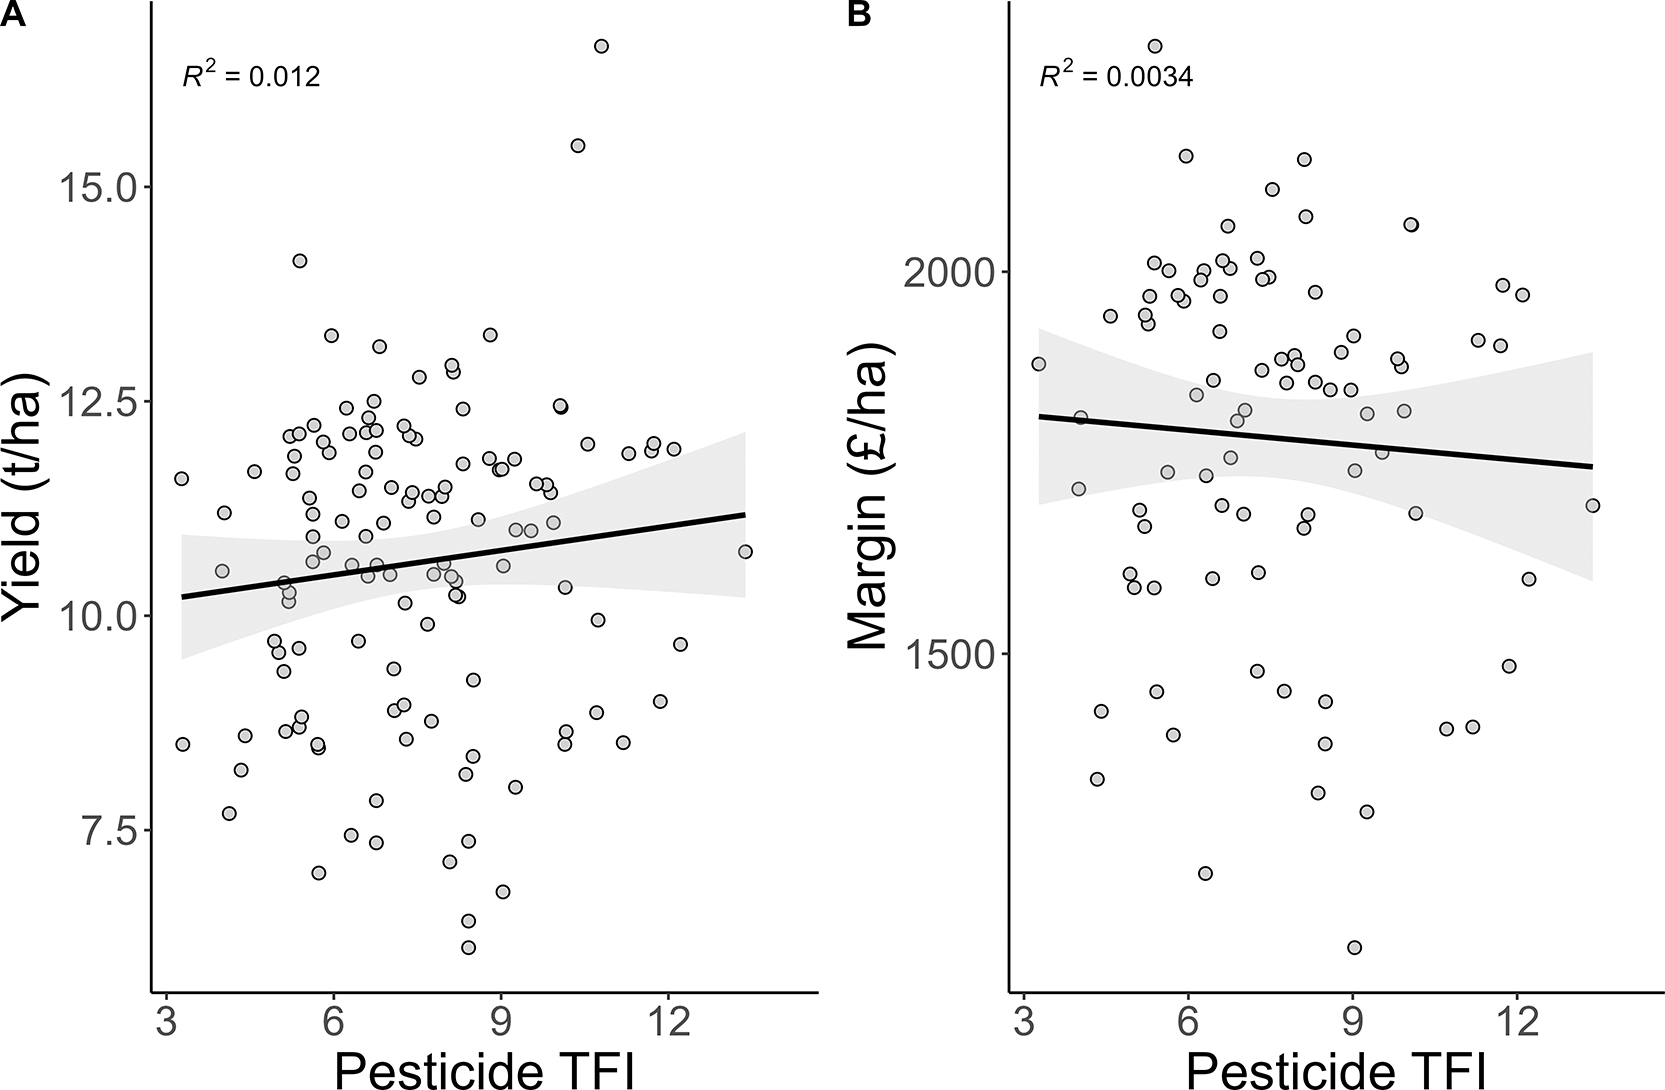
Figure 6. Relationship between overall pesticide treatment frequency index (TFI) with A. yield and B. profit margin after crop protection spend.
Each point represents an individual field observation, with fitted linear regression lines (black) and 95% confidence intervals (grey shading). N = 125, 84 for yield and margin respectively.
Despite overall TFI corresponding with higher yields, overall TFI was not a statistically significant predictor for margin after crop protection spend, indicating that increased pesticide inputs do not correspond with increased economic returns despite evidence of increased yields (
Table 2;
Figure 6B).
Discussion
This work was intended to describe the use of pesticides and selected IPM activities during the study period and identify any connections between practices and productivity/profitability. These data provide a benchmark for future assessment of alternative approaches to pest management. As part of that, data were analysed to identify any cultural practices that may be associated with variation in pesticide treatment frequency. Three factors were identified which correlate with changes in pesticide TFI; 1) inclusion of ploughing as part of field cultivations was associated with lower herbicide use, 2) crops with relatively higher disease resistance rating were associated with lower fungicide use, and 3) inclusion of cover crops within the rotation was associated with lower insecticide use. Further, analysis also identified that crops receiving relatively higher pesticide TFI were on average higher yielding but did not correlate with higher profit margins after the cost of crop protection products were accounted for. Since data was not available on the actual or perceived pest pressures in the fields assessed, it is not possible to make any assertion as to the efficacy of different IPM strategies across the fields included in this study.
Limitations and assumptions
Database size and participant bias
The 144 fields’ data was sourced from YEN and IPMnet members, both initiatives attracting farmers looking to proactively share, discuss and learn from data on crop management and productivity. The data is therefore biased towards farmers who are already highly motivated to achieve sustainable, high productivity approaches, and is not necessarily representative of all crop management across the UK. The median yield within this dataset of 10.9 t/ha, for example, is much higher than the overall UK average WW yield of around 8.3 t/ha over a similar period (Defra, 2025). This reflects the anticipated bias in farmers joining the two networks, and selection of fields that i) were successfully established, and ii) were selected by the farmer as ‘representative’ – not their best, but not their worst, but likely to be an evenly established crop in a field uncomplicated by in-field features such as historic low yielding patches. It is therefore likely that the sample does not include any fields that experiences especially high pest infestations that were not adequately managed using the agronomic approach detailed by the farmer. In this context, the data does not include fields in which one or more pest was not effectively managed. The data should be seen as an insight into crop management practices, yield and pesticide applications among farmers already likely to be practicing IPM.
Missing values
Farmers and/or their agronomists were self-reporting data, therefore omissions or ‘unknown’ responses were common. Omissions or unknown cases were treated as missing values and excluded from analyses, leading to smaller sample sizes for certain analyses. Sample sizes for each analysis are noted in corresponding figure legends. Missing values meant that it was not possible to model the importance of any management practices other than pesticide TFI on profit margins. Calculating profit margins required complete data for both yield and crop protection spend in each field. Due to the number of missing values, only 65 fields could be included in this analysis. This subset of fields did not have sufficient variation in management practices to model their impacts as was carried out for other response variables (
Table 2).
Disease resistance
Where participants shared the WW variety sown, data from the AHDB Recommended Lists for cereals and oilseeds (RL) was used to retrieve disease resistance ratings (AHDB, 2025a). In the RL, varietal disease resistance ratings are published on a 1–9 scale for several key diseases, where 1 indicates low resistance and 9 indicates high resistance. Ratings are usually calculated from historic averages of severity data across years, however when resistant genes are overcome and resistance breaks down, the rating may be calculated from a single year’s data to inform farmers of the current situation (AHDB, 2025a). Varieties with ratings of 4 or less can be interpreted as susceptible, varieties with ratings of 8 or 9 can be said to have high resistance. Disease ratings for septoria are reported to one decimal place whereas other disease resistance ratings are rounded to the nearest whole number. Where available, historic varietal resistance ratings for brown rust, yellow rust and septoria in WW were retrieved from publicly available RL data from the year each entry was completed, as varietal resistance rating may change between years (AHDB, 2025a). Data is not available on the actual occurrence of diseases on the fields in this study, so it is not possible to understand whether varietal resistance reduced disease pressure. Varietal resistance may change over time, and so for each variety the rating used for analysis was the rating for the year in which the variety was grown in a given field.
Use of Treatment Frequency Index as a metric for pesticide use
TFI provides a simple metric for comparing relative quantities of pesticide applied in different fields, frequently used as an indicator of relative reliance on pesticide use (Brunet et al., 2008; Lechenet et al., 2017). TFI is not an indicator of environmental impact or risk, but rather an indicator of pesticide reliance; reporting on how frequently and intensively pesticides are used to solve pest problems. It does not provide any information on amount or number of active ingredients (AIs) being applied, or the risks posed by those AIs to people or the environment. In addition, advice differs for pesticide use against diseases, weeds or invertebrate pests with respect of pesticide resistance management. For example, current advice for insecticide resistance management is to use the label rate (IRAC Group 30 Task Team, 2022), whereas advice for fungicide use, where mixtures of different modes of action are more widely applied, reduced dose rate may be appropriate (Corkley et al., 2022; Van den Bosch et al., 2011). Analysis to assess such risks requires a mode advanced indicator, such as a Pesticide Load Indicator (PLI) for use in Denmark (Kudsk et al., 2018), and the UK (Rainford et al., 2023) which use the active ingredients of pesticide products to indicate risk for human health, ecotoxicology and environmental fate. While sufficient data has been collected to calculate PLI for the fields included in this study, it was beyond the scope of this work to undertake this analysis. Despite the limitations of using TFI as an IPM metric, it remains useful in understand the relative frequency and scale of applications across the dataset, and in identifying any potential correlations with other agronomic activities. For a farmer or agronomist, TFI also provides a clear measure of inputs that can be benchmarked against other approaches; the details of product selection and how this may drive TFI can be investigated as part of a wider discussion and review.
Non-chemical approaches associated with reduce pesticide use
Integration of non-chemical approaches that reduced the potential impact of pest infestation is a crucial component of IPM. These have two potential routes to influencing pesticide application decisions. Where non-chemical approaches are effective and target pests are monitored, pests are less likely to exceed economic thresholds and so fewer applications are made. Economic thresholds are not available for all WW pests in the UK, but integration of non-chemical approaches can also influence pesticide application decisions by giving the farmer and their advisors a greater degree of confidence in the crop’s capacity to tolerate potential infestations. In this case, this may enable decisions to be made to apply fewer applications, or lower doses, where the risk of damage is perceived as lower, or the impact of non-chemical approaches is considered sufficient. Five established non-chemical approaches were assessed; cropping history, cultivation strategy, use of cover crops, varietal disease resistance, and seed treatment. As almost all fields included similar seed treatments, it was not possible to investigate the potential associated between seed treatments and pesticide applications in this study.
Non-chemical approaches associated with herbicide use
The only non-chemical approach associated with significant variation in herbicide application was the inclusion of ploughing as part of field cultivations at the beginning of the season. By inverting the soil through ploughing, 95% of freshly shed weed seed, as well as crop residues, are buried; however, it also returns up to 35% of old seed to the soil surface (Devictor et al., 2006). Most weeds germinate from seeds shed in the previous seasons, and so ploughing generally reduces weed populations. It is most effective at reducing the seed bank of weed species with short-lived seed, such as barren brome and black-grass – key weed species for WW in the UK (Lutman et al., 2013). Increasing pressure from herbicide-resistant populations of these and other grass weeds means rotational ploughing remains an important tool for farmers in the UK (Lutman et al., 2013). As repeated ploughing over consecutive years cause older weed seeds to resurface – including species with a relatively long weed-seed longevity – ploughing should form part of a rotational IPM strategy, rather than being an annual activity.
Non-chemical approaches associated with fungicide use
The incidence and the severity of cereal diseases is influenced by the interaction between pathogen, host and environment (Pokhrel, 2021). Disease pressure is affected by interactions between abiotic and biotic factors and may vary year to year and geographically within a certain year (Van den Bosch et al., In Press). Environmental conditions (such as temperature, amount and duration of rainfall and humidity) are a major influence on the virulence and spread of pathogens and determine crop phenology (Pokhrel, 2021). Fungicide programmes in WW are designed to combine both preventative (applied before disease infects the host) and curative treatments (applied after infection), and applied to protect dry matter source; upper leaves from Growth Stage (GS; AHDB, 2025b) 39 to flowering (to protect accumulation of carbohydrate stem reserves), and from flower to natural senescence (to protect dry matter accumulation during grain filling) (Beed et al., 2007; Milne et al., 2007; Paveley et al., 2007). In WW, which is source limited, any increase in the canopy size and duration will increase yield up to GS87 (Beed et al., 2007), however there is an optimal point at which the cost of inputs required to further improve canopy size/duration exceed the return from yield improvement (Paveley et al., 2007).
The disease incidence and severity in a host crop also depends on its varietal resistance or tolerance to the diseases it is exposed to (AHDB, 2025a). In the 144 fields in this study, the only IPM approach significantly associated with reduced pesticide input was in crops with a relatively higher resistance rating against two important cereal diseases; septoria (Zymoseptoria tritici) and yellow rust (Puccinia striiformis). As data is not available on the incidence and severity of yellow rust and septoria on the fields in this study, it is not possible to determine the disease pressure at the treatment application timings or whether fungicides were applied preventatively or curatively. It is also not possible to distinguish between actual and perceived benefits of varietal resistance. However, it does appear that selection of high resistance rated varieties was associated with decisions to implement relatively lower input fungicide programmes. This is either because during the season, these crops were observed to exhibited fewer symptoms of disease, and/or the farmer was sufficiently confident in the disease rating to reduce inputs on that basis. Varietal resistance to yellow rust is usually based on single or major genes which increases the risk of varieties breaking down, whereas varieties that are resistant to septoria tend to have multi or minor gene resistance meaning that several genes provide resistance. This means that yellow rust resistance can break down rapidly (as observed in 2025 with the major yellow rust resistance gene, YR15 being overcome and many varieties losing at least one rating point; AHDB, 2025a). This highlights the importance of monitoring crops throughout the season, particularly for yellow rust.
Non-chemical approaches associated with insecticide use
While there are several invertebrate pests of WW, the main drivers of insecticide use would be in the management of aphids. These can act either as direct pests causing damage during grain filling in the summer, or as vectors of yellow dwarf disease, resulting from infection by barley/cereal yellow dwarf viruses. In this study, all insecticide treatments were applied in the autumn, indicating targeting of aphids as disease vectors. The only IPM approach identified as associated with variation in insecticide TFI was inclusion of cover crops in the field history. Cover crops have been included in cropping systems for a range of reasons, largely relating to improving soil health and ecosystem functions such as improving soil fertility, structure, and organic matter, as well as reducing erosion and nutrient runoff (Adetunji et al., 2020). Cover crops can, depending on the plant species selected, also provide additional resources for beneficial insects, including natural enemies of crop pests such as aphids (Beaumelle et al., 2021; Bowers et al., 2021). Provision of such additional habitat for beneficial insects may influence decisions to apply fewer insecticides, either directly or indirectly. Cover crops may act directly in supporting natural enemies and so reduce the abundance of aphids in subsequent or neighbouring crops (Rowen et al., 2022). Where decisions to apply insecticides are based on field observation, this would lead to reduced application frequency. Indirectly, inclusion of cover crops on farm may form part of a holistic approach to IPM, together with a wider commitment to reduce impacts on non-target biodiversity. The association between cover crops and lower insecticide use may therefore reflect a more strategic approach to promoting biodiversity on farm.
In all cases, non-chemical approaches do not directly correlate with an increase or reduction in yield.
Pesticide, yield, and profit margins in winter wheat in the UK
Higher yielding crops tended to receive relatively higher pesticide inputs, but when the cost of inputs was included in the cost-benefit analysis, higher yielding crops with higher inputs were no more profitable than lower yielding/input crops. Increasing pesticide inputs can only influence yield where pest injury would otherwise reduce the crop’s ability to capture light and/or form yield (Ramsden et al., 2017). As such, higher inputs can only contribute to increasing profit margins if the degree of yield protected is greater than the cost of the pesticides used. During the season, the decision on whether to apply pesticides is one of the most difficult for farmers and their advisors. The consultation of decision support systems (DSS) for IPM has great potential to improve application of pesticides according to need (Ramsden et al., 2025), but these can only complement, not replace, the experience and expertise of advisors, and must be applied in the context of individual farms (Akaka et al., 2024; Marinko et al., 2025). The established benefits of pesticide use in reducing the risk posed by pests of WW (especially in the UK where weather is a key driver of pest risk, and highly variable) make it difficult for farmers and advisors to reduce applications. In this study, the results support research showing the reducing returns associated with increasing inputs, albeit here in the absence of data on actual pest pressures, and there is evidence that preventative activities do drive lower inputs without compromising yield or profit.
Novel approaches to pest management
The Sustainable Use Directive (SUD; Directive 2009/128/EC) promoted the use of IPM principles and encouraged the development and integration of alternative approaches to reducing pesticide use (Helepciuc & Todor, 2021). Alternative approaches are broad in scope, can be preventative or curative, and include improvements in decision making around selection and application of pesticides used. The SUD also indirectly encourages the uptake of alternative approaches by promoting selection of “low-risk pesticides, as well as biopesticides and biocontrols”, however definitions of these remain inconsistent across Europe and between different projects and initiatives.
It is important that farmers have access to the right methods for reducing pesticide use, and alternative approaches also extend to improved targeting of pest management tactics, such as improved technology and machinery, application equipment, and decision support systems. Efficiencies in pesticide spraying can be made as part of “precision farming technologies” (Finger et al., 2024). Novel approaches to pest management are defined as alternative approaches taken within a cropping system that are proven to reduce pesticide inputs, and which are not yet widely adopted across a region or sector. An example of the developments in this area is through the latest precision sprayers. The sprayers, whether through the surveys and/or the applications, use “sensor cameras” to successfully distinguish between crops and weeds to allow for the most accurate spraying. It was said that this method can allow for a “50% reduction in the dose of herbicides used or applied compared to a conventional sprayer” (Szabó et al., 2022). In addition, the authors noted that experimentation with the emergence of drones could provide new avenues for application savings. However, there would need to be changes as to whether drones would be allowed to be used within each country, under the rules of aerial spraying. Whatever approach taken, the use of precision farming technology needs to be properly integrated into a farm’s holistic IPM strategy, to ensure that investments in new technology effectively contribute to the overall pest management approach.
The emergence of better equipment is recognised by farmers to “minimise impact” without having to make large changes to their practices (Bjørnåvold et al., 2022). A survey of winegrowers that were involved in the French DEPHY network found that 26% of the surveys said that the equipment chosen was “an important lever for pesticide reduction” (Fouillet et al., 2023). While farmers might recognise the use of better equipment, it might require resource investments to purchase the necessary equipment (Doonan, 2017; Fouillet et al., 2023). The resource required to target PPP application, particularly if farmers do not possess precision technology, was also found to have an impact on the number of labour hours needed to carry out changes to methods (Doonan, 2017). No novel approaches were identified in this study, however this may be due to the data collection method used, which did not include questions on novel approaches. Identifying such approaches would have relied on the farmers self-reporting beyond the scope of the default forms within the two networks.
Conclusions
Across the 144 winter wheat fields included in this study, no two pest management approaches were the same. Each field received bespoke agronomy reflecting individual context of the farmers experience and resources, the characteristics of the surrounding landscape, the pest pressures in that region/year, and the advice provided by their agronomist and wider support network. This work highlights the complexity of production systems, even within a single crop type, and the challenge of supporting implementation of IPM strategies across large areas of production experiencing different drivers and barriers to alternative and novel IPM approaches. It also shows that non-chemical approaches, as part of integrated strategies, appear to support reducing pesticide inputs without compromise productivity or margin.
Disclaimer
The views expressed in this article are those of the author(s). Publication in Open Research Europe does not imply endorsement of the European Commission or by the UK Department for Environment, Food and Rural Affairs.
Ethics and consent statement
This article summarizes results obtained in the IPMnet initiative. Ethical approval and consent were not required for this article. Permission was obtained from all farmers providing field data into the IPMnet database.









