Introduction
In recent years, the growing integration of digital technologies into political and administrative processes has transformed the ways in which citizens interact with public institutions and political actors. The wide repertoire of digital instruments used by public administrations, political parties or civil society organizations includes tools oriented to political participation.
Although online voting has been widely discussed and implemented in various contexts, its democratic significance remains contested. The relevance of online voting cannot be understood solely in technological terms. Rather, it raises broader questions about access to participation, inclusion, and representation in digital environments. Analysing who engages with these tools—and under what conditions—is therefore essential to assess their impact on democratic equality. Therefore, the importance of this study lies in examining the social and political determinants of online voting in non-electoral processes, contributing to the broader debate on whether digital participation tools can reduce or reproduce existing inequalities.
In this regard, Spain provides a particularly relevant context to explore this question. While it does not employ online voting in national elections, numerous political organizations and municipalities have adopted online participation mechanisms since the 15 M movement. This hybrid environment—where digital tools coexist with traditional participation—offers an ideal setting to analyze the democratic implications of online voting from a demand-side perspective. The Spanish case is also distinctive because of the proliferation of participatory platforms such as Decide Madrid and Decidim Barcelona, as well as the use of online voting in party primaries (Podemos). These experiences illustrate both the promise and the limitations of digital democracy in addressing participation inequalities.
In this paper we will study online voting in Spain. In this regard, we must clarify that in Spain, electoral processes currently take place exclusively in person at the physical ballot box. Therefore, our work will focus on online voting linked to citizen participation processes promoted by public institutions and experiences promoted by socio-political actors. In this context, and to improve the understanding of online voting from the demand side and from a citizen perspective, we will use a questionnaire from the National Institute of Statistics (INE, 2022). Thus, we will analyze several variables grouped into four main groups: digital experience, interest in political issues, socio-demographic characteristics and available resources. In this way, we will try to achieve the following study objectives:
• Determine the characteristics and profile of people who participate through online voting.
• To analyze the possible existence of participation gaps in online voting.
• Examine e-voting and digital participation from a demand-side perspective.
Literature review
At the international level, and in general terms, research and academic discussions have mostly revolved around the implementation of electronic voting systems oriented to the election of public representatives (Darmawan, 2021). In this regard, most of the published research has empirically focused on aspects such as trust (Fel, 2025; Farooq et al., 2024; Erb et al., 2023), security (Sherine et al., 2022), transparency (Rahul et al., 2025) or the legal framework (Licht et al., 2021) as determinants for the use of e-voting systems (Darmawan, 2021).
The second group of research related to electronic voting systems is linked to the analysis of the digitalization of political processes. In this case, participation mechanisms activated by political parties, social movements and civil society organizations have recently gained particular interest (Villaplana et al., 2025; González-Cacheda & Cancela, 2025; Sandri et al., 2024; Sánchez-Medero & Villaplana, 2024; Lisi & Luis, 2022). Finally, we should point out a third group of research, linked to processes that include electronic voting mechanisms in participatory democracy experiences, mostly in local spaces (Becerril-Viera, 2024; Cervantes-Perez, 2022; Pina et al., 2022).
Although these three approaches address different aspects, they share a common analysis from the institutional and technological supply side of online participation. Thus, the relationship between them is based on the analysis of the characteristics of digital mechanisms made available to citizens by public institutions and political and social organizations. In contrast, the aforementioned research ignores the fundamental elements that facilitate or hinder digital interaction from the citizen’s perspective.
Therefore, the literature review reveals a significant research gap. As Darmawan (2021) points out, there is a need for more studies that address this issue from a citizen perspective. This study aims to contribute to improving the level of knowledge from the aforementioned perspective by examining electronic voting and digital participation from a demand-side approach. To this end, we will focus on the profile and characteristics of citizens that may condition participation through online voting mechanisms.
Theoretical framework
In this section, we will attempt to define and delimit the main concepts that make up the theoretical model that articulates and structures the selected study variables. To this end, we will take into account the limitations associated with the dependent variable. In this way, we will distinguish between two concepts configured on the basis of similar and different properties: political participation and citizen participation. First, we must specify what we mean by political participation in this work. In this regard, it is inevitable to refer to the importance of context in the evolution of forms and repertoires of political participation. These have evolved in line with the changes and transformations that have taken place in the social, political, and technological spheres. Following the path of openness initiated by Barnes and Kaase (1979) through the classification between conventional and unconventional political participation, we will focus on a series of authors who address the idea of political participation from the 21st century onwards in a fully digital period. Before continuing to specify the characteristics of the multidimensional approach adopted (Gibson & Cantijoch, 2013), we must first present the basic definition on which our construction is based. To this end, we will draw on the definition developed by Torcal et al. (2006), according to which political participation involves the development of some type of action or activity led by citizens. Furthermore, the actions promoted are necessarily aimed at influencing or conditioning the behavior and decision-making of third parties. Finally, it should be noted that the activities will not be directed exclusively at public institutions, but will include any action that pursues a political result through the hierarchical modification of values within society. This last point is key when it comes to differentiating between the ideas of political and citizen participation, as we will see later. Based on the definition and multidimensional approach adopted, there would be room for forms of electoral political participation, expressed through voting or campaigning, and non-electoral forms such as participation in protests and demonstrations, signing petitions, voting in popular or party referendums, contact with political and institutional representatives, grassroots work in socio-political organizations not oriented toward electoral processes, consumer participation, or socio-political donations (Teocharis & Van Deth, 2018). Finally, we should note that the forms of participation mentioned above are articulated at different levels of commitment (George & Leidner, 2019).
Having outlined the properties, characteristics, and repertoires of the concept of political participation, we will now address the meaning of the idea of citizen participation. The first observation we must make concerns the entity that promotes and leads participatory processes. Given the plurality of actors who could potentially play a leading role in relation to the idea of political participation, in this case, the promoter will necessarily be a public institution. On the other hand, citizen participation will take place in the context of one of the phases of the public policy-making cycle (Kiss et al., 2022). Having made these two conceptual distinctions that separate the concepts of citizen participation and political participation, we must specify the characteristics that define the concept. First, according to Tapella (2021), we consider that citizen participation requires leadership and promotion by public and institutional authorities and the real participation of citizens. Based on these two premises, citizen participation has the capacity to incorporate the vision and values of citizens into the process of public policy-making and the management of social problems (Ianniello et al., 2019; Cernadas et al., 2017). Furthermore, we must refer to citizen participation as a space for communication and dialogue between citizens and institutions (Cernadas et al., 2017). Finally, to complete the definition, it is pertinent to note the similarities with the idea of political participation suggested in this paper. Thus, citizen participation, in addition to involving interaction and activity, has a multidimensional character expressed through various repertoires such as petitions, consultations, participatory budgets, or councils (Díaz-Aldret, 2017), characterized by a differential level of commitment (Kiss et al., 2022).
The growing digitization of political and civic participation has brought about a series of changes in the field of civic and political participation. In this regard, Kim and Hoewe (2023) argue that the emergence of the internet has brought about new forms of participation, characterized by savings in terms of time, effort, and financial resources compared to traditional forms of in-person participation. Thus, the structural nature of the network has modified certain aspects related to the variables of space and time, reducing the costs of participation and increasing its flexibility (López-Noguero et al., 2024). The result has been an increase in forms of participation that are ad hoc, selective, and individualized, defined by Bennett and Segerberg (2012) as connective action. In the same vein, Ruess et al. (2023) point out the changes and adaptations undergone by the concept of political participation as a result of the emergence of new forms of linked political action. Among the classifications aimed at clarifying the new online participatory repertoires, we should mention the work of Gibson and Cantijoch (2013). The authors distinguish nine participatory activities of an online and offline nature based on their passive or active nature. Active: voting, campaign activities linked to political parties, protest activities, contact, community actions, and political consumerism. Passive: reading news in the press, discussing and debating, and forms of expressive participation.
With regard to citizen participation processes, the last decade has seen a significant increase in digital tools designed to involve citizens in the public policy-making cycle. Governments at different levels1 have sought to take advantage of the aforementioned benefits that the internet offers in terms of time, space, and resources for citizen participation. As Royo et al. (2024) point out, this increase has been accompanied by the development of a growing market for e-participation platforms that allow citizens to propose, debate, vote, and decide how budgets are spent or contribute to legislation or the development and approval of strategic plans (Smith & Martín, 2021). The novelty of the platforms that have proliferated in recent years at the international level appears to be related to the comprehensive approach that brings together different functionalities and participatory tools in the same interface. Some examples analyzed in the academic literature are the open-source bidirectional application DECIDIM (Borge et al., 2022), CONSUL, used in 33 countries by 100 institutions and 90 million citizens (Secinaro et al., 2022; Planchuelo, 2018), and CITIZEN SPACE, used by more than 180 organizations (Royo et al., 2024).
In relation to our research, the application of digital devices and instruments to voting processes is of particular interest. As stated by Borge et al. (2024), there are different labels (e-voting, internet voting, digital voting, electronic voting, or online voting) and definitions developed by various institutions to refer to our subject of study. In any case, online voting involves the use of electronic or digital devices to cast votes in environments that may or may not be controlled (Borge et al., 2024)2. This will be the definition used in our work, regardless of the purpose and nature of the different voting processes. In this regard, we should point out that online voting can be used in traditional elections (Fel, 2025; Erb et al., 2023), in citizen participation processes, such as participatory budgeting or platforms such as DECIDIM (Borge et al., 2022), or in the context of the activities of civil society organizations or political parties under the label of political participation (Borge et al., 2024).
Digital mechanisms for political participation, such as online voting, have been characterized by some authors based on their potential for communication through the modification of space and time variables, facilitating ubiquity in communications between the different individual and collective actors that take part in political processes. This configuration would facilitate coordination, mobilization, and participation (Carson & Vromen, 2018). In addition, Valenzuela et al. (2018) and Gil de Zúñiga et al. (2012) point to the potential of the internet and social media to improve levels of social trust, reciprocity, commitment, and political participation. Similarly, various studies related to citizen participation point to the potential of digital tools to increase citizen participation beyond conventional elections. Increased participation and interaction between citizens and public administrations through systems such as online voting would increase the trust and legitimacy of institutions and governments (Asimakopoulos et al., 2025; Royo et al., 2024; Borge et al., 2024; Borge et al., 2022).
However, digital mechanisms and tools present a number of limitations to participation. Beyond the issues highlighted in the introductory section, which have dominated much of the academic debate surrounding online voting systems, we will focus on an idea that has been widely discussed in relation to digitization processes in general: the digital divide. To this end, we must define and narrow down the meaning of this concept. The concept of the digital divide refers to inequalities not only in access to information and communication technologies, but also in the ability to use them effectively. In this sense, it can be understood as the gap between those who benefit from the use of digital technologies and those who are relatively disadvantaged (Rogers, 2001). These disparities are closely linked to broader social inequalities, as factors such as age, education, income, and social position shape individuals’ opportunities for digital engagement (Van Dijk, 2017; Lythreatis et al., 2022). From this perspective, digital participation is unevenly distributed across social groups, potentially reinforcing existing patterns of exclusion. Research related to this concept usually looks at a series of variables and categories related to the personal and positional inequalities identified by Van Dijk (2017). These are: age, gender, ethnicity, security, health, job position, education, household, and nationality.
Although the research model outlined in this paper includes some of the variables identified by Van Dijk (2017) (see
Figure 1), the design goes further by including a greater number of variables that allow us to analyze the complexity of the subject matter more comprehensively. First, we consider the degree of experience and familiarity with the digital environment and the internet to be relevant. This variable appears to be related to a higher self-efficacy index, which is a key mediator for greater internet use in areas characterized by different levels of complexity (Bronstein, 2014; Malliari et al., 2012; Hammond et al., 2011). As Padilla-Carmona (2022) points out, experience and previous use of the internet is a relevant explanatory factor in understanding the differential levels of quantitative and qualitative use of digital tools. Therefore, we consider that the intensity and frequency of connection to the network could have a similar effect to that indicated, with hypothesis 1 (H1) remaining as follows:
H1.
Individuals with a higher level of internet connection frequency (daily use) will participate more intensely through online voting.
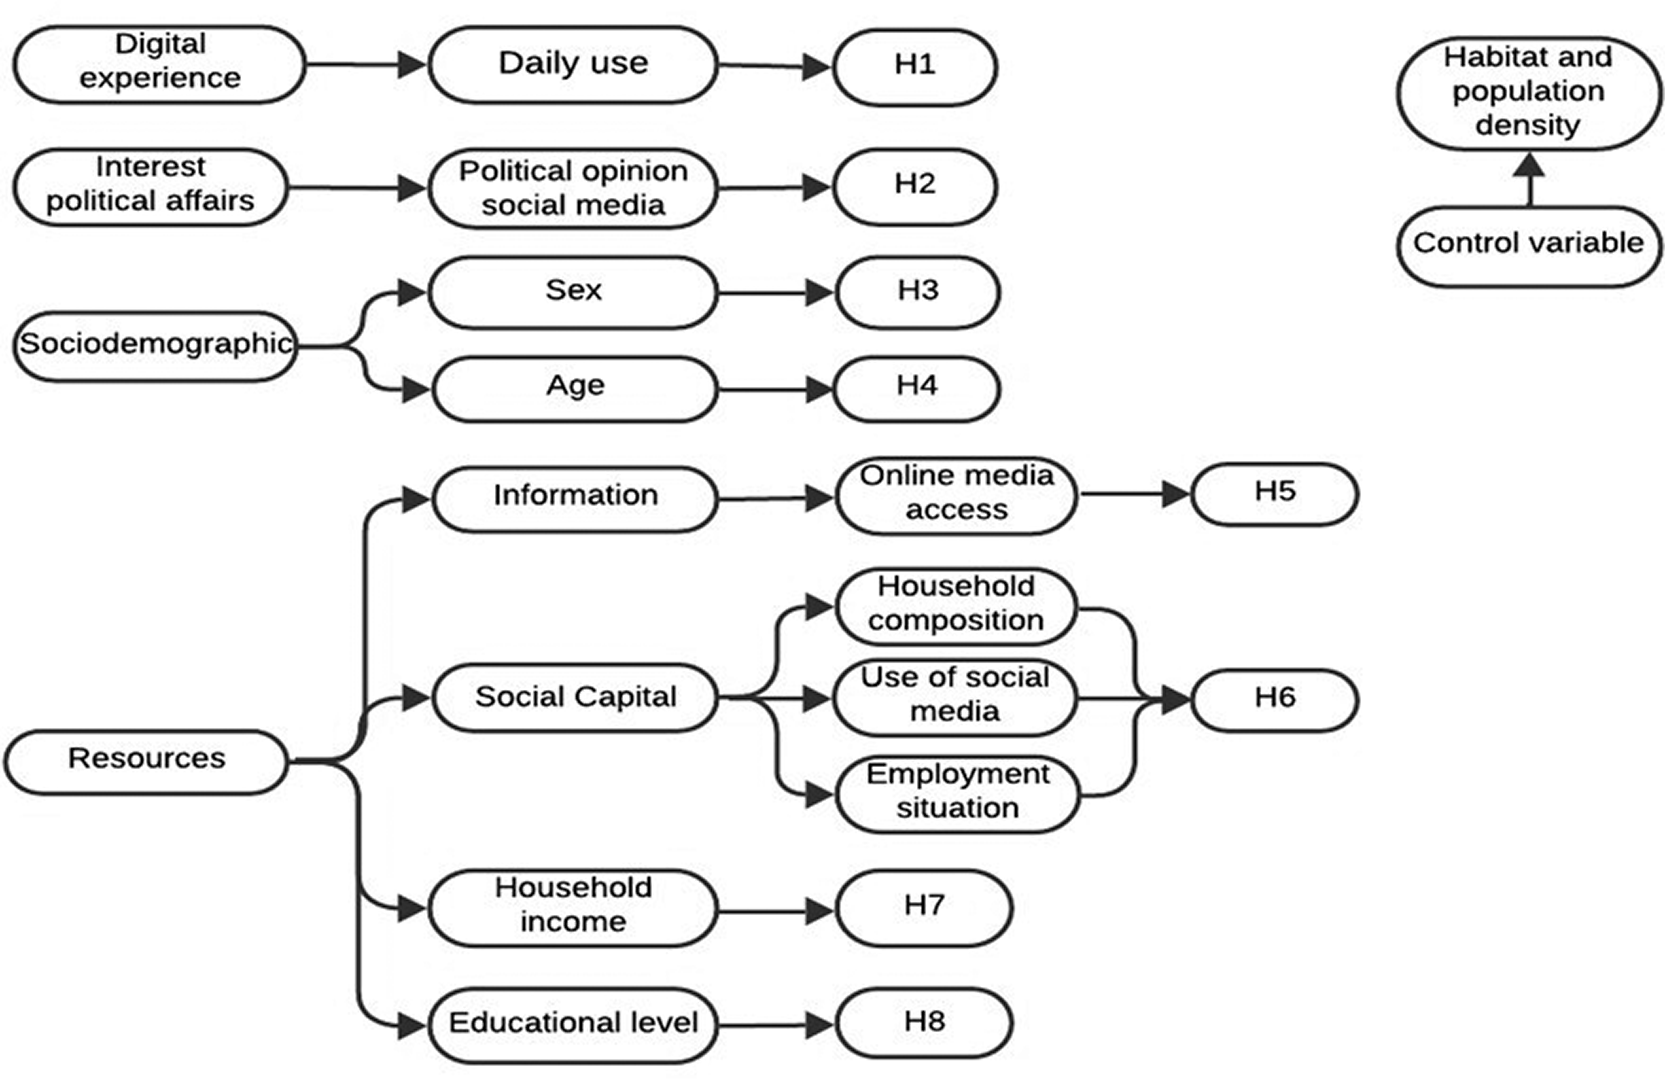
Figure 1. Concept map, variables and study hypothesis.
Own elaboration.
Secondly, we will focus on interest in political issues as a relevant factor for participation through online voting. In this regard, we must refer to the relevant work of Verba et al. (1995), which presents an explanatory model of participation based on three elements: a) the availability of resources; b) proximity to recruitment networks and socio-political organizations; c) interest in political and social issues. Regarding the latter issue, Holt et al. (2013) assert that interest in politics is a motivational prerequisite for participation. Similarly, Kim et al. (2023) point to the importance of psychological variables such as interest in understanding citizen engagement and participation. In relation to our model, we consider that the use of social media to express political ideas would be an indicator of interest in this type of issue, which would appear to be related to a greater propensity to participate through online voting.
H2.
Individuals who express political ideas through social media participate to a greater extent through online voting.
In relation to sociodemographic factors, we will first focus on the variable of gender. There is no consensus in the academic literature on the idea of the digital divide and its relationship to gender. According to Pérez-Amaral et al. (2021), there is no link between gender and the digital divide. On the contrary, McDonald and Wren (2017) warn of a lower level of digital skills among females. Similarly, Lythreatis et al. (2022) point to various studies that demonstrate the relationship between gender and the digital divide as a result of women having lower levels of self-efficacy than men when using digital and technological devices (Hoffmann & Lutz, 2019). With regard to the issue of participation levels, the debate remains open. However, there seems to be some consensus regarding qualitative differences in participation patterns based on gender (Heger & Hoffmann, 2021; Pfanzelt & Spies, 2019; Sartori et al., 2017). Thus, women would participate to a greater extent in activities related to consumer participation and connective action (Bennett & Segerberg, 2012), such as boycotts or signing petitions, forms of participation that are far from the visibility of the public space. The differences noted would have to do with the different amount of time available to men and women, and with socialization oriented toward the private sphere in the case of females (Heger & Hoffmann, 2021; Pfanzelt & Spies, 2019). Based on the literature reviewed and the nature and characteristics of online voting, we developed the following working hypothesis:
H3.
Gender is not a determining factor in explaining the different levels of participation through online voting.
The second variable related to sociodemographic characteristics that forms part of our model is age. In this case, there is academic consensus regarding the importance of age as a predictor when explaining individuals’ ability to access and use technological and digital devices (Lythreatis et al., 2022; Quinde et al., 2020). Furthermore, age is analyzed as a determinant that appears to be related to different patterns of behavior and participation. There is a high degree of consensus in the specific literature linking institutionalized political participation, i.e., that associated with electoral processes and political parties, to older age groups (Alarcón, 2021; Melo & Stockemer, 2014; Norris, 2003). In contrast, young people participate more intensely in the political process through unconventional participatory activities and actions, either individually or in connection with protest groups or social movements (Hoffmann & Lutz, 2019; Melo & Stockemer, 2014). Based on the arguments presented previously in the literature cited, it would be plausible to expect greater participation by younger age groups in online voting:
H4.
Individuals in the younger cohorts will participate more intensely through online voting.
As we have pointed out above, resources form part of the explanation for participation developed by Verba et al. (1995) and Brady et al. (1995). In our model, we have categorized resources into four items: information, social capital, income level, and educational level. With regard to the first category, and in accordance with Holt et al. (2013), we consider that regular access to information through online media will improve individuals’ levels of information and, with it, the probability of participating through processes that include online voting. On the other hand, access to this type of media would indicate a level of familiarity and digital skills compatible with participation through the aforementioned instrument:
H5.
People who obtain information through online media will participate to a greater extent through participatory forms such as online voting.
In relation to the idea of social capital, it should be noted, before delving into some of its elements, that it is determined by the level and nature of the social connections established (Bourdieu, 1986). Thus, individuals’ networks would be configured by different levels of social capital associated with their position and social class (Bourdieu, 1986). According to Spottswood and Wohn (2020), social capital appears to be associated with the availability of tangible resources such as money or access to various types of information. Access to technical and sociopolitical information is key to participation through online voting. In relation to the first issue, several studies link the availability of social connections with overcoming barriers to access and use of digital tools. In this way, connection with friends or family would emerge as a relevant element for the effective use of the internet (Díaz & Vidal-Alaball, 2022; Colombo et al., 2015). On the other hand, we consider that social capital linked to the establishment of connections related to household composition, participation in the labor market, or social networks will improve individuals’ levels of social and political information (Singh & Moody, 2022; Gil de Zúñiga et al., 2012). The consequence will be a higher level of participation through online voting.
H6.
People who belong to composite households, participate in the labor market, and use social networks will participate more intensely through online voting.
Continuing with the category of resources, related to the digital divide and participation, we will focus on household income levels. The scientific literature addressing the first issue points to the relevance of income and income level for the use of digital devices and the internet (Lythreatis et al., 2022; Ye et al., 2021). Regarding the link between participation and income level, we find conflicting indicators. Classical academic literature points to the relationship between levels of participation and income level (Verba et al., 1995; Brady et al., 1995). Similarly, subsequent research has pointed to the relevance of the income variable for participation through certain repertoires, such as monetary donations or consumer participation. Conversely, the income variable would not be decisive in explaining participation through repertoires that do not involve the use of money (Ritter & Solt, 2019; Schlozman et al., 2017). However, research on online participation indicates that this medium encourages engagement among people with lower incomes, probably as a result of the low cost of digital repertoires (Theocharis et al., 2019). In this scenario of contradictory results, hypothesis 7 will be as follows:
H7.
Household income does not determine significant differences in levels of participation through online voting.
Within the resource block, we cannot overlook the variable of educational level. On the one hand, as Aars and Christensen (2018) point out, education can equip individuals with greater cognitive capacity for processing information related to political issues and processes. On the other hand, educational level would be associated with a higher level of skills and self-efficacy in the digital and internet sphere (Lythreatis et al., 2022). Thus, various studies confirm the association between digital political participation and educational level (Van Deursen et al., 2017; Schlozman et al., 2010).
H8.
Individuals with a higher level of education will participate more intensely through online voting.
Finally, we have introduced the habitat category as a control variable in our model (see
Figure 1). According to
Pérez-Amaral et al. (2021), the type of habitat and population density appear to be related to the digital divide. This phenomenon could be due to a lack of infrastructure for internet access in less populated rural areas. On the other hand, the type of rural habitat appears to be associated with lower educational attainment, an older population, and lower digital skills. Thus, one would expect lower participation through online voting in rural areas with lower population density.
Data and method
Data source
This study draws on data from the 2024 Survey on Equipment and Use of Information and Communication Technologies in Households, conducted by the Spanish National Statistics Institute (INE) in accordance with Eurostat guidelines. The survey is designed to analyse patterns of internet use and digital interaction among the Spanish population. Data collection took place between April and June 2024 across the national territory, using a mixed-mode approach that combines online, telephone, and face-to-face interviews. The sample is based on a stratified multi-stage design, in which census sections, households, and individuals are sequentially selected. The final dataset includes responses from 16,478 households. (N = 16,478). This dataset has been previously applied in the study of digital inequality in administrative processes (González-Cacheda, 2025).
Study variables
Dependent variables
For the study and analysis of relative electronic voting we will use the variable Online voting. This is a categorical and dichotomous variable (yes: 1; no: 0) whose values reflect the proportion of individuals who have participated by voting through digital means.
Independent variables
The empirical model includes a set of explanatory variables capturing different dimensions of digital participation. These variables are organised into four main categories: digital experience, political interest, sociodemographic characteristics, and resources (the questions included in the survey regarding some of the study variables can be found in
Table 4).
In relation to the first concept, the dichotomous variable (yes: 1; no: 0) daily use appears, which collects information related to the frequency of internet use. Secondly, we will try to analyze interest in political issues through the dichotomous variable (yes: 1; no: 0) political opinion social media, which provides information on the possible participation of the interviewees through political opinions on social networks. In the third block, aimed at presenting sociodemographic information. Sociodemographic characteristics include sex (male = 1; female = 0) and age, measured as a continuous variable. For analytical purposes, age is also grouped into eight categories: 18–28 (1), 29–38 (2), 39–48 (3), 49–58 (4), 59–68 (5), 69–78 (6), 79–88 (7), and 89–98 (8). Next, we have organized the category resources through a subdivision articulated in four sections: information; social capital; household income; educational level. Thus, the dichotomous variable (yes: 1; no: 0) online media access is related to the first subcategory. Secondly, in relation to the properties of the concept of social capital, the dichotomous variables household composition (multiperson household: 1; one person household: 0), use of social media (yes: 1; no: 0) and the categorical variable employment situation (unemployed (0); employee (1); student (2); retired (3) appear). The third subcategory is associated with the variable household income, which reports the level of net monthly household income. This variable is structured in five levels: less than 900 (1), between 900 and 1599 (2), between 1600 and 2499 (3), between 2500 and 2999 (4) and 3000 or more (5). Finally, we find the fourth subcategory. This refers to the level of education attained. In this case, the data are arranged in nine categories (incomplete primary education (0); primary education (1); secondary education (1st stage) (2); secondary education (2nd stage) (3); non-higher post-secondary education (4); higher vocational training (5); university graduates (up to 240 credits) (6); university graduates (over 240 credits) (7); doctoral degree (8) (González-Cacheda, 2025).
Control Variable
To complete the analysis, we introduce a control variable in our model. The habitat and population density variable is organized into three different categories: (1) densely populated area; (2) intermediate density area; (3) thinly populated area.
Statistical analysis
The empirical analysis is structured in several stages combining descriptive and inferential techniques. First, descriptive statistics are presented in order to examine patterns of participation in online voting across the different explanatory variables, as well as the distribution of the control variable. In a second step, a logistic regression model is estimated to analyse the relationship between the explanatory variables and the dichotomous dependent variable. This approach allows us to assess the probability of participating in online voting as a function of the individual characteristics included in the model.
The results of the regression analysis are reported in terms of odds ratios, and statistical significance is evaluated at the 0.05 level. To complement these findings and facilitate interpretation, average marginal effects (AME) are also calculated. These estimates provide a more intuitive interpretation of the magnitude and direction of the relationships identified in the model. Finally, predicted probabilities are computed for the statistically significant variables in order to better illustrate the effects observed. All statistical analyses were carried out using Stata 15.1. All statistical analyses were performed with Stata 15.1 (StataCorp. LP, College Station, USA).
Results
In this section, we will present the main results of our research. First,
Table 1 shows various descriptive statistics related to the study variables. Second,
Table 2 summarizes the main findings and predictions resulting from the logistic regression analysis. Next, we will present
Table 3, which shows the average marginal effects of the logistic regression model. Finally, we will present several figures designed to visually illustrate the results associated with the statistically significant explanatory variables.
Table 1. Descriptive analysis of the study variables.
|
|
Online voting |
|---|
| DIGITAL EXPERIENCE | |
| Daily use | |
| -Yes | 14.24 |
| -No | 2.68 |
| INTEREST POLITICAL AFFAIRS | |
| Political opinion social media | |
| -Yes | 48.40 |
| -No | 6.76 |
| SOCIODEMOGRAPHIC | |
| Sex | |
| -Male | 13.60 |
| -Female | 13.24 |
| Age | |
| -Yes | |
| Mean | 47.13 |
| SD | 15.40 |
| -No | |
| Mean | 51.54 |
| SD | 16.75 |
| RESOURCES | |
| 1-Information | |
| Online media access | |
| -Yes | 16.54 |
| -No | 3.13 |
| 2-Social Capital | |
| Household composition | |
| -One person household | 13.52 |
| -Multiperson household | 13.37 |
| Use of social media | |
| -Yes | 18.77 |
| -No | 5.65 |
| Employment situation | |
| -Unemployed | 10.02 |
| -Employee | 16.13 |
| -Student | 12.89 |
| -Retired | 9.19 |
| 3-Household income | |
| -Less than 900 | 12.14 |
| -Between 900 and 1599 | 11.71 |
| -Between 1600 and 2499 | 11.67 |
| -Between 2500 and 2999 | 14.72 |
| −3000 or more | 15.14 |
| 4-Educational level | |
| -Incomplete primary education | 4.98 |
| -Primary Education | 5.13 |
| -Secondary education (1st stage) | 7.76 |
| -Secondary education (2nd stage) | 12.56 |
| -Non-higher post-secondary education | 22.22 |
| -Higher Vocational Training | 14.46 |
| -University graduates (up to 240 credits) | 17.63 |
| -University graduates (over 240 credits) | 22.54 |
| -Doctoral degree | 20.93 |
| CONTROL VARIABLE | |
| Habitat and population density | |
| -Densely populated area | 14.42 |
| -Intermediate density area | 12.26 |
| -Thinly populated are | 11.96 |
Table 2. Regression results.
|
Online voting |
|---|
| DIGITAL EXPERIENCE | |
| Daily use | 1.862** |
| (0.398) |
| INTEREST POLITICAL AFFAIRS | |
| Political opinion social media | 10.625*** |
| (0.660) |
| SOCIODEMOGRAPHIC | |
| Sex | 0.889* |
| (0.052) |
| Age | |
| 18–28 | 1.015 |
| (0.150) |
| 29–38 | 0.902 |
| (0.126) |
| 39–48 | 0.906 |
| (0.126) |
| 49–58 | 0.966 |
| (0.141) |
| 59–68 | 0.742 |
| (0.148) |
| 69–78 | 0.647 |
| (0.159) |
| 79–88 | 0.847 |
| (0.412) |
| 89–98 | - |
| RESOURCES | |
| 1-Information | |
| Online media access | 3.062*** |
| (0.340) |
| 2-Social Capital | |
| Household composition | 0.868 |
| (0.065) |
| Use of social media | 1.576*** |
| (0.119) |
| Employment situation | |
| -Employee | 1.229* |
| (0.108) |
| -Student | 1.024 |
| (0.177) |
| -Retired | 1.485 |
| (0.224)** |
| 3-Household income | |
| -Between 900 and 1599 | 1.005 |
| (0.108) |
| -Between 1600 and 2499 | 0.985 |
| (0.103) |
| -Between 2500 and 2999 | 1.181 |
| (0.117) |
| −3000 or more | 0.989 |
| (0.099) |
| 4-Educational level | |
| -Primary Education | 0.807 |
| (0.305) |
| -Secondary education (1st stage) | 0.831 |
| (0.291) |
| -Secondary education (2nd stage) | 1.182 |
| (0.413) |
| -Non-higher post-secondary education | 2.428 |
| (2.458) |
| -Higher Vocational Training | 1.340 |
| (0.473) |
| -University graduates (up to 240 credits) | 1.992 |
| (0.701) |
| -University graduates (over 240 credits) | 2.473* |
| (0.867) |
| -Doctoral degree | 2.207 |
| (0.091) |
| CONTROL VARIABLE | |
| Habitat and population density | |
| -Intermediate density area | 0.836** |
| (0.05) |
| -Thinly populated area | 0.924 |
| (0.079) |
| n | 13920 |
| Pseudo R2 | 0.24 |
Table 3. Average marginal effects of the logistic regression model.
| Online voting |
|---|
| Margin | SD |
95% CI |
|---|
| DIGITAL EXPERIENCE | | | |
| Daily use | | | |
| -Yes | 0.13 | 0.002 | (0.130–0.140) |
| -No | 0.08 | 0.013 | (0.061–0.114) |
| INTEREST POLITICAL AFFAIRS | | | |
| Political opinion social media | | | |
| -Yes | 0.40 | 0.010 | (0.384–0.425) |
| -No | 0.07 | 0.002 | (0.066–0.076) |
| SOCIODEMOGRAPHIC | | | |
| Sex | | | |
| -Male | 0.13 | 0.003 | (0.121–0.135) |
| -Female | 0.14 | 0.003 | (0.132–0.146) |
| Age | | | |
| 18–28 | 0.14 | 0.011 | (0.120–0.165) |
| 29–38 | 0.14 | 0.008 | (0.128–0.160) |
| 39–48 | 0.13 | 0.005 | (0.122–0.145) |
| 49–58 | 0.13 | 0.005 | (0.123–0.145) |
| 59–68 | 0.13 | 0.005 | (0.127–0.151) |
| 69–78 | 0.11 | 0.010 | (0.096–0.138) |
| 79–88 | 0.10 | 0.014 | (0.078–0.135) |
| 89–98 | - | - | - |
| RESOURCES | | | |
| 1-Information | | | |
| Online media access | | | |
| -Yes | 0.14 | 0.002 | (0.140–0.151) |
| -No | 0.06 | 0.005 | (0.053–0.075) |
| 2-Social Capital | | | |
| Household composition | | | |
| -One person household | 0.14 | 0.005 | (0.132–0.155) |
| -Multiperson household | 0.13 | 0.002 | (0.125–0.137) |
| Use of social media | | | |
| -Yes | 0.14 | 0.003 | (0.138–0.151) |
| -No | 0.10 | 0.004 | (0.096–0.115) |
| Employment situation | | | |
| -Unemployed | 0.11 | 0.006 | (0.105–0.130) |
| -Employee | 0.13 | 0.003 | (0.128–0.142) |
| -Student | 0.12 | 0.012 | (0.096–0.144) |
| -Retired | 0.15 | 0.012 | (0.129–0.176) |
| 3-Household income | | | |
| -Less than 900 | 0.13 | 0.006 | (0.117–0.144) |
| -Between 900 and 1599 | 0.13 | 0.006 | (0.118–0.145) |
| -Between 1600 and 2499 | 0.12 | 0.006 | (0.117–0.141) |
| -Between 2500 and 2999 | 0.14 | 0.005 | (0.135–0.156) |
| −3000 or more | 0.13 | 0.004 | (0.120–0.139) |
| 4-Educational level | | | |
| -Incomplete primary education | 0.10 | 0.025 | (0.054–0.155) |
| -Primary Education | 0.09 | 0.011 | (0.067–0.112) |
| -Secondary education (1st stage) | 0.09 | 0.004 | (0.082–0.101) |
| -Secondary education (2nd stage) | 0.11 | 0.004 | (0.108–0.128) |
| -Non-higher post-secondary education | 0.18 | 0.010 | (−0.024–0.402) |
| -Higher Vocational Training | 0.12 | 0.006 | (0.115–0.142) |
| -University graduates (up to 240 credits) | 0.16 | 0.007 | (0.152–0.181) |
| -University graduates (over 240 credits) | 0.19 | 0.007 | (0.177–0.204) |
| -Doctoral degree | 0.17 | 0.023 | (0.131–0.224) |
| CONTROL VARIABLE | | | |
| Habitat and population density | | | |
| -Densely populated area | 0.14 | 0.003 | (0.133–0.146) |
| -Intermediate density area | 0.12 | 0.004 | (0.115–0.133) |
| -Thinly populated are | 0.13 | 0.006 | (0.119–0.145) |
Table 4. Research questions and study variables.
| Variables | Research questions |
|---|
| Online voting | Have you taken part in online consultations or voting on civic or political issues (e.g. consultations on urban planning, etc.) (in the last 3 months)? |
| Daily use | On average, how often have you used the Internet in the last 3 months? |
| Political opinion social media | You have expressed opinions on civic or political issues on websites or social networks (e.g. Facebook, X, Instagram, YouTube, etc.) (in the last 3 months)? |
| Online media access | Have you read news, newspapers or magazines online (in the last 3 months)? |
| Use of social media | You have participated in social networks (created a user profile, sent messages or other contributions to Facebook, Tik Tok, X, Instagram, etc) (in the last 3 months)? |
Table 1 summarizes the trend of the explanatory variables of participation through online voting. The proportions observed show a higher level of use of this type of participatory repertoire among individuals with a higher level of digital experience and familiarity and with a greater interest in political issues. Similarly, people who obtain information through online media and who use social networks have a higher level of participation in online voting. The same trend can be observed among people with a higher level of education, those in the labor market, and families with a higher income level. At the same time, the average observed for the age variable is higher among individuals who do not participate in online voting processes. Conversely, no differences are observed in the proportions with respect to the variables of gender and household composition (see
Table 1).
The results of the logistic regression analysis shown in
Table 2 demonstrate how the variables daily use, political opinion on social media, gender, access to online media, use of social media, employment status, educational level, and habitat and population density allow us to predict a higher probability of participation through online voting (p < 0.05). Conversely, the variables age, household composition, household income, and some categories of employment status, educational level, and habitat do not show a statistically significant relationship with the dependent variable analyzed.
In relation to the variables that do not show a statistically significant relationship in the regression model, a very similar level of probability of participation through online voting is observed. Thus, in relation to the gender variable, it can be seen that men and women have practically equivalent probabilities of participation, at around 13% and 14%, respectively. A similar pattern is observed in the household composition variable, where people who live alone (14%) and those who live in households with more than one individual (13%) show very similar levels of probability of participating through the digital repertoire analyzed. Likewise, the different age categories show relatively homogeneous values, especially between 18 and 68 years of age, where the probability of participation remains around 13–14%, falling slightly in the older age groups (see
Table 3).
With regard to the variables that show a statistically significant relationship in the regression model,
Figure 2 graphically shows the positive relationship between daily internet use, the expression of political opinions on social media, and the probability of participating through online voting. Specifically, people who use the internet daily are approximately 13% more likely to vote online, compared to around 8% among those who do not use it daily. Likewise, those who express political opinions on social media are around 40% more likely to participate by voting online, while among those who do not do so, this probability is around 7%, showing a substantial difference between the two groups.
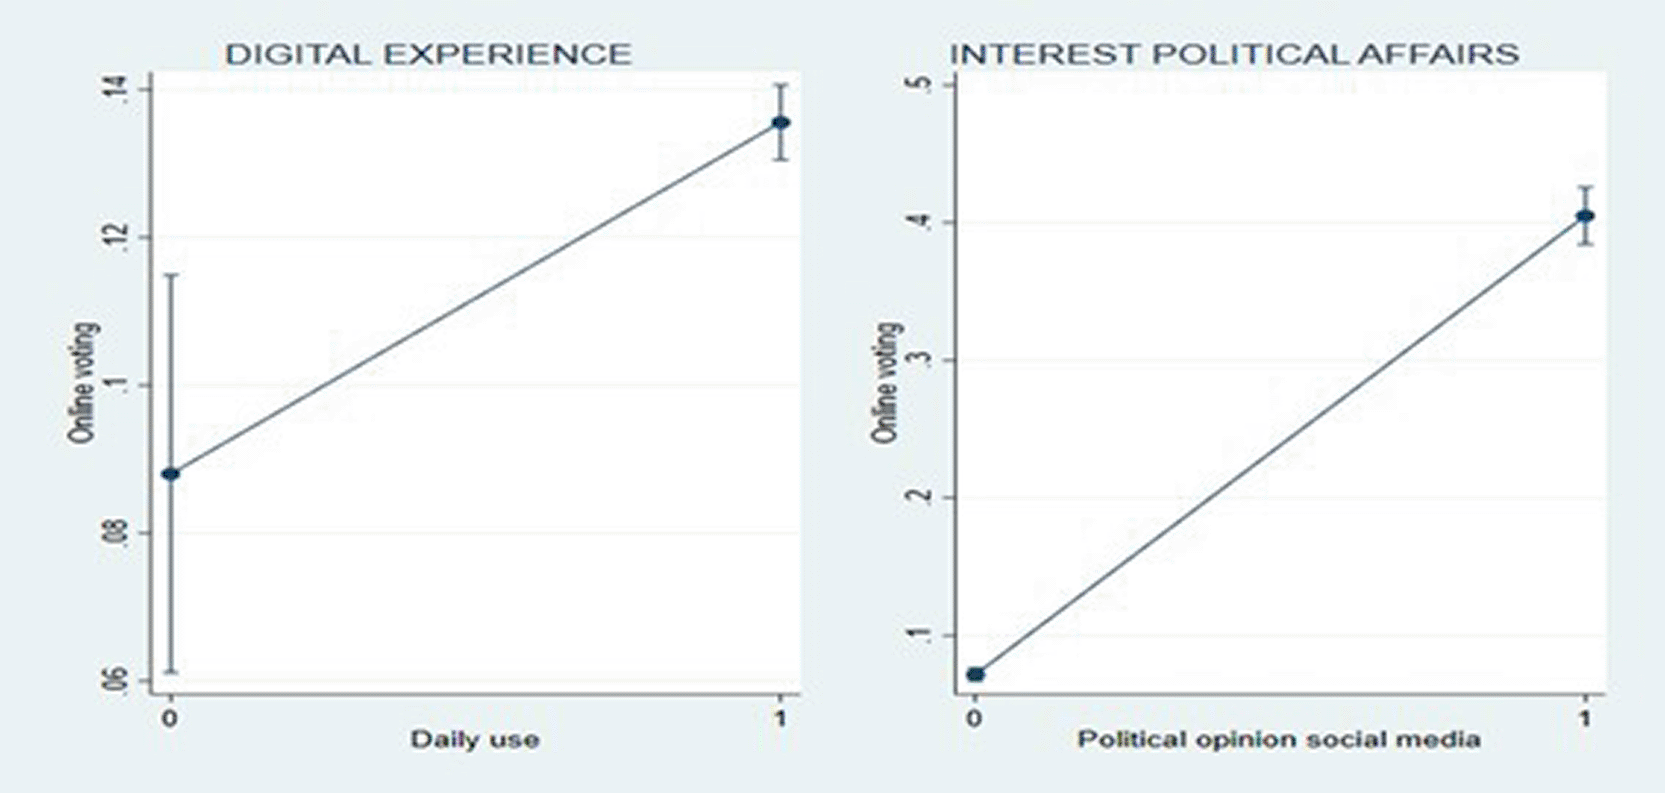
Figure 2. Marginal predictions of the probability of voting online by daily use and political opinion social media.
Note: 95% confidence intervals.
Figure 3 shows the marginal predictions of the probability of participating through online voting by gender and age. In the case of gender, very similar levels are observed between men (13%) and women (14%). In terms of age, the probability of participation remains relatively stable between the ages of 18 and 68 (around 13–14%), while from the age of 69 onwards there is a slight decline, standing at around 10–11% in the older age groups (see
Figure 3).
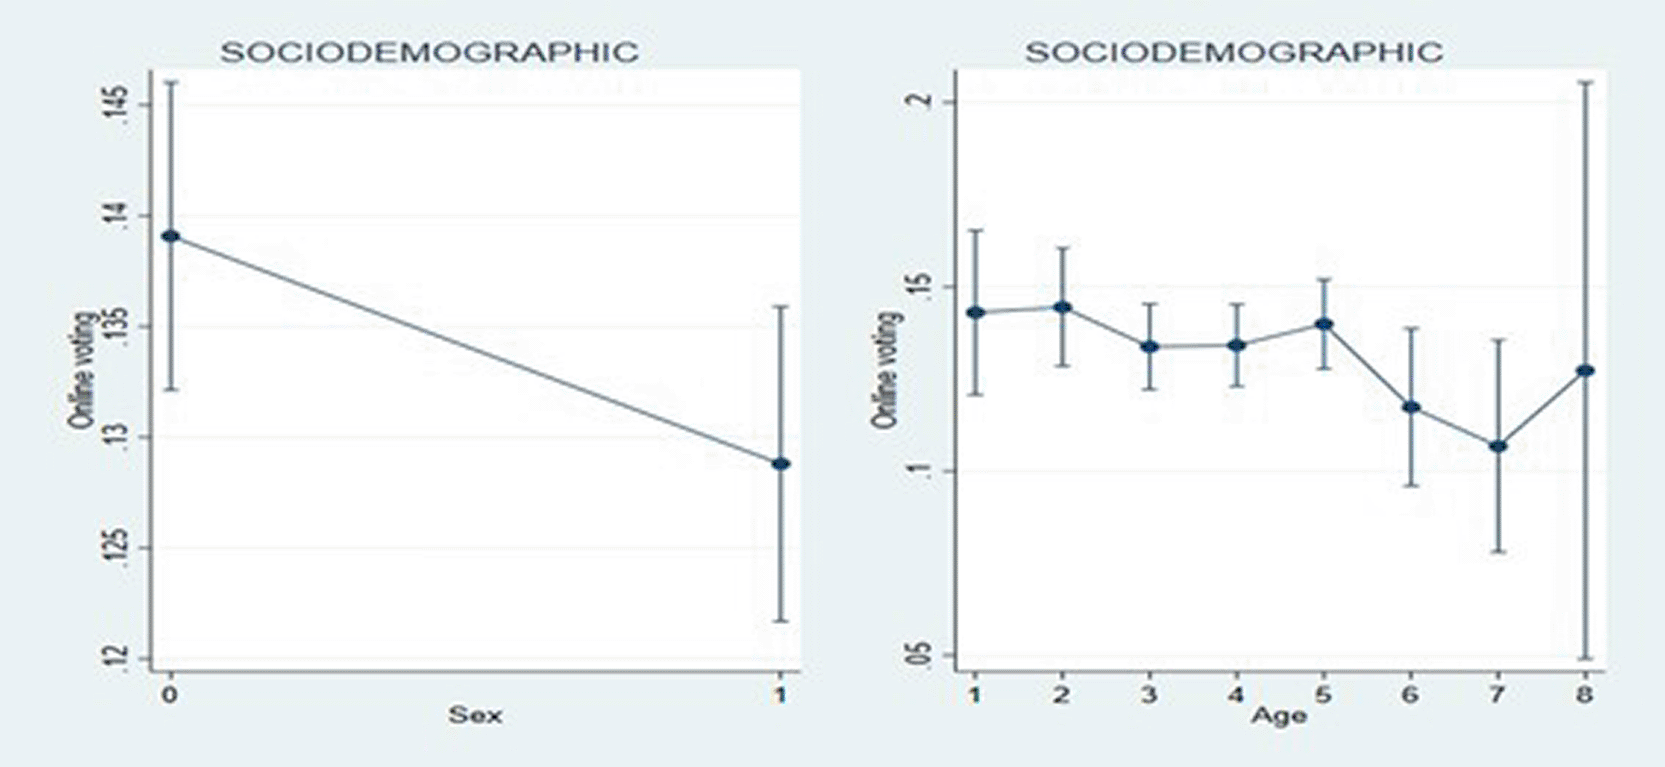
Figure 3. Marginal predictions of the probability of voting online by age and sex.
Note: 95% confidence intervals.
Figure 4 shows the marginal predictions of the probability of participating through online voting according to access to online media and household composition. In the first case, people with access to online media are around 14–15% more likely to vote online, compared to around 6% among those without such access. In contrast, in relation to household composition, the differences are small, with the probability standing at around 14% among those who live alone and 13% among those who live in households with more than one member (see
Figure 4).
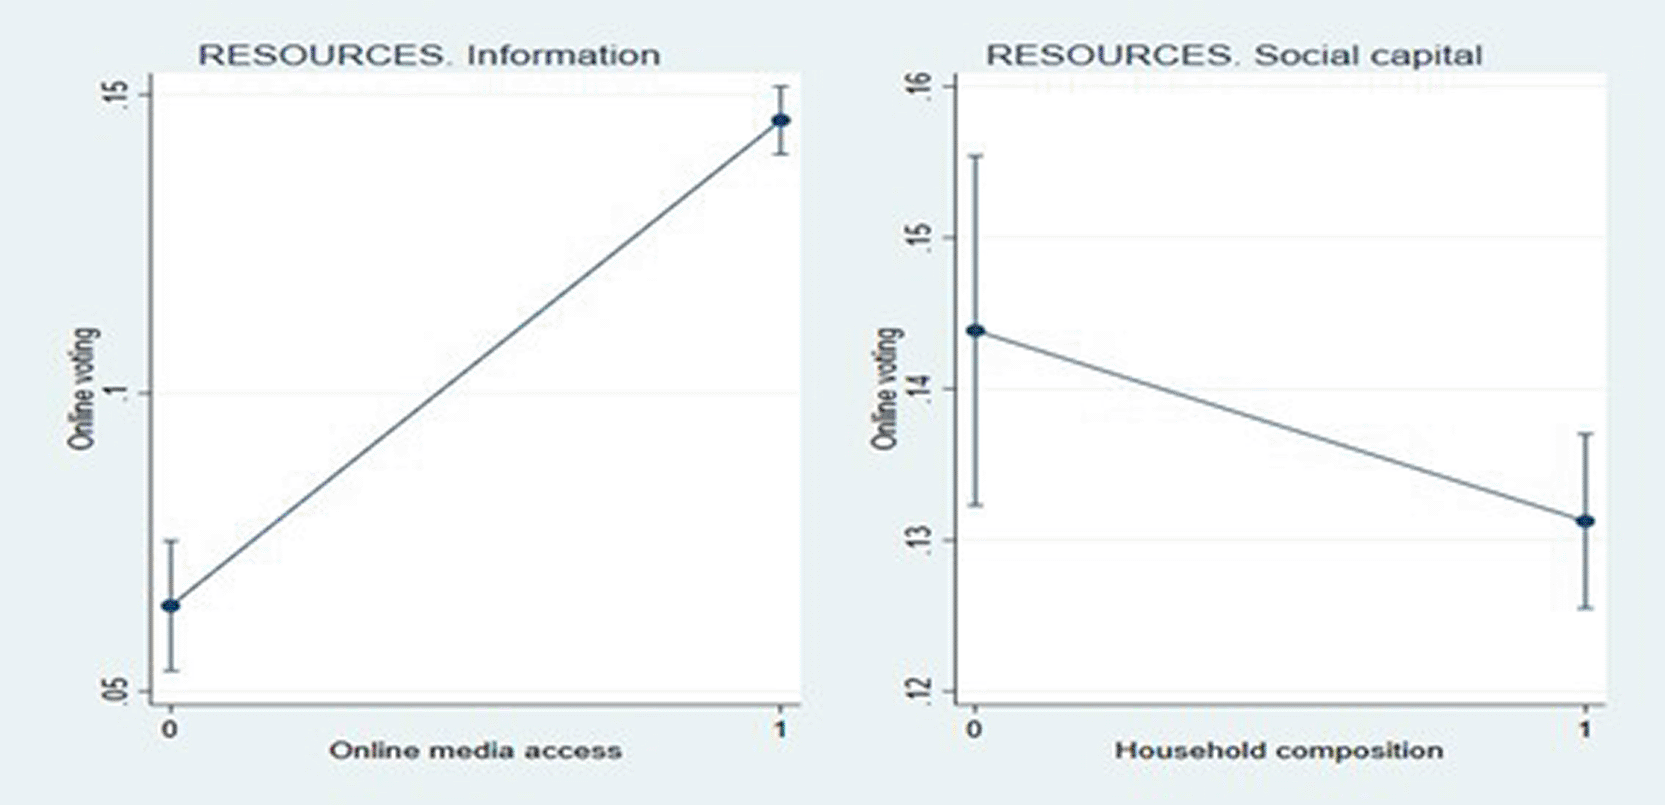
Figure 4. Marginal predictions of the probability of voting online by online media access and household composition.
Note: 95% confidence intervals.
Figure 5 shows the marginal predictions of the probability of participating through online voting according to social media use and employment status. In relation to social media use, those who use social media have an approximate probability of 14% of voting online, compared to around 10% among those who do not use social media. In terms of employment status, the probabilities are around 11% among unemployed people, 13% among employees, 12% among students, and approximately 15% among retired people, with the latter showing a slightly higher probability of participating through online voting (see
Figure 5).
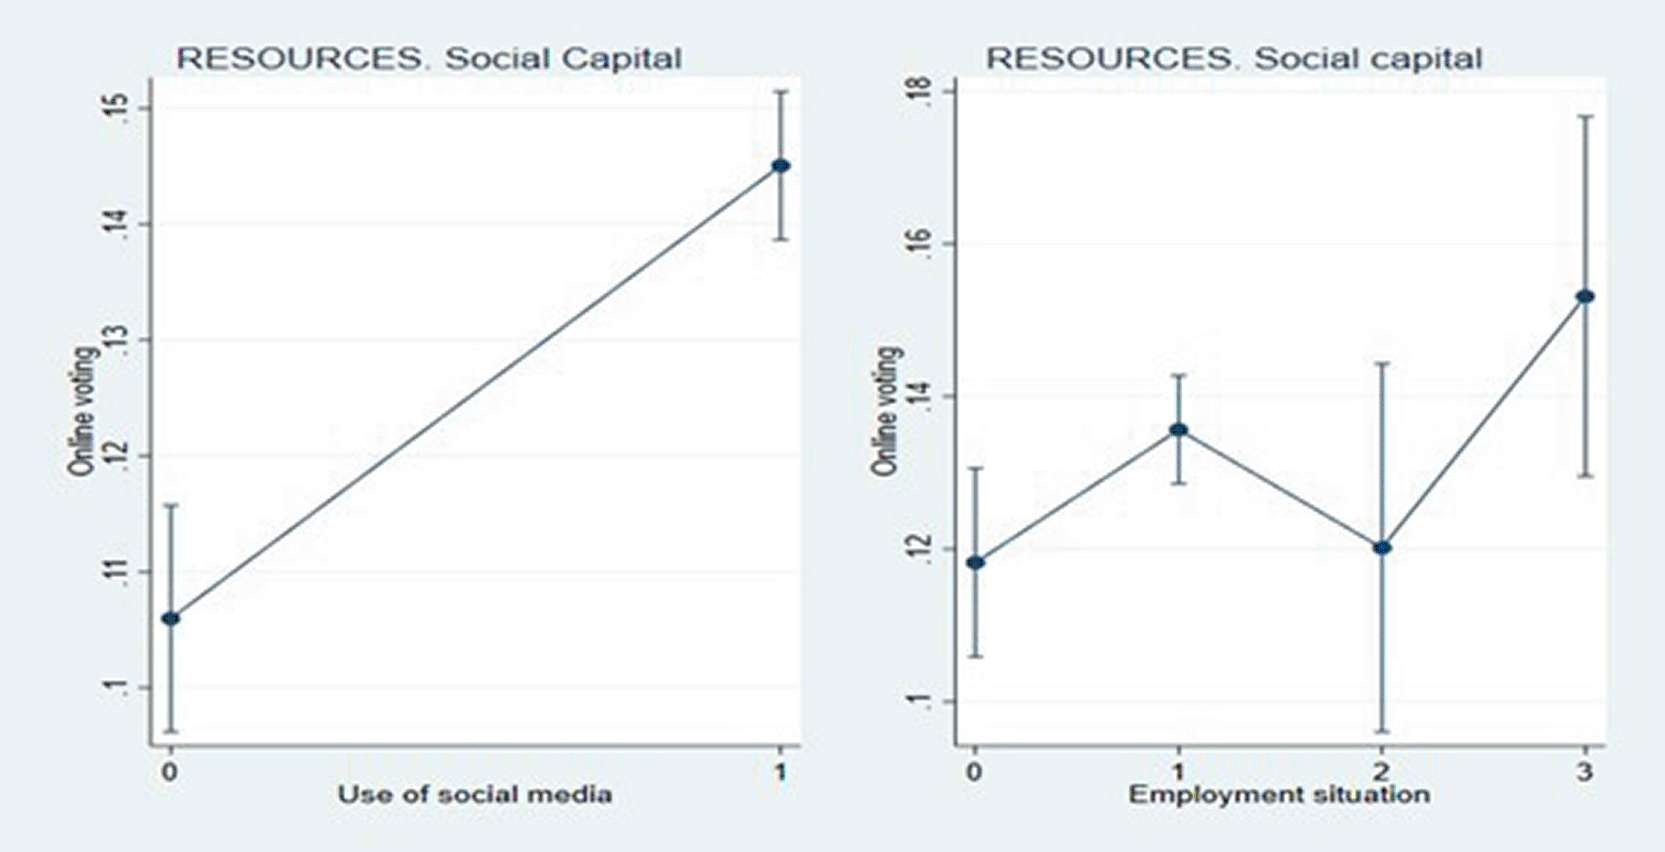
Figure 5. Marginal predictions of the probability of voting online by use of social media and employment situation.
Note: 95% confidence intervals.
In terms of economic resources, the probability of participating through online voting remains relatively stable across different household income brackets, standing at around 12–14%, with a slight increase among those who report monthly incomes between €2,500 and €2,999. In terms of educational level, there is a growing trend in the probability of participation as the level of education increases, from values close to 9–10% among those with the lowest educational levels to approximately 17–19% among those with university degrees or doctorates (see
Figure 6).
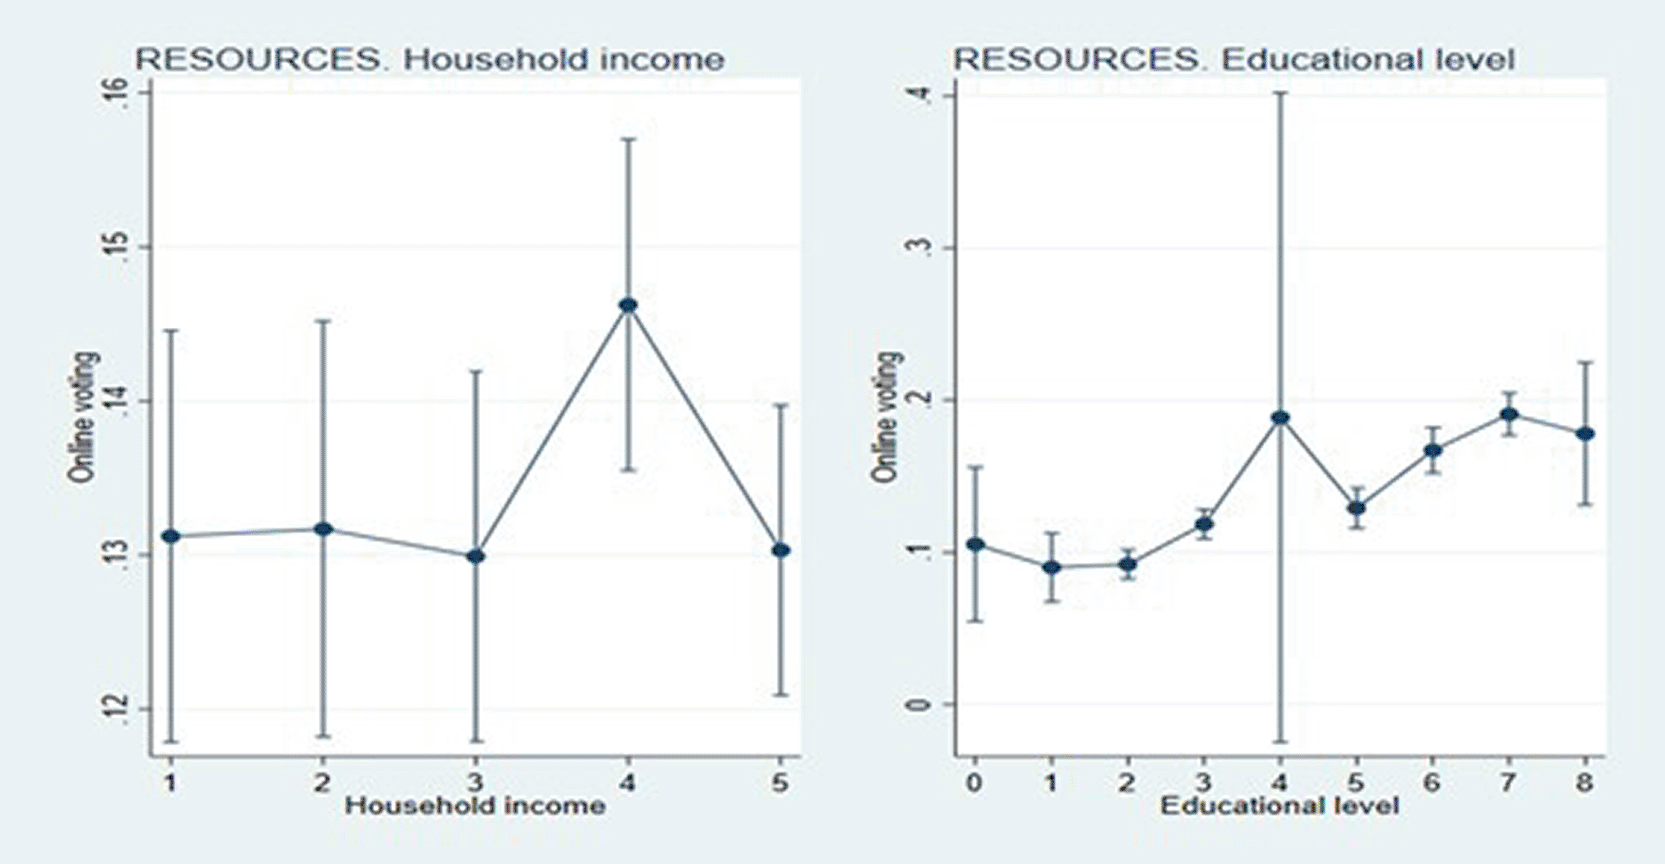
Figure 6. Marginal predictions of the probability of voting online by household income and educational level.
Note: 95% confidence intervals.
Finally, in relation to the control variable, the probability of participating through online voting is slightly higher in densely populated areas (around 14%), while it drops to approximately 12% in areas of intermediate density and stands at around 13% in sparsely populated areas, reflecting relatively small differences between the different types of habitat (see
Figure 7).
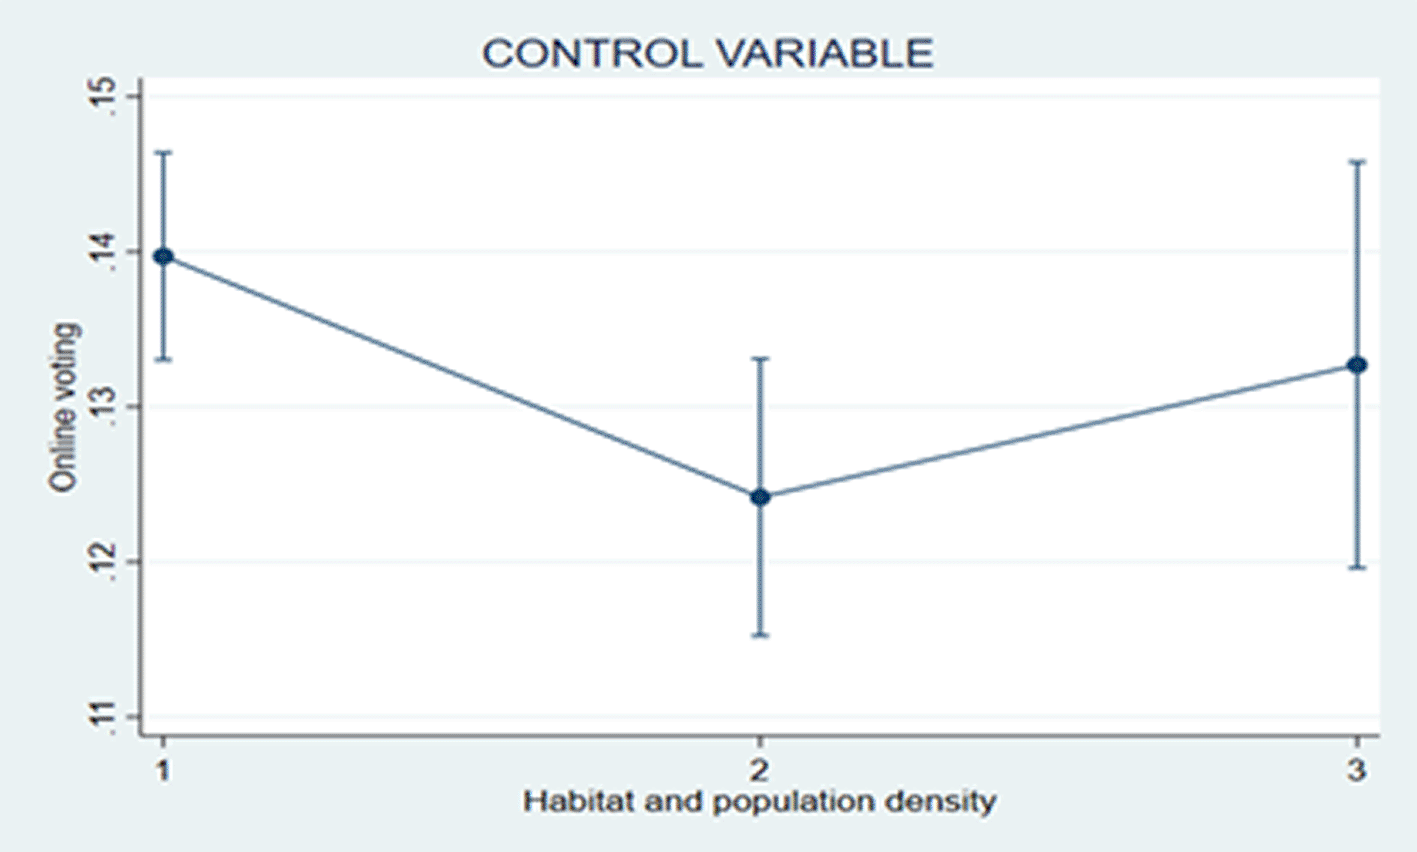
Figure 7. Marginal predictions of the probability of voting online by habitat and population density.
Note: 95% confidence intervals.
Discussion
In this research, we have analyzed political and civic participation (Kiss et al., 2022; Torcal et al., 2006) through online voting and its relationship with various factors related to digital experience, interest in political issues, sociodemographic profile, and the resources of the people who participate through this repertoire. Thus, based on the characteristics and profile of the people who participate through online voting, we have tried to identify the factors associated with the concept of the digital divide that could hinder access to and use of the applications through which electoral processes involving online voting are carried out (Lythreatis et al., 2022; Van Dijk, 2017).
First, with regard to digital experience, the results confirm the importance of familiarity and regular exposure to the internet as explanatory factors of participation through online voting. In line with Padilla-Carmona (2022), previous use and experience appear to shape digital performance both quantitatively and qualitatively. A plausible explanation lies in higher levels of digital self-efficacy among those who access the internet on a daily basis (Bronstein, 2014; Malliari et al., 2012; Hammond et al., 2011). In this sense, hypothesis 1 (H1) is supported.
Second, regarding interest in political issues, the findings reveal a particularly strong relationship between expressing political opinions on social media and participation through online voting, which supports hypothesis 2 (H2). In line with classic works (Verba et al., 1995) and more recent contributions (Kim et al., 2023; Holt et al., 2013), political interest appears to operate as a motivational prerequisite for participation. At the same time, the indicator used in this study also captures digital competence and familiarity with online political environments. Thus, its high predictive power may reflect the combined effect of political motivation and digital capacity.
With regard to sociodemographic factors, the evidence requires a more nuanced assessment of hypotheses 3 and 4. In the case of gender, the regression model identifies a statistically significant relationship, although the predicted probabilities for men and women remain very similar. This suggests that gender differences in participation through online voting are limited in substantive terms, even if they are not entirely absent. Therefore, hypothesis 3 (H3) receives only partial support. This pattern may be related to some of the defining features of online voting, such as privacy, anonymity, and lower spatial-temporal costs, which may reduce some of the barriers traditionally associated with gendered patterns of participation (Heger & Hoffmann, 2021; Pfanzelt & Spies, 2019; Bennett & Segerberg, 2012).
In contrast, the results do not provide clear support for hypothesis 4 (H4). Although the marginal effects suggest a slight decline in the probability of participation among older age groups, age does not show a statistically significant relationship in the regression model. This finding suggests that participation through online voting in non-electoral settings may not be as strongly structured by age as expected from the broader literature on digital inequality and political participation (Lythreatis et al., 2022; Quinde et al., 2020). Given the broad wording of the survey question and the heterogeneity of possible participatory contexts included in the dependent variable, caution is needed when interpreting age-related differences.
Fourth, and finally, we consider the set of hypotheses linked to resources (Verba et al., 1995; Brady et al., 1995). The results support hypothesis 5 (H5), since access to online media is associated with a greater probability of participating through online voting. As suggested by Holt et al. (2013), frequent exposure to digital news environments may increase the amount of political information available to individuals. At the same time, such access also signals familiarity with the digital sphere, which may facilitate engagement in online participatory tools.
With regard to hypothesis 6 (H6), the evidence partially supports the initial expectation. The use of social media and some employment categories are associated with a higher probability of participation, whereas household composition does not show explanatory power. These results suggest that not all dimensions of social capital operate in the same way. Rather, participation through online voting seems to benefit especially from forms of social insertion linked to digital routines, informational flows, and relational environments that reinforce familiarity with online interaction (Singh & Moody, 2022; Spottswood & Wohn, 2020). At the same time, the lack of association with household composition indicates that the mere presence of close ties within the home is not sufficient to explain differences in this participatory repertoire.
In relation to household income, the results support hypothesis 7 (H7). Income does not show a statistically significant relationship with participation through online voting, and the predicted probabilities remain relatively stable across income groups. This suggests that direct economic resources may be less decisive in explaining this form of participation than other factors such as digital skills, informational access, or educational background. In this respect, the findings are more consistent with those studies that emphasize the relatively low-cost nature of digital participation repertoires than with the classic expectation that higher income systematically increases participation (Theocharis et al., 2019).
Regarding hypothesis 8 (H8), the findings point to a positive association between educational attainment and participation through online voting, especially at the highest educational levels. This result is consistent with the broad literature linking education to greater cognitive resources, political information processing, and digital self-efficacy (Aars & Christensen, 2018; Van Deursen et al., 2017; Schlozman et al., 2010; Lythreatis et al., 2022). Thus, education remains one of the clearest mechanisms through which participatory inequalities in digital settings may be reproduced.
Finally, with regard to the control variable, the results suggest limited territorial differences in participation through online voting. As noted by Pérez-Amaral et al. (2021), habitat and population density may be linked to digital inequalities associated with differential access conditions and the distribution of digital opportunities. In our case, however, this relationship is only partially confirmed: participation is lower in areas of intermediate density than in densely populated areas, while differences with thinly populated areas are smaller and not statistically significant. Therefore, rather than identifying a clear territorial divide, the findings point to a modest and non-linear habitat effect.
Conclusion and limitations
The data and information analyzed allow us to characterize the participatory profile of individuals who vote online in non-electoral processes as people who are familiar with the use of the internet, interested in political issues, and endowed with higher levels of information, social capital, and education. These findings suggest that participation through online voting in these contexts is primarily structured by differences in digital experience, political engagement in online environments, and educational resources, pointing to the persistence of a digital divide in access and uso to digital participation tools.
The main limitation of this study relates to the design of the questionnaire and the wording of the question from which we extracted our dependent variable. The breadth and ambiguity of the question do not allow us to specify the type and specific objective of the online vote being asked about. Thus, those who answered affirmatively may have exercised online voting associated with a wide range of situations and contexts related to civic and political spheres.
Political implications
The results of this study have important implications for the design of digital participation infrastructures. If online voting mechanisms disproportionately attract young citizens with higher levels of education and digital experience, public institutions run the risk of reinforcing pre-existing participatory inequalities rather than reducing them. Consequently, digital participation should not be understood as a neutral technological improvement, but rather as an area that requires public interventions aimed at equity. This involves investing in digital literacy programs, simplifying the interfaces of participatory platforms, ensuring multimodal channels that combine online and in-person options, and developing specific outreach strategies targeting socially and digitally marginalized groups.