1. Introduction
One of the EU’s missions is to have 100 climate-neutral smart cities by 2030. Today, 103 cities across wider Europe have been awarded the EU Mission Label for their commitment to this goal. However, neutralising carbon footprint on a city scale is easier said than done. One only needs to look at Copenhagen, which pledged to reach net zero by 2025, but then postponed this target after acknowledging the original aim was no longer feasible. The challenging nature of clean urban energy transition is pushing cities to test innovative concepts and technologies in a bid to unlock their potential for reaching climate neutrality by the end of the decade. Positive Energy Districts and Digital Twins are two promising solutions that some Mission Cities are using in combination to achieve climate objectives.
2. Before PEDs
At the heart of the PED concept lies the idea that an entity can be self-sufficient with electricity through production, storage and export of renewable energy. This entity can be a district, neighbourhood, or building. In fact, PED origins are to be found in ZEBs or nZEBs. These are zero or nearly-zero energy buildings that cover their energy needs significantly from “renewable sources produced on-site or nearby” (
European Parliament and Council 2010).
After ZEBs, the narrative shifted from a single to several buildings. The European Innovation Partnership on Smart Cities and Communities called for lighthouse projects to combine different building blocks to test innovative solutions that “reduce greenhouse gas emissions and energy consumption and more widely improve the urban environment” (
European Commission 2012). Shortly afterwards, the concept of Positive Energy Blocks was born. PEBs were defined as a group of diverse interconnected buildings (at least three) with “complementary energy consumption curves” (EIP-SCC 2016). In other words, some buildings in PEBs may be ZEBs, some may already have a clean-energy surplus, but some may still be net energy consumers. However, as a group, these buildings can achieve a net-positive energy balance annually. At the time, the aim was to have 100 PEBs by 2020 (ibid).
3. Positive Energy Districts
The next iteration of the ‘+energy’ concept scaled the idea to the district level (
Figure 1). A district is more than a collection of buildings. It’s not defined solely by the built environment. Many land uses and urban typologies co-exist in a district. A successful representation of these characteristics requires a more holistic approach beyond ZEBs and PEBs. That’s why a new framework in the form of PEDs was introduced to help fast-track climate-neutral cities through an ambitious district transformation.
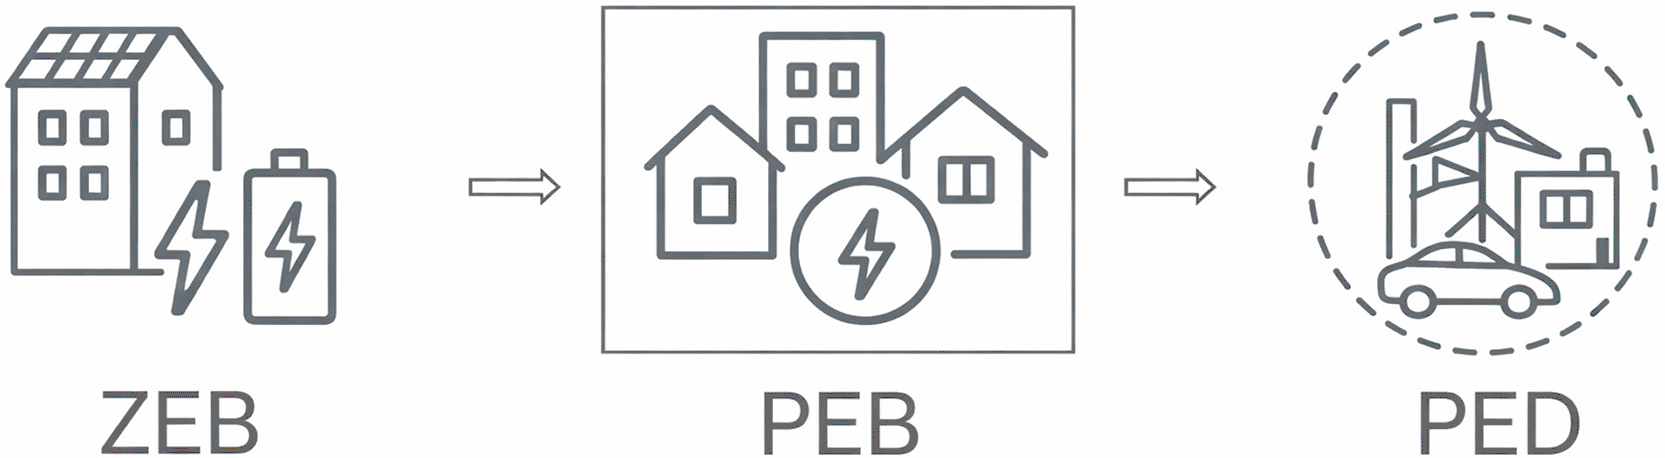
Figure 1. Evolution of the +energy concept.
A district’s multi-faceted nature was reflected in the PED definition first formulated in the Strategic Energy Technology Plan 2018. The document states that PEDs require an integrative approach between “buildings, the users and the regional energy, mobility and ICT system” (SET-Plan 2018). Just like with PEBs, a target of 100 implementations was attached to the PED concept, to be achieved by 2025. At the time of writing this article, the PED landscape has grown to 114 projects that have piloted PED principles in various urban settings across Europe, as reported on PED-EU.NET (n.d.)
Building on these original principles, the project BIPED (n.d.) has further operationalised key building blocks of Positive Energy Districts (
Figure 2).
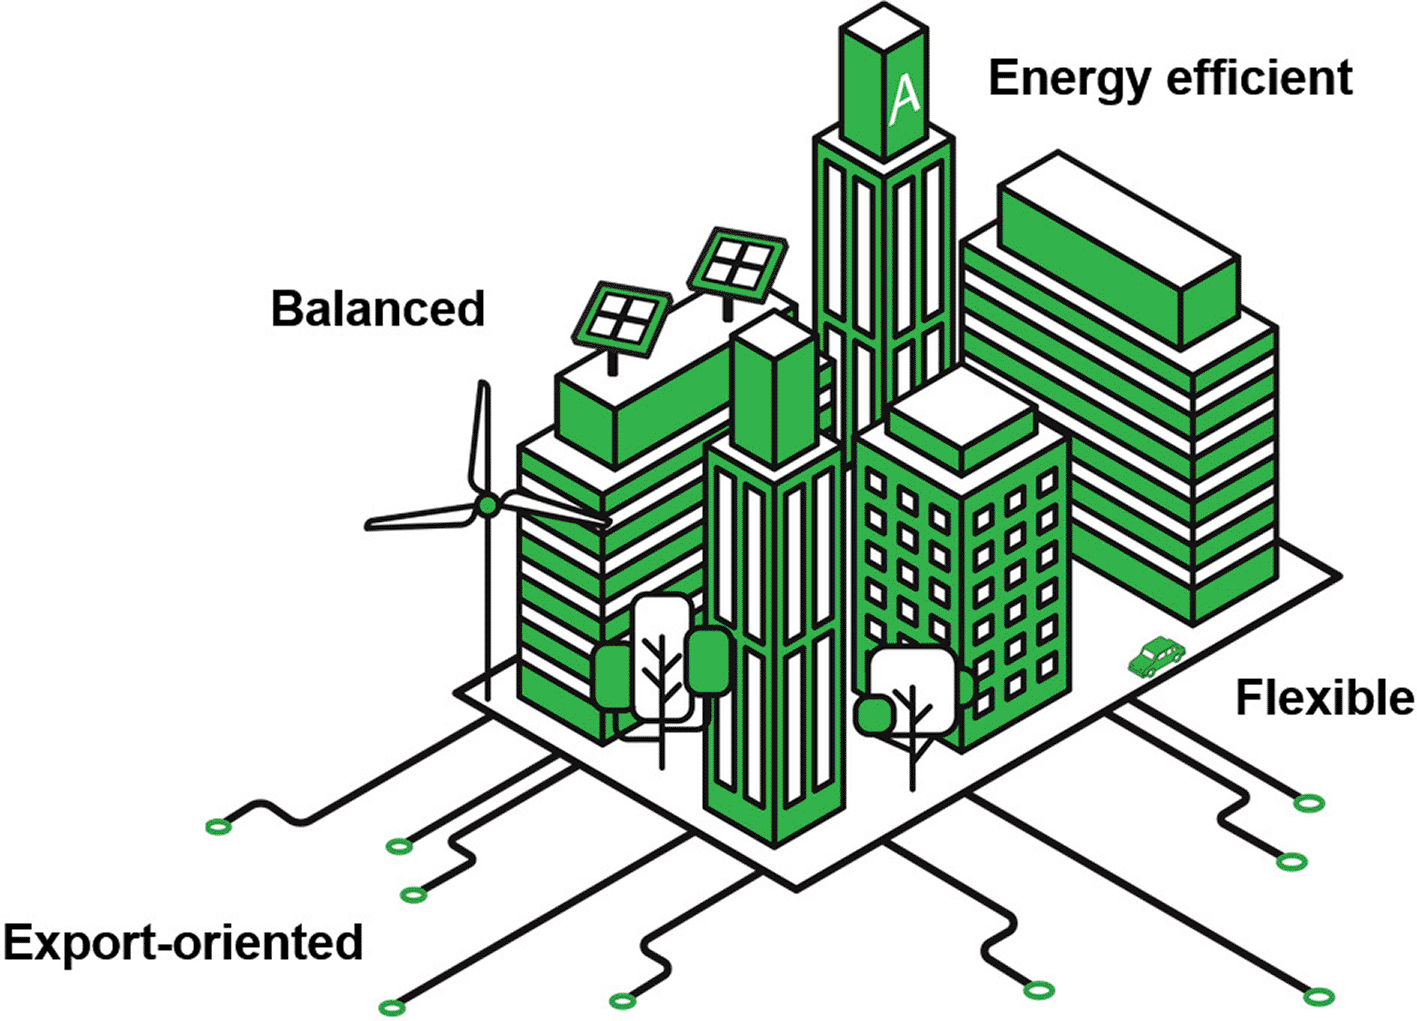
Figure 2. PED building blocks.
PEDs are flexible:
In today’s weather-dependent, renewable-driven energy systems, demand must be flexible to accommodate intermittent supply. By incorporating distributed energy sources (e.g. energy communities) and facilitating sector couplings (e.g. mobility-energy nexus), PEDs help unlock flexibility potentials to stabilise energy systems during crunch times.
PEDs are energy-efficient:
PED sectors use the least amount of energy possible thanks to energy efficiency improvements in everything from buildings to household appliances. This helps keep energy consumption in PEDs lower than the amount of locally produced renewable energy.
PEDs are balanced:
Local solar, wind, geothermal, wastewater, biomass and waste heat are examples of renewable sources that PEDs use to cover their energy needs. As a result, energy imports from outside the district and/or city boundaries are minimised, enabling self-consumption.
PEDs are energy exporters:
Once PEDs’ own energy needs are covered, they work towards generating a surplus of clean renewable energy for sharing with other districts that are net energy consumers. This way, district by district, cities can achieve their clean urban energy transition towards net-zero emissions.
4. Digital solutions for PEDs
Digital transformation is a critical enabler of energy transition. Digitalisation improves the way in which we plan, co-create and execute energy policies to achieve sustainable smart cities. The deployment of ICTs helps transform urban governance, making it more data-driven and forward-looking, informed by evidence of what is currently happening in different policy domains, and how the situation may change if new measures are introduced. Several technologies that European Commission identifies as ‘facilitators’ of digitalisation in urban energy systems—urban data spaces, cross-domain models, digital twins and standards (CINEA 2022)—represent the core of BIPED’s digital solution for PED development in the Brabrand district of Aarhus, Denmark.
5. BIPED’s integrated Digital Twin
The open-source urban data platform called Civora (n.d.) is a gateway to different components that make up the Digital Twin PED (BIPED Platform n.d.). For the purposes of this article, we focus on the four main elements: data catalogue, model coordinator, 3D environment, and dashboards (
Figure 3). The following paragraphs will provide a general overview of each component. Readers interested in extra details can consult BIPED’s more technical reports for in-depth descriptions (BIPED Consortium 2024a, 2024b). Sample datasets are also publicly available (Kogut 2026).
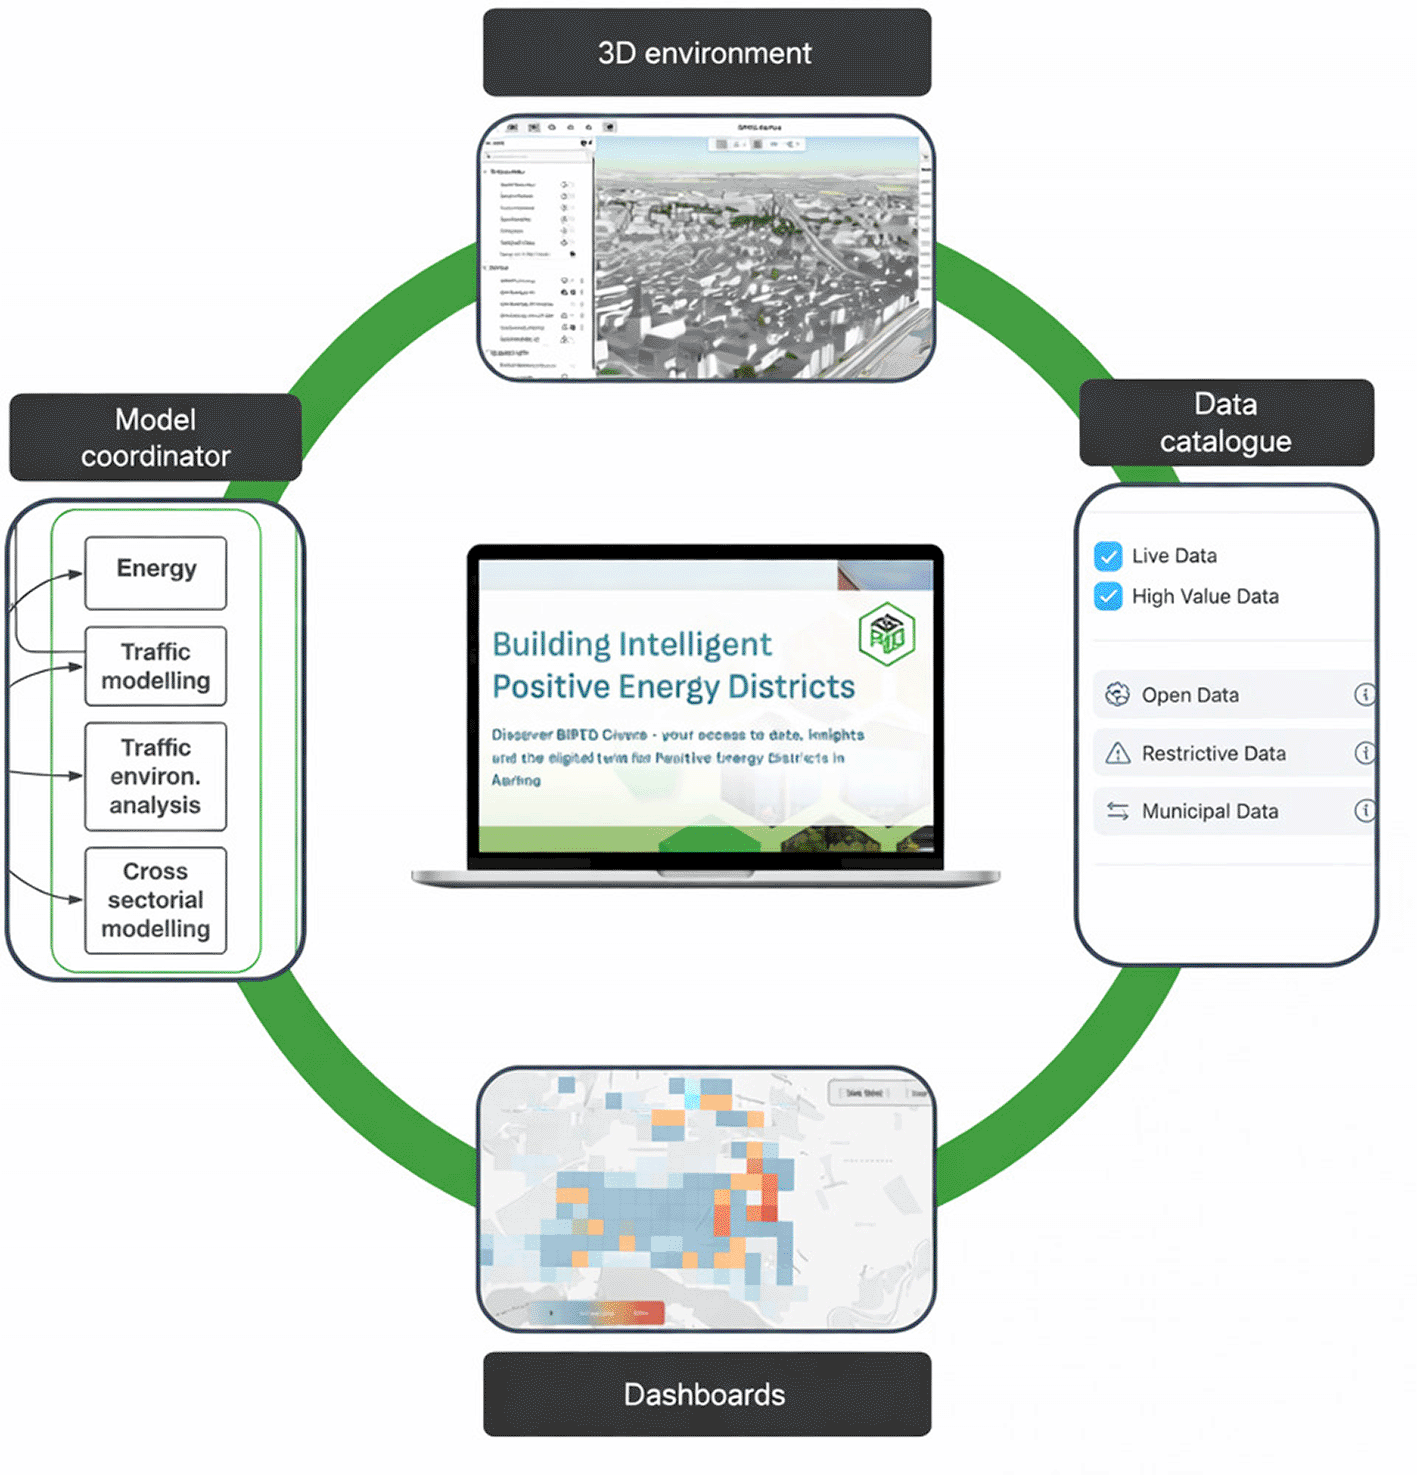
Figure 3. BIPED’s integrated Digital Twin PED platform.
5.1 Data catalogue
The tool acts as a central repository for sharing static and dynamic datasets, covering energy, weather, mobility, demographics, and air quality in the city of Aarhus. The associated metadata is released under the DCAT-AP standard (
European Commission 2023). Many national and EU portals are using the same standard, which means information about BIPED data can be easily discovered on external platforms. BIPED’s data catalogue has data sovereignty rules that allow data owners to determine which datasets they want to share, how, with whom, and on which conditions. The capacity to host open and closed (private, restricted, commercial) datasets means that BIPED’s data catalogue effectively functions as a data space capable of supporting secure and interoperable data exchange between platform participants.
5.2 Model coordinator
Data from the catalogue is fed into models that broadly represent the state of and dynamics within different PED sectors–for example, built environment, household occupancy, traffic flows, energy consumption and sources. If the aim was to only run standalone simulations, there would be no need for a broker to orchestrate model interaction. But in Digital Twin PEDs, the added value comes from running cross-domain modelling (Kogut 2024). For these simulations to happen, models need to ‘talk to each other’ whereby the output of one model becomes the input of another. This inter-connectedness is achieved by implementing the OGC API Processes standard which links models together through a common syntax (OGC 2021).
5.3 Virtual 3D environment
Aarhus is visualised in 3D using CityGML, a standard by OGC (n.d.) for storing, visualising and exchanging 3D city models. CityGML provides another layer of interoperability through common semantics. It harmonises representations of key urban objects and allows users to select them for specific queries–for instance, identifying all buildings within a particular area that use heat pumps or district heating or central heating. Most of the city is available in LOD2; this level of detail shows extruded buildings with detailed roof structures. The reason BIPED went for LOD2 and not LOD1 as a default representation is because the latter shows building blocks with flat roofs–not ideal for assessing solar potential in different buildings, which is one of the PED use cases in Aarhus.
5.4 2D dashboards
Naturally, we tend to associate digital twins with 3D environments, but not all use cases require three dimensions. A district’s energy demand, building occupancy and traffic flows can all be visualised using “flat” charts and heat maps, and remain perfectly useful for decision making. Recognising that Digital Twin PEDs are not limited to 3D representations, BIPED has developed 2D dashboards within the digital twin environment to support modelling work best served by this visualisation format.
6. Digital Twin PED use cases
A handful of cases presented below were selected to a) match the sectoral diversity present in a district (energy, mobility, social characteristics) and b) illustrate how Digital Twin PEDs can serve the needs of diverse user groups (professionals and non-experts alike). However, these examples are not exhaustive. As BIPED develops, more cases will be cross-tested in the digital twin (e.g. district heating forecasting, indoor climate, wind comfort, green space accessibility), with results reported in future publications.
6.1 Rooftop PV planning
One way in which citizens can contribute to the green transition is by becoming energy prosumers. A classic example is the household PV installation, which is by far the most common and accessible form of prosumer participation. Renewable energy from rooftop solar panels supports affordable living by offsetting family energy bills. In some cases, home owners may receive credits or payments for feeding excess energy back to the grid. But how can people know if the return on their investment will be worth it, considering that household PVs, despite their small size, can be quite expensive, costing tens of thousands of euros?
BIPED’s solar planner was designed to address this need (
Figure 4). The tool is integrated into the 3D digital twin and shows, by analysing roof structure, building position, nearby objects (e.g. trees), and weather information, the solar potential of all buildings in Aarhus. Residents can locate their house on a map and specify the rooftop area to be covered by PV panels. After providing additional information about the household, its electricity demand, and planned financing options (equity capital, duration, interest rate), the user will get a personalized report showing the total energy yield, expected return on investment (profit or loss), and potential savings in financial terms and CO2 equivalent. The latter basically shows how much less CO2 the household would produce by using its own generated electricity than if the same amount of energy was taken from the grid. Based on these calculations, the user can make an informed decision about the risks and benefits of becoming a PED prosumer.
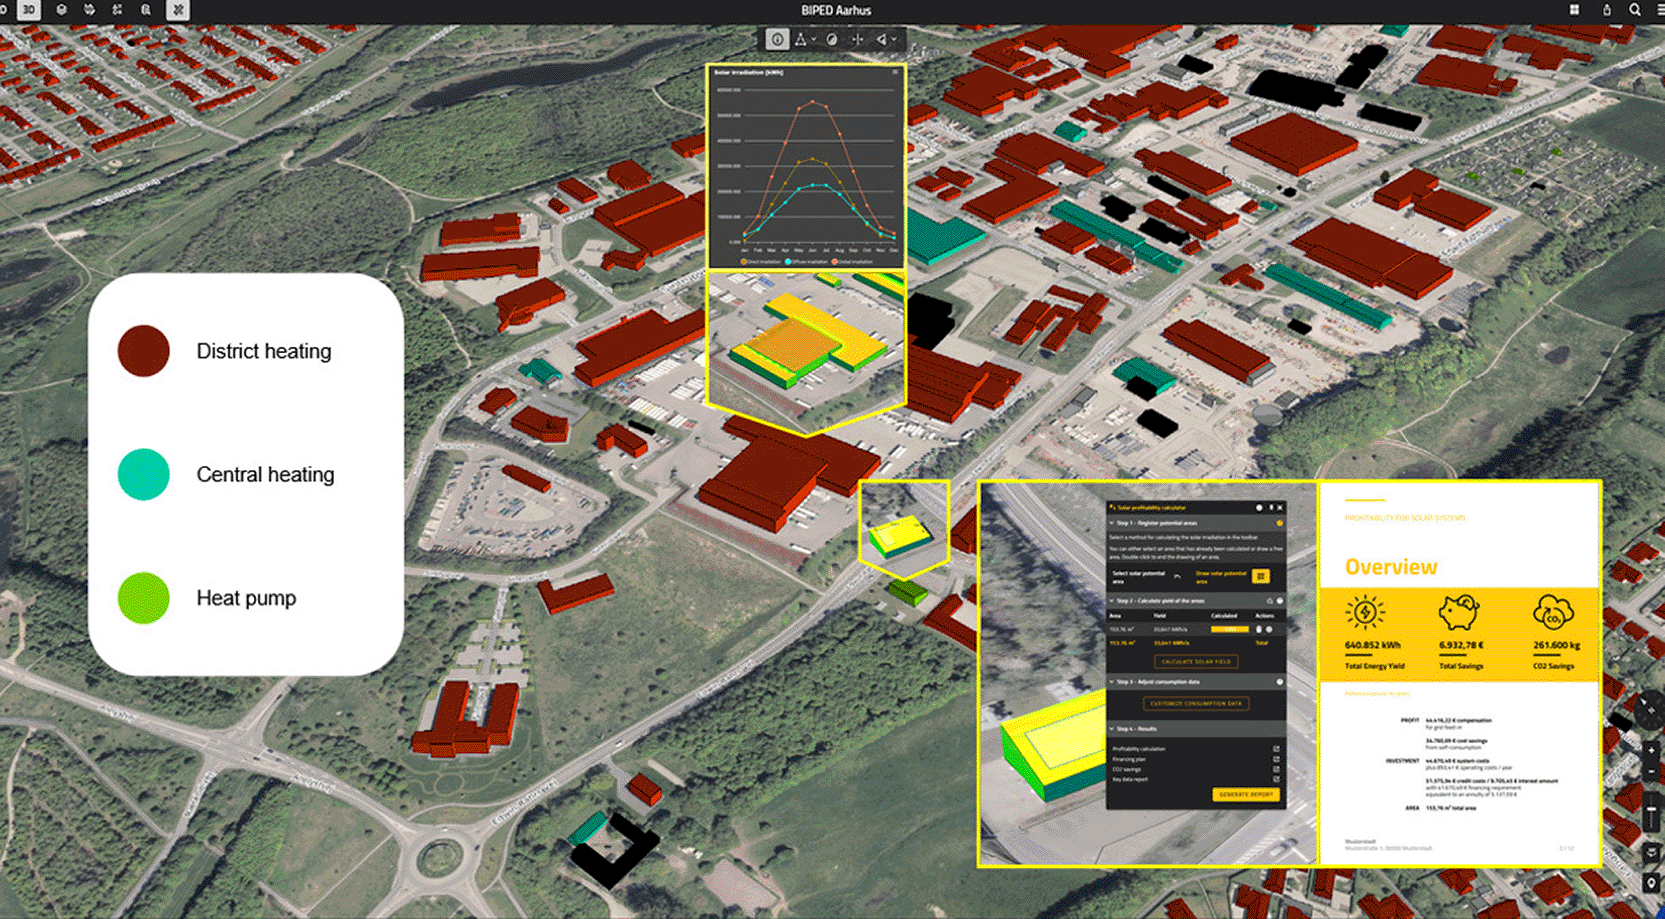
Figure 4. BIPED’s solar planner app.
In addition to planning individual PV installations, the BIPED Digital Twin also allows energy managers, sustainability managers and other administrative stakeholders to quickly identify buildings with the best suitability to utilize regenerative energy. By mapping the realistic solar efficiency for all buildings in Aarhus–taking into account climate and occlusion parameters–decision makers can better assess the potential for a whole district and plan sourcing of energy solutions accordingly.
6.2 Building occupancy assessment
The way in which people use space directly affects building energy consumption. Such insights can be useful for demand forecasting, demand-response management, and optimisation of on-site renewable production and storage. To support these measures, BIPED started analysing household occupancy patterns in Brabrand (
Figure 5). Information was processed in an aggregate manner (250x250 meter grid) rather than per household to overcome privacy restrictions. This approach ensured compliance with the GDPR while providing sufficient granularity for simulation purposes.
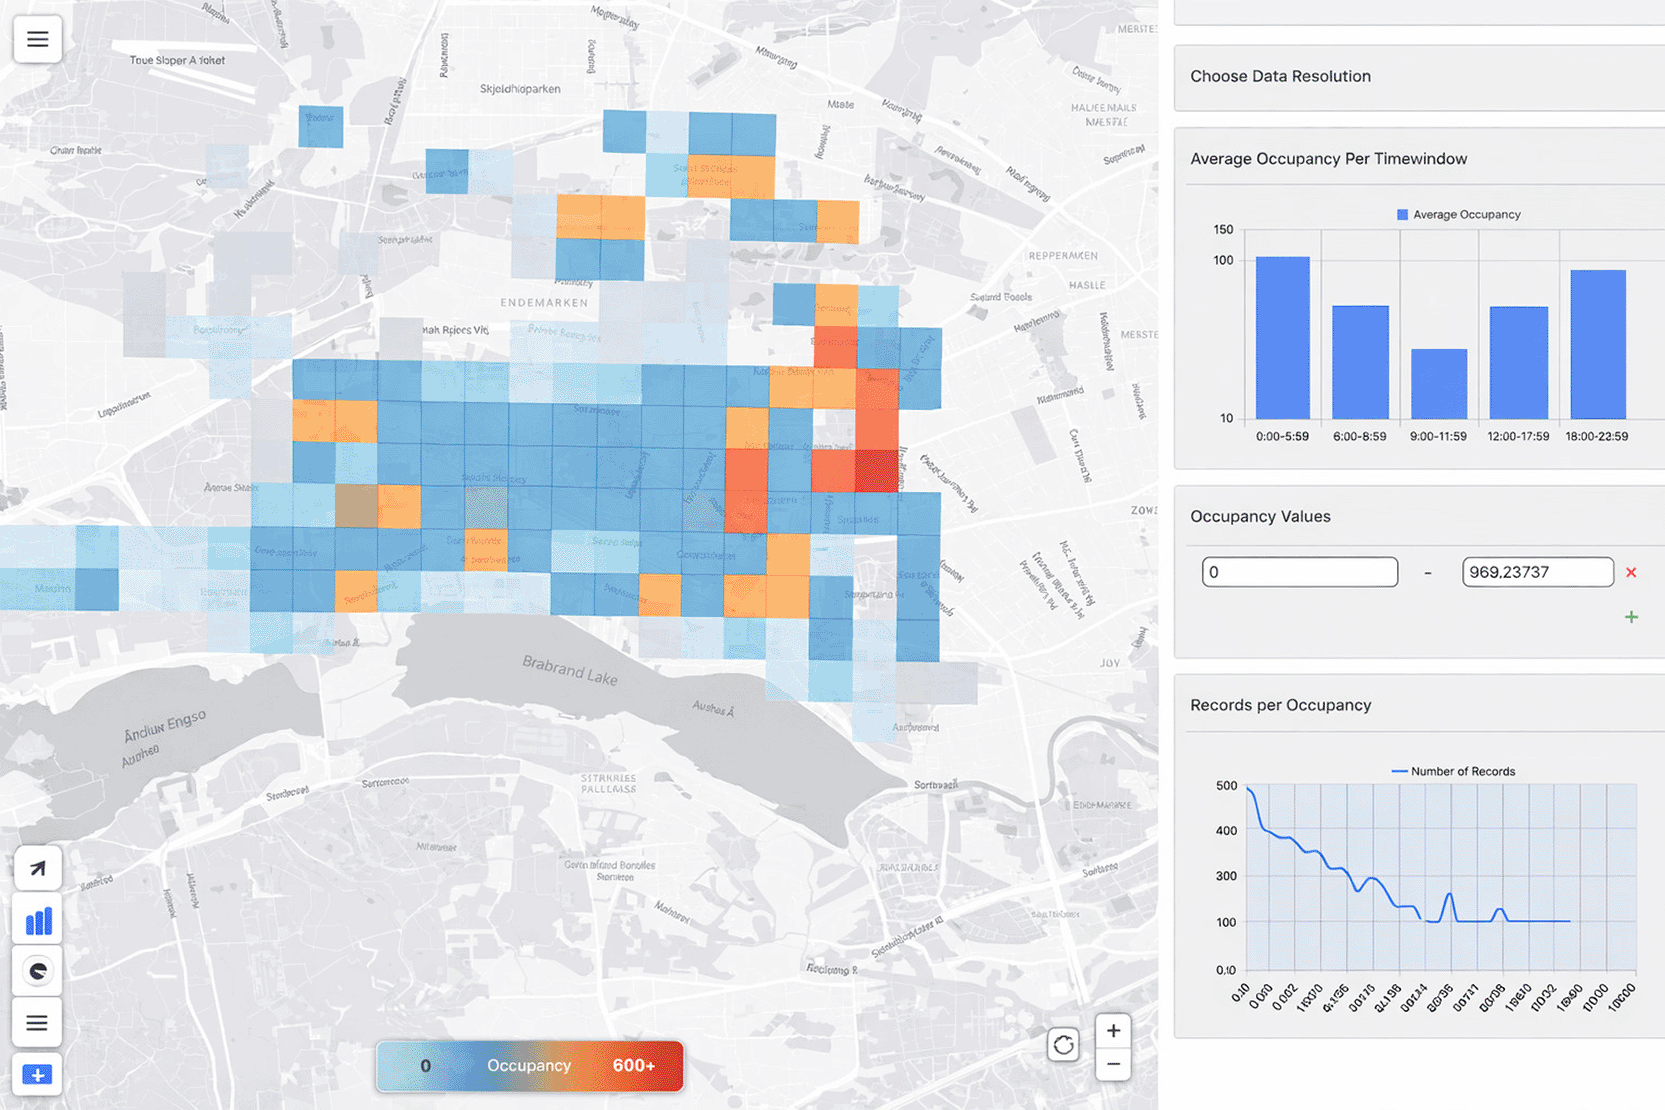
Figure 5. Brabrand’s building occupancy analysis.
The modelled data shows occupancy per target area as well as time window. These spatio-temporal occupancy patterns can be used by smart energy systems to predict where and when energy loads will rise. Demand response mechanisms in the form of price signalling can follow, nudging residents to adjust the scheduling of HVAC,1 lighting, and appliances accordingly.
Other interesting scenarios can be tested by combining occupancy patterns with renewable energy datasets. The municipality is actively promoting greater rooftop PV coverage across Aarhus. Many residential homes and public buildings (e.g. sport centers, schools) now have solar panels that generate green electricity. Using occupancy forecasts, on-site renewable production and storage can be optimally scheduled to meet expected demand so that, for instance, sufficient solar energy is stored for peak occupancy hours. This would reduce reliance on the grid, improving self-consumption and contributing to the PED development in Brabrand.
6.3 Traffic management
Aarhus’s path to climate neutrality requires offsetting its current annual carbon footprint of about 1.3 M CO2e (BIPED Consortium 2025). Around half of these emissions come from transportation. So, changes in transport and mobility measures will be needed if the city’s net-zero plans are to be achieved (Bouchal et al., 2025).
BIPED’s Digital Twin includes a macroscopic traffic model for measuring city-wide impacts of different vehicle types, route characteristics, and overall traffic density (
Figure 6). The model can evaluate traffic flows across multiple road segments and, by incorporating propulsion type distributions (electric, hybrid, conventional vehicles), provide detailed energy assessments for urban mobility systems. The results can support urban planners in assessing energy impacts of proposed traffic scenarios (e.g. lowering speed limits) across the city, as well as in individual districts like Brabrand.
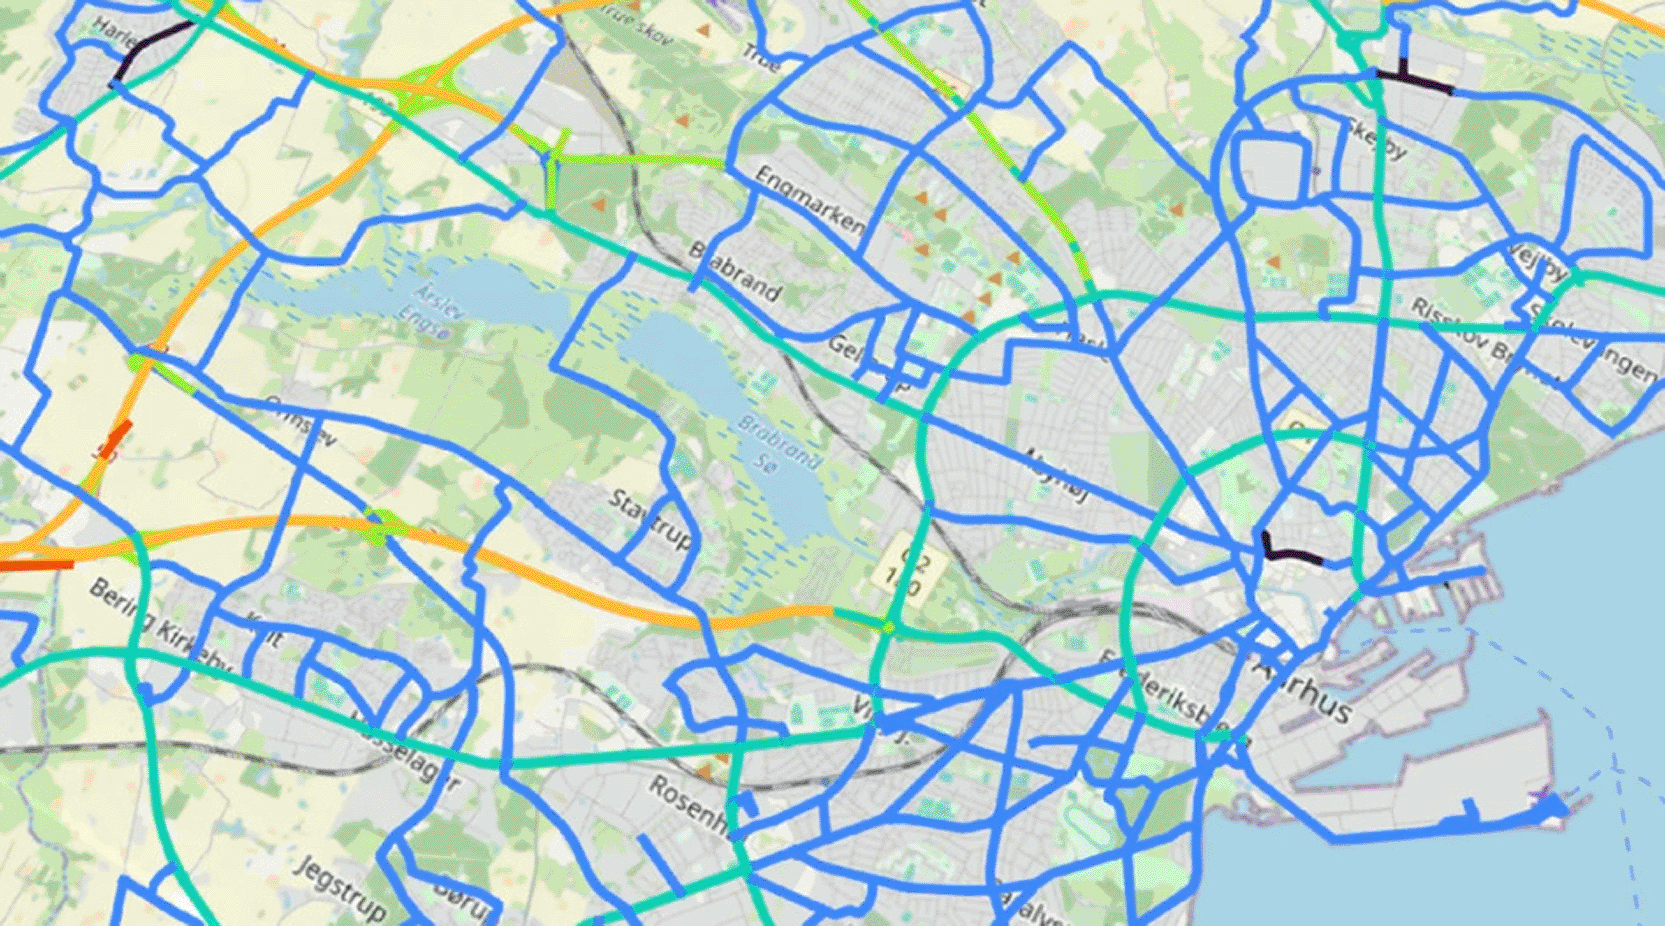
Figure 6. Aarhus traffic model.
The Digital Twin also has a microscopic traffic model. It uses flow information and average traffic volumes from aggregated outputs to simulate lower-level properties like the position and velocity of single vehicles. Detailed micro representations of traffic dynamics are particularly useful for studying the environmental impacts of mobility on air quality and noise within inner city areas. When combined with insights from the wind comfort analysis and green space accessibility assessment, the results can support evaluation of urban livability by showing how PED development is impacting the quality of life in Brabrand.
6.4 Energy and water supply map
A utility map from Center Denmark (currently called Energikortet) is developed to show supply systems for water, district heating, electricity, and gas, among others. The map has a focus on the topology of the energy and water supply systems, including for instance wind power generation, combined heat and power plants.
Figure 7 shows the supply system topology map for the city of Fredericia with a focus on district heating including the production facilities. As indicated in the figure, the map is also able to show power systems (transmission and distribution systems, transformers, etc.), gas systems, PtX systems, as well as water supply, and wastewater systems. The user is able to select the focus areas, and when a focus area is selected, the digital twin map includes possibilities for showing the relevant time series data.
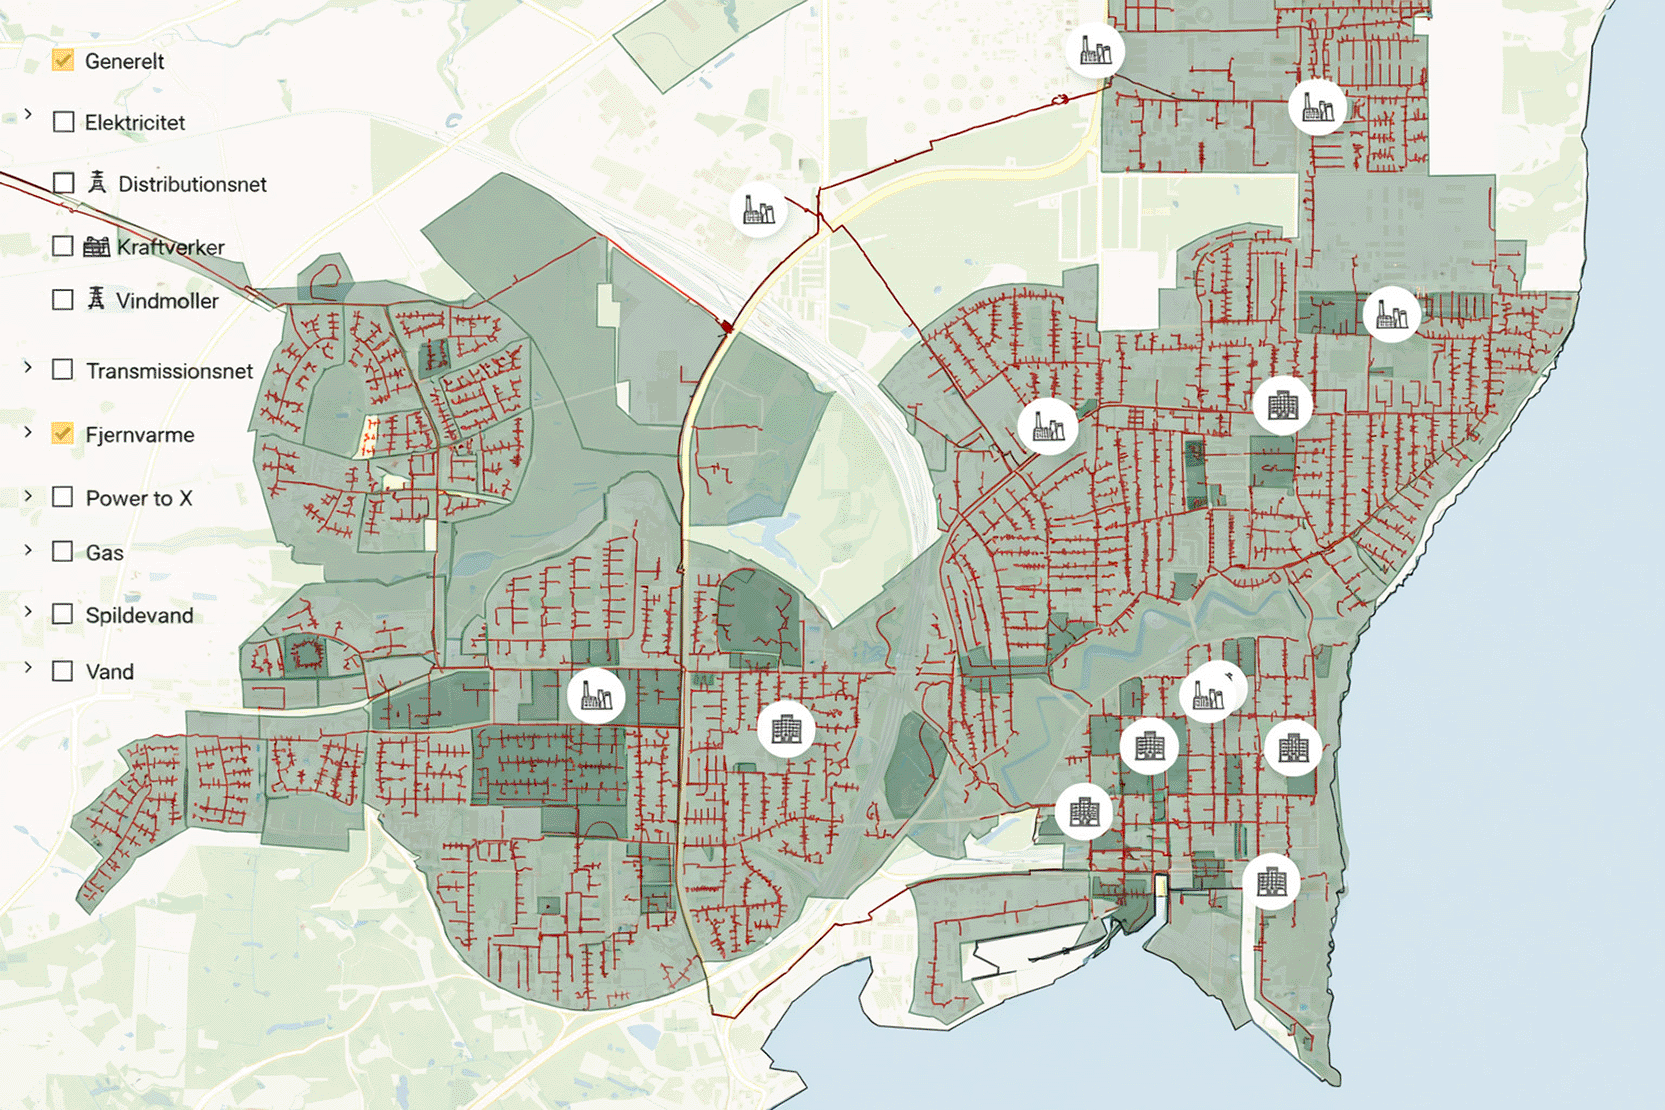
Figure 7. Energy and water supply map (Energikortet).
For the BIPED project in Aarhus the focus is on the district heating network. The district heating system is operated by Kredsløb, and Kredsløb has signed up for a special edition of the map developed for the district heating network and production facilities. This map is Varmeoverblikket. Varmeoverblikket is currently under development for Aarhus. In addition to advanced methods for showing the topology and the underground district heating pipes, Varmeoverblik will provide a possibility for showing the results from the heat load forecasting system, which has been developed in BIPED.
7. Conclusion: Digital Twin PED requirements
Digital Twin PED is an enabler of an ambitious transformation where districts produce more clean energy than they consume, ready to share this surplus with other urban areas in a city as it strives to become climate neutral. The district is represented virtually in sufficient complexity to account for the many things that make up the urban fabric. As such, a Digital Twin PED incorporates elements one would expect to find within district boundaries, from buildings and traffic, to energy flows, environmental conditions, and social dynamics.
If districts are diverse systems with many interconnected elements, then Digital Twin PEDs should also exhibit similar diversity and capture multi-way interactions that happen in the real world. From a technical perspective, the best way to achieve this dual objective is through syntactic and semantic standards. Internationally agreed sets of requirements like DCAT-AP, OGC API and CityGML improve information discovery and allow data and models to be integrated in a common virtual environment, a prerequisite for cross-domain simulations.
A Digital Twin PED enables virtual prototyping of measures that can help a district become energy-positive. How does building occupancy affect energy loads? Which flexibilities can be unlocked from having more energy prosumers in an area? What is the right mobility circulation plan for lowering CO2 emissions from transport? These are just some examples that illustrate the type of interventions that can be planned and optimised using a Digital Twin to support PED in achieving high levels of energy-efficiency, flexibility, self-consumption, and export capacity.
Most of this work would normally be carried out by professional urban or energy planners. But some simulation tools need to be simple enough to be used by non-experts, such as residents wondering if installing solar panels is right for them. A Digital Twin PED therefore caters to diverse audiences, and in so doing acts as a multi-use platform where top-down planning and bottom-up engagement come together to drive forward informed, multi-level governance needed for energy transition to succeed. In another BIPED publication we will explain how to engage stakeholders in the co-design of Digital Twin PED.
Cities looking to deploy a Digital Twin PED must be clear about the +energy concept they are dealing with so that technology can match the scale, diversity and complexity of the entity in question. Is the focus on a district or just buildings? The latter clearly have a better fit with the ZEB or PEB framework, in which case building-oriented digital tools like BIM might be more appropriate. But if the target entity is a district in a wide sense, then a PED’s Digital Twin would be a better concept-technology combination with which to capture urban properties and dynamics beyond the built environment. So, before doing any technical work on Digital Twin PEDs, the project should eliminate conceptual ambiguity by clarifying which +energy concept is being used (
Figure 8).
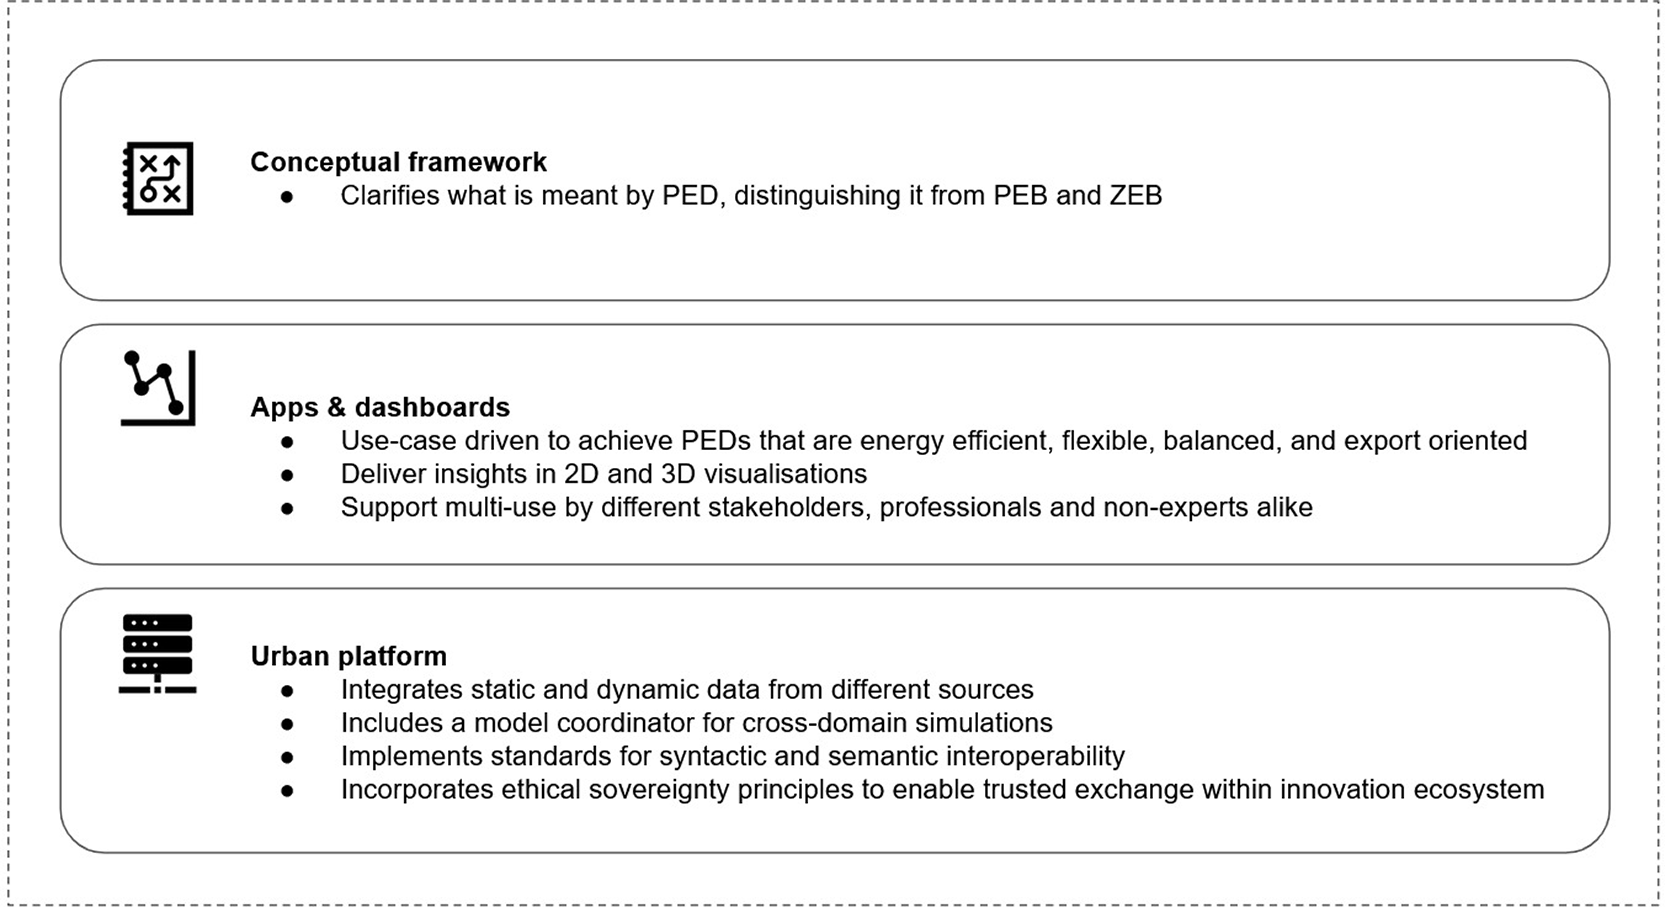
Figure 8. Digital Twin PED technical requirements.
A Digital Twin PED has to manage data, models and applications within an integrated, multi-layered architecture. This, in turn, requires an urban data platform which can process static and dynamic data, feed this information into models that can run in tandem, and provide modelled results in ways that can be used/understood by a variety of PED stakeholders. However, not everything that comes out of a Digital Twin PED has to be visualised in 3D. Many PED related use cases and their results (e.g. traffic flows, building occupancy, district heating loads) can be displayed in 2D dashboards without losing their explanatory value.
Finally, data, models and applications in a Digital Twin PED can be open or closed depending on conditions set by their owners. In some situations, access may be restricted if there is sensitive information involved, or because the owner would like to protect its intellectual property. To accommodate these requirements, a Digital Twin PED must incorporate sovereignty principles so that platform stakeholders can set their own terms for access, sharing and reuse of their digital assets. This would ensure that a Digital Twin PED is not just multi-faceted and interoperable on the inside, but also includes the necessary ethical, privacy and security guardrails to enable an innovation ecosystem built on trust.
Ethics and consent
Ethical approval and consent were not required for this study.
References
- BIPED:
BIPED Project Website.n.d. viewed 5 December 2025
Reference Source
- BIPED Consortium:
D2.1 Initial Release of the BIPED Digital Twin Platform , Horizon Europe.2024a.
Reference Source
- BIPED Consortium:
D2.2 BIPED Digital Twin Release 1, Horizon Europe.2024b.
Reference Source
- BIPED Consortium:
How BIPED is Helping Aarhus to Fast-Track Climate Neutrality by Building a Positive Energy District with Local Digital Twins.2025.
Reference Source
- BIPED Platform:
BIPED Digital Twin Platform.n.d. viewed 5 December 2025.
Reference Source
- Bouchal J, Matousek H, Jezek J:
Visualising Big Traffic Data in GLayer to Guide Policy Development.
ERCIM News.
2025; 140. January, viewed 8 July 2024.
Reference Source
- CINEA:
Digitalisation of Urban Energy Systems, European Climate, Infrastructure and Environment Executive Agency.2022.
Reference Source
- Civora:
Civora UI Repository, viewed 5 December 2025.n.d.
Reference Source
- EIP-SCC:
Strategic Implementation Plan.
European Commission;
2016.
Reference Source
- European Commission:
Smart Cities and Communities – European Innovation Partnership, Communication C(2012) 4701 final.2012.
Reference Source
- European Commission:
DCAT Application Profile for Data Portals in Europe (DCAT-AP).
Publications Office of the European Union;
2023.
Reference Source
- European Parliament and Council:
Directive 2010/31/EU on the Energy Performance of Buildings (recast).
Off. J. Eur. Union.
2010.
Reference Source
- Kogut:
Dataset for 'Technical requirements for a Digital Twin PED'. [Data set].
Zenodo.
2026. Publisher Full Text
- Kogut P, Schmitz E, Schilling A:
Local Digital Twins for Positive Energy Districts.
ERCIM News.
2024; 138. 4 July, viewed 8 July 2024.
Reference Source
- OGC:
OGC API – Processes Standard.
Open Geospatial Consortium;
2021.
Reference Source
- OGC:
CityGML Standard Overview, viewed 5 December 2025.n.d.
Reference Source
- PED-EU.NET:
PED Database, viewed 5 December 2025.n.d.
Reference Source
- SET-Plan:
Implementation Plan: Smart Cities and Communities.
European Commission;
2018.
Reference Source







