Introduction
Populations living in Pacific Island Countries and Territories (PICTs) have experienced rapid transitions in health, and social and economic changes. The transition started in the 19th century during the colonial period and then accelerated in the second part of the 20th century subsequently to the Second World War.1–2 Globalisation and industrialisation have increased the availability and the consumption of inexpensive and highly processed products.3,4 Traditional rural lifestyles, including customary, cultural, social, and livelihood activities, were modified into more Western and urban practices.5 This resulted in a shift in nutritional and physical activity behaviours, with significant impacts on health.3–6 In many PICTs, more than 50% of the total population and about 30% of adolescents are now overweight or obese.7,8 This is concerning given that weight status is a factor associated with noncommunicable diseases, such as type 2 diabetes.9,10 More recently, the easy access to digital technologies, including devices like smartphones and tablets, and the social media platforms that generate vast amounts of content, have shown to influence social representations, everyday behaviours, and mental health, especially among young people.11,12
Previous studies have examined adolescents living in PICTs including those in New Caledonia,13,14 however, there remains limited information about adolescents living in Vanuatu. One earlier study from 2007 surveyed 715 individuals, including 513 children and adolescents, for anthropometric information, yet recent evidence is lacking.15 To address this gap, the current study primarily aimed to obtain reliable and up-to-date information in the behaviours, lifestyles and health of adolescents living in Vanuatu. A variety of data was collected including dietary habits, sleep patterns, well-being, the use of digital technologies, and objective measurements of weight status and physical activity. A second aim was to explore the potential associations between these factors in order to gain a better understanding of those associated with body weight status. This data note presents a dataset of 213 adolescents living in Vanuatu (female: 119; male: 92; unknown: 2) collected between June and July 2023.
Although the number of participants is relatively low, the diversity of the dataset’s content is quite exceptional, allowing the cross-referencing of information such as screen time, diet and physical activity. This is why the data described here may be used in future studies across various scientific fields. In addition, while the population we studied was hard to reach, most of the tools we used are standard, allowing comparisons with results from studies that have employed the same tools. The accelerometer data are also very precious for a better understanding of general behaviour regarding sleeping and physical activity. The time series nature of these data may also be of interest for model building and testing new methodologies.
Materials and methods
Context
The data collection followed the framework of the European Family Farming, Lifestyle and Health in the Pacific (FALAH) project (n° 873185).16 This European project brought together 95 researchers and teaching-based researchers based in Europe along with partners in Australia, Fiji, New Caledonia, Solomon Islands, and Vanuatu. Its main aim was to build a network of research teams operating in the Pacific Islands that share a common interest in food security and its direct or indirect links with the environment, lifestyle and health. The expected outcome was to promote and revitalise family farming in order to improve the health of Pacific populations and strengthen food security. The data presented in this data note relates primarily to the third work package of the FALAH project, which focused on knowledge exchange.
Vanuatu is an archipelago located in the South Pacific Ocean between 166–172° E longitude and 13–21° S latitude (Figure 1). It is divided into 6 provinces (Malampa, Penama, Sanma, Shefa, Tafea, and Torba). There are only 2 towns: Port-Vila, the capital city, on Efate island, and Luganville on Espiritu Santo island. In 2020, it has been estimated that more than two third of the population lived in rural areas.17 In 2024, there were more than 320000 inhabitants, approximately 20% of whom were aged between 10 and 19,18–20 and the population estimate is now, in 2026, beyond 340 000.21 The locations chosen as part of this study were Efate in Shefa Province and Esperitu Santo in Sanma Province because they are different islands that made it possible to reach people living in both urban and rural areas (Figure 1). There are 138 indigenous Oceanic spoken languages, and the official languages are Bislama, English, and French. Bislama is the language most commonly used in everyday life, especially among non-isolated populations, while English or French are languages generally used for teaching in secondary schools.22–24 Discussions with the participants therefore took place in English or French.
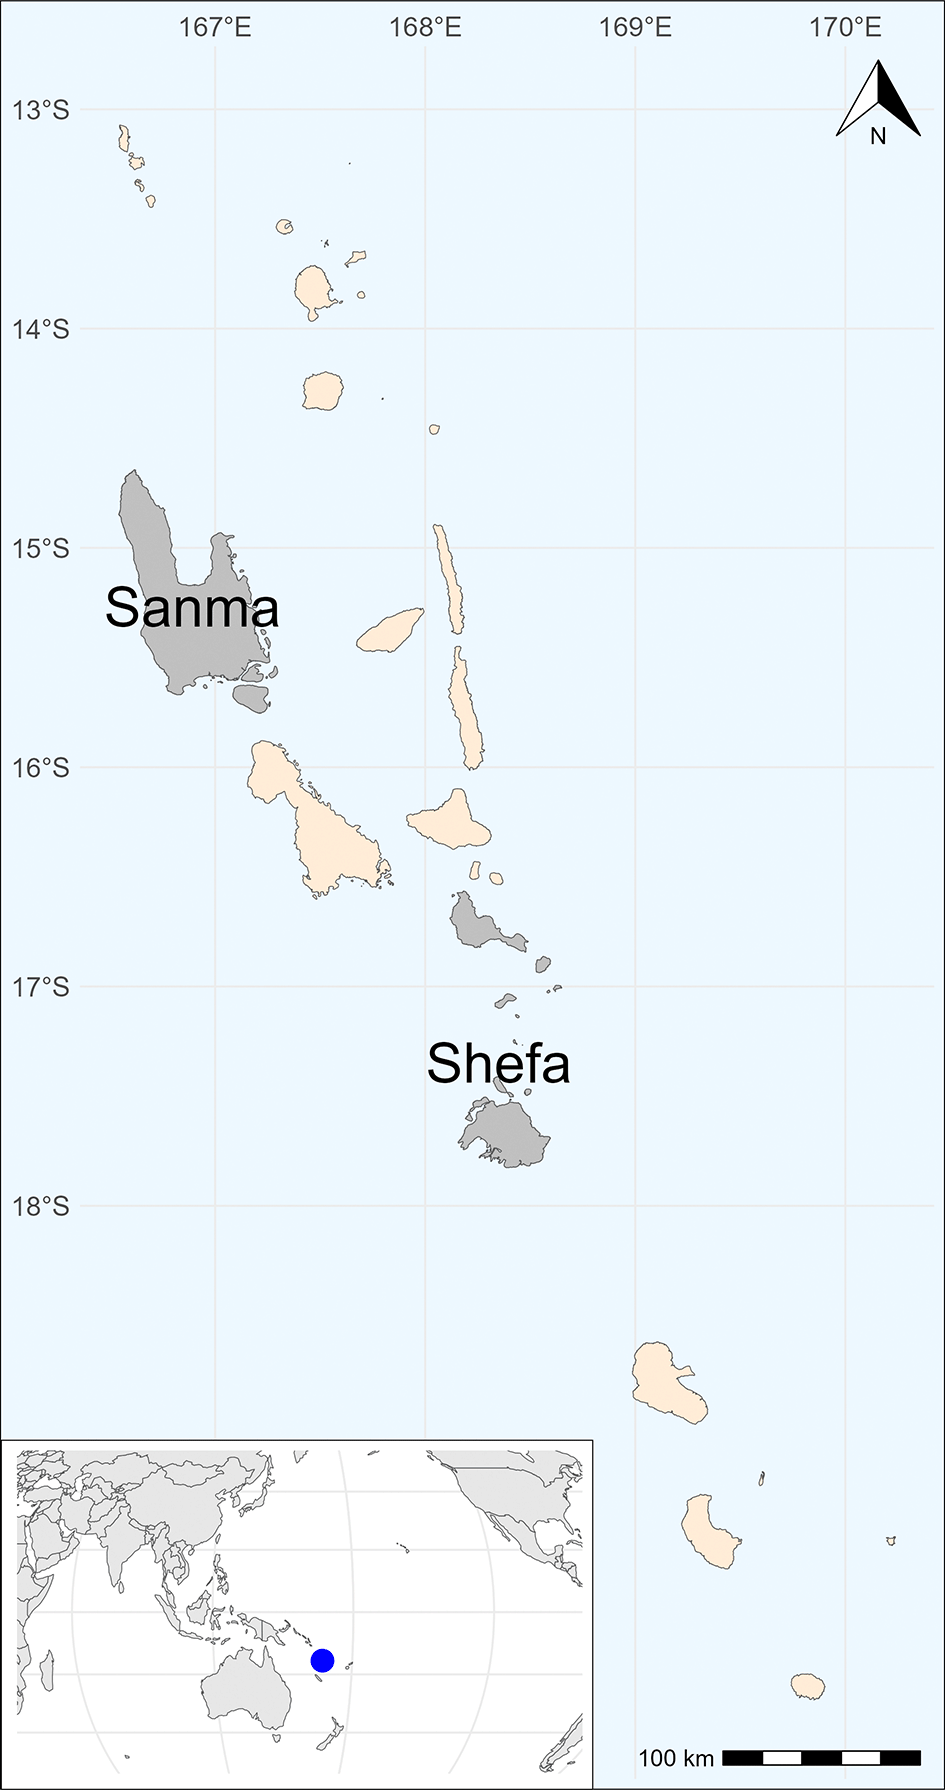
Figure 1. Map of Vanuatu: Sanma and Shefa provinces.
Even though there are faith schools and private schools, education is mainly provided by the government through the management of the Ministry Of Education and Training.25 No school fee is applied from early childhood care and education to Year 10. The free education is planned to be extended to Years 11 to 13.26 Approximately half of the adolescents of the intended age for junior secondary education attends the corresponding level, and around a quarter attend senior secondary education.19 Although there are English and French schools, the curriculum is harmonised in one system as it is depicted in the legend of the twin’s sand drawing.23 Peralta et al. 2025 also briefly described the Vanuatu’s basic science and agriculture syllabus, which addresses health education, including information on nutrition and, more generally, healthy habits in everyday life.27
Recruitment of the participants
The data presented here was collected in a pilot study. Two secondary schools were selected based on several criteria including their living environment context (rural/urban), their island location (Efate (Shefa) /Esperitu Santo (Sanma) that are the most populated islands, see Figure 1), the class levels available (from years 9 to 11), and the availability of sufficient number of students (with at least 150 expected during one single field trip, i.e. in only one school visit).
Based on these criteria, two schools were identified and then visited during the initial field trip to Vanuatu in October 2022. During this visit, members of the research team met with the principals and the deputy principals to explain the study in detail, including its design and expected outcomes. The team also reviewed the school curriculum, student environment, and the school grounds to better understand the educational context. Both principals agreed for their school to participate in the pilot study.
Data collection occurred in June 2023 during a second field trip. Before data collection, the principal or deputy principal was asked to select four different classes between levels 9 to 11. The potential student participants and their parents were provided with written information about the research objectives, outlining the details of the research study, and the nature of student involvement. The document also included an opt-out form for parents who did not want their child to participate. If no signed note was returned, it was understood as consenting to their child’s involvement in the study. The external students took the participant information sheet home to share with their parents or legal guardians. For the boarding students who were unable to return home to provide written parental consent, the researchers obtained verbal consent from community authorities (principals, directors, teachers). Although consent is sought in research from both parents and adolescents for studies involving vulnerable populations, including young people, in Vanuatu, when parents are not available, it is customary for an authority figure (such as a teacher, school director, or a Kastom leader) to approve the ethical aspects of the study, in line with local practice.28
Students were free to opt out and decline participation at any point. In addition to parental consent, all adolescents provided individual written consent through the submission of the online survey.
Materials
Personal information including sex and birthdate of students, was collected from the administrative school staff. The questionnaires that the participants were asked to complete consisted of a panel of tools which are described and available at 29 in their English version and 30 in their French version. The school located at Efate was a French school whereas the school located at Santo was English-based. The first part of the questionnaires included: (1) an adaptation of the Food Frequency Questionnaire developed by Gwynn et al. 201131; (2) a questionnaire about the perception of water, especially water quality, at school; (3) an adaptation of the questionnaire to assess barriers and facilitators to physical activity developed by Arlinghaus et al. 202132; (4) a questionnaire about sleep habits and behaviours with questions based on the Pittsburgh Sleep Quality Index, and partly used by a previous study33,34; (5) sociodemographic information such as the mother’s and father’s job. The second part of the questionnaire included: (1) the ethnic community membership developed by Phinney 199235; (2) a questionnaire about the use of new technologies and media with questions developed and used in a previous study36; (3) questions about the use of digital tools for health; (4) the 5-item World Health Organization Well-Being Index (WHO-5)37; (5) two questions to assess the perception regarding health and weight; (6) the BMI-based silhouette matching test as a body-image perceptions tool developed by Peterson et al. 2003.38
Anthropometric measurements included height, weight, and waist circumference. Height was measured to the nearest 0.1 cm with a Leicester Tanita HR 001 (Tanita corporation, Tokyo, Japan) and weight was measured to the 0.1 kg with a Tanita DCM-430MA (Tanita corporation, Tokyo, Japan). Waist circumference was measured at the midpoint between the lowest rib and the iliac crest with a tape measure that was placed horizontally. Each measurement was taken twice to the nearest 0.1 cm at the end of a normal expiration. If a difference greater than 0.5 cm was noted between the two measurements, then a third measurement was taken, and the average of the two nearest values was kept as the recorded value.
Sexual maturity of the participants was assessed with the Tanner scale,39–41 which ranges from 1 (pre-adolescence) to 5 (mature stage).
Physical activity of the participants was assessed using a 60-Hz triaxial GENEActiv accelerometer (Activinsights Ltd, Kimbolton, UK) worn for 5 to 7 consecutive days, including weekends. Data were extracted from the devices using the Data Extractor of the GENEActiv software. This produced the .bin files.42,43
Methods for data derivation
Age in months was calculated from each participant’s birthdate and the date of the research intervention. Age in years was then determined by rounding the age in months divided by 12 to the nearest whole number. Participants’ ages in years were grouped into three categories: “Between 14 and 15 inclusive”, “Between 16 and 17 inclusive” or “Greater than or equal to 18”. Place of residence (rural or urban) was determined based on the school location and the European standard to assess the degree of urbanisation.44
Body mass index (BMI) was calculated from weight (in kg) and height (in m). Weight status was determined based using four different BMI-based definitions: International Obesity Task Force (IOTF) references,45 French references,46 World Health Organisation (WHO) references,47 and Centers for Disease Control and Prevention (CDC) references.48,49 The procedure, described in Wattelez et al. 2025, followed established methods using the reference centiles and Lambda-Mu-Sigma (LMS) values to classify the weight status and compute the BMI z-scores.14 The resulting weight status categories are: Underweight, Normal weight, Overweight, and Obese. Note that in the French reference system, the Obese category is absent.
BMI-based Healthy weight status was also derived from each participant’s sex, age and BMI.50,51 This indicator includes four categories: Very lean, Healthy Fitness Zone (HFZ), Needs Improvement (NI), and Needs Improvement – Health Risk (NI – Health risk). For confidentiality purposes, the original 4-level categories were merged into binary categories in the tables presented in this paper.
A GENEActiv accelerometer records acceleration in the 3 axes (x, y, and z), temperature in °C, and light in lux in a 60-Hz frequency. This data is available in the .bin files with metadata.42,43 From the 3-dimension acceleration signals (
,
,
) recorded in 60-Hz frequency, the signal vector magnitude (SVMg) is aggregated into 1-second epochs and deduced based on
Equation 1.52,53
(1)
Experimental conditions
Questionnaire and anthropometric data were collected over two consecutive days in each school during class time. At least two members of the research team were present in the classroom alongside the teaching staff during completion of the questionnaire to clarify or answer any questions. The teachers were instructed to provide definitions only, and not to give any examples to avoid influencing students’ answers.28 Depending on the resources available at the school, the questionnaires were completed via a REDCap mobile app on digital tablets provided by the research team, or online on computers in a computer room using the same REDCap questionnaire hosted by the University of New Caledonia.54,55 The participants could choose to complete the questionnaire in their preferred language, either English or French.
Groups of approximately five participants were formed based on sex and the alphabetical order, for the anthropometric measurements in the school sick bay. While the participants completed the questionnaires, two members of the research team collected the group of participants who were to be measured. The anthropometric measurements were taken while the participants were in light clothing by or with the school nurse and recorded by a trained staff of the research team. For sexual maturity, each participant was interviewed individually by a member of the research team: female participants were interviewed by a female team member and male participants were interviewed by a male team member. The participants were individually shown the Tanner board corresponding to their sex and asked to select the stage that best matched the illustrations, and the number chosen was then recorded. Once all measurements were completed, the research team members escorted them back to the classroom and collected the next group of participants to be measured. The combined time required for questionnaire completion and anthropometric assessment was approximately 1 hour and 30 minutes.
The research team randomly selected 39 students enrolled in the Efate school and 34 participants enrolled in the Santo school to wear a 60-Hz triaxial GENEActiv accelerometer (Activinsights Ltd, Kimbolton, UK) for five to seven days. After determining whether the participant was right-handed or left-handed, a trained researcher fitted the device on the dorsal side of the participant’s nondominant wrist. Each participant was reminded to keep the device on until it was collected by a research team member or by the school staff. They were also instructed to continue their normal everyday activities (sports, physical activity, shower, sleep, nap, cleaning, etc.) and to wear it both day and night, except during particular activities that could pose a hazard (combat sports for instance) or safety issue. At the end of the 5-to-7-day wear period, if the research team was unable to return to the visited school, the devices were collected by the school’s administrative team and sent back to the research team by air freight at the cost to the research team. Upon receipt, the data was downloaded with the GENEActiv software following the procedure previously described.
Anonymisation
As it is generally accepted, including under the General Data Protection Regulation (GDPR), a dataset is considered anonymised when the risk of reidentification is very low, even when combined with additional data from external sources. On the contrary, if the risk of reidentification is not negligible, then the dataset is regarded as non-anonymised. Note that the primary dataset contains non-anonymised information that cannot be openly available. However, to allow access to a part of this dataset, it has been anonymised by removing sensitive or highly identifying information, such as ethnic community. When possible and appropriate, certain information has been blurred. For instance, rather than providing ages in months or years, the anonymised dataset contains age ranges aggregating 2-year
ages.
The GENEActiv .bin files that may contain identifying information through their metadata have been aggregated from 60-Hz record into 1-second-epoch records. The output has been stored into both.csv and.RData files. The processed was implemented with R and its GENEAread package.53,56 It is described into the repositories through the available R scripts.
Description of the datasets
Table 1 describes the content of the repositories that make up the datasets. For consistency due to Zenodo’s size limitations, both the non-anonymised and anonymised datasets are each distributed across three repositories: one containing all participant information and two repositories containing the accelerometer data.
Table 1. List of the repositories that contain the dataset.
| Title | Content | DOI | Number of files | File size (in Gb) |
|---|
| Anthropometric measurements and questionnaire responses collected from adolescents living in Vanuatu during FALAH project (non-anonymized information)57 | Non-anonymised information about the participants including their anthropometric measurements and their questionnaire responses. Two files contain similar information, one in .xlsx format for convenience and the other in .csv format for interoperability. | 10.5281/zenodo.18795680
| 2 | ~ 10−3 |
| Anthropometric measurements and questionnaire responses collected from adolescents living in Vanuatu during FALAH project (anonymized information)58 | Anonymised information about the participants including their anthropometric measurements and their questionnaire responses. Two files contain similar information, one in .xlsx format for convenience and the other in .csv format for interoperability. | 10.5281/zenodo.18829783
| 2 | ~ 10−3 |
| GENEActiv accelerometer files collected in Vanuatu during FALAH project (non-anonymized version - first part)59 | First part of the raw .bin files directly downloaded from the GENEActiv devices with the cradle and the Data extractor of the GENEActiv software. These are 60-Hz records with metadata potentially identifying. | 10.5281/zenodo.14043546
| 39 | 29.5 |
| GENEActiv accelerometer files collected in Vanuatu during FALAH project (non-anonymized version - second part)60 | Second part of the raw .bin files directly downloaded from the GENEActiv devices with the cradle and the Data extractor of the GENEActiv software. These are 60-Hz records with metadata potentially identifying. | 10.5281/zenodo.14089526
| 33 | 14.5 |
| GENEActiv accelerometer files collected in Vanuatu during FALAH project (anonymized version - first part)61 | First part of the .csv and .RData files converted from the GENEActiv .bin files. This repository also contains the participantCharacteristics.csv file giving the list of the participants having worn an accelerometer with their basic information (age range and sex) as well as the period they wore the device (starting day and day of removal), and the repository DOI where to find each file. The read_a_binFile_share.R is an R script showing the process for data conversion from 60-Hz .bin files into 1-second-epoch .csv (or .Rdata) files. | 10.5281/zenodo.14043331
| 80 (2 x 39 + 2) | 5.7 |
| GENEActiv accelerometer files collected in Vanuatu during FALAH project (anonymized version - second part)62 | Second part of the .csv and .RData files converted from the GENEActiv .bin files. The content of this repository is similar to those containing the first part. | 10.5281/zenodo.14089477
| 66 (2 x 33 + 2) | 4.1 |
The supplementary Table S1 describes the participant-related information included in the dataset, organised into 17 sections, and specifies which information is open and which is restricted. The restricted information is not included in the anonymised dataset. Section 1 contains the main participants’ personal information, such as sex, age and place of residence. Section 2 includes accelerometer-related information, and is completed only when a participant has worn a GENEActiv device. Sections 3 to 5 contain anthropometric measurements and derived indicators, which can be used to compute participants’ weight status for instance. The last sections, 6 to 17, contain the participants’ responses to the questionnaires.
As participants spoke either English or French, the French questions and responses for close-ended questions were translated to English. Responses to open-ended questions were left in the original language, whether written in English, French, Bislama, or another language.
Dataset validation
In this section, we propose an overview of the dataset content through descriptive tables and figures for a selection of variables.
Description of the participants
Table 2 describes the 213 participants involved in the data collection in terms of sex, place of residence, age range and ethnic community.
Table 2. Description of the participants.
| Factor | Category * | n (%) |
|---|
| Sex | Female | 119 (56) |
| Male | 92 (43) |
| Place of residence | Rural | 89 (42) |
| Urban | 124 (58) |
| Age range | Between 14 and 15 inclusive | 72 (34) |
| Between 16 and 17 inclusive | 86 (40) |
| Greater than or equal to 18 | 22 (10) |
| Ethnic community # | European | 90 (42) |
| Melanesian | 75 (35) |
| Other | 30 (14) |
Distribution of weight status
Table 3 describes the weight status distribution of the participants according to the four references previously mentioned,45–49 and the distribution of their BMI-Healthy weight status.51
Table 3. Distribution of the participants’ weight status and BMI-Healthy weight status.
| Reference | Category * | n (%) |
|---|
| IOTF Weight status | Underweight or normal | 121 (57) |
| Overweight or obese | 27 (13) |
| WHO Weight status | Underweight or Normal | 123 (58) |
| Overweight or obese | 29 (14) |
| Cachera Weight status | Underweight or normal | 134 (63) |
| Overweight or obese | 20 (9) |
| CDC Weight status | Underweight or normal | 128 (60) |
| Overweight or obese | 26 (12) |
| BMI-Healthy weight status | Very lean or HFZ | 128 (60) |
| NI or NI health risk | 26 (12) |
Questionnaires
Figure 2 is bar graphs describing the responses from 206 participants to a selection of 10 questions from the Food Frequency Questionnaire.31 The distributions of the responses are shown for the following food items: vegetables, fruits, water, soft drinks, rice, pasta, roots and tubers, traditional meals, confectionary, and sweet foods. Participants could choose a single option among 5 to 12, according to the considered question.
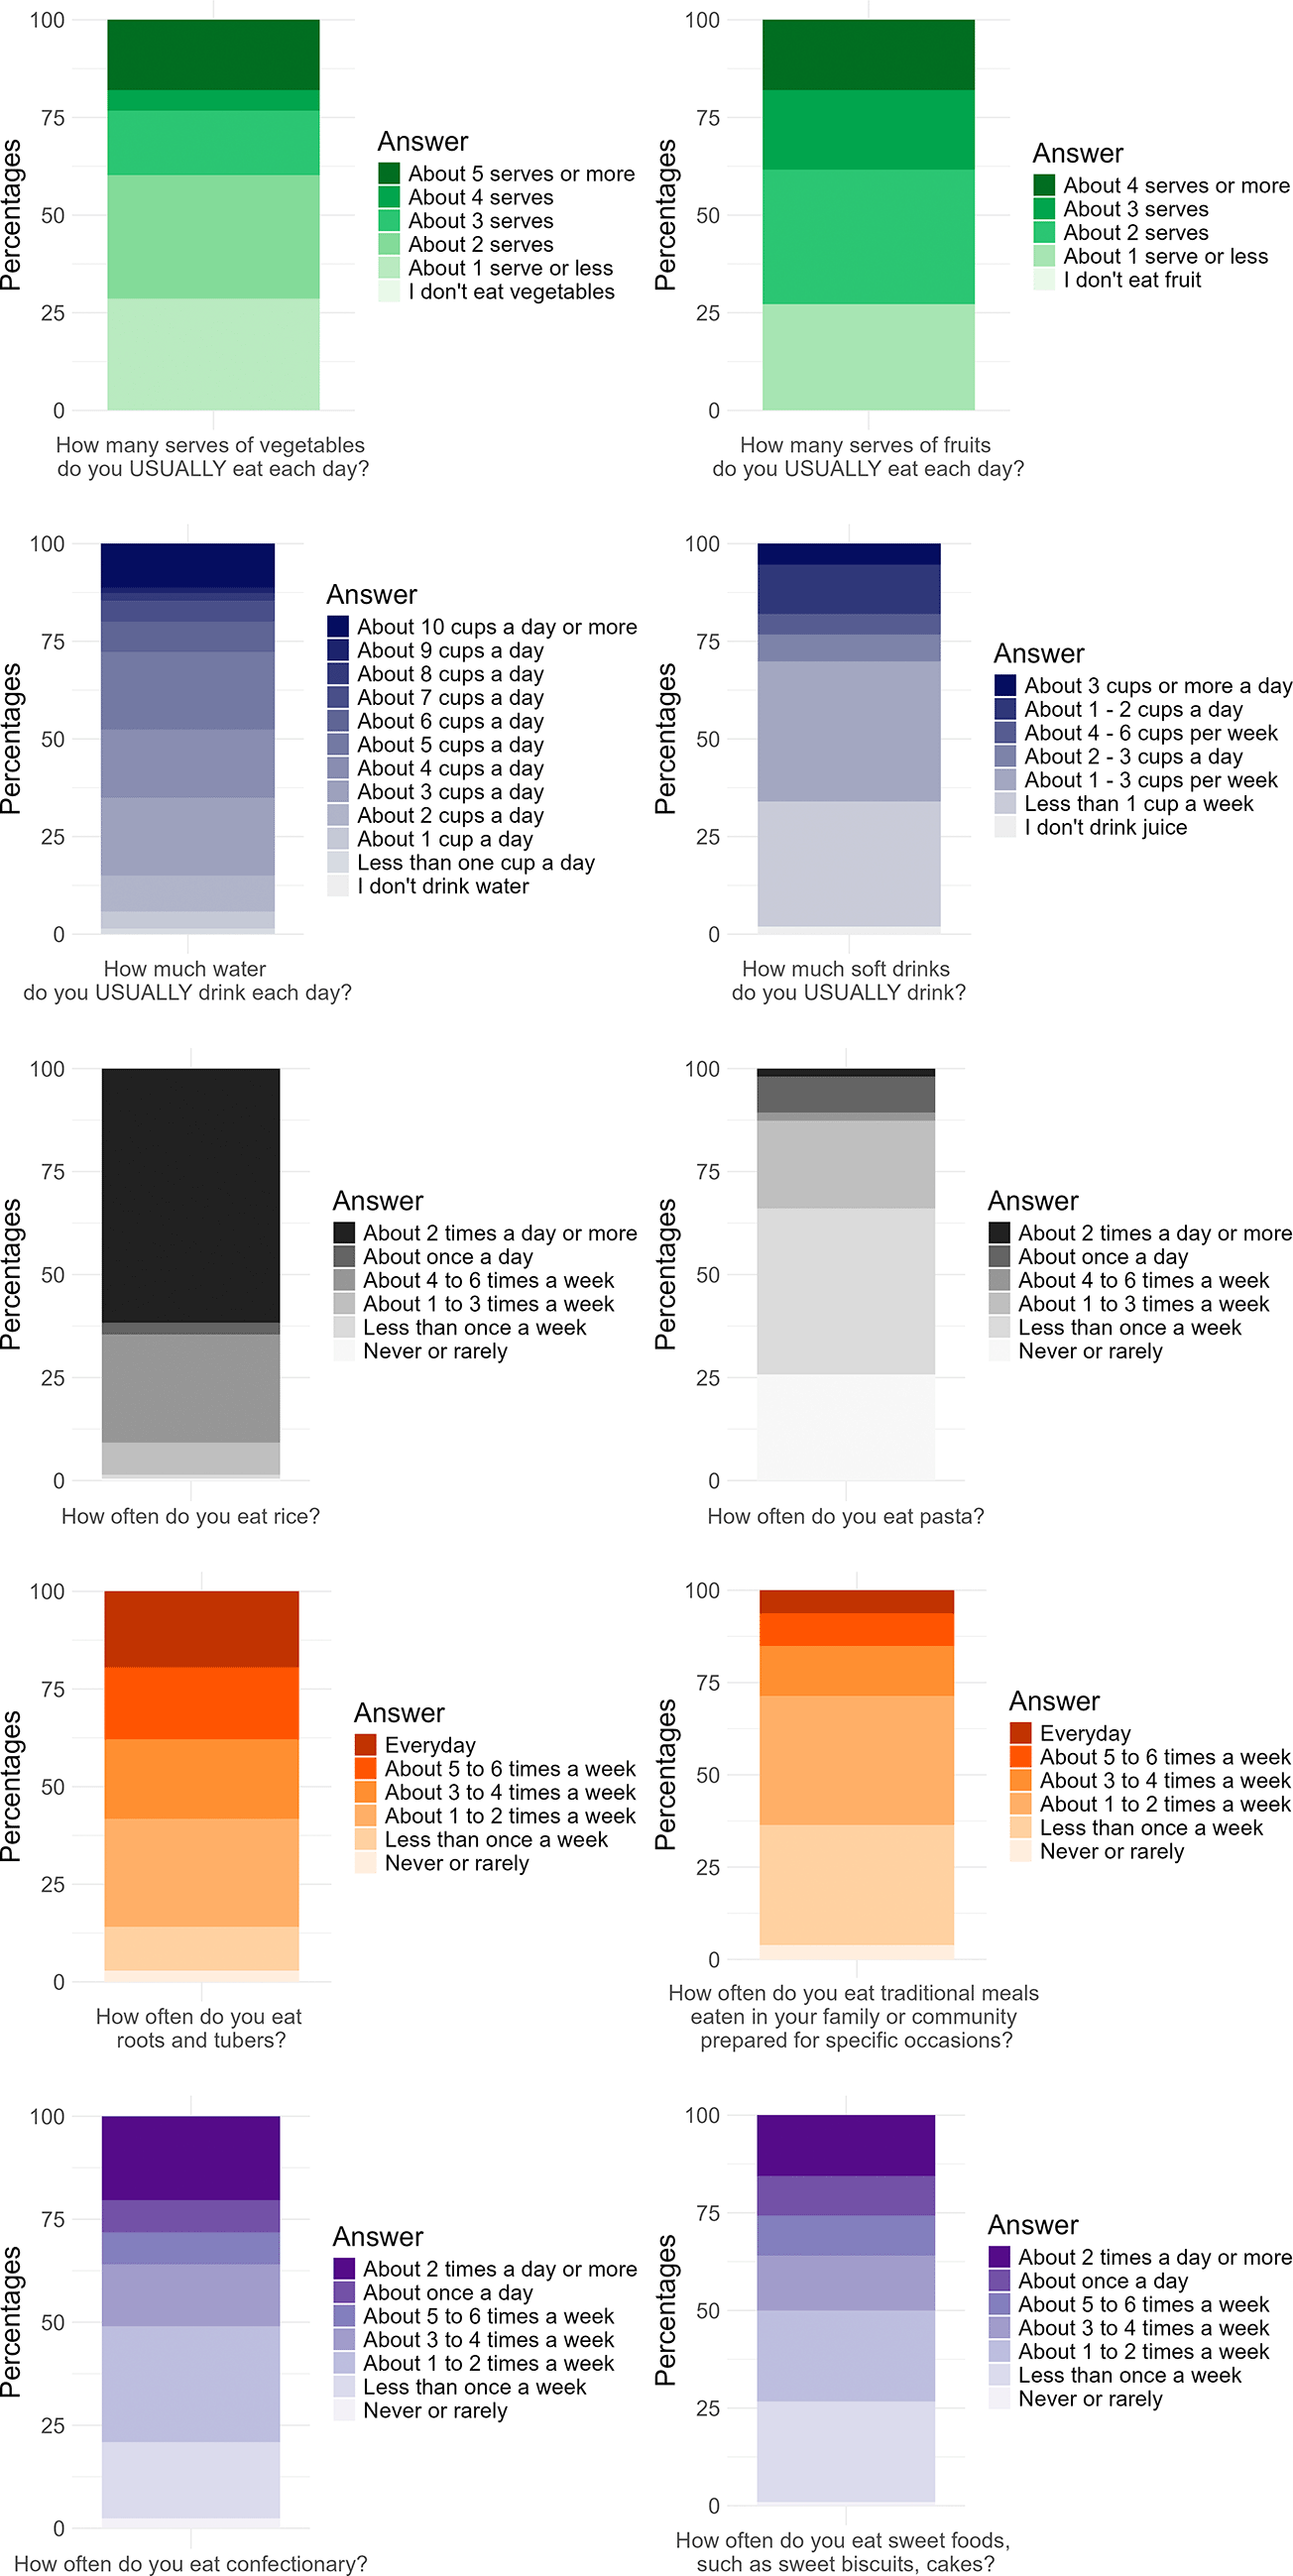
Figure 2. Participants’ responses to a selection of the “Food frequency questionnaire”31 (from top to bottom and from left to right): 1) How many serves of vegetables do you USUALLY eat each day? (A ‘serve’ is a half- cup of cooked vegetables or 1 cup of salad vegetables). 2) How many serves of fruit do you USUALLY eat each day? (for example, papaya, banana, mango, orange, apple, etc.). 3) How much water do you USUALLY drink each day? This can be plain tap water or bottled water. 4) How much soft drinks do you USUALLY drink (juice, soda, lemonade, coke, etc.)? 5) How often do you eat rice? 6) How often do you eat pasta? 7) How often do you eat roots and tubers (taro, yams, sweet potatoes, etc.)? 8) How often do you eat traditional meals eaten in your family or community prepared for specific occasions? 9) How often do you eat confectionary (such as lollies and chocolates)? 10) How often do you eat sweet foods, such as sweet biscuits, cakes?.
Figure 3 is a bar graph about the distributions of the responses from 196 participants for the Water at school questionnaire. Participants could choose a single option on a 5-point Likert scale, from “Not agree at all” to “Completely agree”).
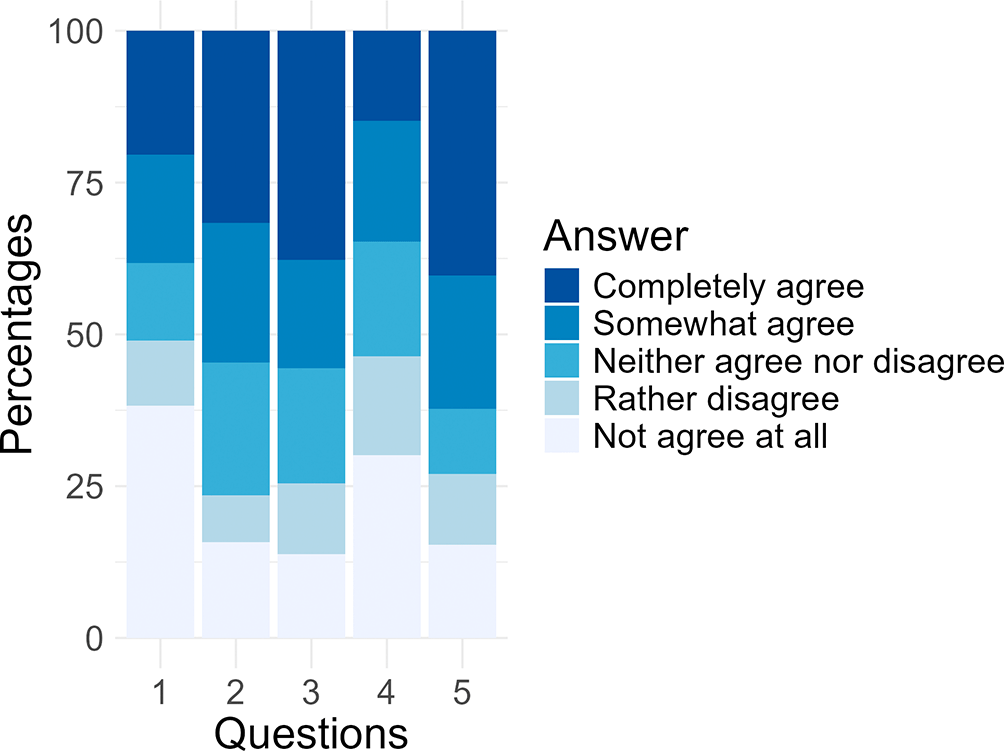
Figure 3. Participants’ responses to the questionnaire entitled “Water at school”. The questions were: 1) Drinking tap water in my school is fine with me. 2) The water from my school taps could make me sick. 3) School water taps are generally not clean. 4) The water from my school taps tastes good. 5) My school’s tap water contains unhealthy chemicals.
Figure 4 is composed with two bar graphs describing the distributions of the responses provided by 188 and 195 participants respectively for the questionnaires about barriers and facilitators for physical activity.32 There were 5 available options for a single choice, from “Never” to “Almost always”.
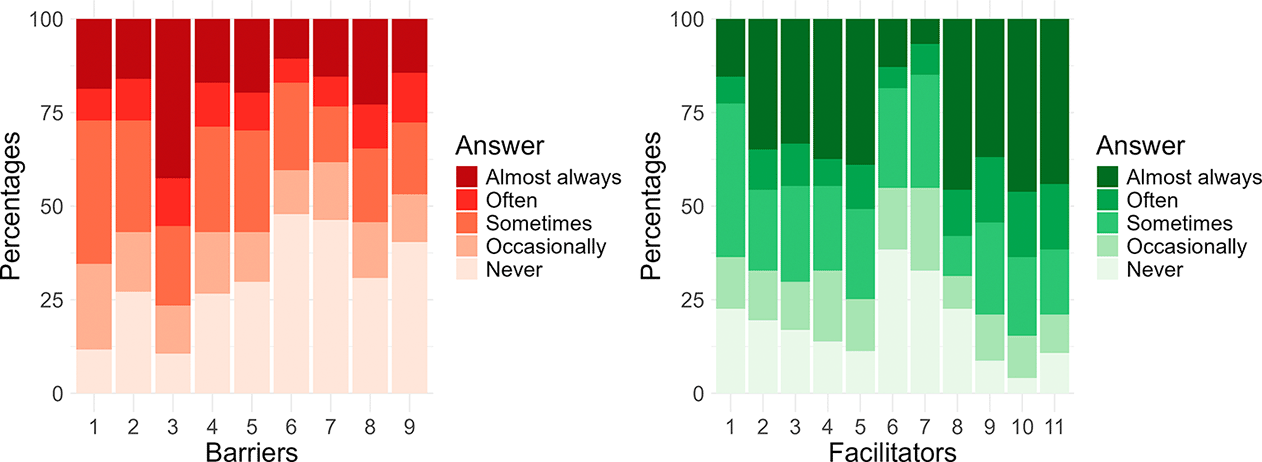
Figure 4. Participants’ responses to the questionnaire entitled “Barriers and facilitators for physical activity”.32
The questions regarding the barriers were: 1) I would rather watch television. 2) I would rather play video games or use the computer for fun. 3) I would rather use my phone. 4) Physical activity is too much work. 5) My friends do not like physical activity. 6) My friends tease me during physical activity. 7) There is no place near my home or my school to do physical activity (field, swimming pool, bike path…). 8) I don’t have the equipment I need for physical activity (shoes, bike, ball, jumping rope, …). 9) There is not a safe place for physical activity. The questions regarding the facilitators were: 1) Family members do physical activity with me. 2) I am in a sports team. 3) I play with my sibling(s). 4) Friends do physical activity with me. 5) Parent(s) encourage me to get physical activity. 6) Parent(s) provide transportation to get physical activity. 7) Parent(s) exercise. 8) I have fun during physical activity. 9) I am good at physical activity. 10) I know that it is good for me, and this motivates me to get physical activity. 11) I feel better afterwards, and this motivates me to get physical activity.
Figure 5 represents the distributions of the responses from 199 participants regarding a selection of 4 questions from the sleep questionnaire33,34: time of falling asleep in week days and in weekends, and wake-up time in week days and in weekends. Participants could choose a single option among a set of times.
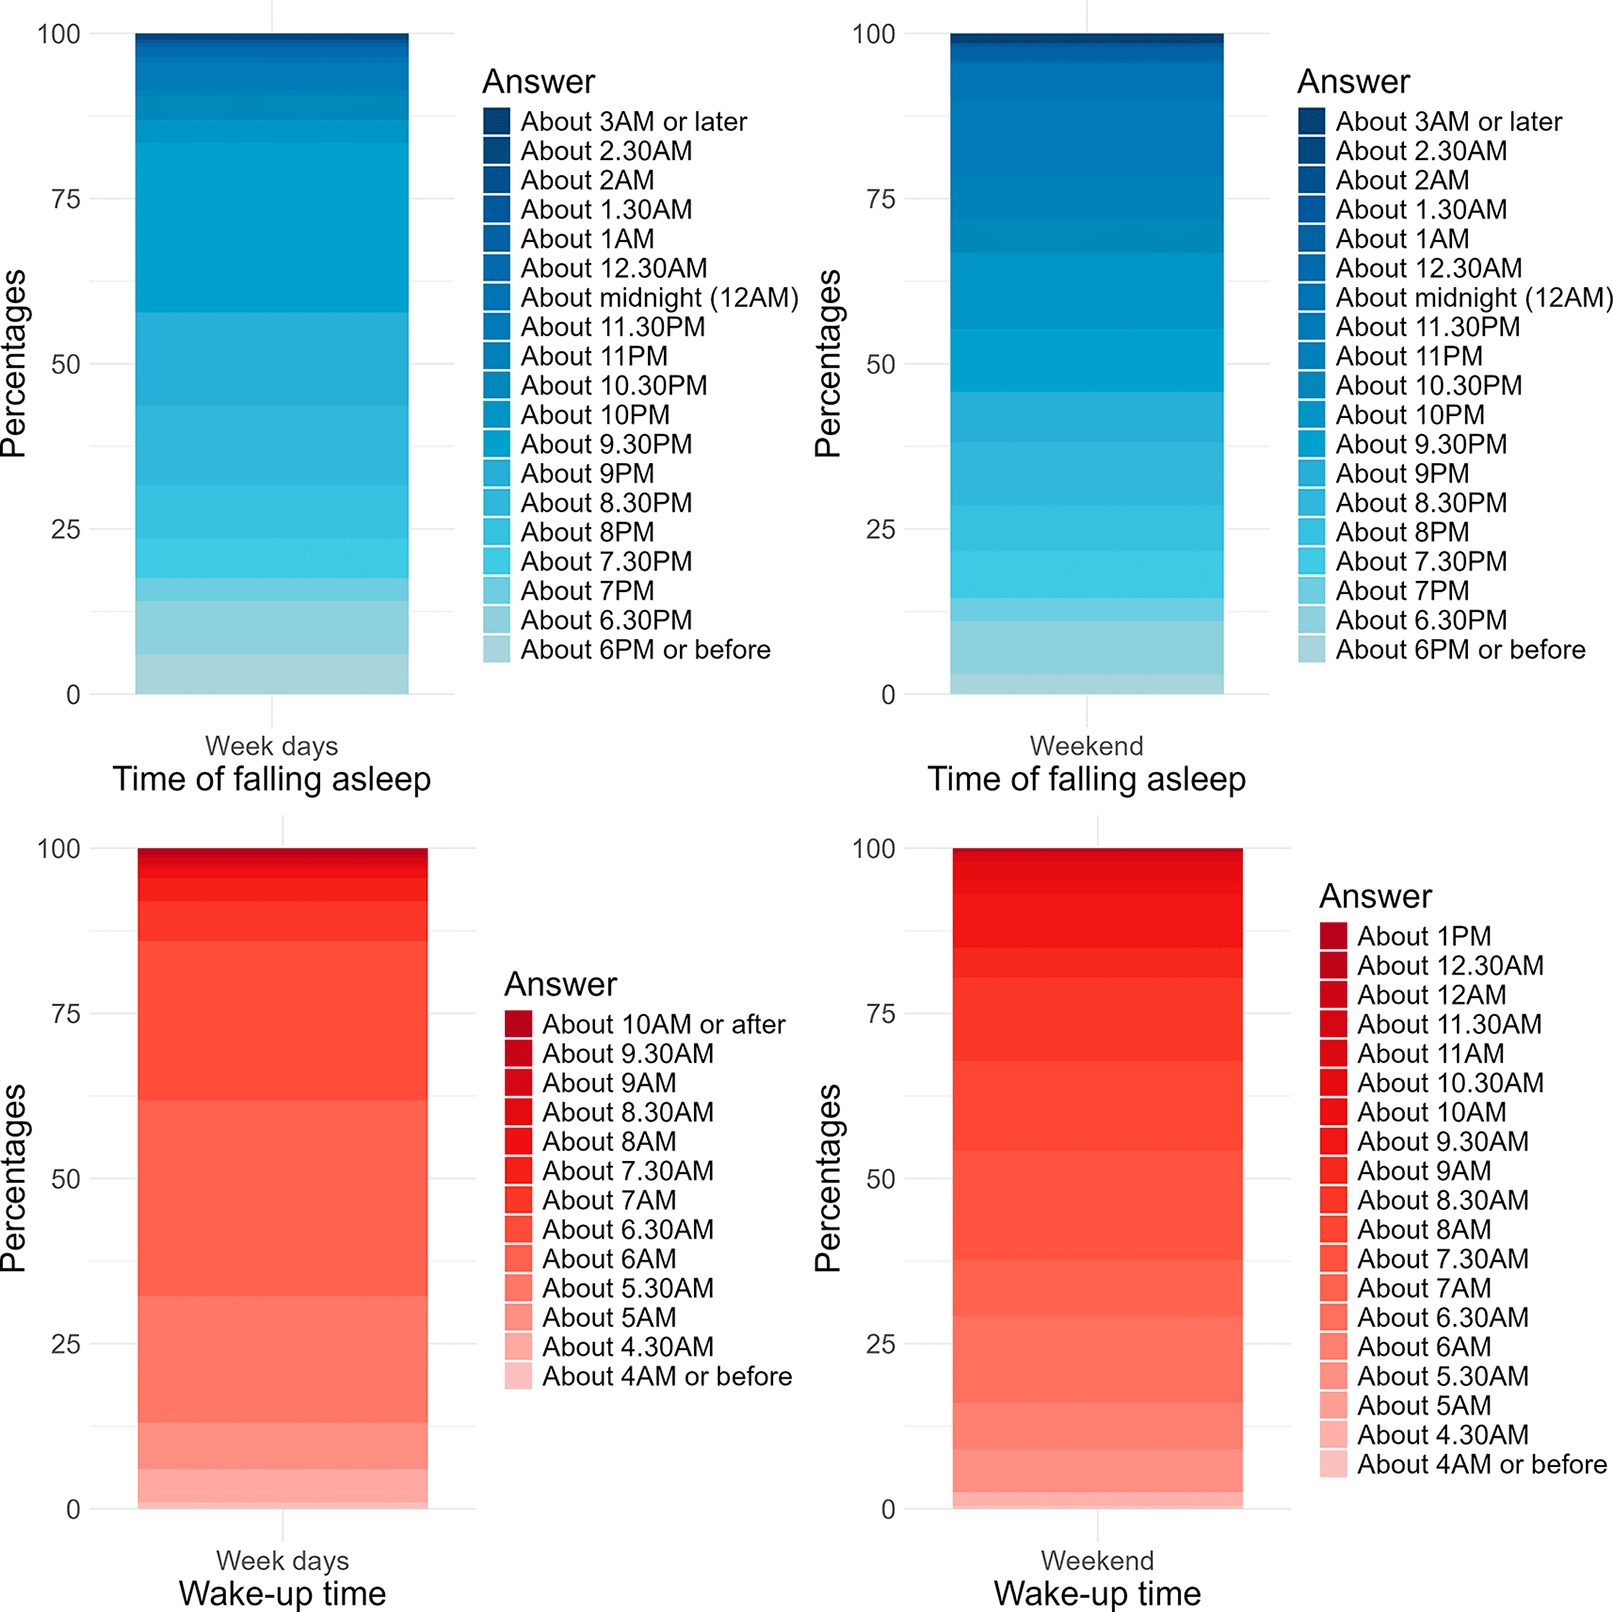
Figure 5.
Participants’ responses to a selection of the “Sleep” questionnaire33,34 (from top to bottom and from left to right): 1) What time do you usually fall asleep when you go to school the day after? 2) What time do you usually fall asleep when you don’t go to school the day after? 3) What time do you usually wake up when you go to school in the morning? 4) What time do you usually wake up when you don’t go to school in the morning?.
Figure 6 is a bar graph representing the distributions of the responses from 194 participants for the ethnic community membership.35 Participants could choose a single option on a 5-point Likert scale, from “Not agree at all” to “Completely agree”.
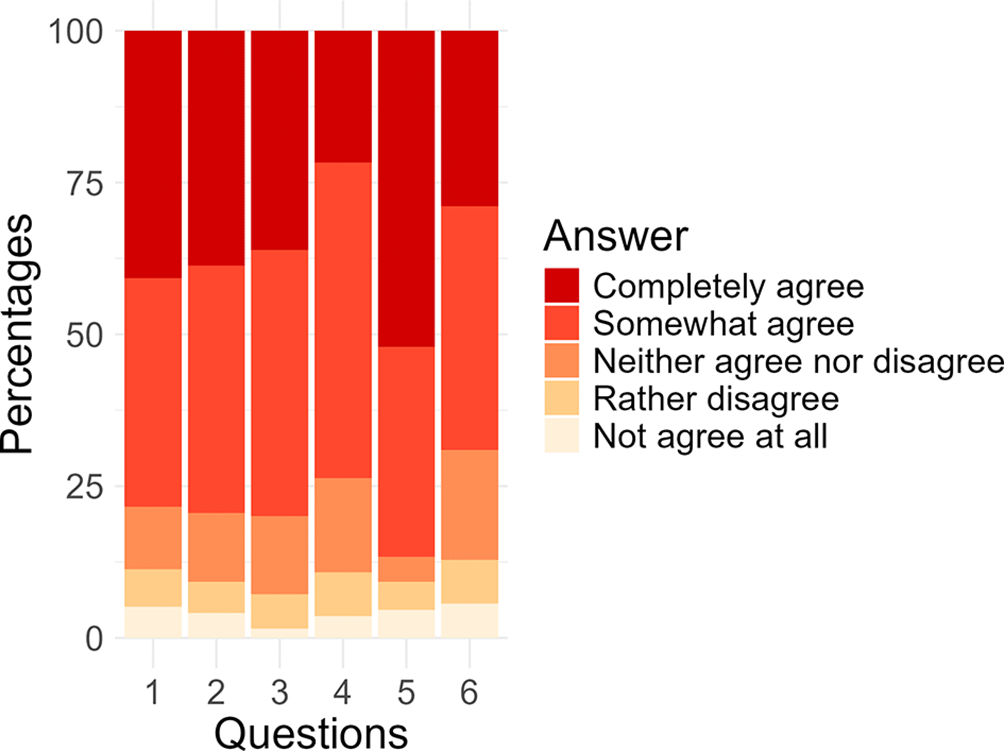
Figure 6. Participants’ responses to the “Ethnic community membership” questionnaire.35 The questions were: 1) I spent time trying to learn more on my community group, such as its history, its traditions and customs. 2) I understand the meaning of belonging to a community group. 3) I understand the meaning of my community belonging and what it represents for me. 4) I often did actions that helped me understand my community context. 5) To know more about my community background, I often spoke to other persons (family, friends or other). 6) I feel a strong attachment to my community group.
Figure 7 is a set of bar graphs showing the distributions of responses from participants who were questioned about the time they spent watching television (136 participants), listening to the radio (200 participants), using computer or tablet (201 participants), using the mobile phone (154 participants), and playing video games (201 participants) in week days and weekends.36 Participants could choose a single option among 7, from “I don’t use” to “More than 5 hours”.
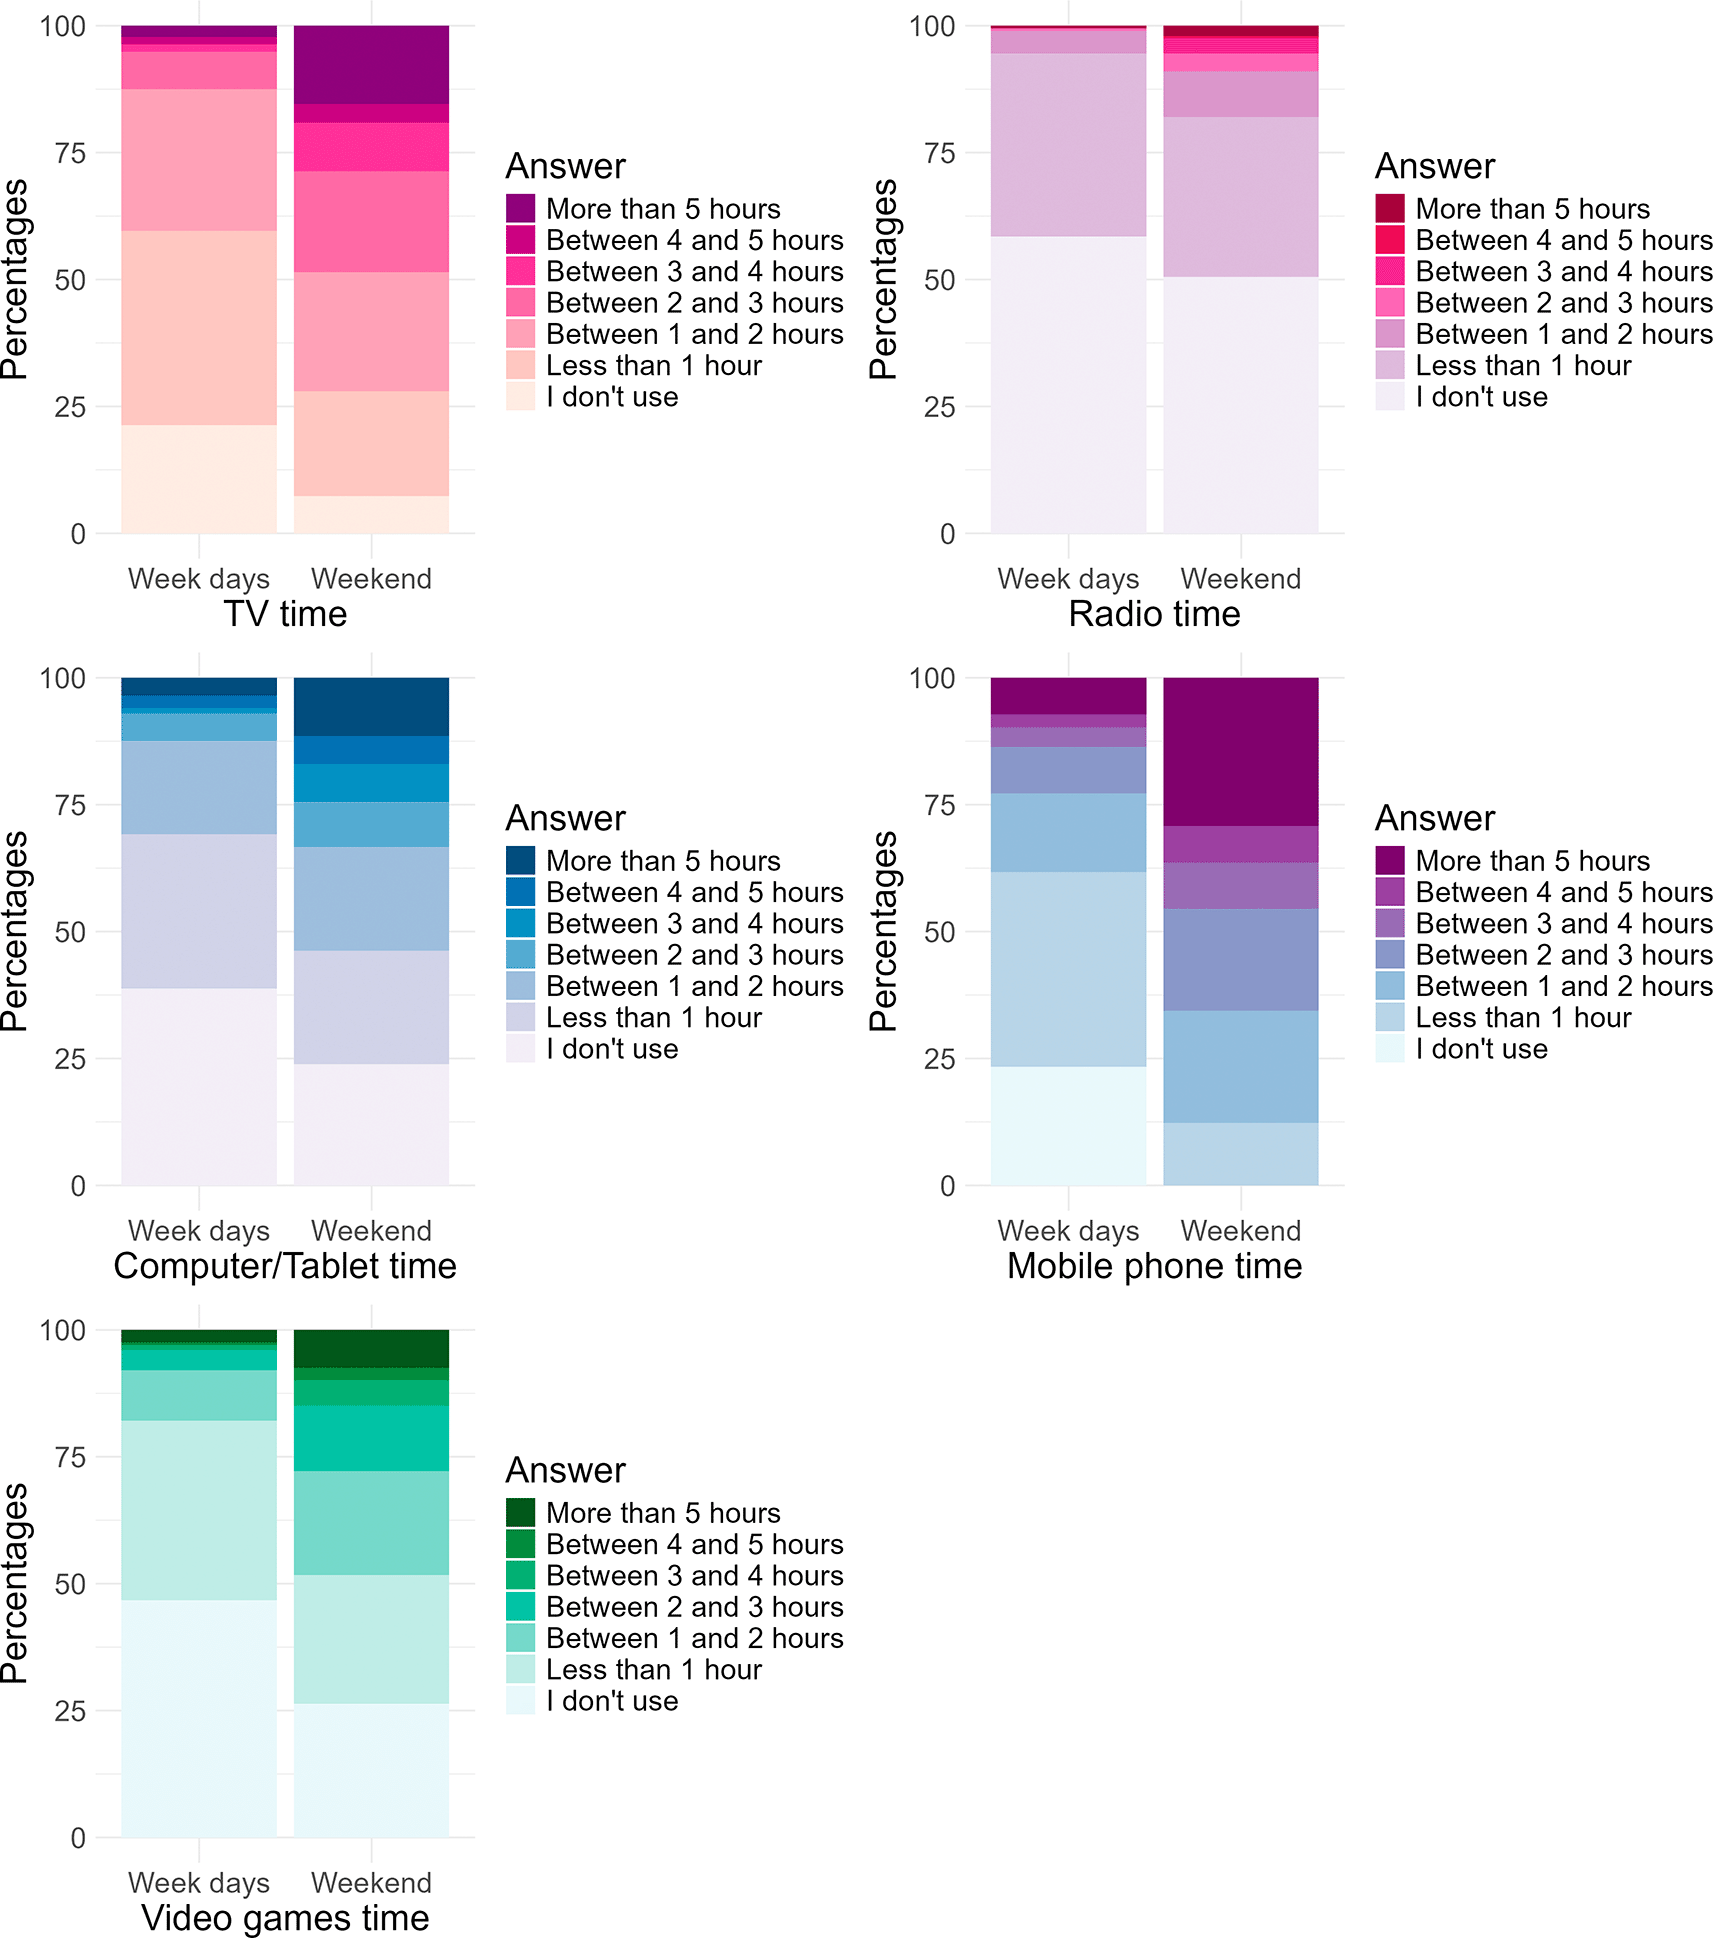
Figure 7. Participants’ responses to a selection of the “New technologies and media”36 (from top to bottom and from left to right): 1) How much time per day do you spend watching television during the school week / weekend? 2) How much time per day do you listen to the radio during the school week / weekend? 3) How long are you on the computer and tablet per day, during the school week / weekend? 4) How long are you on your mobile phone per day during the school week / weekend? 5) How much time per day do you spend playing video games during the school week/weekend?.
Figure 8 shows three bar graphs that represent the distributions of responses provided by 197 (top left) and 113 (top right and bottom) participants respectively regarding their habits of watching screens during meals: (1) Do you ever eat your meals in front of the screen? (Yes/No); (2) How many times a week? (4-option single choice); (3) On which types of meals? (4-option multiple choice).
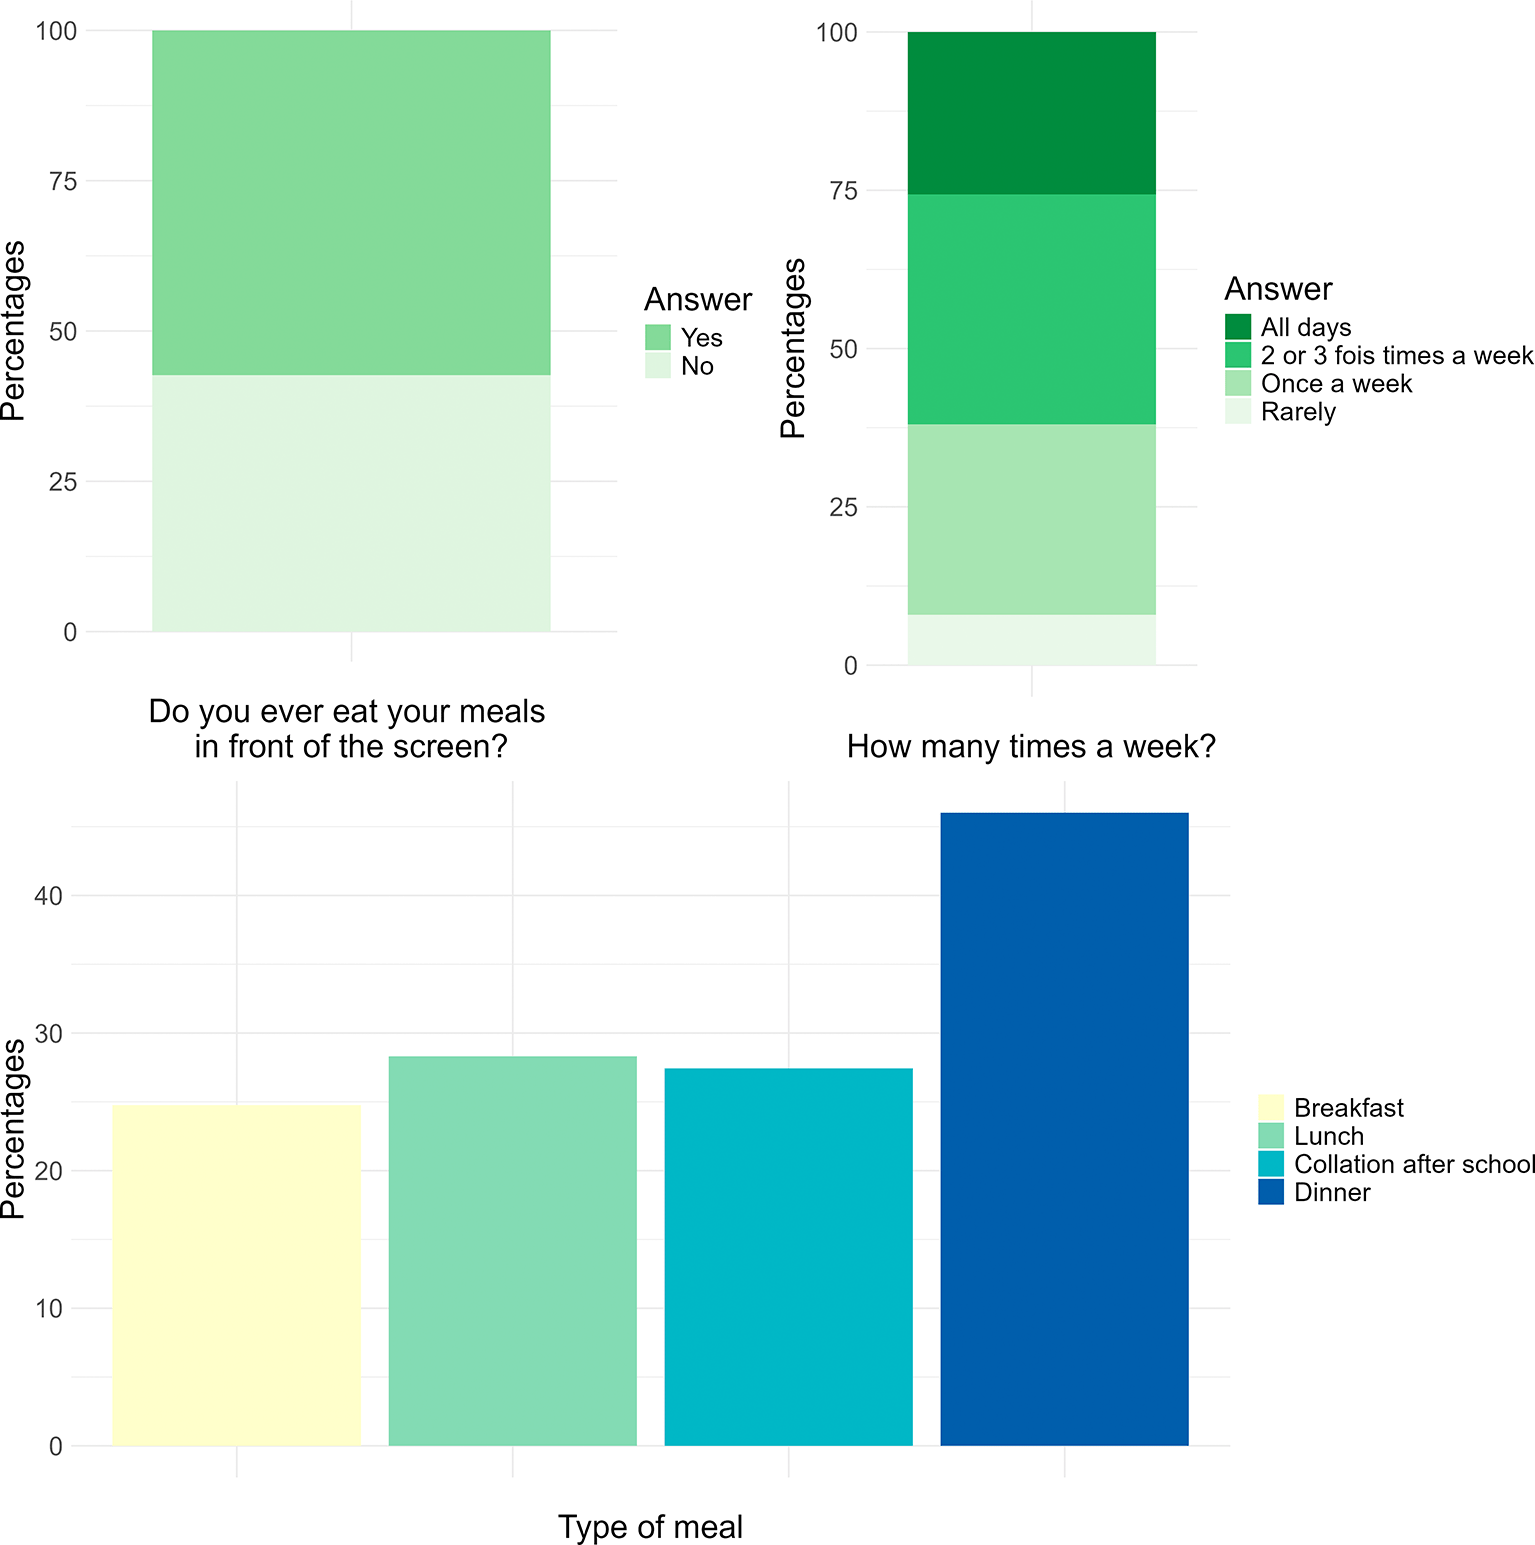
Figure 8. Participants’ responses to a selection of the “Digital tools and health” (from top to bottom and from left to right): 1) Do you ever eat your meals in front of the screen? 2) How many times a week? 3) On which types of meals?.
Figure 9 is a bar graph showing the distribution of the responses provided by 188 participants to the 5-item WHO well-being questionnaire.37 They could choose a single option on a 6-point Likert scale, from “Never” to “Always”.
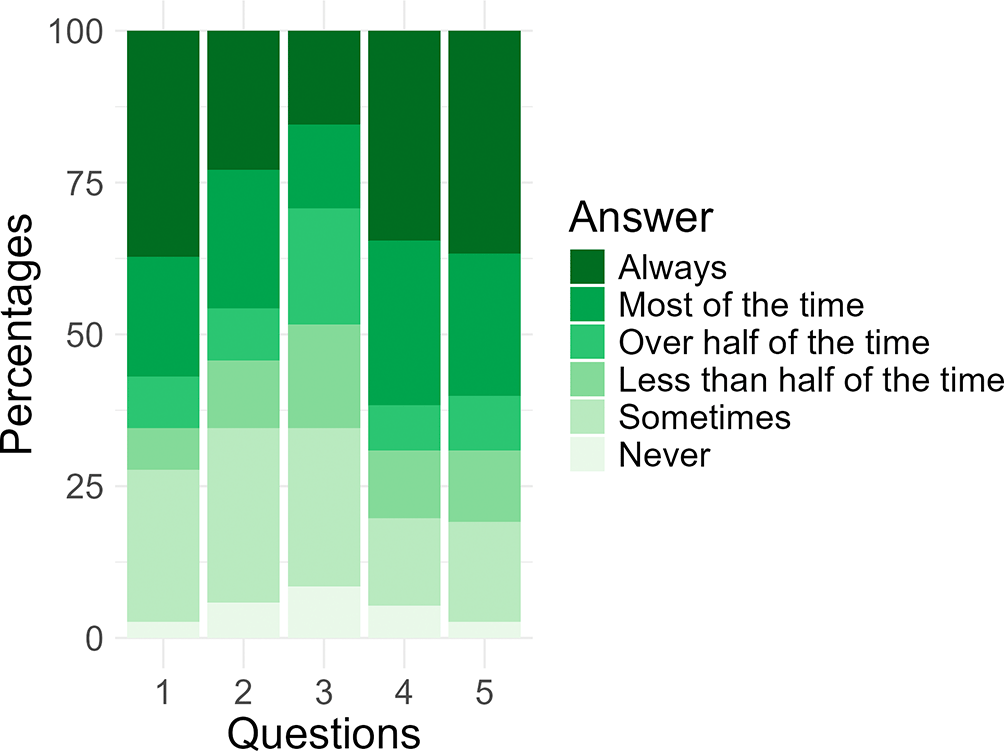
Figure 9. Participants’ responses to the “Well-being” questionnaire.37 The questions were: 1) I felt good and in a good mood. 2) I felt calm and peaceful. 3) I felt energetic and vigorous. 4) I woke up feeling refreshed and ready to go. 5) My daily life has been full of interesting things.
Figure 10 shows two bar graphs that represent the distributions of responses provided by 188 participants to the following questions: (1) Given your age and height, you would rather say you are …; (2) Would you rather say your health is … These were 5-option single choice questions.
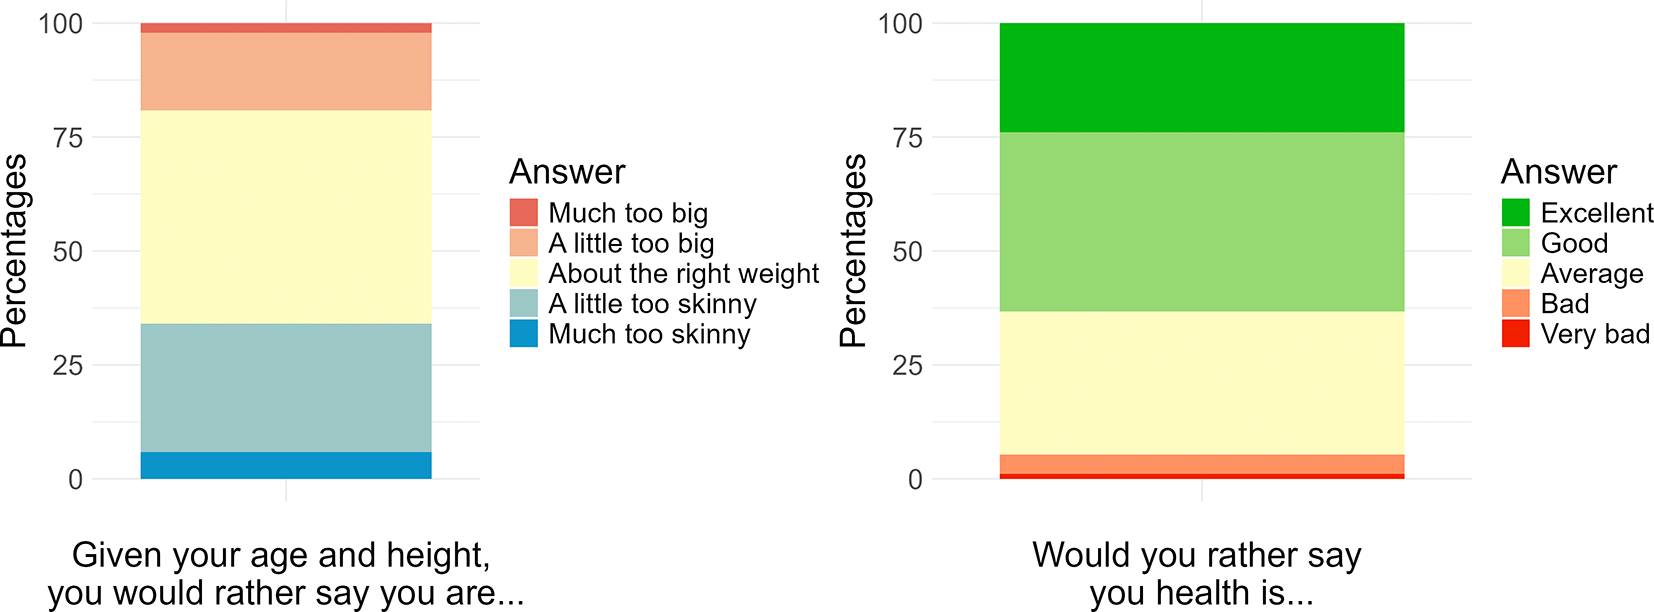
Figure 10. Participants’ responses to the “Perception of health and weight” questionnaire. The questions were: 1) Given your age and height, you would rather say you are… 2) Would you rather say your health is…
Figure 11 is a violin graph showing the distributions of the values selected by 187 participants.38 While an image showing 4 men or women (depending on the participant’s sex) silhouettes with increasing weight status from the left-hand side to the right-hand side, they had to select a value from 1 to 27 showed in a grid under the set of silhouettes that: (1) best reflects their current appearance, (2) corresponds to the silhouette they would like to look like. This was a text constrained response.
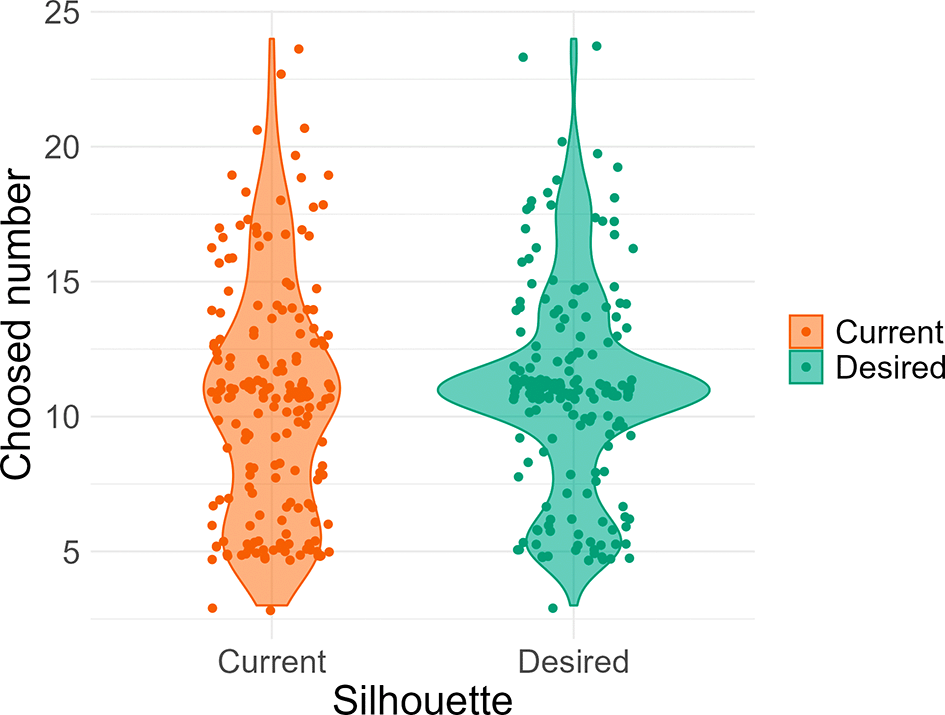
Figure 11. Violin plots and points of the participants’ responses regarding the “Silhouette assessment and expectation”38: 1) Choose the value that best reflects your current appearance. 2) Choose the value that corresponds to the silhouette you would like to look like.
Figure 12 is a bar graph showing the distribution of the responses provided by 174 participants to the questionnaire regarding the perception about biological sampling. They could choose a single option on a 5-point Likert scale, from “Completely unacceptable” to “Totally acceptable”.
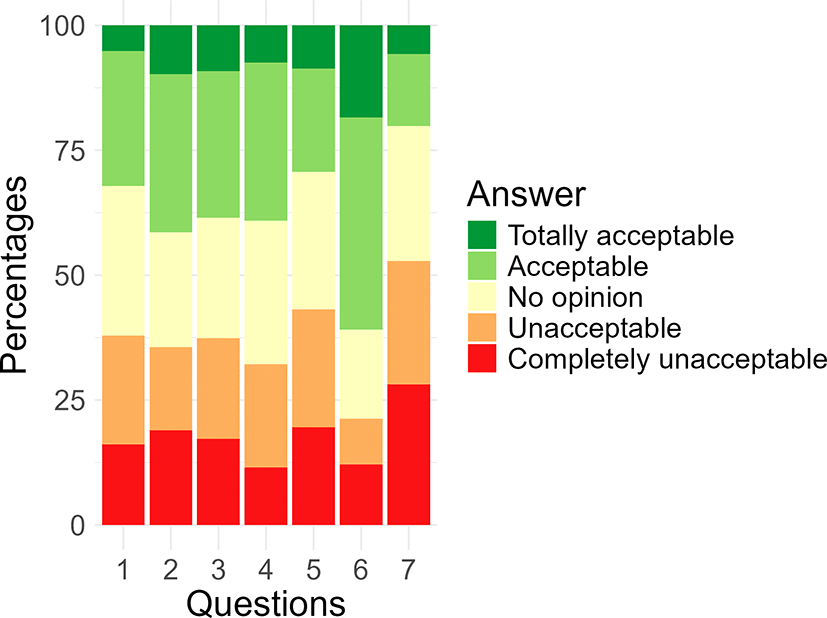
Figure 12. Participants’ responses to the “Perception about biological sampling” questionnaire. The questions were: Although no samples will be taken in this project, we would like to know your opinion on sampling procedures (saliva, sweat, hair, blood). Please share your opinion by indicating what you find acceptable. 1) Give a saliva sample using the equipment provided. 2) Give some hairs. 3) Give a few clipped nails. 4) Give sweat samples using the equipment provided. 5) Give a urine sample (pee) using the equipment provided. 6) Give a blood sample. 7) Give a faecal material sample (poo) using the equipment provided.
Accelerometers
Figure 13 presents 1-second epochs aggregated data from GENEActiv accelerometer devices. The adolescent participant wore the device from 23 to 30 June 2023. Note that, as describes the “Experimental conditions” subsection, there may be a delay between the removal of the device and the data downloading. It is observed with flat signals in the acceleration series, a high decreasing in temperature, and a continuous null light signal if the device was stored in a dark place. Even though the signal was recorded from 23 June to 6 July 2023, it has to be noted that, when studying the participant behaviour, the end of the series should be removed from the analysis.
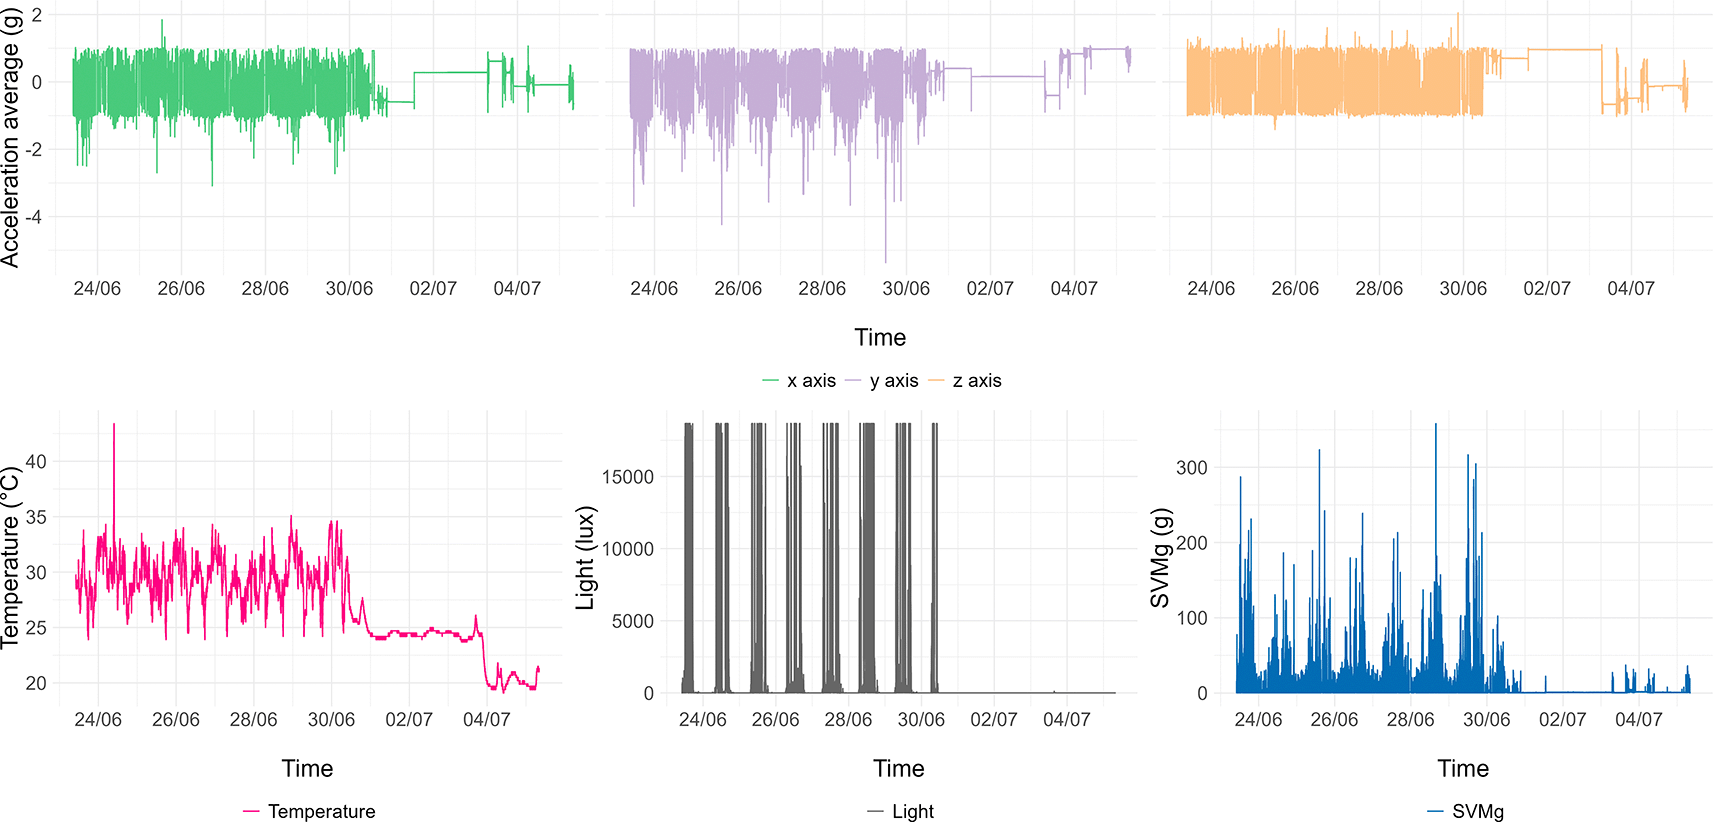
Figure 13. An example of accelerometer data content from 23/06/2023 to 06/07/2023 with a 1-second epochs (from top to bottom, from left to right): acceleration recorded in the x axis, acceleration recorded in the y axis, acceleration recorded in the z axis, temperature, light, and signal vector magnitude.
Limitations
Table 4 sums up the quantity of missing data for the information considered in this data collection.
Table 4. Missing data in the dataset.
| Information | Number of missing data |
|---|
| Sex | 2 |
| Age | 33 |
| Ethnic community | 18 |
| Tanner stage | 16 |
| Waist circumference | 16 |
| Scale measurements | 34 |
| IOTF weight status | 64 |
| Cachera weight status | 59 |
| WHO weight status | 61 |
| CDC weight status | 58 |
| BMI-Healthy weight status | 58 |
| Food frequency questionnaire | 7–9
* |
| Water at school | 9–14
* |
| Barriers and facilitators for physical activity | 11–17
* |
| Sleep | 11–13
* |
| Personal information | 11–12
* |
| Ethnic community membership | 12–18
* |
| New technologies and media | 12–13
* |
| Digital tools and health | 15–16
* |
| 5-item WHO well-being index | 24
# |
| Weight and health perception | 25 |
| Silhouette | 26 |
| Biological sampling perception | 34–37
* |
The list of students provided by the school administration were at times incomplete or contained inaccuracies. When we realised this in the field, we asked participants directly for the missing information. However, some gaps were only identified once data collection ended. Sex is missing for 2 participants who were not measured. Age in months, age in years and age range computed in the way previously described (see section “Methods for data derivation”) were missing for 33 participants. However, 25 of these participants were measured; as a consequence, their civil age in years is available as a record from the impedancemeter scale. Note that the “civil age in years” may differ from the “age in years” we calculated.
Missing data for Tanner stage, waist circumference and scale measurements occurred when students completed only part of the questionnaires but were not measured. Scale measurements may also be missing due to two other additional issues: incorrect use of the scale or a confusion between participant identifiers.
Missing information about sex, age, height or weight resulted in missing data for weight status and BMI-Healthy weight status. It is also important to note that the upper age limit for calculating weight status varies depending on the reference used, resulting in different amounts of missing data. Specifically, the IOTF reference provides values up to 18 years of age, the WHO reference up to 19 years, the Cachera reference up to 21 years, and the CDC reference up to 20 years of age.45–47,49
Technical issues related to the use of tablets, installed software, or the network, resulted in some missing questionnaire data. The number of missing responses per questionnaire ranged from 7 to 37 (
Table 4). In the New technologies and media, and in Digital tools and health questionnaires, questions were embedded, resulting in empty responses due to previous choices.28 For example, if the participant selected “No” to the question “Do you have a mobile phone?”, then the follow-up question (“Is this mobile phone yours or do you share it?”) would not appear, resulting in an empty response.
One accelerometer device experienced a battery-related technical issue, which led to a complete absence of recorded data. As a result, although 34 participants from the school in Santo wore the device, the dataset only contains 33 accelerometer files. Additionally, accelerometer time series indicate that some devices encountered operational issues or some participants did not wear their device for the complete period of monitoring.
Figure 14 shows an example of time series in this case. Although the device was supposed to be worn from 23 to 30 June 2023, the acceleration signals dropped significantly, the temperature decreased abnormally, and the light signal was less frequent, particularly during the final nights (from 26 to 30 June).
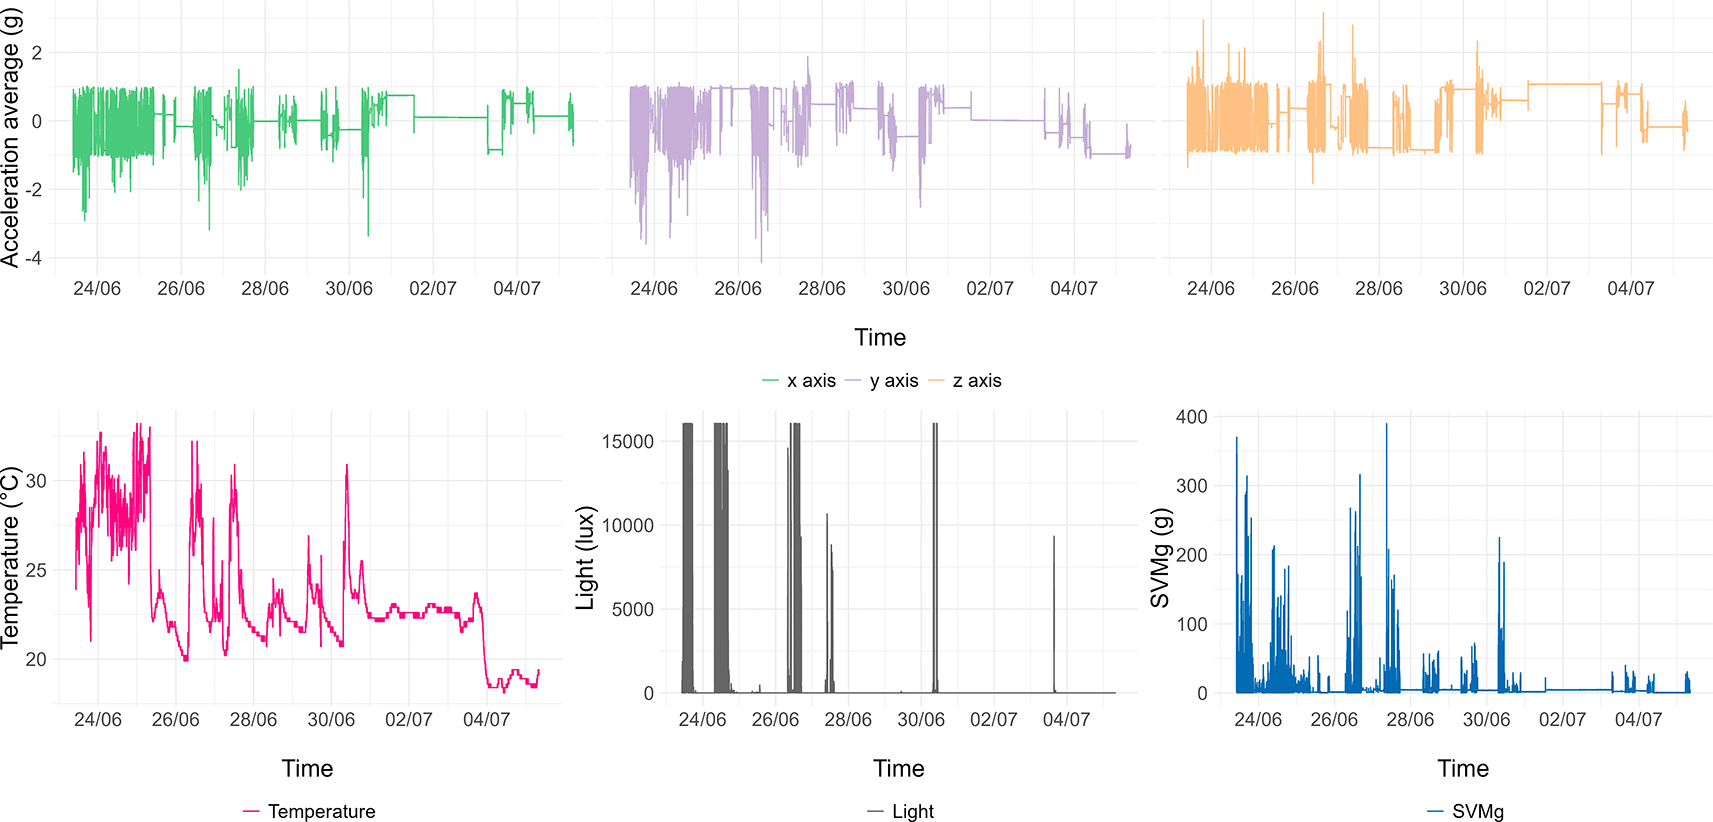
Figure 14.
An example of accelerometer data content from 23/06/2023 to 06/07/2023 with a 1-second epochs whose signal was not continuous (from top to bottom, from left to right): acceleration recorded in the x axis, acceleration recorded in the y axis, acceleration recorded in the z axis, temperature, light, and signal vector magnitude. There may have been a problem with the device or the participant removed it several times during the study period.
Ethics statement
The data collection was a part of the
European Family Farming, Lifestyle and Health in the Pacific (FALAH) project (n° 873185).16 As such, Ethics approval for FALAH projects including fields of research in Fiji, New Caledonia, Solomon Islands, and Vanuatu was obtained from the Consultative Ethics Committee of New Caledonia (CCE 2018–06 001 and 2023–10 012). The associated study was also conducted in accordance with the requirements of the Declaration of Helsinki63 and authorised by the Vanuatu Ministry of Education and Training.
Consent
A participant information template was sent home with the students, providing parents information about the study, and an opportunity to opt-out of the study if they did not want their child to participate. If no signed note was returned, it was understood as consenting to their child’s involvement in the study. For parents who were living in remote, isolated islands and were unable to sign and return the forms due to illiteracy, we obtained verbal consent from community authorities (directors, teachers, and Kastom leaders). In research, consent is sought from both parents and adolescents for studies involving vulnerable populations, including young people. However, in Vanuatu when parents are not available, such as in the case of students residing in boarding schools or living in remote islands, in line with local customs it is common practice that a representative of authority (for example a teacher, school director, or Kastom leader) can approve the ethical aspects of the study. The principals of the participating schools provided consent to involve their students in our study. In instances where written consent was not feasible, oral or verbal consent was accepted. The students whose parents did not opt them out of the study, had consent from community authorities, but did not want to participate, verbally expressed this to their teacher or a research team member and were free to leave the classroom without participating in the study. All adolescents provided individual written consent through the submission of the online survey.
Supplementary material
The supplementary materials associated to this data note are licensed under
CC-BY 4.0 and are available in the deposit described hereafter: