Introduction
The World Health Organization (WHO) Classification of Tumours (WCT), published by the International Agency for Research on Cancer (IARC) and commonly referred to as the ‘WHO Blue Books’, serves as a global standard for the classification of cancers. It also provides standardised terminology that facilitates consistent communication among healthcare professionals worldwide, thereby forming the basis for accurate diagnosis, effective treatment planning, leading to improved patient outcomes and robust international research collaboration.1 Additionally it impacts accurate epidemiological data collection by cancer registries.
Tumours of the urinary system and male genital organs represent a significant global health burden and are among the most frequently diagnosed malignant tumours.2 Classification of these tumours has evolved considerably, e.g. due to advances in molecular profiling, which have revealed distinct genetic and epigenetic alterations in morphologically similar entities. The 5th edition of the WCT of Urinary and Male Genital Tumours3 fundamental transformation of diagnostic approaches towards more accurate stratification and increasingly personalised treatment based on molecular tumour characteristics by incorporating multidimensional information generated through advanced technologies, expanding biological knowledge and evolving diagnostic tools and therapeutic strategies.3,4 Nevertheless, the evidence supporting the diagnostic and prognostic value of specific tumour characteristics varies considerably between different entities, and the systematic assessment of this evidence landscape remains limited.1
Evidence and Gap Maps (EGMs) provide a structured visual overview of the research and highlight both robust evidence and critical gaps.5,6 Unlike traditional systematic reviews, they can capture a broad spectrum of study designs and tumour characteristics, thereby revealing both areas lacking evidence and clusters of low-quality data.7 The project ‘Mapping the Evidence for the WHO Classification of Tumours: a Living Evidence Gap Map by Tumour Type’ (WCT EVI MAP), funded by the European Commission (HORIZON grant No. 101057127), applies this methodology to tumour classification. Led by IARC and developed within the framework of the International Collaboration for Cancer Classification and Research (IC3R), the project systematically maps the evidence for all tumour types and presents the results in an interactive decision support online tool, the WCT Evidence Explorer.7 As part of this framework, the Hierarchy of Research Evidence for Tumour Pathology (HETP) was developed using a Delphi consensus procedure to provide a tailored evidence hierarchy for tumour pathology research.8 The EGM methodology has already been successfully applied to several tumour types included in the WHO Blue Books.9–11
In this study, we present the first EGM for renal cell carcinomas, subdivided into clear cell renal cell carcinoma and non-clear cell renal cell carcinomas, as well as for glandular neoplasms of the prostate and urothelial tumours. These tumour groups illustrate the molecular shift in urological tumour classification.12,13 By systematically reviewing the available evidence for these tumour groups, we characterise the current research landscape, identify areas requiring further investigation and highlight areas where, although extensive research exists, methodological quality remains low. Ultimately, this work will help to strengthen the evidence base of the WCT, promote rigorous research standards in tumour pathology, establish reporting standards and improve patient management through more accurate, evidence-based tumour classification in urological pathology.
Methods
To create this EGM, the WCT EVI MAP project consortium developed a common framework based on the PICO criteria (Population, Intervention, Comparison and Outcome), which was adapted for evidence mapping in tumour pathology and incorporated the expertise of pathologists, epidemiologists, molecular biologists and other specialists.8 The column headings of the map reflect the tumour groups and the corresponding tumour types in line with the WCT of Urinary and Male Genital Tumours (see Supplementary Table S1).14 A detailed description of the methods of the study can be found in the protocols registered for each tumour group on the Open Science Framework (OSF).15–18
Search strategy and screening process
Comprehensive literature searches on the tumour groups of interest were conducted in PubMed and Ovid Embase, by a trained information specialist. The search strategies were developed using a combination of specific terms tailored to each tumour type within each tumour group and terminology describing their characteristics.19 A more operational than analytical difference between the literature searches for the four tumour groups was that they were conducted at different time points. To ensure methodological consistency and comparability in the analysis of results across all tumour groups, the retrieved records were harmonised to a unified publication period from 1 January 2020 to 31 December 2024. Consequently, records published in 2018 and 2019 were excluded from the clear cell renal cell carcinoma search, while records published in 2025 were excluded from the remaining tumour groups. A minor residual difference remains, as the search for clear cell renal cell carcinoma was conducted on 5 December 2024, whilst the other searches were conducted between 26 February and 12 March 2025. Publications from late 2024 that were indexed in Pubmed or Ovid Embase only after 5 December 2024 are therefore included for the other tumour groups, but not for clear cell renal cell carcinoma. Detailed information on the search strategies for each tumour group, including search queries and restrictions applied, can be found in Supplementary Tables S2A-S5B.14
The search results were imported into the web-based software EPPI-Reviewer® Version 6.20 All retrieved records were individually screened based on the title and abstract, using predefined eligibility criteria set out in the study protocols published on OSF.15–18 In this project, due to the volume of included records and the scope of the map, screening was restricted exclusively to title and abstract data. According to the screening criteria for clear cell renal cell carcinoma studies addressing metastases, recurrences, therapy relations without biomarkers and omics repository data, were included, which was not the case for the other tumour groups. These broader inclusion criteria for clear cell renal cell carcinoma were applied at an early stage of the project, before the eligibility standards were refined and established.
To improve efficiency, following the manual review of approximately 300 studies, the ‘Priority Screening’ tool of EPPI-Reviewer® was applied, with screening considered complete once 50 consecutive records had been excluded. The results of the ‘Priority Screening’ were subsequently re-evaluated by a human reviewer. A subset of 10% of all records or a maximum of 200 studies (whichever was greater) was independently screened by a second reviewer to assess interrater agreement, with a discrepancy of less than 10% considered acceptable. Ambiguities and disagreements were resolved through discussions between the reviewers. The selection process followed the PRISMA 2020 guidelines,21 with adopted flowcharts documenting the number of records at each stage (see
Figure 2, Supplementary Figure S1).14
Data extraction and coding
The included records were coded based on the title and abstract according to the following categories: 1. Tumour type(s), 2. Tumour characteristic(s) and 3. Study design. Study designs were classified using the WCT EVI MAP decision tree diagram and glossary,22,23 which were developed to categorise a wide range of methodological approaches related to tumour pathology. If multiple tumour types or characteristics were reported, all relevant codes were assigned. For records with multiple study designs, the design representing the highest level of evidence (LoE) for the coded tumour characteristics according to the adapted HETP (see Supplementary Table S6),14,24 refined during the project, was assigned. A second reviewer independently coded 10% of the included studies, or a maximum of 200 records, to ensure consistency. Interrater agreement was assessed, with disagreements resolved through discussion with the other reviewers where necessary to achieve 90% agreement. The final coded results were then downloaded from EPPI-Reviewer® in JSON format. To ensure consistency across all tumour groups in the final map, additional tumour characteristics of clear cell renal cell carcinoma, which had been coded in the early project phase, were subsequently excluded to align the dataset with the common coding framework. This enables a focused, in-depth analysis of the diagnostic evidence landscape. While these decisions improve methodological consistency within the map, their implications for cross-group comparisons and the scope of the evidence captured are discussed in the section on limitations.
LoE were determined using an updated version of the HETP (see Supplementary Table S6),14,24 with evidence divided into five levels, where Level One (P1) represents the highest quality of evidence (e.g. systematic reviews) and Level Five (P5) the lowest (e.g. case reports). A custom Python script was developed to automatically assign LoE to the coded studies in the downloaded JSON file, based on their assigned study design and tumour characteristics, in accordance with the adapted HETP framework.14
Data analysis and visualisation
The EPPI-Mapper® v.2.4.5 software was used to create an interactive EGM. Each cell in the EGM shows the intersection between a specific tumour type (column) and a tumour characteristic (row), whereas the LoE are represented as colour-coded circles within the cell. The size of the circles corresponds to the number of studies included, and the colours indicate the highest to the lowest LoE available for these studies: from yellow (Level One), light green (Level Two), turquoise (Level Three), blue (Level Four) to dark purple (Level Five) and grey (Unclassifiable). Studies reporting on multiple tumour types and/or tumour characteristics are visualised multiple times on the map. Thus, the number of entries reflects the evidence coverage across the various dimensions of the map and not the total number of independent studies. Absolute gaps (research areas with no evidence), synthesis gaps (lots of available research, but mostly of low quality, Levels Four-Five) and areas with solid evidence (systematic reviews and high-quality primary studies, Levels One-Two) can be easily identified using this visualisation; see
Figure 1 for a sample of the map. Figures and tables in this article were created using custom Python scripts, unless otherwise stated.
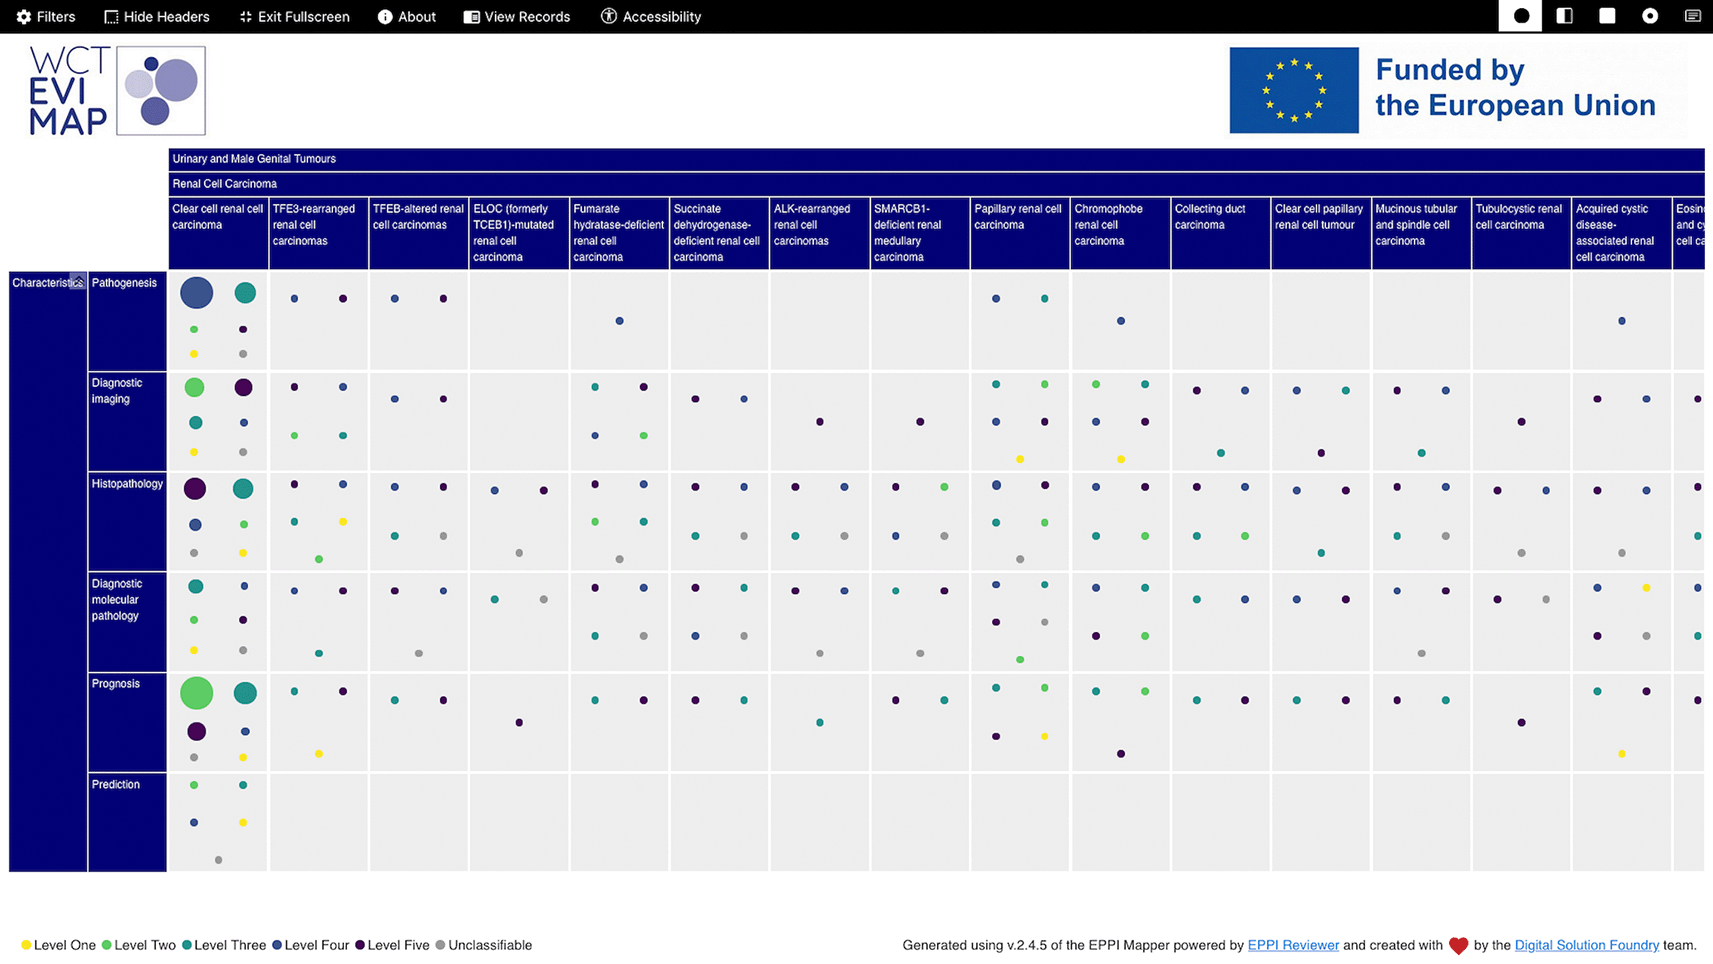
Figure 1. Sample evidence and gap map for WHO Classification of Tumors - Urinary and Male Genital Tumours.
Rows depict tumour characteristics and columns represent specific tumour types and groups. Circle size reflects the number of included studies, while colours indicate the assigned Level of Evidence: yellow (Level One), light green (Level Two), turquoise (Level Three), blue (Level Four), dark purple (Level Five) and grey (Unclassifiable). The map was created using EPPI-Mapper®.
Results
Systematic literature searches in PubMed and Ovid Embase yielded 65,686 records after deduplication (7,748 for clear cell renal cell carcinoma, 10,454 for non-clear cell renal cell carcinoma, 33,143 for glandular neoplasms of the prostate and 14,341 for urothelial tumours). At screening, 9,460 were excluded by human reviewers and 50,598 by the Priority Screening function of EPPI-Reviewer®, and 5,628 studies met the inclusion criteria. Additional 833 studies were excluded during coding, leaving 4,795 coded studies. Of these, 4,138 fell within the harmonised 2020 to 2024 publication window and were retained for the EGM; the remaining 657 records published in 2018, 2019, 2025 or with no specified year were excluded. Due to the multiple coding of tumour characteristics and types, 43.0% of the studies appear multiple times in the EGM, resulting in 6,117 total entries (
Table 1,
Figure 2). Per-group PRISMA flowcharts are provided in Supplementary Figure S1.14
Table 1. Details of the evidence and gap map (EGM).
Number and percentage of studies and entries included in the EGM, by tumour group and in total.
|
Clear cell renal cell carcinoma | Non-clear cell renal cell carcinoma | Glandular neoplasms of the prostate | Urothelial tumours | Total (complete EGM) |
|---|
| Studies in EGM (n) | 1,900 | 628 | 245 | 1,365 | 4,138 |
| Systematic reviews (n (%)) | 18 (0.95%) | 6 (0.96%) | 4 (1.63%) | 46 (3.37%) | 74 (1.79%) |
| Primary studies (n (%)) | 1,882 (99.05%) | 622 (99.04%) | 241 (98.37%) | 1,319 (96.63%) | 4,064 (98.21%) |
| Multi-coded tumour type studies (n (%)) | 0 (0.00%) | 116 (18.47%) | 30 (12.24%) | 76 (5.57%) | 222 (5.36%) |
| Multi-coded characteristic studies (n (%)) | 653 (34.37%) | 242 (38.54%) | 67 (27.35%) | 656 (48.06%) | 1,618 (39.10%) |
| Multi-coded studies in total (n (%)) | 653 (34.37%) | 340 (54.14%) | 89 (36.33%) | 700 (51.28%) | 1,782 (43.06%) |
| Entries in the EGM (n) | 2,719 | 916 | 320 | 2,162 | 6,117 |
| Entries per tumour type (median (range)) | 2,719 (2,719 to 2,719) | 37 (5 to 337) | 79 (5 to 96) | 58 (16 to 2,065) | 45 (5 to 2,719) |
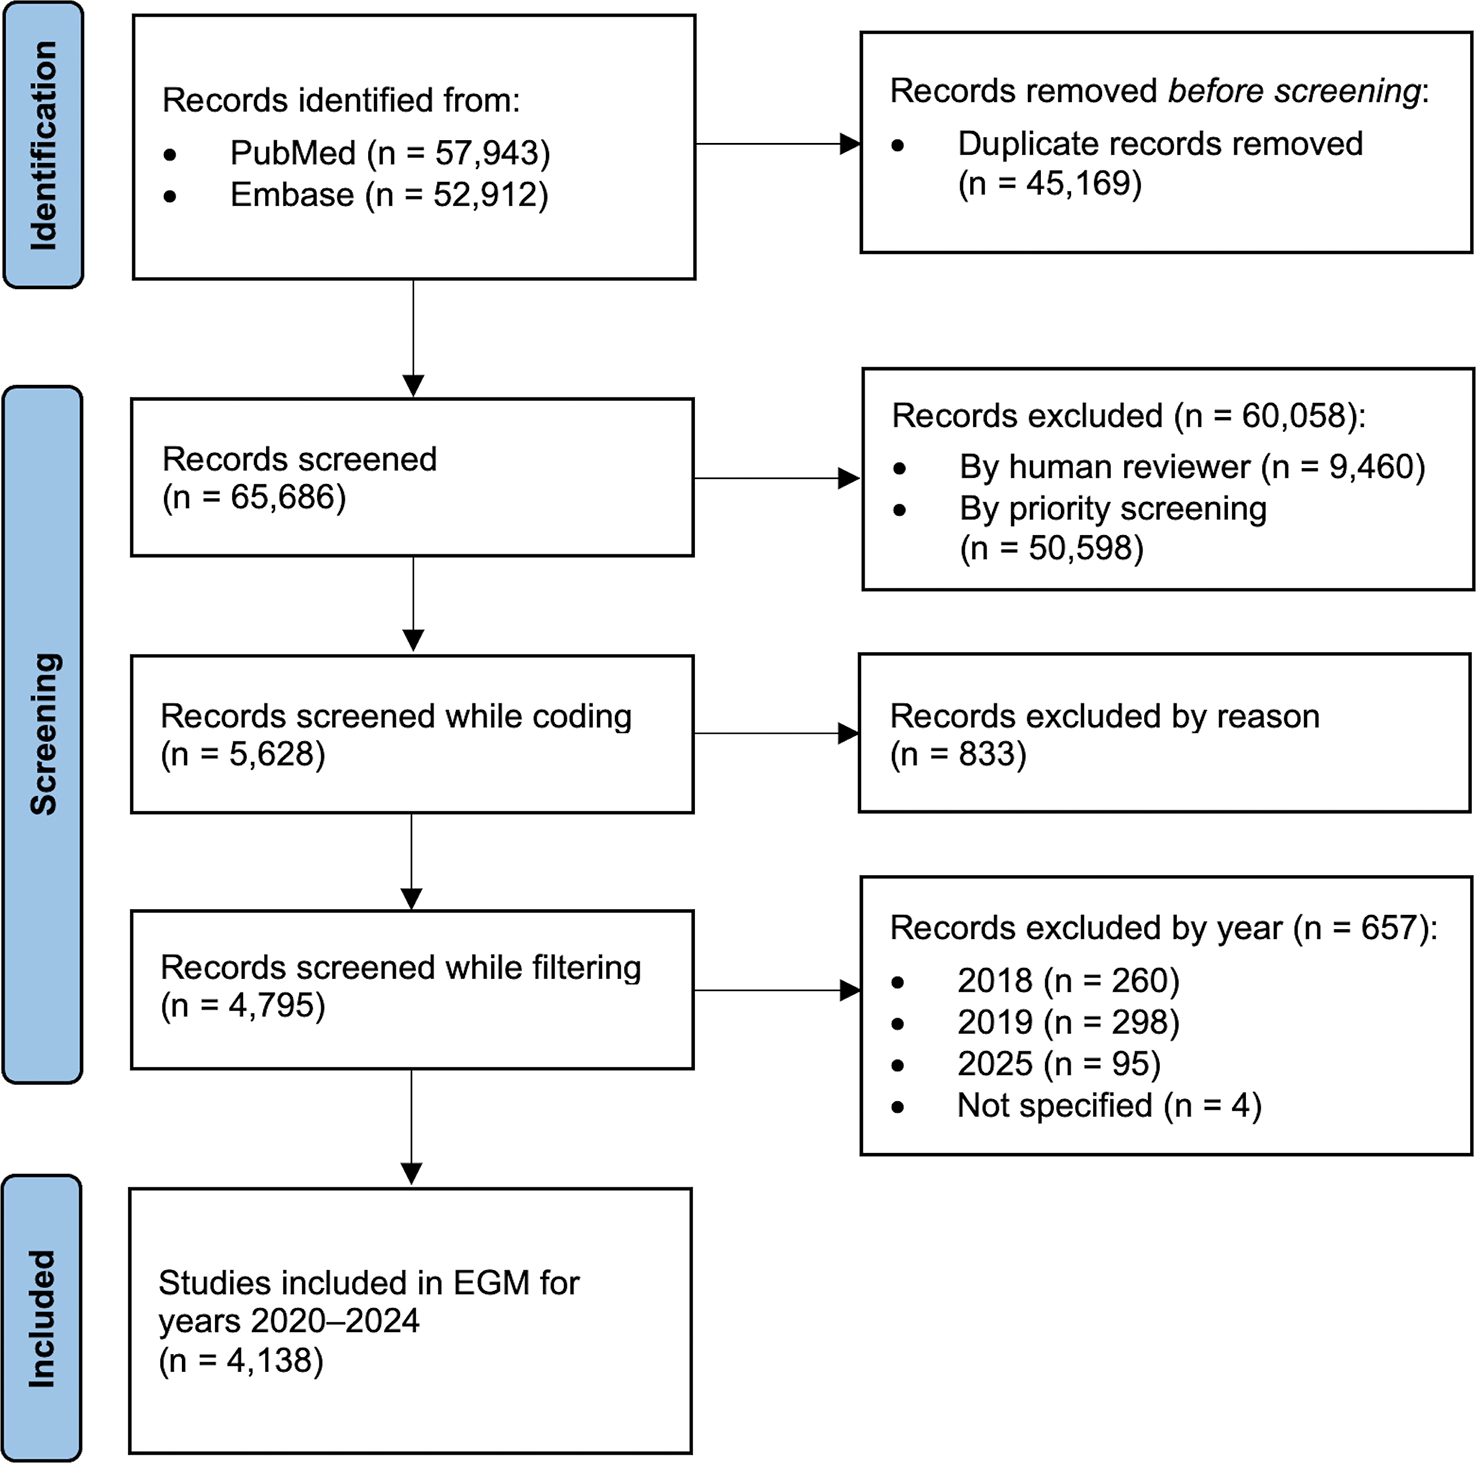
Figure 2. Adapted PRISMA flowchart for the complete evidence and gap map (EGM).
Step-by-step presentation of the records identified during the systematic searches, leading up to the studies included in the EGM on tumours of the kidney, prostate and urinary tract, in accordance with the WHO Classification of Tumours of Urinary and Male Genital Tumours.
Findings from included studies
The four tumour groups contributed unevenly to the EGM (
Table 1). Clear cell renal cell carcinoma had the largest evidence base with 1,900 coded studies (2,719 entries), followed by urothelial tumours (1,365 studies, 2,162 entries), non-clear cell renal cell carcinoma (628 studies, 916 entries) and glandular neoplasms of the prostate (245 studies, 320 entries). Entries per individual tumour type ranged from five (renal cell carcinoma NOS and treatment-related neuroendocrine prostatic carcinoma) to 2,719 (clear cell renal cell carcinoma). Of all included articles, 74 (1.8%) were systematic reviews coded at the highest LoE (Level One) and 4,064 (98.2%) were primary studies distributed across Levels Two to Five. Urothelial tumours had the highest proportion of systematic reviews at 3.4%.
The number of studies per publication year remained relatively stable over the harmonised time period, fluctuating between 781 (18.9%), corresponding to 1,174 entries in the EGM in 2020, and 875 (21.2%), corresponding to 1,270 entries in 2024, with a decline in 2023 that was mainly attributable to studies on urothelial carcinomas and non-clear cell renal cell carcinomas. There were no other notable temporal trends within or between tumour groups (
Figure 3).
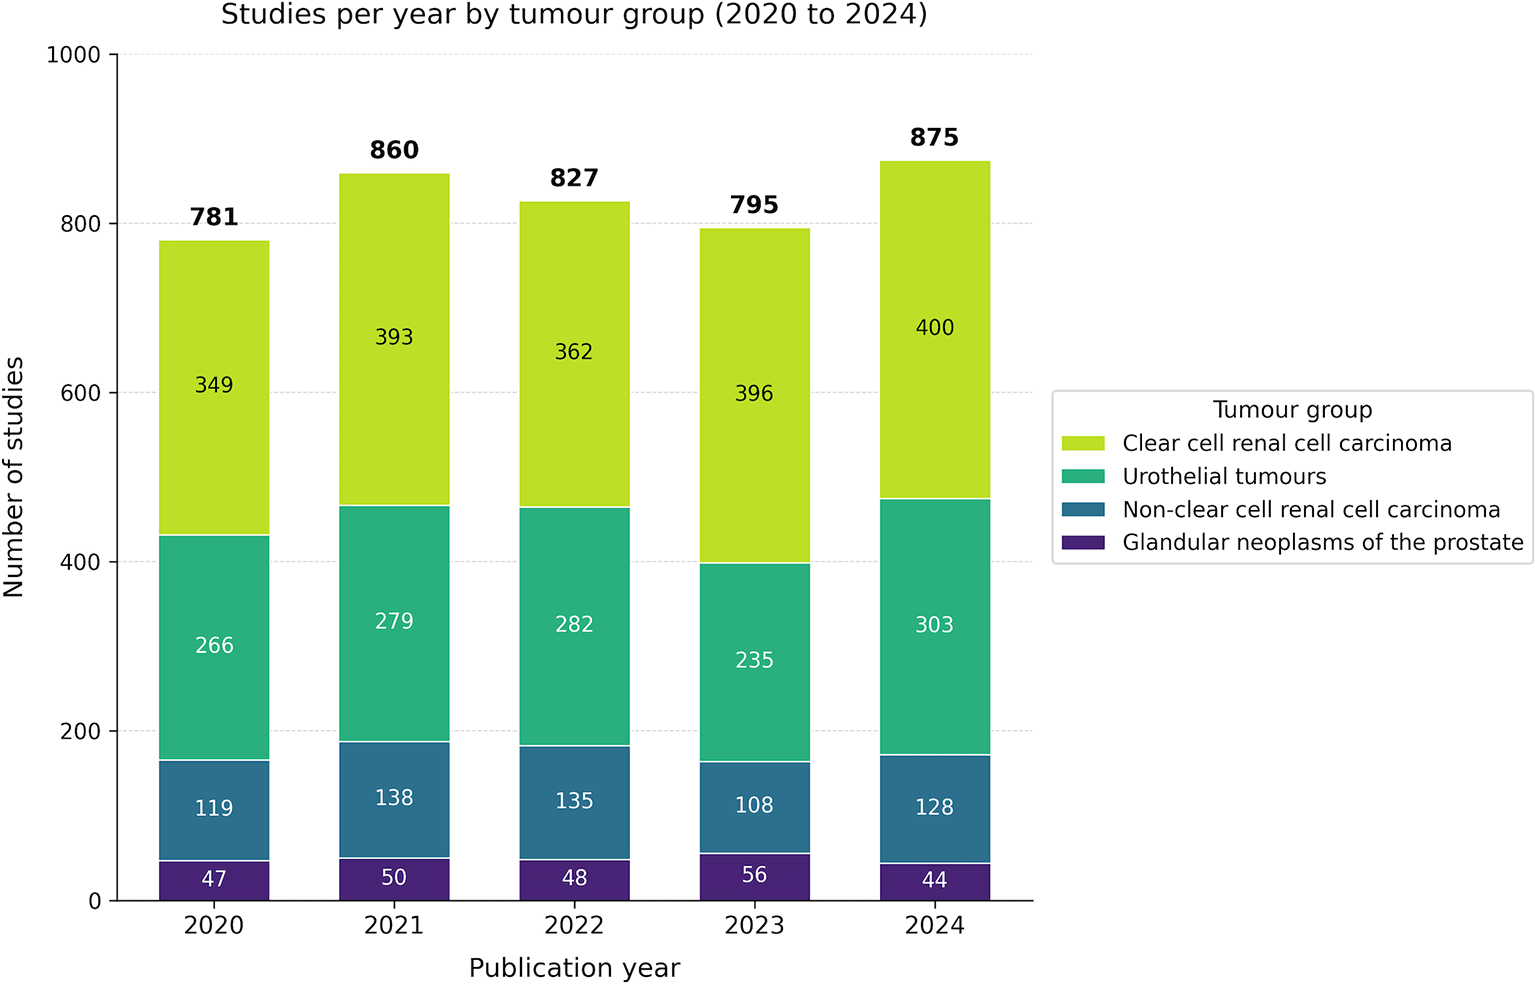
Figure 3. Barplot showing the year of publication of included studies, overall and stratified by tumour group (x-axis: number of studies; y-axis: year of publication).
Evidence distribution across tumour characteristics
The evidence base was concentrated in two characteristics: histopathology (n = 1,765; 28.9%) and prognosis (n = 1,726; 28.2%). Pathogenesis (n = 1,061; 17.4%), diagnostic imaging (n = 771; 12.6%) and diagnostic molecular pathology (n = 694; 11.4%) followed, while prediction was markedly underrepresented (n = 100; 1.6%) and accounted for ≤2% of entries in every tumour group (
Figure 4, Supplementary Table S7).14
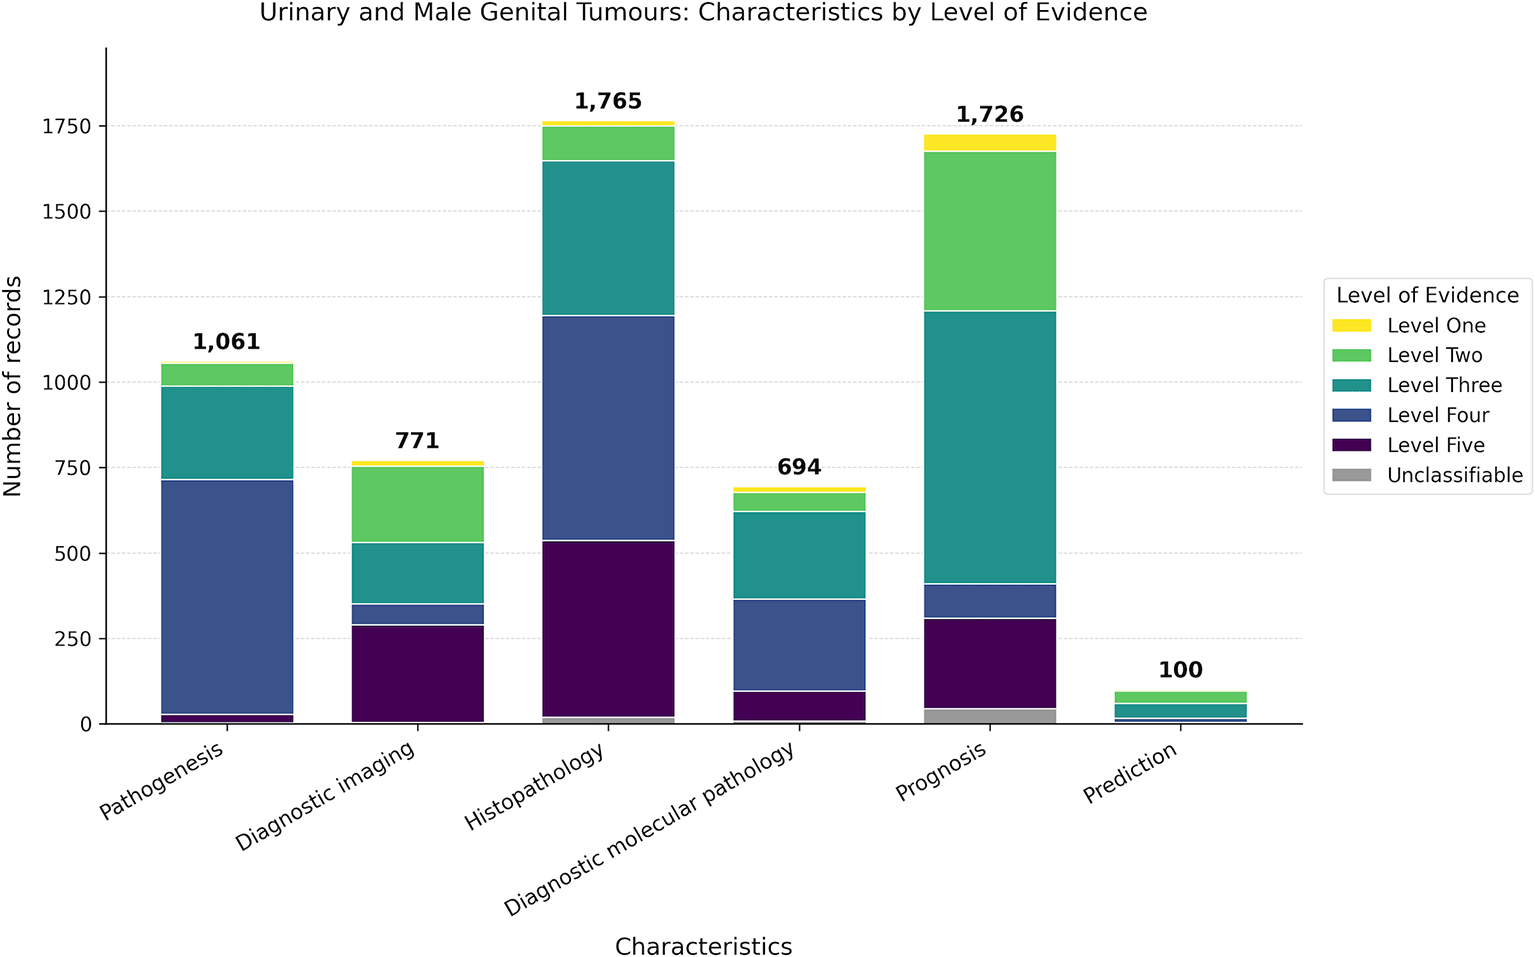
Figure 4. Barplot showing the number of records identified for each tumour characteristic.
Studies that contributed to multiple tumour characteristics were counted more than once. Colours indicate the level of evidence: Level One (yellow), Level Two (light green), Level Three (turquoise), Level Four (blue), Level Five (purple) and Unclassifiable (grey).
Evidence profiles according to tumour characteristics
The LoE varied considerably both across tumour groups and characteristics (
Figure 5,
Table 2). Across all four groups, low-level evidence (Levels Four to Five) was the dominant tier, accounting for 40.9% of urothelial tumour entries, 47.0% of clear cell renal cell carcinoma entries, 57.5% of glandular neoplasms of the prostate entries and 68.0% of non-clear cell renal cell carcinoma entries. High-level evidence (Levels One to Two) was correspondingly sparse, ranging from 6.9% in non-clear cell renal cell carcinoma to 23.8% in clear cell renal cell carcinoma (
Table 2).
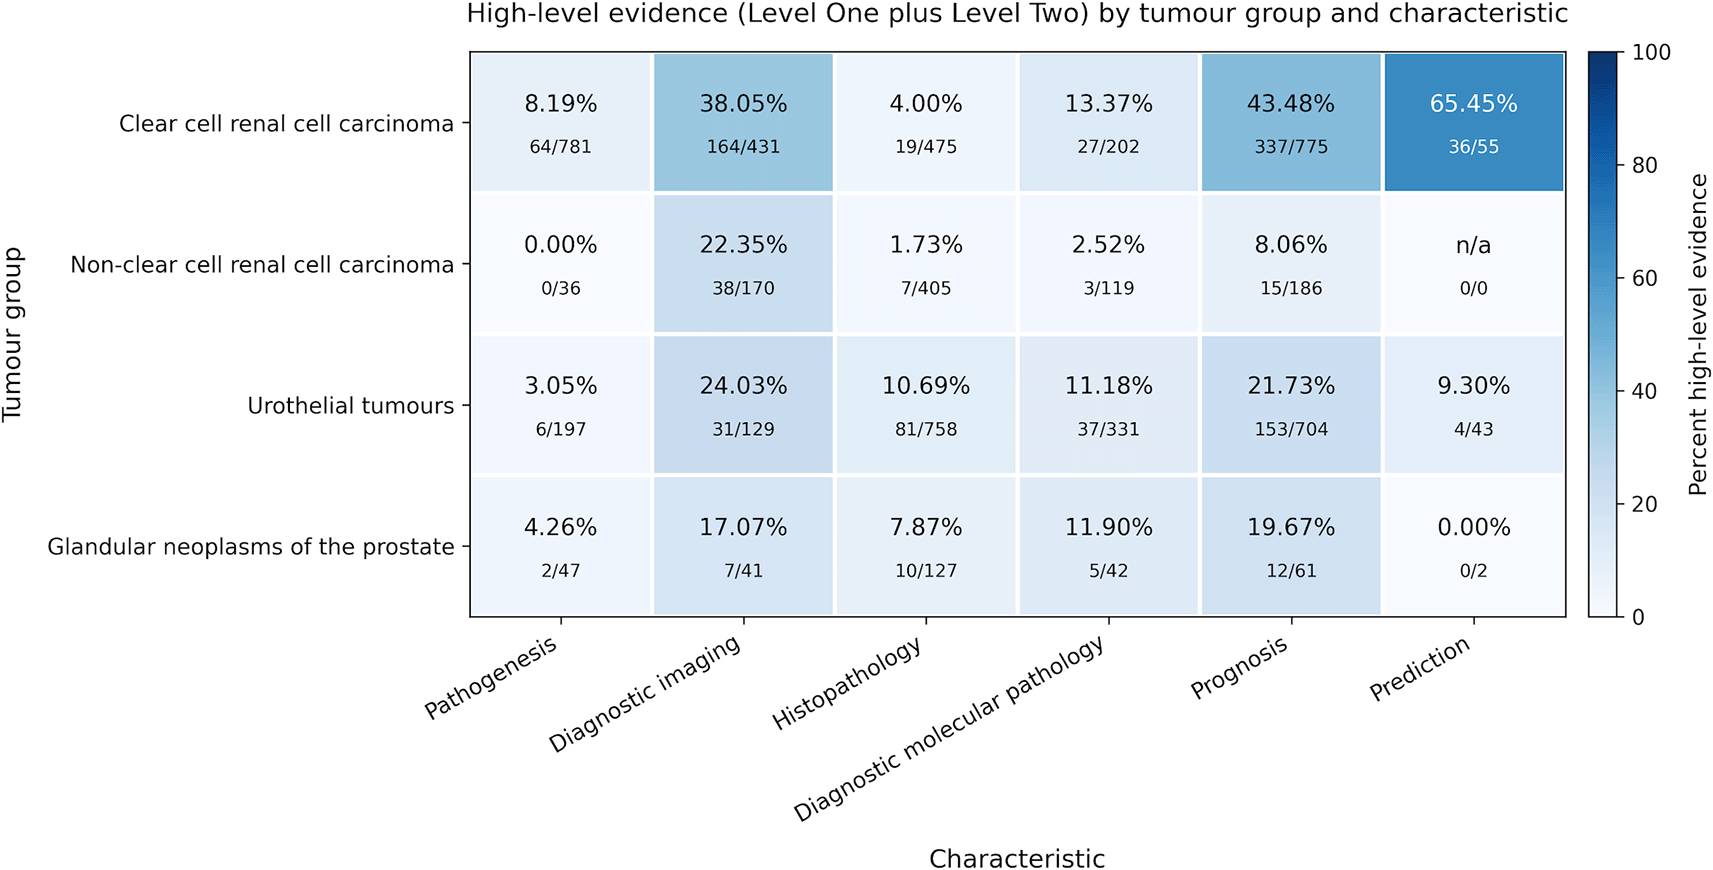
Figure 5. Heatmap showing the proportion of high-level evidence (Level One–Two) by tumour group and characteristic.
The values represent the numerator (number of records with high-level evidence) in relation to the denominator (total number of records for the respective tumour group and characteristic, irrespective of the level of evidence). Colour intensity reflects the percentage on a fixed scale from 0% to 100%. Cells marked ‘n/a’ indicate combinations with no data records (denominator = 0).
Table 2. Distribution of evidence levels by tumour group.
Each row shows the number and percentage within each evidence level category: high-level evidence (Levels One–Two), moderate-level evidence (Level Three), low-level evidence (Levels Four–Five) and Unclassifiable (records that could not be assigned a level of evidence).
| Tumour group |
Total (n) | High – Levels one to two (n (%)) | Moderate – Level three (n (%)) | Low – Levels four to five (n (%)) | Unclassifiable (n(%)) |
|---|
| Clear cell renal cell carcinoma
| 2,719 | 647 (23.80%) | 752 (27.66%) | 1,279 (47.04%) | 41 (1.51%) |
| Non clear cell renal cell carcinoma
| 916 | 63 (6.88%) | 226 (24.67%) | 623 (68.01%) | 4 (0.44%) |
| Glandular neoplasms of the prostate
| 320 | 36 (11.25%) | 99 (30.94%) | 184 (57.50%) | 1 (0.31%) |
| Urothelial tumours
| 2,162 | 312 (14.43%) | 926 (42.83%) | 884 (40.89%) | 40 (1.85%) |
| Total
| 6,117
| 1,058 (17.30%)
| 2,003 (32.74%)
| 2,970 (48.55%)
| 86 (1.41%)
|
Within tumour groups, the proportion of high-level evidence varied substantially by characteristic (
Figure 5, detailed proportion per tumour type provided in Supplementary Figure S2).14 Prognosis carried the largest absolute number of high-level studies in every group and reached 43.5% high-level evidence in clear cell renal cell carcinoma (337 of 775), but only 8.1% in non-clear cell renal cell carcinoma (15 of 186). Diagnostic imaging showed a similarly uneven pattern, with high-level evidence ranging from 17.1% in glandular prostate neoplasms (7 of 41) to 38.1% in clear cell renal cell carcinoma (164 of 431). Histopathology, despite being the most heavily populated characteristic overall (1,765 entries), held the smallest share of high-level evidence in three of the four groups (1.7% to 10.7%), reflecting the dominance of case reports, case series and other low-level study designs in this domain. Pathogenesis was almost entirely classified as Level Four mechanistic evidence, with high-level proportions of 0.0% to 8.2% across groups. Prediction was the sparsest characteristic across the EGM, with 100 entries in total (
Figure 4); within this small pool, clear cell renal cell carcinoma stood out with 65.5% high-level evidence (36 of 55), while glandular prostate neoplasms had no high-level prediction studies (0 of 2) and non-clear cell renal cell carcinoma had no prediction entries.
The complete interactive EGM for renal cell carcinomas, glandular neoplasms of the prostate and urothelial tumours is available online under WCT EVI MAP: Preliminary Results.
Tumour group-specific evidence patterns and identified gaps
Evidence distribution patterns differed substantially across tumour groups, reflecting variation in disease prevalence, classification maturity and search precision. A complete entity-level breakdown of evidence distribution and gap classification is displayed in the per-group heatmap in
Figure 6, with additional detail provided in Supplementary Tables S7-S8B.14 In
Figure 6, each tumour entity is evaluated across predefined characteristics and each corresponding cell is assigned to one of four evidence categories: (i) absolute gaps indicate the complete absence of records; (ii) relative gaps denote fewer than 20 records, with none meeting Level One or Level Two evidence; (iii) synthesis evidence where at least 20 records exist but none is at Level One or Level Two; and (iv) solid evidence indicates the presence of at least one study classified as Level One or Level Two. Of the 180 cells, 44 (24.4%) are absolute gaps, 77 (42.8%) are relative gaps, 5 (2.8%) are synthesis gaps and 54 (30.0%) show solid evidence.
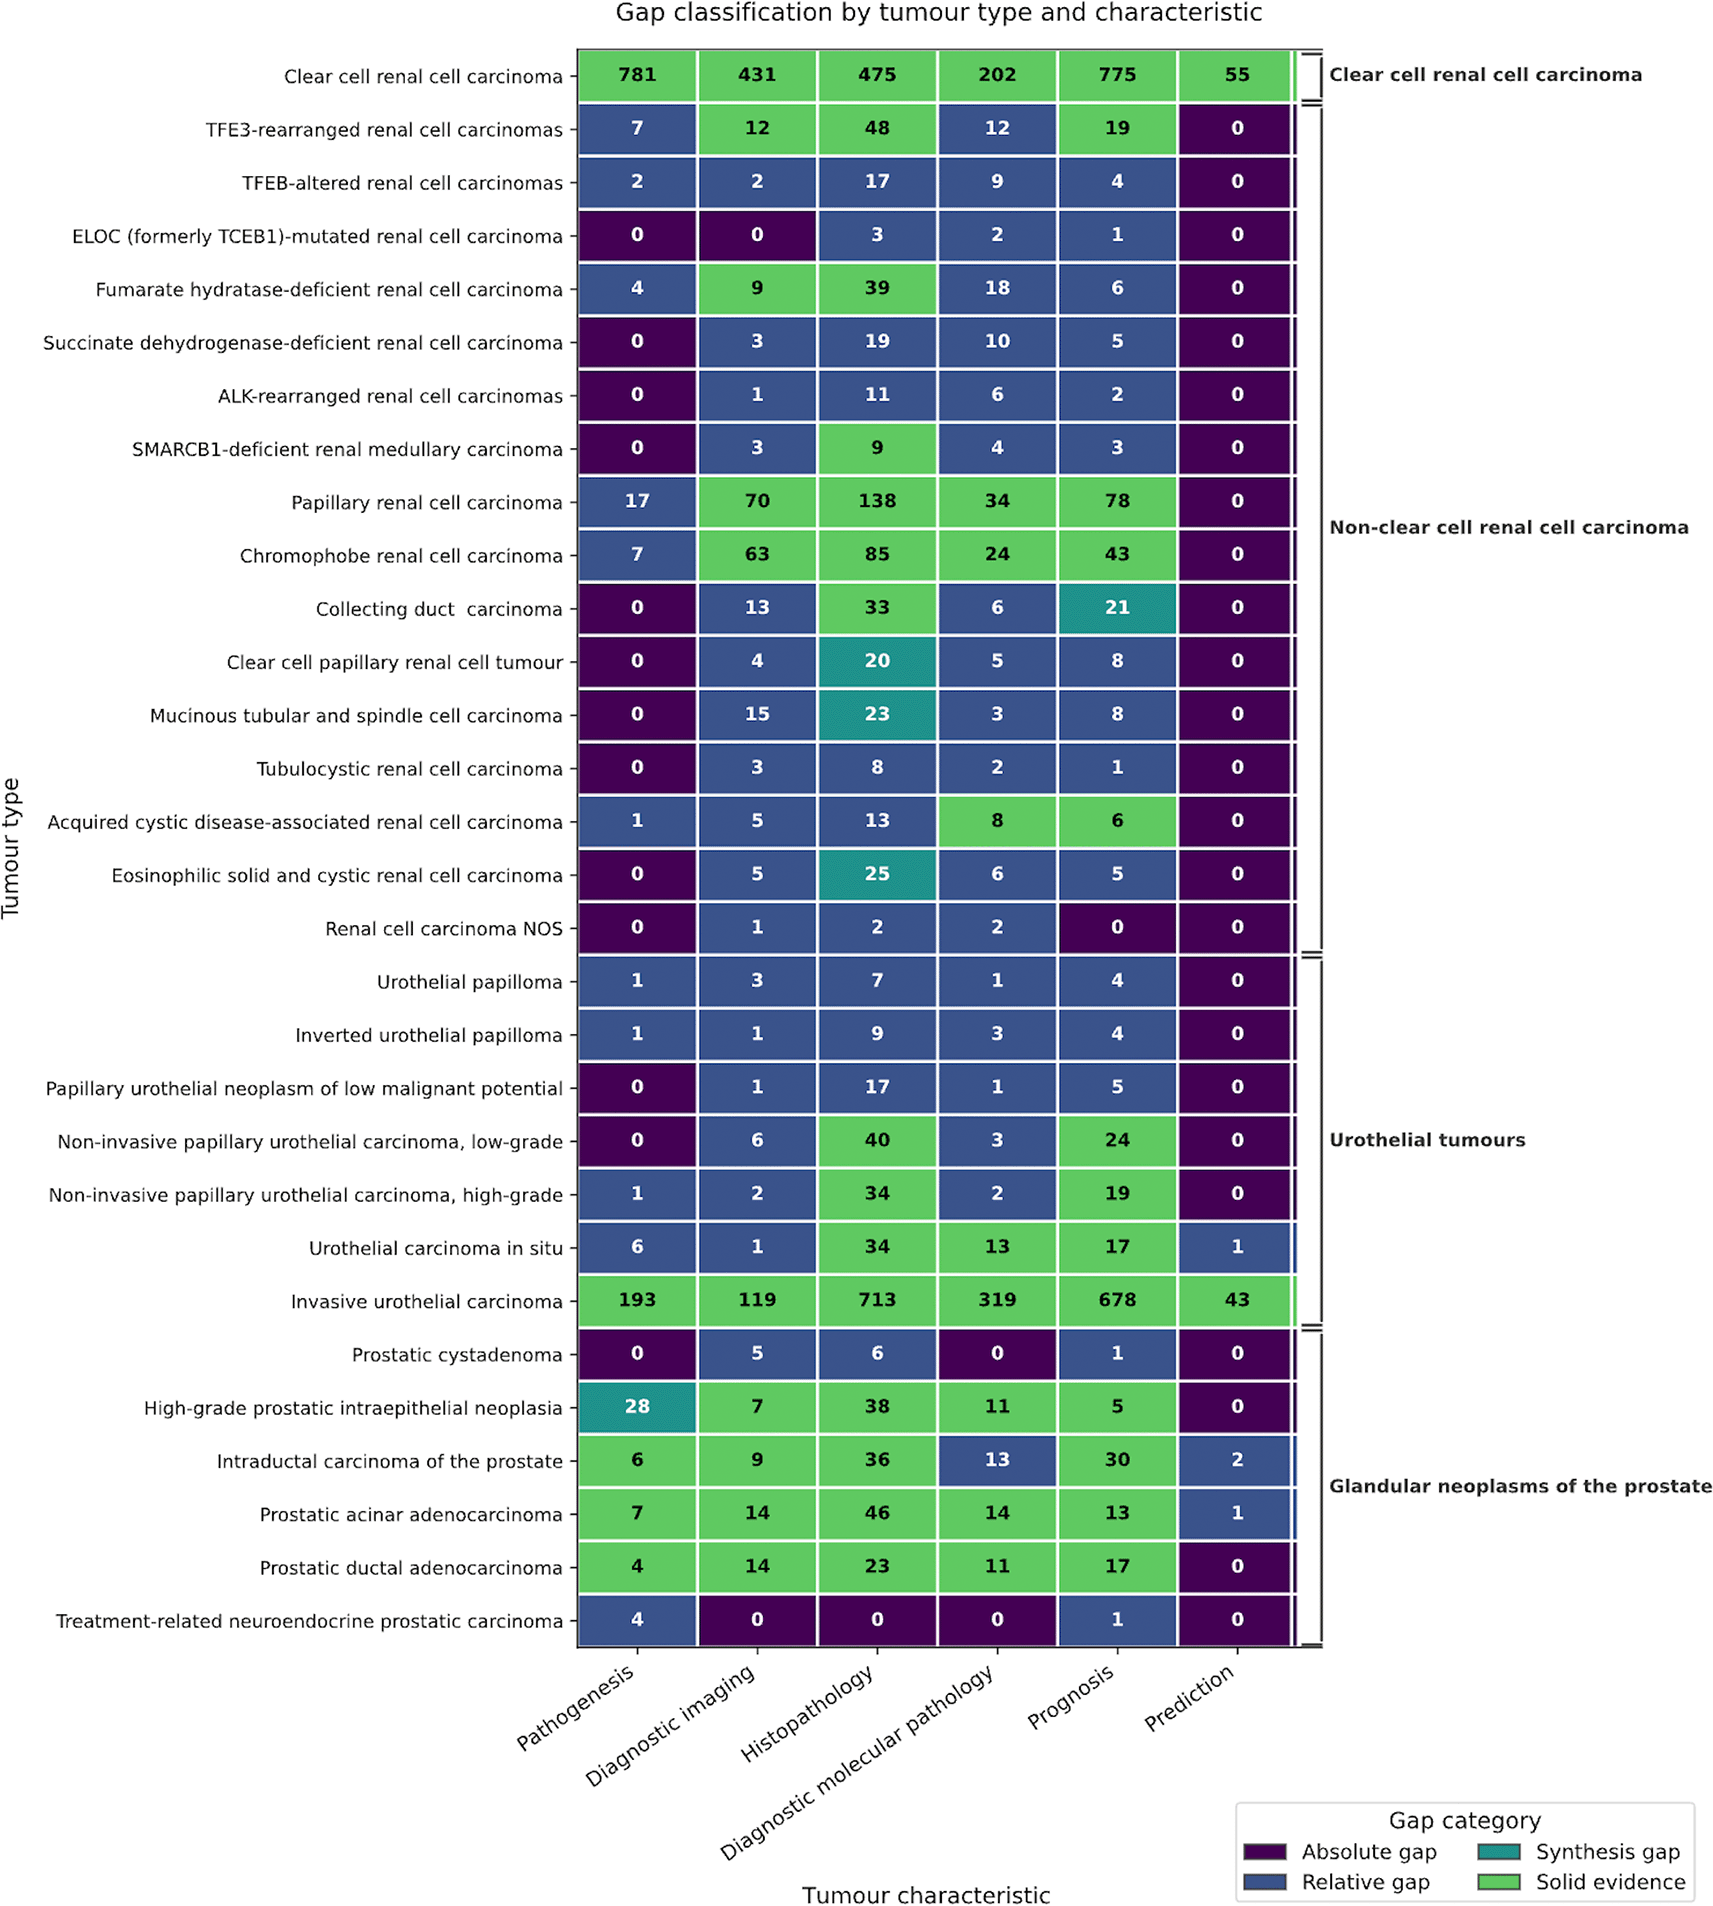
Figure 6. Gap classification matrix by tumour type and characteristic in the evidence and gap map (EGM).
Rows represent the 30 individual tumour types (in EGM order, grouped by tumour group), and columns represent the six tumour characteristics. The number in each cell indicates the count of records assigned to that combination of tumour type and characteristic.
Renal cell carcinomas
Clear cell renal cell carcinoma had the most balanced and comprehensive evidence base, with high-level evidence present in every characteristic. Notably, 28.7% of entries addressed pathogenesis, considerably more than the 3.9% to 14.7% observed for other groups and 43.5% of prognostic entries reached at least Level Two. Clear cell renal cell carcinoma was also the only entity with high-level predictive evidence. Among the remaining 16 renal cell carcinoma entities, the combined search yielded substantially less specific results and evidence was sparse. Non-clear cell renal cell carcinoma was dominated by histopathological research (44.2% of entries) but with the highest proportion of low-level evidence for histopathology (87.7%). Papillary and chromophobe renal cell carcinoma carried most of the high-level evidence and showed solid coverage in diagnostic imaging, histopathology, diagnostic molecular pathology and prognosis. Five additional entities (TFE3-rearranged renal cell carcinoma, fumarate hydratase–deficient renal cell carcinoma, acquired cystic disease–associated renal cell carcinoma, collecting duct carcinoma and SMARCB1-deficient renal medullary carcinoma) also showed solid evidence in histopathology, with at least three of these entities further supported by solid evidence in diagnostic imaging or prognosis. Solid evidence was identified for four entities, whereas the remaining entities were characterized primarily by relative and absolute gaps, particularly in pathogenesis. ELOC-mutated renal cell carcinoma and renal cell carcinoma NOS were the most severely underrepresented entities, with absolute gaps in three characteristics including pathogenesis. Overall, prediction represented an absolute gap for all renal cell carcinoma subtypes except clear cell renal cell carcinoma.
Glandular neoplasms of the prostate
Despite the high global incidence of prostate cancer, the evidence base for individual tumour types was limited, resulting in an inclusion rate of <1% based on abstracts.
Prostatic cystadenoma and treatment-related neuroendocrine prostatic carcinoma were the most severely underrepresented entities, with predominantly absolute gaps in three and four out of six characteristics, respectively. The remaining tumour types demonstrated a relatively balanced evidence base for most characteristics, with the notable exception of prediction. Prediction evidence was confined to two studies on intraductal carcinoma of the prostate and one on prostatic acinar adenocarcinoma, for all other prostate types, there was an absolute gap. A relative gap was identified in the evidence on diagnostic molecular pathology in intraductal carcinoma of the prostate and a synthesis gap was observed in pathogenetic research on high-grade prostatic intraepithelial neoplasia.
Overall, despite the limited evidence base, relatively robust evidence was available for most entities.
Urothelial tumours
The group of urothelial tumours had the highest proportion of systematic reviews (3.4%) and a balanced distribution across non-predictive characteristics, although predictive research remained minimal at 2.0% with absolute gaps in five of the seven entities. Screening exclusion was high (90.1%). Invasive urothelial carcinoma was the only urothelial entity with solid evidence across all tumour characteristics.
Urothelial carcinoma in situ showed solid evidence in histopathology, diagnostic molecular pathology and prognosis, but exhibited relative gaps in the other three tumour characteristics. While both, high-grade and low-grade, non-invasive papillary urothelial carcinoma were supported by solid histopathological and prognostic evidence, the remaining characteristics and the other entities were mostly characterised by relative gaps, with absolute gaps particularly evident in pathogenesis and prediction.
Discussion
This EGM provides the first systematic overview of the research landscape of the WCT of Urinary and Male Genital Tumours, integrating four separate searches into a single megamap covering 4,138 included studies across 30 tumour entities. The findings reveal a markedly heterogeneous evidence base in dominance of prognostic and histopathological research, persistent synthesis and solid evidence gaps and a near-complete absence of predictive evidence sitting alongside domain-specific patterns shaped by disease prevalence, classification maturity and search precision.
Principal findings and clinical relevance
The overall pattern observed here, with prognosis and histopathology dominating the evidence base (>57% of all EGM entries), systematic reviews accounting for only 1 to 3% of included studies and predictive research representing no more than 2% of entries in any tumour group, is consistent with previously published maps of evidence cited in the WHO Blue Books for breast and thoracic tumours, developed within the WCT EVI MAP project.9–11 The urological map both confirms these cross-tumour patterns and reveals domain-specific deviations. With only 30% solid evidence, 24% absolute gaps and 43% relative gaps, the extent of unmet evidential need across the landscape is highlighted. The pathogenesis literature for clear cell renal cell carcinoma constitutes a notable exception, likely reflecting decades of translational research in VHL/HIF pathway biology,25 while the absence of predictive studies is strongly pronounced throughout the whole map.
Importantly, the clinical relevance of the evidence base may differ substantially across professional disciplines. For pathologists, studies addressing diagnosis and differential diagnosis may reflect the most immediately applicable in daily practice and supposed ‘low level’ evidence may meaningfully inform morphological classification. In contrast, clinicians in urology and oncology may prefer to rely on middle to high level evidence concerning therapy, prognosis and imaging. This disciplinary divergence means that evidence gaps identified in the map carry different practical consequences depending on the professional context in which the map is used. It should also be noted that prognostic and predictive studies are often guided by therapeutic possibilities and needs, which means that they sometimes refer to tumour families rather than tumour types or subtypes that are not explicitly mentioned in the abstract. Consequently, they may not have been included in the current systematic, abstract-based screening approach, a fact that is also mirrored in the high exclusion rates for some tumours.
Clear cell renal cell carcinoma dominates the evidence base. This reflects both its prevalence as the most common renal cell carcinoma type (~75% of cases)26 and the methodological advantage of its tumour type-specific search strategy, which yielded substantially higher screening inclusion rates of 34% compared to 1–10% for the combined searches used for the other tumour groups. Clear cell renal cell carcinoma and invasive urothelial carcinoma were the only two entities with high-level across all six tumour characteristics, including high-level predictive evidence, a finding that reflects its comparatively rich therapeutic infrastructure: among the entities mapped, they have the largest portfolio of available targeted agents and therefore the most developed prerequisites for predictive marker validation.13,27
For non-clear cell renal cell carcinoma, the concentration of evidence in histopathology combined with the highest proportion of low-level evidence per tumour group indicates predominantly descriptive research without the methodological infrastructure required for evidence-based classification. Absolute gaps for ELOC-mutated renal cell carcinoma, renal cell carcinoma NOS and tubulocystic renal cell carcinoma partly reflect the recent introduction of these entities in the fifth edition of the WCT in 2022.3
For glandular neoplasms of the prostate, the limited overall evidence base, with 254 studies feeding 320 EGM entries and a screening inclusion rate of less than 1%, contrasts sharply with the high global incidence of prostate cancer.2 High screening exclusion rates partly reflect the widespread use of generic terminology (‘prostate cancer’) in primary literature without specification of the WCT-defined tumour group or differentiation of the explicit tumour type and, particularly at the level of abstracts, it was observed that clinical studies for glandular neoplasms of the prostate commonly fail to distinguish between ductal and acinar adenocarcinoma, providing this information in the full text only. As a result, studies relevant to a specific entity are not retrieved under entity-specific search terms, contributing to an apparent evidence deficit that does not reflect the actual publication landscape. Beyond this, research appears to be heavily concentrated on prostatic acinar adenocarcinoma at the expense of rarer entities. Prostatic cystadenoma and treatment-related neuroendocrine prostatic carcinoma were severely underrepresented with absolute gaps across three and four of the six characteristics, a particularly notable finding for the latter given its growing clinical relevance as an androgen-deprivation resistance mechanism.28
For urothelial tumours, the overall screening exclusion rate was high, once again reflecting the pervasive use of generic terminology as ‘bladder cancer’ in primary publication. Nevertheless, the group achieved the highest proportion of systematic reviews and compared to non-clear cell renal cell carcinoma a balanced distribution across non-predictive characteristics, with solid evidence across all six characteristics for invasive urothelial carcinoma. This, however, should be interpreted with caution: as the most general term within the group, ‘invasive urothelial carcinoma’ captures studies that do not further specify the specific type and includes various synonyms, likely inflating its apparent evidence base relative to the more narrowly defined entities. The relatively few studies on urothelial papilloma and inverted urothelial papilloma presumably reflect their benign clinical course rather than a genuine research deficit.
Two structural findings carry particular clinical relevance across all tumour groups. First, the predominance of low-level evidence in histopathology reflects the inherent reliance of morphological classification on descriptive observational research. For rare or recently described entities, prospective multicentre validation is rarely feasible and low evidence levels should be interpreted accordingly, rather than as an indication of poor scientific quality. Where larger cohorts exist, however, structured interobserver agreement studies would substantially improve the reproducibility of classification criteria. Second, the marked underrepresentation of predictive biomarker studies (≤2% across all groups except clear cell renal cell carcinoma) reflects a structural mismatch between the conventions of predictive research and those of tumour classification. Predictive studies are typically embedded in clinical trials with therapeutic endpoints and their reporting conventions are not oriented toward tumour-type-specific classification. As molecularly targeted therapies, antibody-drug conjugates and checkpoint inhibitors increasingly shape urological oncology,29–31 integrating predictive evidence into classification frameworks will require either revised eligibility criteria for future EGM iterations or new study designs that explicitly link therapeutic and classificatory endpoints.
Seven entities (ELOC-mutated renal cell carcinoma, tubulocystic renal cell carcinoma, renal cell carcinoma NOS, urothelial papilloma, inverted urothelial papilloma, prostatic cystadenoma and treatment-related neuroendocrine prostatic carcinoma) had fewer than 20 eligible studies, precluding meaningful evidence synthesis. For these entities, the 6th edition of the WCT will need to rely on expert consensus and explicitly grading this in the classification (analogous to evidence grading in clinical guidelines) would improve transparency.
Strengths and limitations
The strengths of this work include the integration of four parallel searches from two major literature databases into a single megamap, the comprehensive coverage of the important and more frequently encountered urological tumours within the defined time frame and the application of the standardised HETP framework8 for evidence grading. Furthermore, the systematic and interdisciplinary approach, which involves experts from the fields of epidemiology, systematic searches, systematic reviews, pathology, molecular biology and laboratory medicine, uses a predefined and published methodological protocol. This serves all aspects of screening, coding and mapping, as well as manual quality controls between reviewers at all levels and regular exchange between the groups, to ensure a defined quality of the presented EGMs and comparability of the results with other tumour types.
However, the complexity and scope of the approach led to the necessity to focus on essential information and procedures in this first round of EGM production, which entails several limitations: The most important of these is the fact that screening and coding were based exclusively on titles and abstracts, which carries the risk of misclassification if abstracts lack methodological details or if standards for abstract reporting are not adhered to, a situation frequently observed by the reviewers. When abstracts reported more than one study design, only the primary design was coded. This may have led to conservative evidence-level assignments in methodologically mixed studies.
Cross-group comparisons should be interpreted cautiously: clear cell renal cell carcinoma was processed under broader inclusion criteria and a longer search time period (2018 to 2024 versus 2020 to 2025 for other groups), with 2018 to 2019 entries representing approximately 22% of clear cell renal cell carcinoma EGM entries. The harmonisation to a 2020 to 2024 window addresses this only partially: a residual asymmetry remains because the clear cell renal cell carcinoma search was executed on 5 December 2024 while the other searches extended into early 2025, meaning publications from late 2024 indexed only after 5 December 2024 may appear in the other groups but not in clear cell renal cell carcinoma.
The strict application of WCT 5th edition terminology as the inclusion standard resulted in screening exclusion rates of 68–94% across three of four tumour groups, largely due to heterogeneous terminology in the primary literature. This heterogeneity leads to partial underrepresentation of entities whose designations changed between editions, newly recognised entities and benign entities. To some extent, this limitation was addressed by including MeSH terms alongside historical and current nomenclature in the search strategy. It is acknowledged, however, that the map is anchored to the 5th edition WCT framework by design and is intended to inform the classification process rather than to anticipate emerging entities. This issue is further amplified in low- and middle-income countries, where limited access to advanced molecular diagnostics reinforces reliance on histopathological classification, thereby exacerbating variability in terminology and reporting.
Several additional methodological boundaries shape the interpretation of evidence gaps. Pathogenesis was likely undercaptured: scoping decisions excluded epidemiology, including molecular epidemiology with pathogenetic overlap, and preclinical or mechanistic studies were excluded unless they explicitly addressed pathogenesis in the abstract. For rare tumour entities, even substantial increases in study volume may not translate into higher-level evidence, since the prospective multicentre designs required to reach Levels One to Three are often not feasible. Finally, neither publication bias nor the methodological quality of individual studies was formally assessed, consistent with EGM methodology but meaning that the map may disproportionately reflect positive findings.
Conclusions, implications and future directions
This EGM systematically locates and characterises the variation in research evidence for urinary tract and male genital tumours, identifying both areas where robust evidence is available and those where it remains sparse. It provides a transparent evidence-base for the development of the future editions of the WCT, distinguishing between areas where classification decisions are supported by robust evidence and those where expert consensus must remain central.
Three priorities emerge for the research community. First, the gap identified across all four tumour groups may represent the most promising opportunity: commissioning targeted systematic reviews for tumour types with substantial primary literature but absent synthesis would translate existing studies into a classification-ready format with relatively little effort. Second, for entities where primary literature remains critically scarce, registry-based case accumulation within international pathology networks could offer a feasible route to higher-level evidence. Third, standardised adoption of the WCT nomenclature in primary publications and adherence to reporting guidelines (STARD, STROBE, REMARK, as promoted by the EQUATOR Network), including principles of clear and informative abstract reporting,32 would substantially improve search precision and evidence retrievability in future EGM iterations. Furthermore, the gap between evidence grading criteria and the conventions of diagnostic pathology research suggests that the field may benefit from greater alignment with report standards established in clinical oncology, to ensure that high-quality diagnostic studies are recognised and retrieved as such in future evidence maps.
Assessing study quality beyond the assignment of study type ultimately requires full-text screening and data extraction, pointing to an important area for methodological refinements in subsequent EGM iterations. This could also be expanded to other clinical domains, including epidemiology, clinical manifestation, anatomical localisation, aetiology and risk factors, to provide a more comprehensive picture of the urological cancer evidence landscape and better serve the full range of stakeholders who rely on the WCT as a classification standard.
Recent developments in large language model-based approaches, piloted in the present project, offer a promising route towards both goals: by enabling full-text screening at scale and more granular study classification, they may substantially reduce the resource requirements of future EGM iterations while improving the depth and precision of evidence retrieval.
Ethical approval and informed consent
This study did not involve human participants or animals; ethical approval and informed consent were not required.
Disclaimer
The content of this article represents the personal views of the authors and does not represent the views of the authors’ employers and associated institutions. Where authors are identified as personnel of the International Agency for Research on Cancer / World Health Organization, the authors alone are responsible for the views expressed in this article and they do not necessarily represent the decisions, policy or views of the International Agency for Research on Cancer/World Health Organization.
Funded by the European Union. Views and opinions expressed are however those of the author(s) only and do not necessarily reflect those of the European Union or European Health and Digital Executive Agency. Neither the European Union nor the granting authority can be held responsible for them.
The authors used Claude Sonnet 4.6, Claude Opus 4.7 and DeepL Pro to edit and improve the readability of the text. The AI tools were used solely to provide linguistic support. The authors created and verified all scientific content, interpretations, analyses and conclusions.
no role in study design, data collection and analysis, decision to publish or preparation of the manuscript.







