1. Introduction
Wind turbine blades are large composite structures whose manufacturing process, principally vacuum-assisted resin infusion of glass-fibre and carbon-fibre laminates, is prone to defects such as porosity, dry spots, wrinkles and delamination (Murdy et al., 2022; Shevtsov et al., 2020). A significant part of the defects identified during quality inspection triggers a repair operation that consumes additional resin and glass fibre, energy and labour time, on top of the material embedded in the blade itself. At fleet scale, these repair operations represent a recurring, avoidable source of material consumption and emissions that is distinct from the structural material of the blade.
The Horizon Europe Innovation Action TURBO (Grant Agreement No. 101058054, coordinated by the Technical University of Denmark, DTU;
European Commission, 2022) addresses this issue directly. Work Package 11 (WP11) is responsible for the project's life cycle assessment, life cycle costing (LCC) and social life cycle assessment (S-LCA). Under the project's Key Objectives, KO-7 requires the demonstration of "robust deltas in embedded carbon, energy and production waste" associated with defect repair, alongside a stated ambition of a 90% reduction in factory repair time and material.
From M30 onward, SGRE demonstrated successive TURBO technologies (optimised infusion, sensors and machine-learning-controlled flow) on physical castings of a 16 m section produced from a 108 m wind turbine blade mould (B108). This paper presents the resulting defect-level comparative carbon footprint assessment, built directly on measured, post-manufacturing defect inventories for three such castings, and extrapolates the results to a full 108 m blade using a surface-area scaling method confirmed by SGRE.
2. Materials and methods
2.1 System description and functional unit
This study assesses a targeted functional unit: the material, energy and time flows associated with the formation and repair of manufacturing defects on a 16 m section of the B108 wind turbine blade mould, before and after the introduction of TURBO technologies. This is not a life cycle assessment of the blade; it is a targeted inventory of the rework/repair stage, which is the stage TURBO technologies act on directly. Results are extrapolated to a full 108 m B108 blade (Section 3.5) to express the section-level findings at the scale of one manufactured blade and of SGRE's realistic forecast annual production.
2.2 Manufacturing scenarios: three physical demonstrator castings
Three physical castings of the 16 m B108 section were produced and inspected. Casting 1 (baseline) used the standard infusion process with no TURBO technology and was measured in March 2025. Casting 2 (optimised infusion) modified the infusion inlet and outlet positions and was reported to the consortium at month 42 (M42, March 2026). Casting 3 (sensors and machine learning) combined ML-based control of the infusion flow rate, replacing pressure-based control, with a change in the flow-enhancement material under the beam; it was measured in April 2026. Casting 3 does not simply add ML control on top of the Casting 2 configuration: the two castings use different flow-enhancement material changes, so the two scenarios cannot be used to isolate the marginal contribution of ML control alone.
Table 1 summarises the three castings.
Table 1. Demonstrator castings.
| Casting | Configuration | Date | Data status |
|---|
| 1. Baseline | Standard infusion process, no TURBO technology | March 2025 | Measured |
| 2. Optimised infusion | Modified infusion inlet/outlet positions | September 2025 | Defect count measured; masses estimated |
| 3. Sensors + ML | ML-controlled flow rate + different
flow-enhancement material | April 2026 | Defect count measured; masses estimated |
2.3 Impact assessment method and reference factors
Climate change impacts were computed from the physical inventory (resin mass, glass mass, grinding energy) using the emission and energy factors listed in
Table 2. Grinding energy was only measured as a single total (252 kWh, baseline), covering both resin and glass removal together; it was expressed per kg of resin (k = 252/148.3 = 1.7 kWh/kg) as a calculation convenience, not because the energy is specific to resin. Electricity-related impacts used the Danish electricity mix, with a CO2 eq factor of 0.1312 kg CO2 eq/kWh. Because grinding energy is defined as a fixed linear function of resin mass, its relative reduction between scenarios is mathematically identical to that of resin and does not constitute an independent measurement; it is reported separately in
Table 3 for completeness of the physical inventory, not as an independently observed indicator.
Table 2. Reference emission and energy factors.
| Parameter | Value | Unit | Source |
|---|
| Emission factor, epoxy resin | 4.2 | kg CO2 eq/kg | ARDITEC/SGRE |
| Emission factor, glass fibre | 2.0 | kg CO2 eq/kg | ARDITEC/SGRE |
| Grinding energy, baseline | 252.0 | kWh | SGRE |
| Grinding energy intensity | 1.699 | kWh/kg resin | SGRE |
| Danish electricity mix, CO2 eq factor | 0.1312 | kg CO2 eq/kWh | Ecoinvent |
| Glass/resin ratio (fixed) | 2.5463 | kg glass/kg resin | Verified across all 56 baseline defect lines |
Table 3. Physical and environmental inventory, 16 m section, by casting.
| Indicator | Baseline | Infusion (Sc.2) | ML (Sc.3) |
|---|
| Number of defects | 56 | 39 | 38 |
| Resin required (kg) | 148.35 | 103.31 | 119.41 |
| Glass required (kg) | 377.73 | 263.06 | 304.06 |
| Repair time (h) | 110.0 | 76.6 | 149.7 |
| Grinding energy (kWh) | 252.0 | 175.5 | 202.8 |
| CO2 eq, materials (kg) | 1,378.5 | 960.0 | 1,109.6 |
| CO2 eq, energy (kg) | 33.1 | 23.0 | 26.6 |
| CO2 eq, TOTAL (kg) | 1,411.6 | 983.1 | 1,136.2 |
| CO2 eq avoided vs baseline (kg) | - | 428.5 (−30.4%) | 275.3 (−19.5%) |
The glass/resin ratio of 2.5463 kg glass per kg resin was found across all 56 baseline defect lines, confirming that glass is not an independent inventory item in this system: any valid resin estimate for a defect implies its glass requirement directly, which is used in the estimation method below.
2.4 Estimation method for Scenario 2 (rule of three) and robustness check
The material avoided in that scenario was estimated by a rule of three: material avoided = baseline material × defect-count reduction rate. The raw SGRE defect list for this scenario recorded 45 rows, of which 9 were excluded as not relevant or not related to the TURBO process, and 39 were retained as the official, consortium-reported result. The resulting defect-count reduction rate is (56-39) / 56 = 17/56 = 0.303571, i.e. 30.4%, applied uniformly to the baseline resin, glass and repair-time totals.
This approximation was cross-checked against a second, independent method, applied to the 28 (of 39 non-excluded) defects whose defect code shared a family prefix with a baseline defect (9 recognised families). For those defects, estimated resin was computed as declared length (mm) × a family-specific resin-per-millimetre ratio derived from the baseline; for the remaining defects (whose declared length proved incompatible with the baseline's physical scale, and is more likely an inspection or observation zone than a repair footprint), the baseline's average resin per defect (2.649 kg/defect) was used instead. This family-based check yielded an estimated resin mass of 100.164 kg, against 103.313 kg from the rule of three, a gap of -3.149 kg or -3.05%, confirming the rule of three within approximately 3% for this section.
2.5 Defect-type classification method
SGRE's defect codes are consistent across the three source lists (baseline, optimised infusion, ML), allowing defects to be grouped into families independently of the estimation issues affecting resin/glass masses in Scenario 2. All 56 baseline defect codes were grouped into four families: (i) dry spot/resin starvation defects attributable to the infusion flow front, (ii) root-end air pockets and local resin starvation, (iii) delamination, and (iv) other defects, including foreign objects and vacuum-filter debris. The same four families were applied to the optimised-infusion and ML defect lists. This classification uses defect counts only, which are directly observed in each source list.
2.6 Scaling to the full blade and to fleet level
To describe the physical inventory of a complete B108 blade, defect densities per square metre measured on the 16 m section were scaled linearly to the full 108 m B108 blade, a method confirmed by SGRE (defects/m2 × blade area = total defects). The resulting scaling factor is 4.293. This full-blade inventory was then multiplied by SGRE's realistic planned annual production for one plant (490 blades) to obtain fleet-scale annual figures.
3. Results
3.1 Section-level physical and environmental inventory
Table 3 presents the physical inventory and resulting CO2 eq impacts for the three castings of the 16 m section. Optimised infusion reduced total repair-related CO2 eq from 1,411.6 kg (baseline) to 983.1 kg, an avoided impact of 428.5 kg CO2 eq (calculation: 1,411.581-983.066 = 428.516 kg, i.e. 428.516/ 1,411.581 = 30.35%). The ML scenario reduced total repair-related CO2 eq to 1,136.2 kg, an avoided impact of 275.3 kg CO2 eq (1,411.581-1,136.248 = 275.333 kg, i.e. 275.333/1,411.581 = 19.50%). As shown in
Figure 1, the ML scenario's total impact remains between the baseline and the infusion scenario, rather than surpassing infusion's reduction.
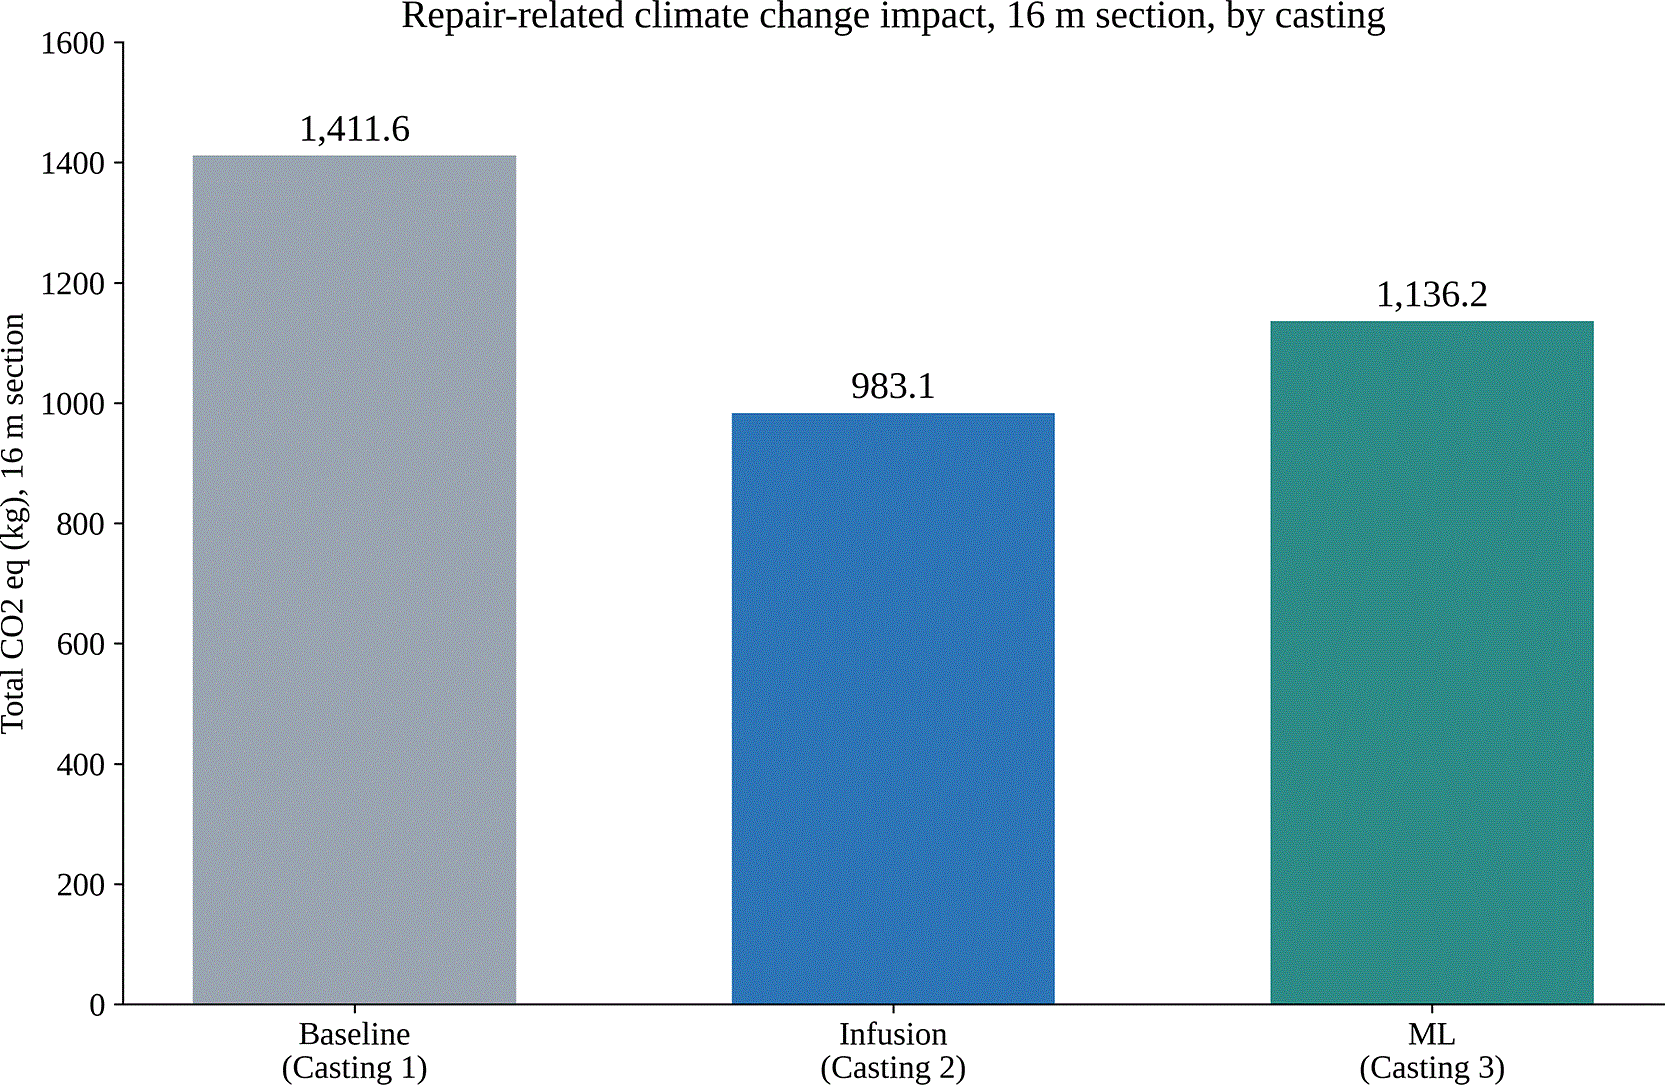
Figure 1. Repair-related climate change impact, 16 m section, by casting.
3.2 Decoupling between defect count and material reduction
As shown in
Figure 2, the ML scenario removed a larger share of defects than optimised infusion (32.1% vs 30.4% reduction in defect count: (56-38)/56 = 0.3214 and (56-39)/56 = 0.3036 respectively), but achieved a smaller reduction in material consumption (19.5% vs 30.4% for resin/glass). This decoupling reflects a change in the average size of the remaining defects: average repair time per defect rose from 117.9 min/defect at baseline (110 h × 60 /56 defects) to 236.3 min/defect under the ML scenario (149.667 h × 60/38 defects), an increase of 100.5%. The technologies evaluated here remove predominantly small, easily repaired defects; the defects that remain are, on average, larger and require heavier repair methods (e.g. countersunk repairs).
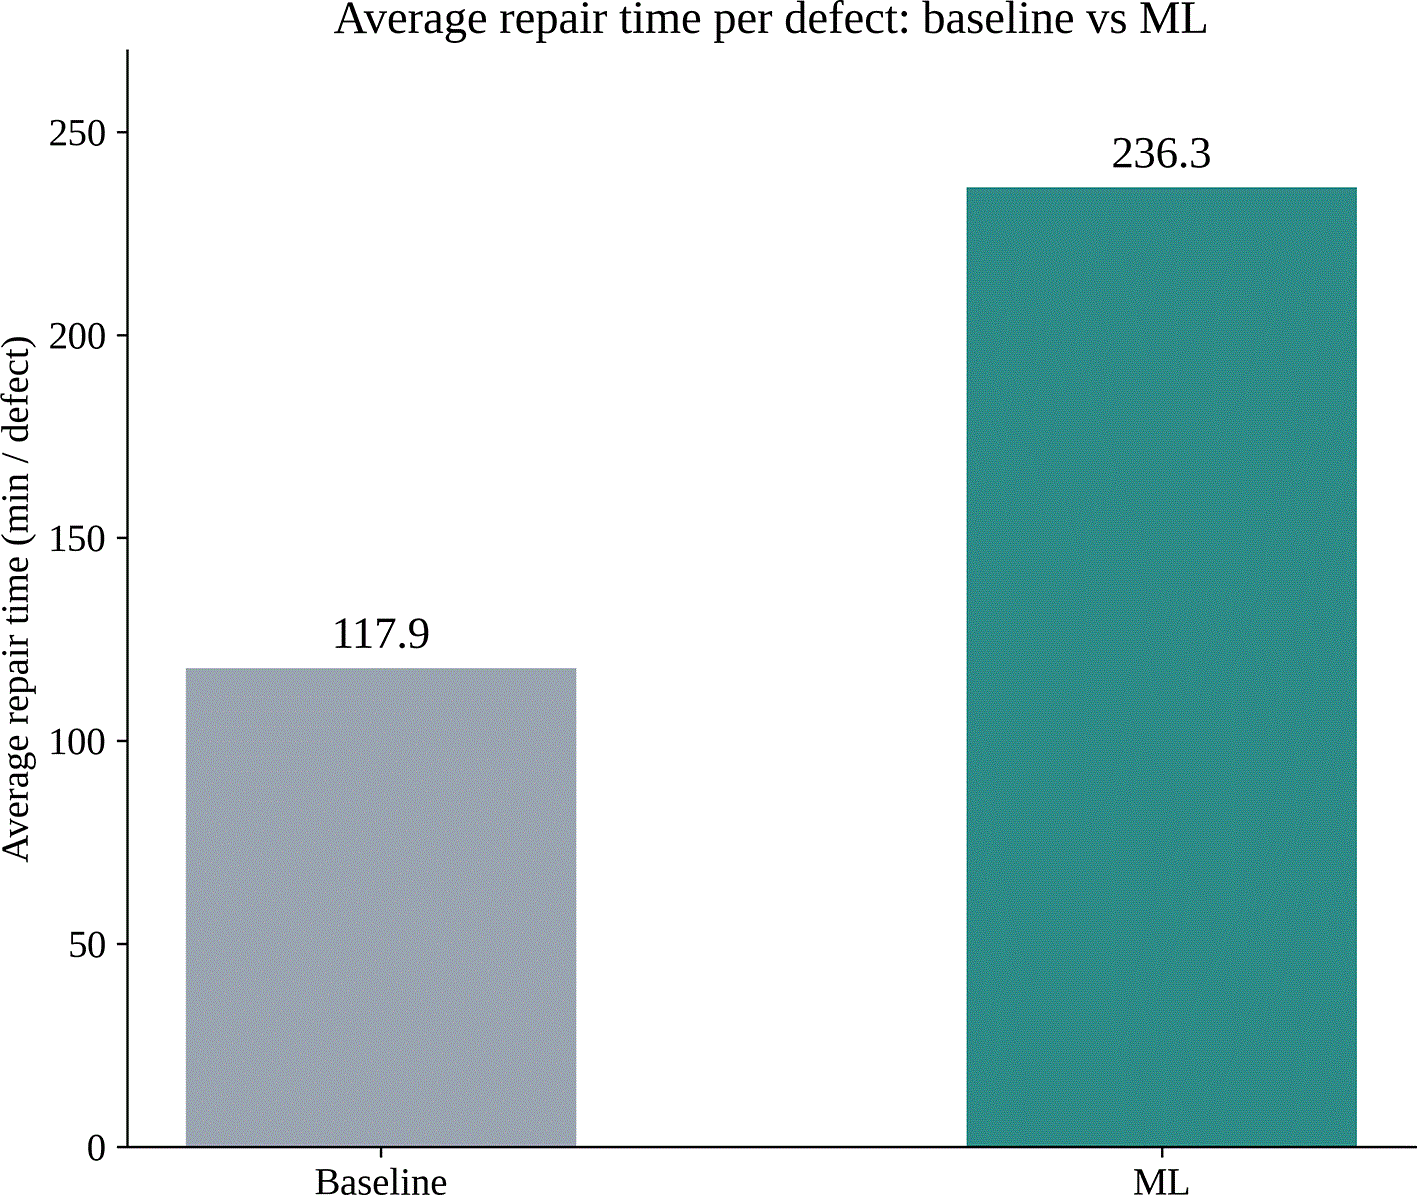
Figure 2. Average repair time per defect: baseline vs ML.
3.3 Which defect families are actually removed
Grouping defects into the four families defined in Section 2.5 shows that the two mitigation scenarios do not act uniformly across defect types.
Table 4 reports the defect count per family for each scenario, using directly observed counts (not resin-based estimates).
Table 4. Defect count by family, baseline vs infusion vs ML.
| Defect family | Baseline | Infusion | ML | Reduction, infusion | Reduction, ML |
|---|
| Dry spot (infusion-flow related) | 25 | 24 | 24 | −4.0% | −4.0% |
| Root-end air pockets | 12 | 2 | 0 | −83.3% | −100% |
| Delamination | 8 | 1 | 4 | −87.5% | −50.0% |
| Other (foreign object, filter debris, etc.) | 11 | 1 | 4 | −90.9% | −63.6% |
| Not observed in baseline (new defect types) | 0 | 11 | 6 | n/a | n/a |
| Total | 56 | 39 | 38 | - | - |
As we can see in
Figure 3, the two mitigation scenarios are highly effective at eliminating three of the four defect families: root-end air pockets, delamination and miscellaneous defects are all reduced by 50-100%. The dry-spot family stands out as the exception, remaining nearly unchanged (-4.0% for both infusion and ML), which points to it as the clearest remaining opportunity for further process improvement. As this family is also the largest in the baseline (25 of 56 defects, 44.6%), it naturally becomes a larger share of the defects that remain after mitigation: 66.7% of retained defects under optimised infusion (24 of 39) and 63.2% under the ML scenario (24 of 38). This helps explain the rise in average repair time per defect documented in Section 3.2, since dry-spot defects include some of the largest individual repairs in the baseline list.
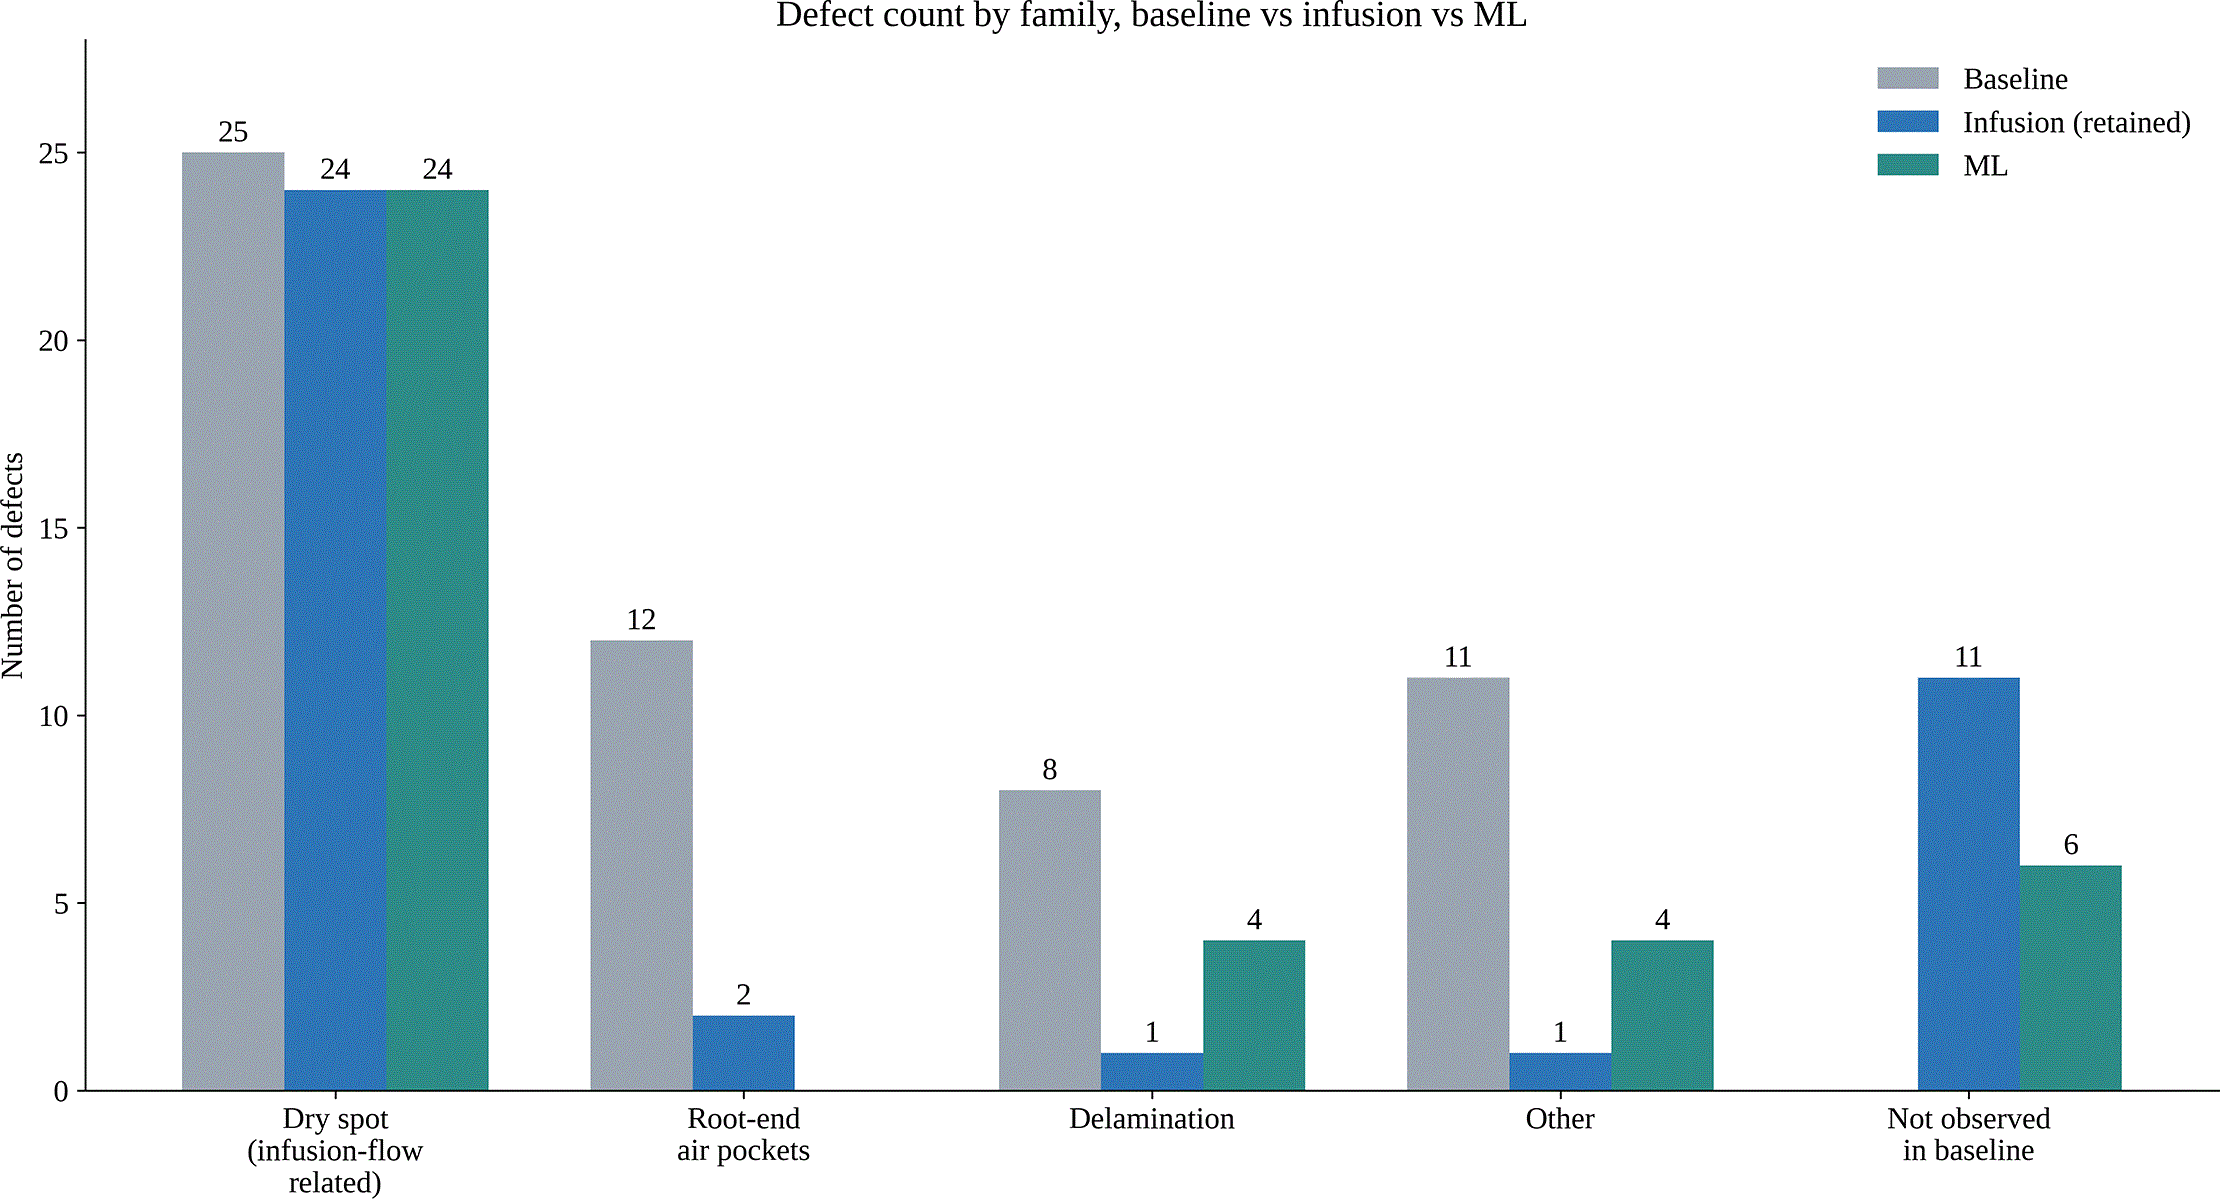
Figure 3. Defect count by family, baseline vs infusion vs ML.
3.4 Robustness check for the optimised-infusion estimate
In
Figure 4, the family-based robustness check (Section 2.4) confirmed the rule-of-three estimate for Scenario 2 within 3.05% on resin mass (and, by the fixed glass/resin ratio, an identical relative gap on glass mass), supporting the order of magnitude of the 30.4% CO2 eq reduction reported for that scenario, while the rule of three remains the primary calculation method used in this study.
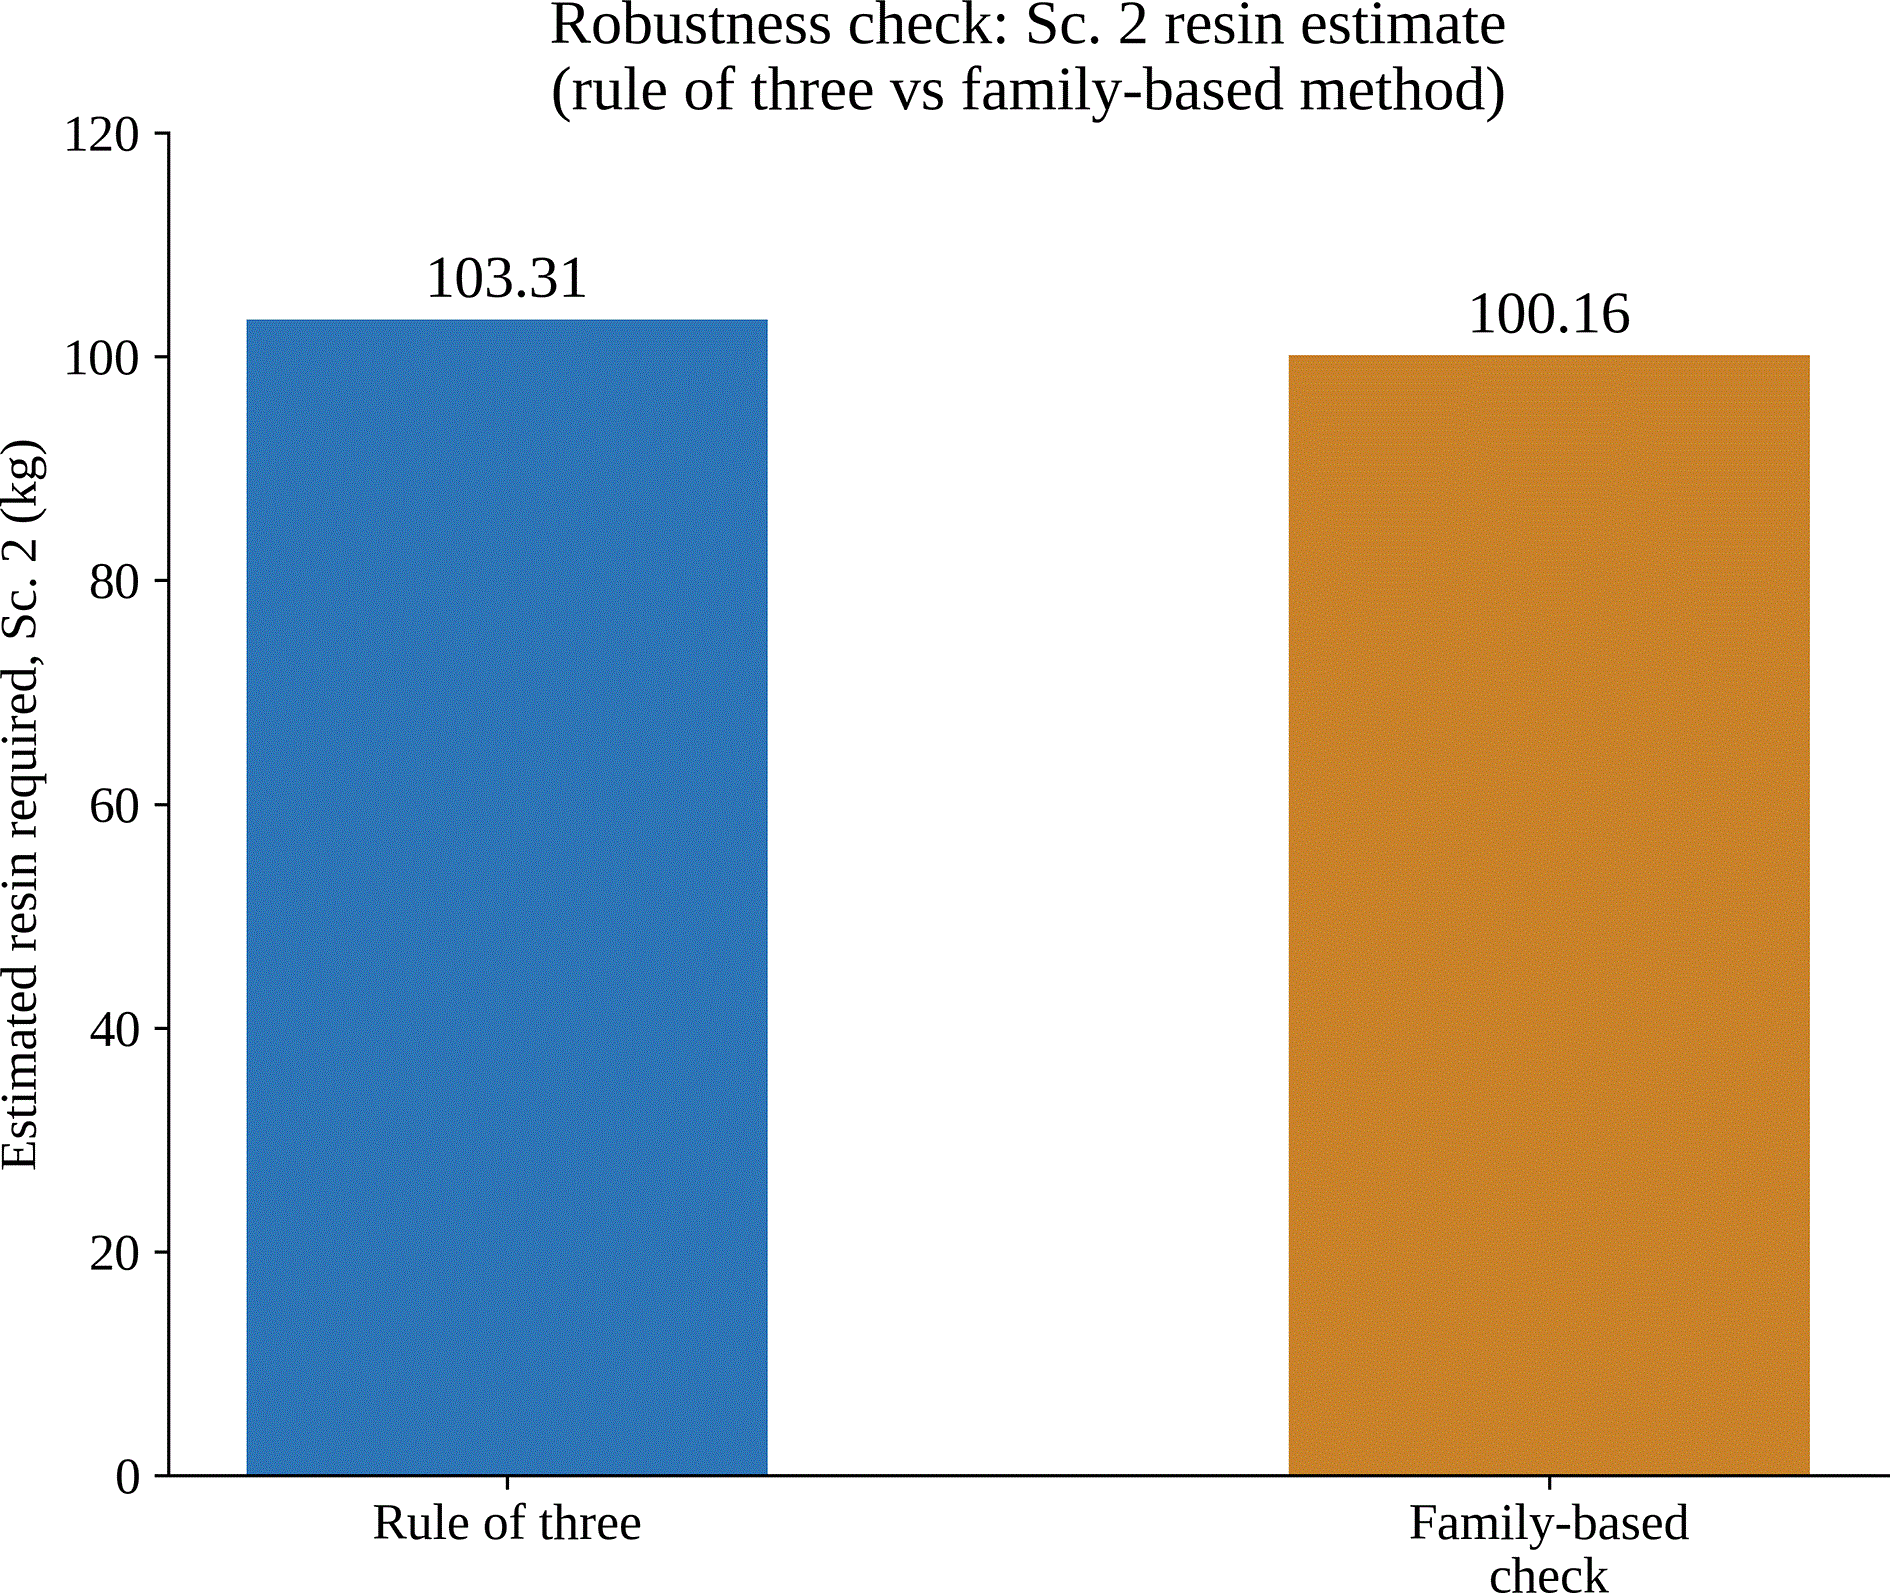
Figure 4. Robustness check: optimised-infusion resin estimate, rule of three vs family-based method.
3.5 Extrapolation to the full B108 blade
Table 5 and
Figure 5 extrapolate the section-level inventory to a full 108 m B108 blade using the surface-area scaling factor of 4.293 confirmed by SGRE for defect density transfer within the B108 mould.
Table 5. Physical inventory extrapolated to the full B108 blade, scaling factor 4.293.
| Indicator | Baseline | Infusion (Sc.2) |
ML (Sc.3) |
|---|
| Number of defects | 240.4 | 167.4 | 163.1 |
| Resin (kg) | 636.9 | 443.5 | 512.6 |
| Glass (kg) | 1,621.7 | 1,129.4 | 1,305.3 |
| Repair time (h) | 472.2 | 328.9 | 642.5 |
| Total CO2 eq (kg) | 6,060.1 | 4,220.4 | 4,878.0 |
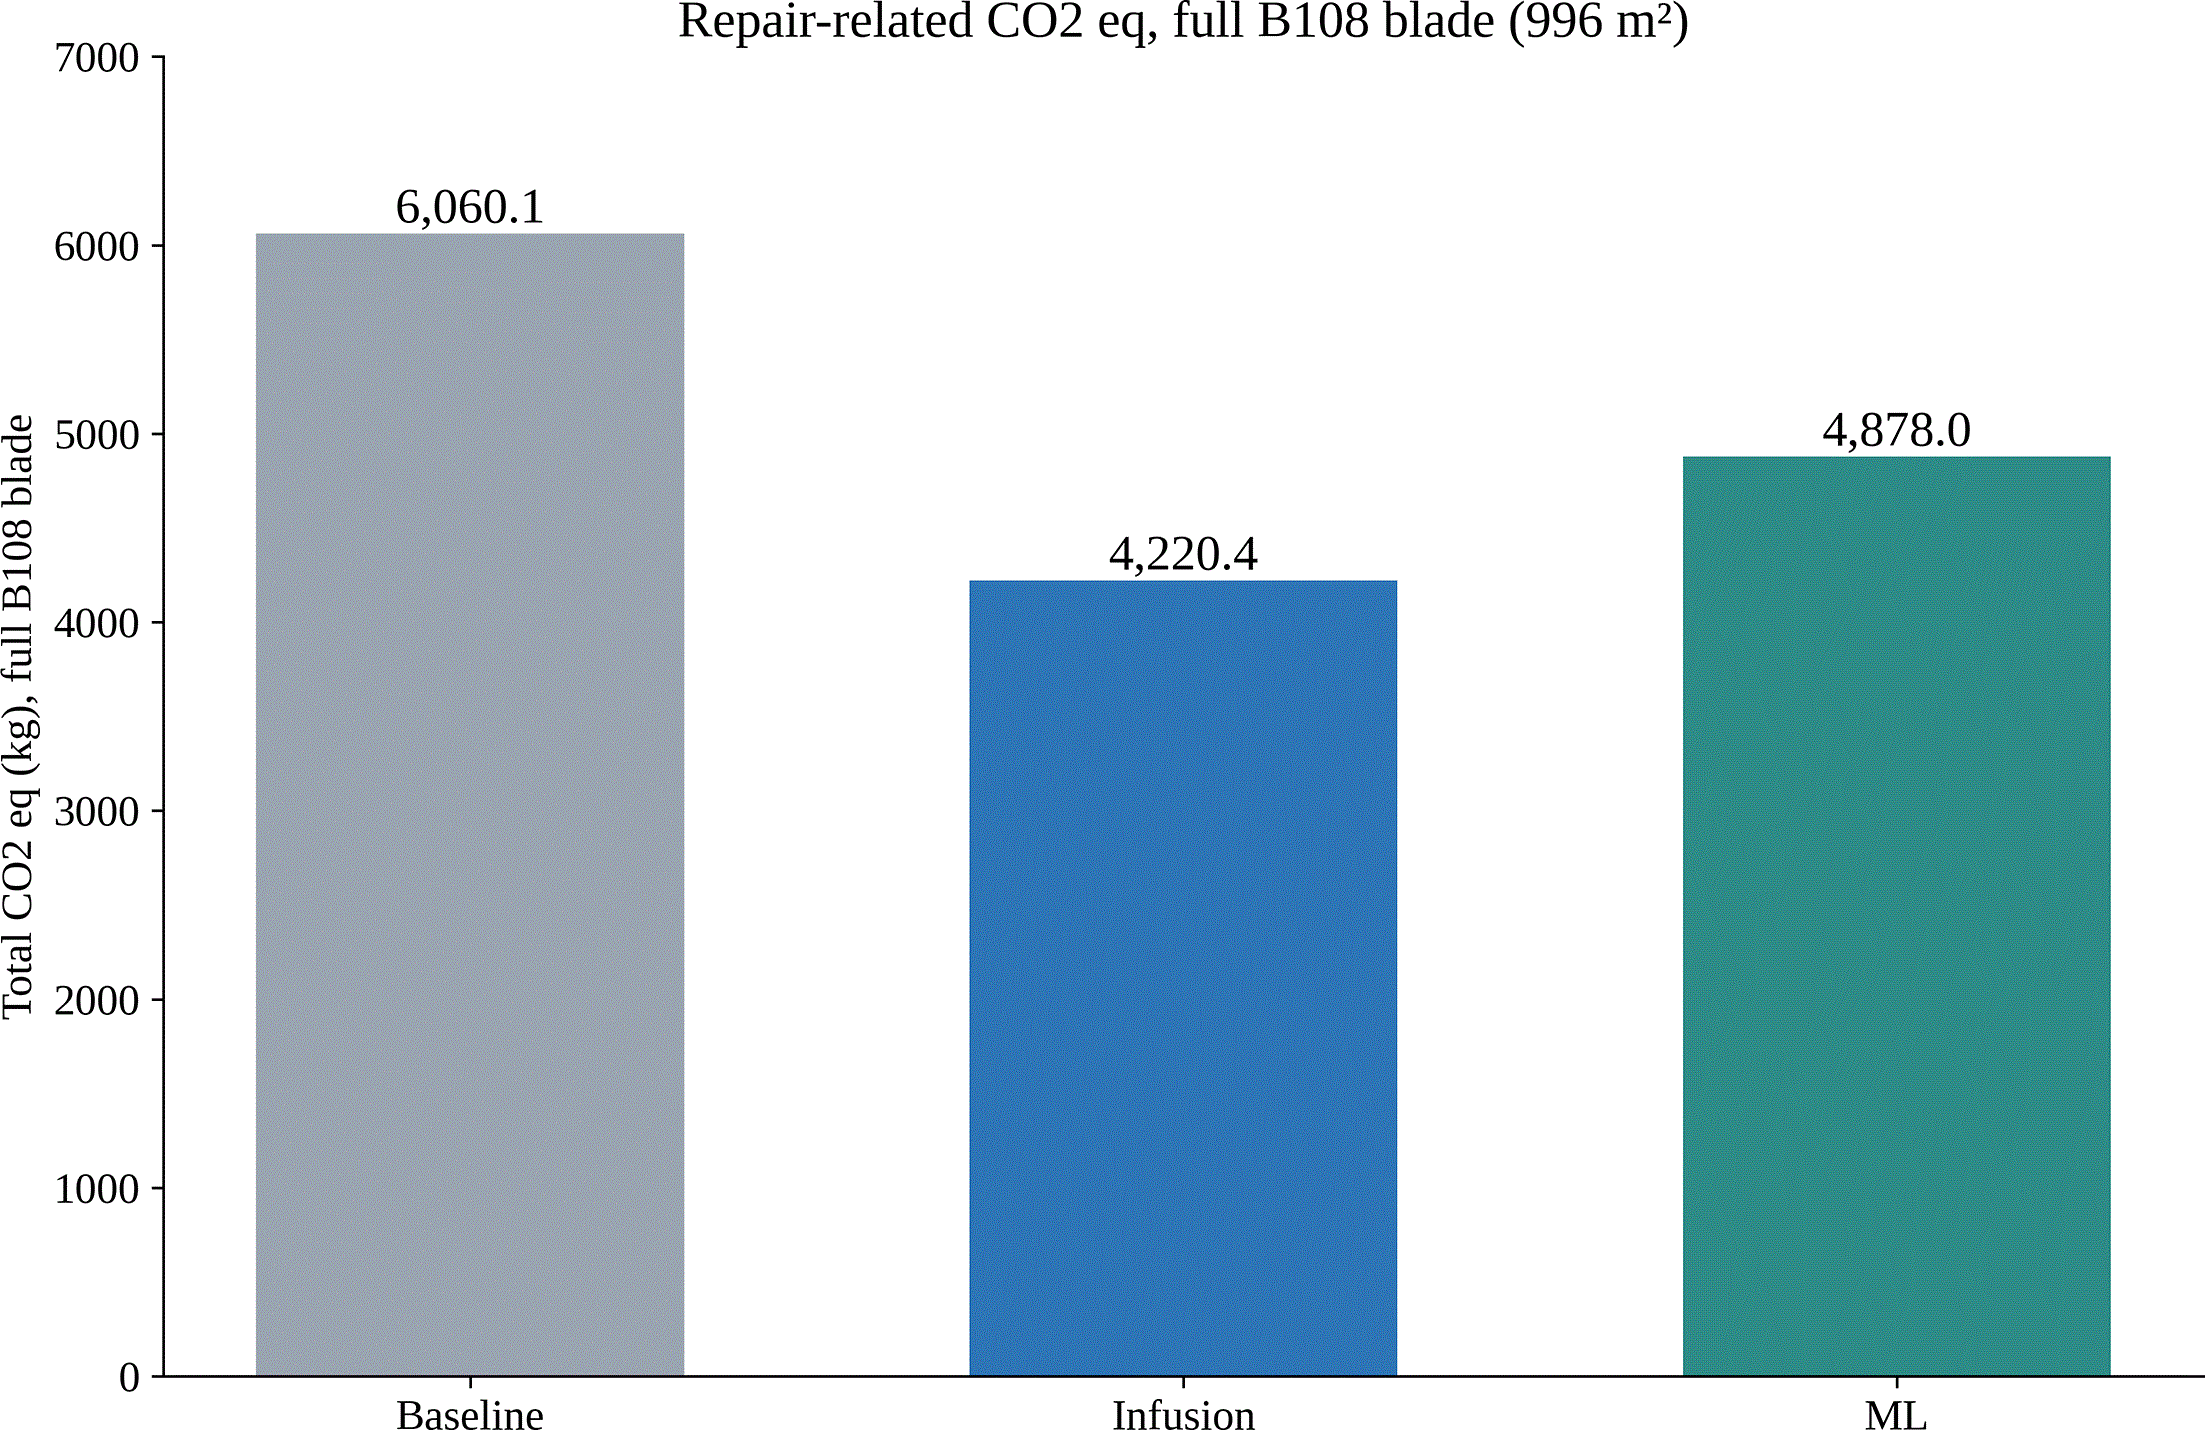
Figure 5. Repair-related CO2 eq extrapolated to the full B108 blade.
3.6 Fleet-scale annual impact
Scaled to a realistic annual production rate for one plant (490 blades/year, based on Aalborg), defect-repair impacts extrapolated to the full B108 blade (
Table 5) represent approximately 2,969.4 tonnes CO2 eq per year at baseline. As shown in
Figure 6, optimised infusion avoids 901.4 tonnes CO2 eq per year, leaving 2,068.0 tonnes CO2 eq per year still required; the ML scenario avoids 579.2 tonnes CO2 eq per year, leaving 2,390.2 tonnes CO2 eq per year still required.
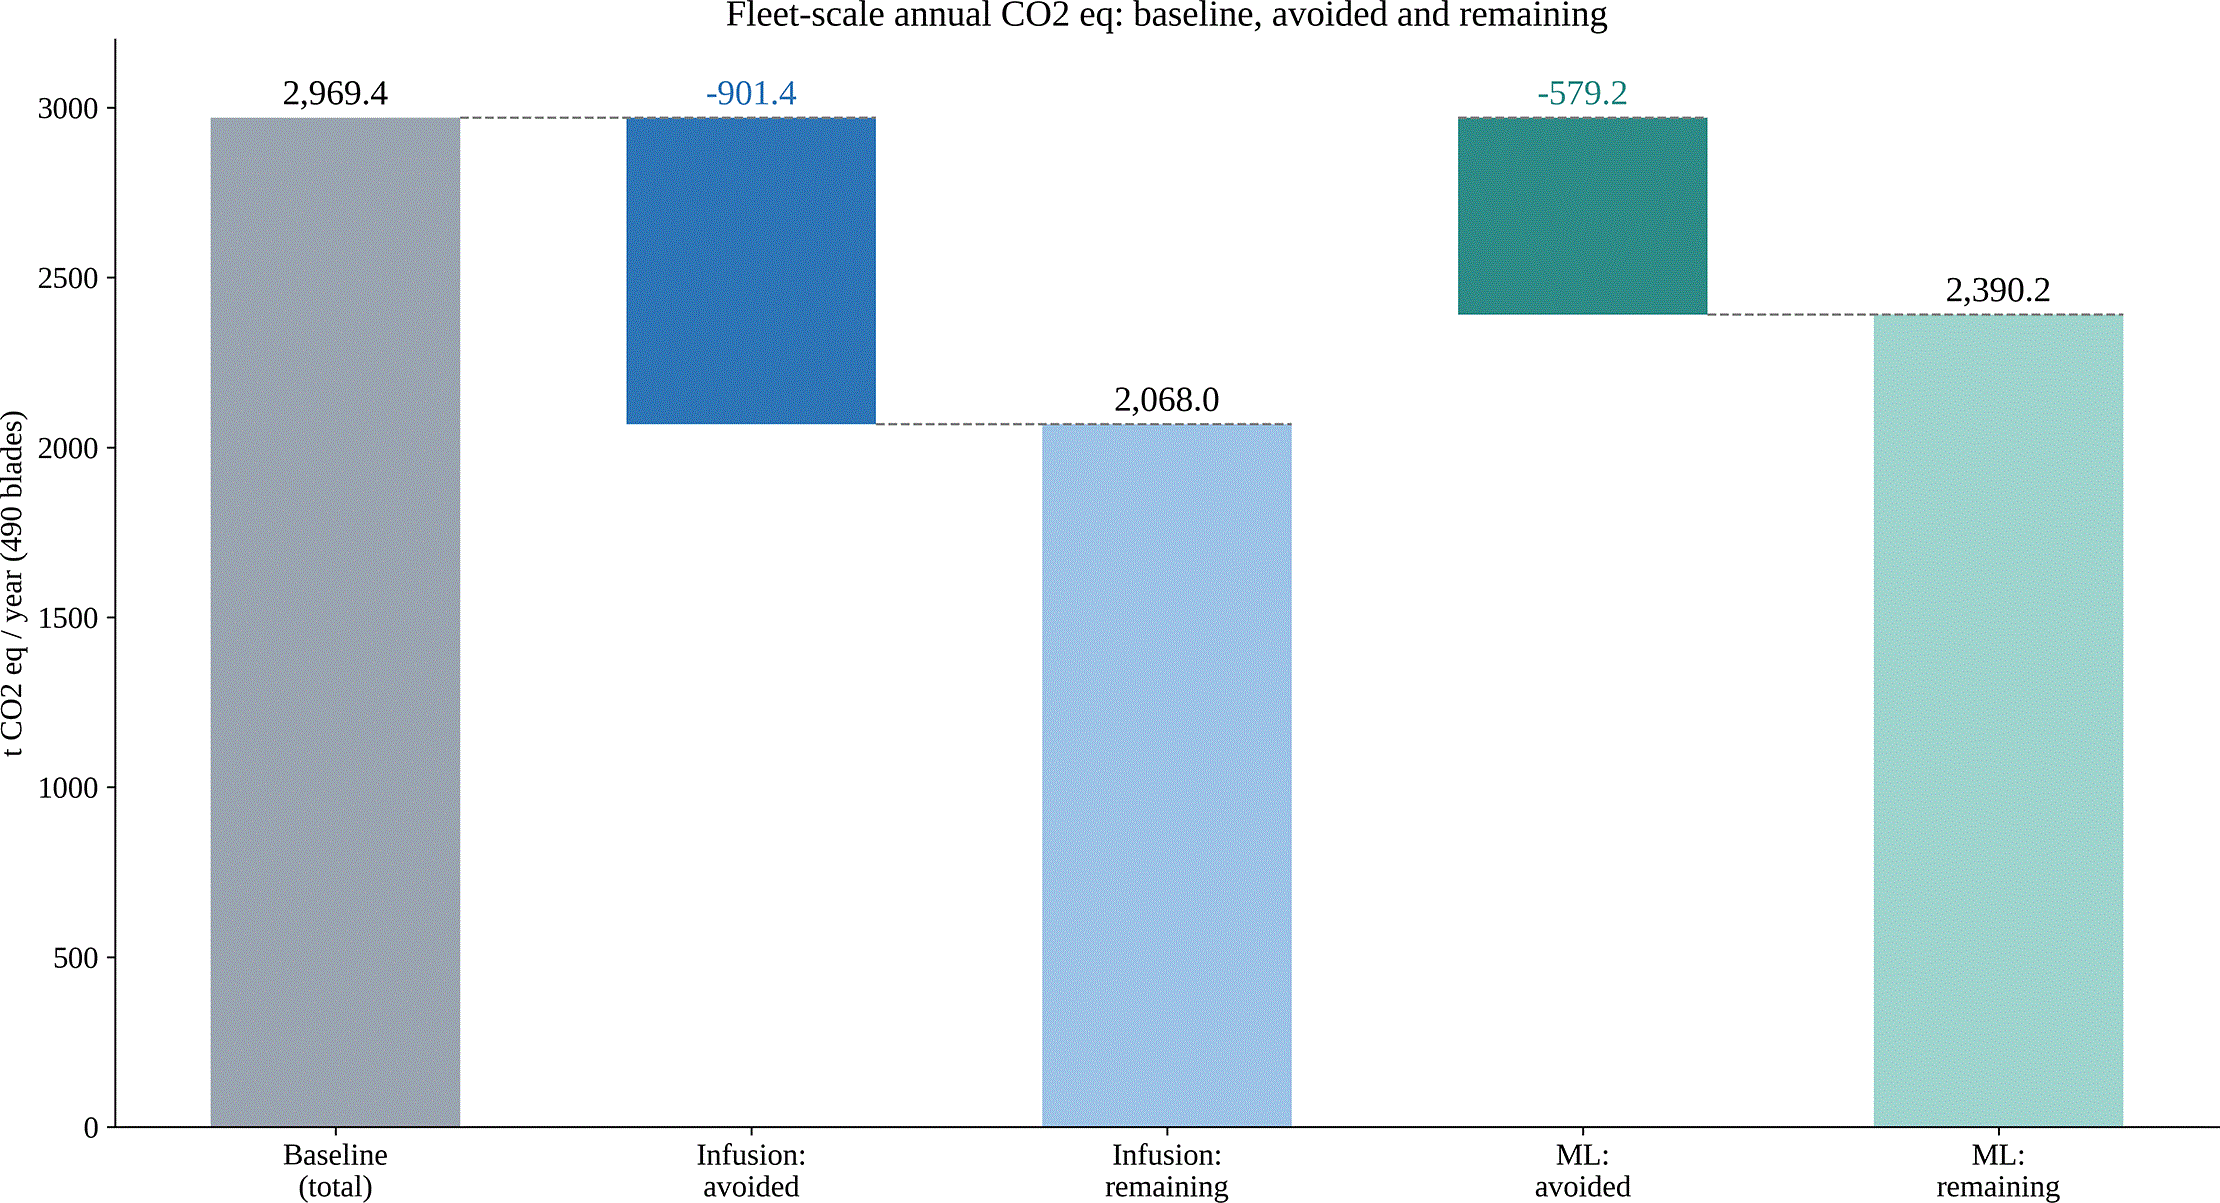
Figure 6. Fleet-scale annual CO2 eq, full B108 blade basis (490 blades/year).
4. Discussion
4.1 Progress achieved
This study confirms that TURBO technologies are already delivering measurable reductions in defect-repair carbon footprint: optimised infusion and the ML-controlled process each cut defect-repair CO2 eq by roughly one-fifth to one-third relative to the standard process. Manufacturing waste, including scrap and rework material, has been identified elsewhere as a significant contributor to a wind turbine blade's overall global warming potential, on the order of 10% of cradle-to-gate impact (Pender et al., 2025), which situates the reductions reported here within a meaningful share of the blade's manufacturing footprint. Both mitigation scenarios evaluated are highly effective at eliminating three of the four defect families identified in this work (root-end air pockets, delamination and miscellaneous defects), at rates from 50% to 100%. Comparable defect-reduction magnitudes have been reported elsewhere in wind blade manufacturing: a process-modelling and Six Sigma intervention in a wind blade factory achieved a reduction in defect count of more than 30% and a 14% reduction in repair time within one month of implementation (Oliveira et al., 2024), of a similar order to the reduction observed here for optimised infusion, though achieved through a different, non-technological route (process control and quality management rather than infusion or sensor hardware changes).
The defect-family breakdown shows that dry-spot defects, the largest single baseline family, are the type still largely untouched by either technology (-4.0%). This is consistent with the wider literature on vacuum infusion, where dry spots, caused by incomplete impregnation of the fibre reinforcement at the resin flow front, are recognised as a persistent and difficult-to-eliminate defect type even when flow-related process parameters are actively controlled, because they arise from local variations in fibre permeability and flow-front stability (Shevtsov et al., 2020). Because both mitigation scenarios evaluated here already target flow-related parameters, this points to a specific, well-characterised target for the next iteration of these technologies rather than an open-ended search.
The ML scenario's smaller net CO2 eq reduction, despite removing more defects by count than optimised infusion, should be read alongside the wider literature on machine-learning-based process control in composite manufacturing, which reports adaptive flow-control and defect-reduction gains of a broadly comparable order (Malashin et al., 2025), generally demonstrated under simulated or laboratory-scale conditions. The results reported here, from a physical, factory-representative demonstrator, illustrate some of the practical gap between simulated potential and factory-floor performance, including training data quality and the confounding process change described in Section 2.2, which are less visible in simulation-based studies.
4.2 Limitations
Two limitations should be kept in mind when interpreting these results. First, each scenario is based on a single physical casting; with n=1 per scenario, it is not possible to distinguish genuine process-driven improvement from ordinary casting-to-casting variability, and the reported reductions should be read as point estimates rather than statistically validated effects. Second, this study covers a single impact category, climate change; a full life cycle assessment under ISO 14040/14044 ((International Organization for Standardization, 2006a, 2006b) would require extension to a full impact category suite, identified as future work.
5. Conclusions
This study establishes a defect-level comparative carbon footprint assessment of wind turbine blade manufacturing, built on three physical demonstrator castings and real, measured post-manufacturing defect data. Optimised infusion reduced defect-repair CO2 eq by 30.4% relative to a standard-process baseline; a sensors-plus-machine-learning configuration, reduced it by 19.5%, a smaller benefit than its defect-count reduction (32.1%) alone would suggest, because it disproportionately removes small, easily repaired defects while leaving larger ones. A breakdown by defect family further shows that three of the four families are nearly eliminated by both mitigation scenarios, with dry-spot defects standing out as the clear next target: still barely reduced despite both technologies acting on the infusion process that plausibly causes them. Scaled to the full B108 blade and to SGRE's annual production, the reductions already achieved represent several hundred tonnes of avoided CO2 eq per year. Future work should extend this analysis to a full impact category suite and replicate castings per scenario to validate the reductions statistically.
Ethics and consent
Ethical approval and consent were not required.
Data availability
The defect inventories underlying this study (post-manufacturing quality-control records for the three demonstrator castings) are restricted. These datasets were generated and are held by SGRE as part of internal manufacturing quality-control records, and contain commercially sensitive information about SGRE's production process, including process parameters and defect-level production data, that could be of competitive value if disclosed. The restriction is commercial, not ethical. No Institutional Review Board or equivalent ethics body was involved, as none was required for this type of dataset.
Readers or reviewers wishing to request access to the underlying datasets may contact the corresponding author, Léo Staccioli (leo.staccioli@arditec.net), or Grégoire Lebreton, SGRE (gregoire.lebreton@siemensgamesa.com). Access requests are considered by SGRE on a case-by-case basis and may be granted for legitimate research purposes, subject to SGRE's prior approval. Access is not automatic and is not guaranteed.
The derived, non-confidential physical and environmental inventory values reported in
Table 3,
Table 4,
Table 5 of this article, which underlie all figures, represent the complete quantitative basis for the results, methods and conclusions reported in this article and are freely available within the manuscript itself.
Acknowledgements
During the preparation of this manuscript, the authors used Perplexity to assist with grammar and language editing. The authors reviewed and edited the output as needed and take full responsibility for the content of this publication.
References
- European Commission:
Towards tURbine blade production with zero waste (TURBO) (Grant Agreement No. 101058054) [Project].
CORDIS;
2022.
- International Organization for Standardization:
Environmental management - Life cycle assessment - Principles and framework (ISO 14040:2006).2006a.
- International Organization for Standardization:
Environmental management - Life cycle assessment - Requirements and guidelines (ISO 14044:2006).2006b.
- Malashin I, Martysyuk D, Tynchenko V, et al.:
Data-driven optimization of discontinuous and continuous fiber composite processes using machine learning: A review.
Polymers.
2025; 17(18): 2557.
- Murdy P, Hughes S, Barnes D:
Characterization and repair of core gap manufacturing defects for wind turbine blades.
J. Sandw. Struct. Mater.
2022; 24(7): 2083–2100.
- Oliveira D, Teixeira L, Alvelos H:
Integration of process modeling and Six Sigma for defect reduction: A case study in a wind blade factory.
Procedia Computer Science.
2024; 232: 3151–3160.
- Pender K, Romoli F, Bacharoudis K, et al.:
Evaluating priority strategies for decarbonising offshore wind turbine blades through lifecycle assessment.
Clean Techn. Environ. Policy.
2025; 27(7): 2919–2936.
- Shevtsov S, Zhilyaev I, Chang SH, et al.:
Experimental and numerical study of vacuum resin infusion for thin-walled composite parts.
Appl. Sci.
2020; 10(4): 1485.







