1. Introduction
Nanostructured coatings are a cornerstone of advanced surface engineering, offering superior mechanical strength, enhanced wear resistance and improved functional properties compared to conventional microcrystalline materials.1 The performance of these coatings is intrinsically governed by a complex interplay of material composition, microstructure and processing parameters and the choice of the right manufacturing process is critical to generate reliable, safe and durable structures. Among the various fabrication techniques, electrodeposition has emerged as a particularly versatile and scalable method for producing dense and porosity-free nanocrystalline coatings. Electrodeposition is a process in which a metal or alloy is deposited onto a conductive substrate in the presence of an electric current and is commonly used for coating materials by enhancing their surface properties, including corrosion and wear resistance or electrical conductivity. The process involves immersing the substrate (cathode) and a metal source (anode) in an electrolyte solution (bath) containing metal ions. When an external voltage is applied, metal ions migrate towards the cathode and reduce to form a thin, uniform metal coating. Within this field, nickel (Ni) electrodeposition is of paramount industrial importance due to the material’s excellent corrosion resistance, hardness and ability to form uniform coatings,2 which makes it one of the most employed metals for both functional and decorative purposes, with multiple applications in different industries, including electronics, automotive and aerospace.2 When voltage is applied, metal ions undergo reduction at the cathode, forming a solid metal deposit through the reaction
+ 2
→ Ni during Ni deposition.
During electrodeposition, several main components dispersed in the bath guarantee coating stability and quality, including metal salts, additives, acids and nanoparticles (NPs). Metal salts serve as the source of metal ions, ensuring a steady supply of ions for deposition. Additives play a crucial role in modifying the deposit characteristics, including leveling agents for surface smoothness, brighteners for enhanced reflectivity, suppressors for controlled deposition rates and stress relievers to prevent internal defects like cracking or peeling. Acids, such as sulfuric acid (
) and boric acid (
), regulate pH and conductivity, ensuring stable electrochemical reactions.3 NPs can be incorporated into the bath to form composite coatings, improving hardness and corrosion resistance. Frequently, surfactants are also present to prevent aggregation and segregation phenomena.
The presence of NPs in the bath results in an enhancement of the corrosion resistance, since they can act as physical barriers against corrosive agents.4 Additionally, they can also reduce friction by facilitating easy shear between layers and improve wear resistance by reinforcing the metal matrix against mechanical degradation.5 Therefore, the study of the impact of NPs on surface texture is critical. The incorporation of NPs into the Ni polycrystalline matrix during electrodeposition significantly influences the solidification process, affecting both columnar growth and surface texture, since they can act as heterogeneous nucleation sites, promoting the formation of finer grains and altering the crystallographic texture of the deposit.6
The NP concentration, size and shape play crucial roles in these effects. Higher concentrations of NPs generally increase the number of nucleation sites, resulting in a more pronounced grain refinement. However, excessive NP content can lead to agglomeration, which may adversely affect the uniformity of the deposit. Similarly, smaller particles provide a larger surface area for nucleation but may be more prone to agglomeration, and the shape of the NPs influences their interaction with the growing matrix and can promote anisotropic growth. This would prevent columnar growth, thus enhancing mechanical properties, since columnar grain boundaries facilitate crack propagation. Furthermore, NPs also promote the formation of smoother and more compact surfaces.4 Additionally, as well as the chemical composition, properties of electrodeposited Ni like texture or hardness are highly sensitive to process parameters. These include the bath temperature, current density and the use of agitation methods.
Due to the importance of NPs and fabrication process parameters during electrodeposition, different experimental techniques and simulation methods have been employed for this analysis in the literature. Experimentally, coatings generated in the presence of NPs have been characterized using scanning electron microscopy (SEM), transmission electron microscopy (TEM), X-ray diffraction (XRD) and energy-dispersive X-ray spectroscopy (EDS) to analyze microstructure, NP distribution and phase composition. Mechanical and corrosion properties have been evaluated via hardness tests, wear tests and electrochemical measurements.4,6,7,8,9 Simulation methods, such as molecular dynamics (MD), finite element analysis (FEA) and Monte Carlo simulations, have been used to model NP-matrix interactions, deposition kinetics and stress distribution, providing insight into the mechanisms governing NP incorporation and coating performance.10,11,12,13 However, it was still not possible to understand the impact of NP properties together with process parameters on final coating properties. To address this gap, we developed a phase-field model to simulate the polycrystalline electrodeposition of nickel in the presence of NPs with varying geometries and concentrations. The insights from these simulations are then analyzed using machine learning (ML), specifically a Random Forest classifier, to identify the most influential parameters controlling microstructure development. Furthermore, Explainable Artificial Intelligence (xAI) techniques, namely the SHAP tree explainer, are applied to decode the complex, non-linear relationships within the model. This combined methodology aims to provide a deeper, more fundamental understanding of the electrodeposition process, offering predictive capabilities that can guide the experimental design of next-generation nanocomposite coatings. The simulation methodology and ML framework are detailed in Section 2, with the results and discussion presented in Section 3.
2. Methods
a. Phase-field modelling
Phase-field modelling is a computational technique that uses continuous field variables to describe microstructural evolution by solving coupled partial differential equations based on thermodynamic and kinetic principles.14,15,16 In the study of the polycrystalline Ni electrodeposition with NPs suspended in the electrolyte, we characterize the different Ni grains with order parameters
where
and
is the number of grains, and the different NPs with order parameters
where
and
is the number of NPs. These order parameters take the value
inside the region they represent and
outside, and all of them are equal to
in the electrolyte. Additionally, the concentration of ions in the electrolyte is described by the concentration field
and the electrostatic potential field by the variable
. The general equations governing the evolution of the order parameters and concentration are given by the Allen-Cahn and Cahn-Hilliard equations,17 respectively:
where
is the interface mobility,
is the ion mobility and
is the total free energy of the system. Since the total free energy includes chemical, gradient and electrostatic contributions, the equations for the evolution of the order parameters representing Ni grains can be written as
18:
where
and
are the interface mobility and a pre-factor related to reaction exchange current, respectively,
is a double well potential function with
being the transition barrier energy, which is different for the grain/liquid interface and grain/grain interface,
is an interpolation function,
and
define the strength of the nucleation and pinning terms,
is a gradient coefficient penalizing gradients,
is a symmetric function,
is the cation valence,
is the overpotential, and
,
and
are the gas constant, room temperature and Faraday constant, respectively. Since no coarsening is observed during electrodeposition, the barrier energy is set to a larger value at grain/grain interfaces than at the Ni/electrolyte interface (
, with
J/
).
18 The overpotential
represents the excess potential energy due to the application of an external electrostatic field, and determines the reaction rate during electrodeposition. The second term, in brackets, represents the Butler-Volmer equation,
18 which controls the electrodeposition reaction rate.
On the other way, since NPs are considered as fixed particles and are not allowed to seggregate or aggregate, their positions do not change over time:
In this work, out-of-plane effects, particle rotation, aggregation and segregation are not captured. However, the assumption that NPs remain immobile and do not aggregate during the deposition process is supported by experimental observations under the operating conditions considered in this work.19 In electrodeposition systems, NPs are typically stabilized in the electrolyte through a combination of Brownian motion, hydrodynamic agitation and the use of surfactants, which effectively prevent rapid aggregation and sedimentation.19,20,21
The evolution of the ion concentration is given by18:
where
determines how much NPs reduce the ion mobility,
is the ion diffussion coefficient,
is the site density of the metal and
is the cation concentration in electrolyte. The last term represents the conversion of
ions into Ni metal at the solid/liquid interface.
Finally, the electrostatic field evolves as follows18:
where
and
are the conductivities of the electrolyte and Ni phases, respectively, and
quantifies the effect of the NPs on it.
The electrodeposition process was modeled using the described phase-field framework implemented via a custom Python script within the FEniCS finite-element library.22,23 The simulations were performed on a 2D computational domain, where the coupled partial differential equations were solved to capture the evolution of the electrolyte/metal interface. Nanoparticles of specified geometries (spherical and 2D lamellar) and volume fractions were explicitly incorporated into the domain as immobile inclusions. Circular inclusions correspond to 2D projections of spherical NPs, whereas elongated rectangular inclusions represent lamellar particles, serving as simplified projections of plate-like nanomaterials such as graphene or
. These representations are not intended to reproduce the full three-dimensional morphology of NPs, but rather to capture their effective geometrical interaction with the evolving solid-liquid interface within a reduced-dimensional framework. However, since the key physical effects of interest, such as interfacial pinning, drag or anisotropic obstruction of grain growth, primarily depend on the local geometry and spatial distribution of obstacles relative to the growth direction, our consistent 2D framework allows evaluating the relative influence of NP geometry on microstructure evolution within our studied parameter space. Multiple simulations varying model parameters and NP concentrations and types were run to generate a database with details about 5789 phase-field simulations.
A numerical convergence study was performed to ensure the robustness of the simulation results. Mesh refinement analyses were conducted by systematically increasing the spatial resolution until variations in grain morphology, dynamics and stability became negligible. Similarly, time-step sensitivity was evaluated by reducing it and verifying that the evolution of the microstructure remained unchanged. These analyses confirm that the reported results are independent of the chosen discretization. Then, multiple simulations varying model parameters and NP concentrations and types were run to generate a database with details about 5789 phase-field simulations.
b. Artificial Intelligence
i. Random Forest Classifier
The random forest classifier is an ML method used for classification tasks, which works by constructing multiple decision trees trained on different subsets of training data and returning the most common output as the final result. The algorithm begins by creating a diverse set of decision trees, each trained on a different subset of the training data. For each decision tree, the algorithm usually also selects a random subset of input features at each split point, rather than considering all features, which helps introduce variability among the trees and reduce the risk of overfitting. Thanks to their training algorithm, random forest classifiers are less sensitive to noise and outliers in the data, which makes them a powerful and versatile algorithm that is widely used in various use cases, including text classification, image characterization or fraud detection.24
To ensure reproducibility and deterministic results, all random processes involved in data splitting and model training were controlled using fixed random seeds. The dataset was divided into training and test subsets using a fixed split, and the Random Forest model was initialized with the same seed. Input features were standardized using a scaling procedure to ensure comparable magnitudes, by removing the mean and scaling to unit variance to all features, and no feature selection was applied, as all variables correspond to physically meaningful model parameters. To verify robustness, the training and evaluation procedure was repeated across multiple data splits, yielding consistent performance and confirming that the results are not sensitive to a particular partition. Only input parameters were used as predictors, and no information derived from simulation outcomes was included in the feature set. The test dataset was strictly held during training, the entire dataset was found to be sufficiently balanced and model performance was verified across classes to ensure unbiased predictions by computing metrics such as precision, recall and F1-score.
In our study of the NP-reinforced electrodeposition process, the dataset comprised microstructural outcomes from 4497 phase-field simulations with spherical NPs and 1292 simulations with spherical 2D NPs projected in a 2D simulation box, and was randomly split into training (85%) and test (15%) datasets. We employed random forest classifier implemented via the scikit-learn Python module, utilizing an ensemble of 100 decision trees with Gini impurity as the splitting criterion. The classifier was trained to differentiate stable/unstable simulations, and then, for the stable ones, simulations with columnar or non-columnar growth. For both cases, the model’s performance yielded an accuracy of 97.8% and 85%, respectively, and a macro-averaged F1-score of 0.97 and 0.84, respectively. A confusion matrix analysis confirmed high predictive accuracy in both classification problems with reduced small values in off-diagonal cells and consequently no significant bias. We observed a higher precision in the detection of columnar growth (0.91 vs 0.78 for non-columnar growth), thus meaning that it might be easier to apply reverse engineering via optimization algorithms when the target structures presented columnar growth. The trained random forest models were finally interpreted using SHAP (SHapley Additive exPlanations) to provide consistent, global feature importance rankings and individual prediction explanations. The details of this technique are provided in the following subsection.
ii. SHAP Tree Explainer
The SHAP Tree Explainer is a powerful xAI method for interpreting tree-based ML models, such as decision trees, random forests and gradient boosting models. In practical applications, SHAP Tree Explainer has been widely used in domains requiring xAI, including credit scoring, medical diagnosis and risk assessment.25 It has proven to be a reliable tool for ensuring transparency in ML models, detecting biases, and uncovering unexpected model behaviours. It leverages game-theoretic principles to understand how different input variables impact the output of complex ensemble models. The SHAP Tree Explainer works by decomposing a model’s predictions into additive contributions from each feature, and the SHAP value for a feature is the average change in model output by conditioning on that feature when introducing features one at a time over all feature orderings.26 The feature importance values reported in this work correspond to the mean absolute SHAP values computed across the samples in the dataset. This metric represents the average magnitude of the contribution of each feature to the model predictions and is used to rank the relative importance of the input parameters.
3. Results and Discussion
In this work, we simulated Ni electrodeposition in the presence of NPs with different types, shapes and sizes, at room temperature. The metal matrix consisted of polycrystalline Ni, with typical grain sizes around 10 μm, as observed experimentally with sizes between 1–10 μm depending on the type of current (direct or pulse) used, the current density, electrolyte composition, additives and bath temperature. Grain boundaries in electroplated Ni are generally stable during the plating process, meaning that grain growth during the electrodeposition process does not occur or is negligible. The number of NPs in the simulation domain and their radius influences the effective interaction with grain boundaries. Larger particles provide stronger pinning effects due to their increased interfacial contact, whereas smaller particles contribute to a more homogeneous distribution of pinning sites. However, the NP sizes and fractions used in the present work are in good agreement with the observed in experiments, where NPs sizes are comparable or slightly smaller than the initial Ni grain sizes.27,28,29 Additionally, experiments showed that NPs do not have a driving force to move towards the solid/liquid interface without the influence of an external field, and they do not immediately segregate, precipitate or accumulate at this interface. NPs remain suspended in the bath, maintained by Brownian motion and agitation within the electrolyte. Surfactants are also often used to stabilize the NPs and prevent agglomeration, thus contributing to a uniform distribution of NP sizes throughout the electrolyte.19
During electrodeposition, it was observed that solidification and deposition primarily occur from the NPs that reach the cathode, while they do not occur directly from NP clusters dispersed in the bath. Furthermore, NPs at grain boundaries can inhibit grain growth, preventing columnar grain structures and promoting finer, equiaxed grains. However, at the moment there is no further evidence of this phenomenon other than the results of improved Vickers microhardness measured on the nanocomposite coatings. As a consequence, we wanted to analyze this effect via phase-field simulations.
These modelling assumptions are grounded in experimental studies performed at laboratory and pilot scale. Ni-based nanocomposite coatings were synthesized using modified Watts-type electrolytes, where the conventional boric acid buffer (
) is replaced by combinations of organic acids selected via Safe-and-Sustainable-by-Design (SSbD) criteria. Recent work leveraging generative models to identify SSbD-compliant substitutes for boric acid in nickel electroplating provides additional support for the electrolyte design strategy adopted in our experiments.30 Hull Cell screenings evaluated 14 candidate acids with different pKa values, of which some of them (e.g., citric, succinic, acetic, glutaric, tartaric and oxalic acid) demonstrated stable pH buffering behaviour and suitable electrodeposition performance. These electrolytes contained
salts, chloride ions for anode activation, and the selected organic acid as the primary buffering component.
To produce nanocomposite coatings, the electrolytes were reinforced with ceramic (
, SiC) and 2D nanoparticles (graphitic materials such as graphene-based platelets), all of which had been pre-functionalized or dispersed using controlled ultrasonication protocols to ensure stability and prevent aggregation. Surfactants were included when necessary to avoid particle agglomeration and to maintain a uniform size distribution. Their use is consistent with the project’s SSbD constraints, meaning that substances listed as Substances of Very High Concern (SVHCs) under Registration, Evaluation, Authorisation and Restriction of Chemicals (REACH) regulations31 were excluded from all formulations. The NP dispersions were continuously monitored with OF2i (Optofluidic Force Induction),32,33 DLS, and NTA systems to prevent segregation and to verify absence of particle accumulation at rest, directly supporting our model assumption that NPs remain homogeneously suspended rather than migrating toward the solid–liquid interface.
Furthermore, electrodeposition trials performed at small scale (2 L), bench scale (14 L), and pilot scale (120 L) revealed that nanoparticles do not segregate or accumulate at the cathode surface in the absence of external fields. Instead, they remain in suspension through Brownian motion and hydrodynamic agitation, confirming that their incorporation occurs only upon physical arrival at the cathode during growth. This behaviour was consistently observed across baths containing SiC,
, and 2D materials, aligning with the assumption in our simulations that NP positions are fixed and that no spontaneous clustering takes place during the deposition window.
Finally, the motivation for selecting these specific NP systems originates from experimental friction and wear results showing that
, SiC, and 2D nanomaterials substantially reduce friction coefficients and increase coating durability, particularly under forming or sliding conditions (e.g., friction coefficient mapping and lifetime tests). Their capacity to modify solidification fronts, through drag reduction (2D materials) or enhanced wettability (metal oxides), makes them ideal candidates for evaluating their influence on columnar growth suppression.
In our computer simulations, the simulation box consisted of a 2-dimensional
domain containing 5 Ni grains and different number of NPs with same radius as the initial mean grain size (see Figure 1). This setup allowed us to probe the interaction between the growing metal matrix and incorporated particles, and the 2-dimensional approach was enough to reproduce the phenomena. For this, we ran phase-field simulations with circular and rectangular NPs and with different number of NPs. In order to study the impact of process and material parameters on surface roughness and columnar growth, we analyzed the effect of the parameters listed in
Table 1 with a random forest classifier,40 and used xAI with the SHAP tree explainer to understand the impact of the different model parameters individually.
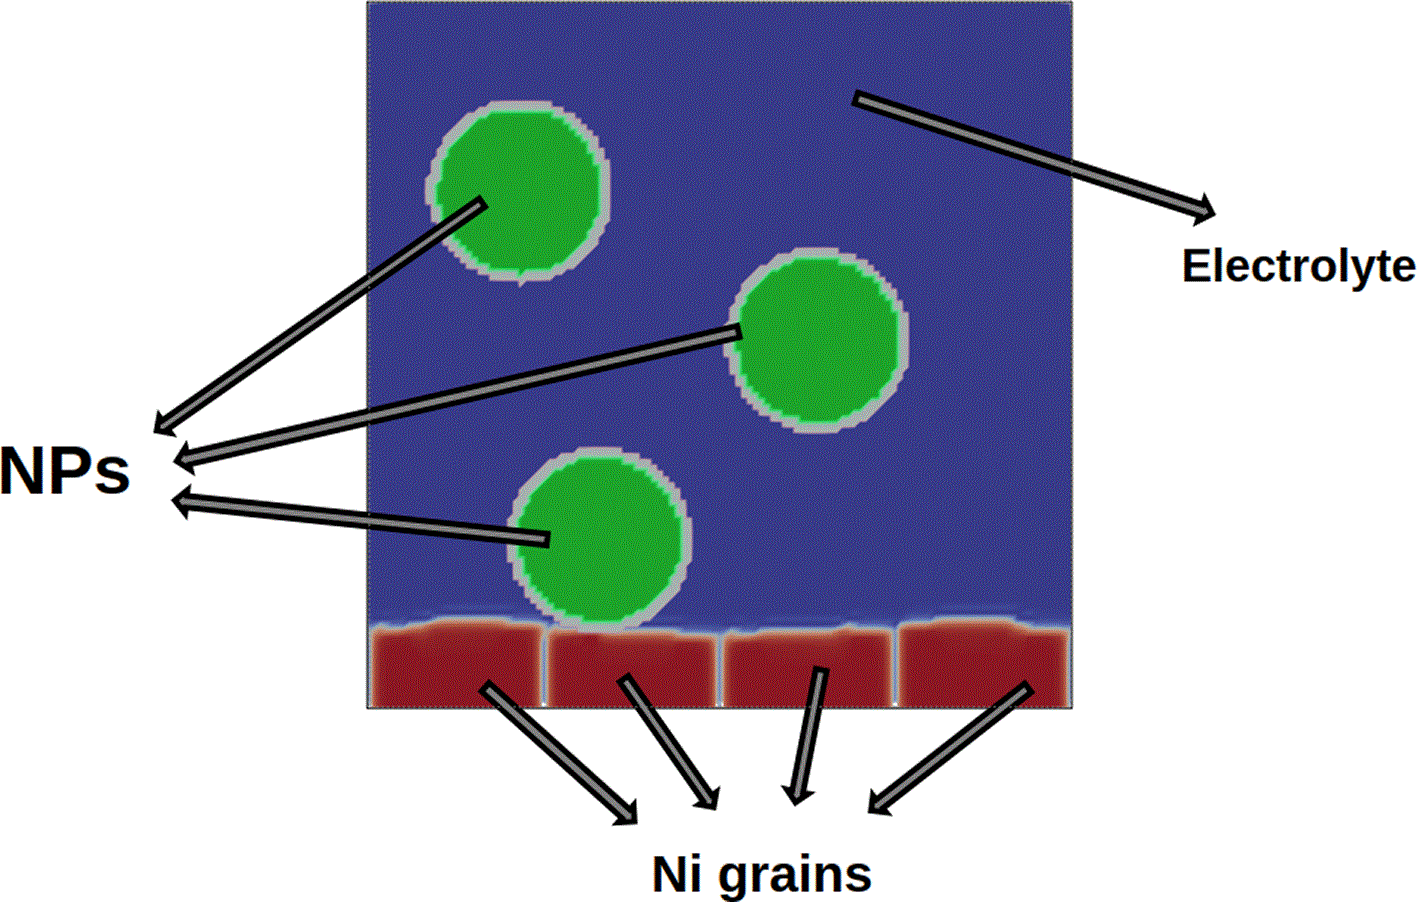
Figure 1.
μm
simulation box containing 4 Ni grains, in red, and three circular NPs, in green.
The blue region is occupied by the electrolyte. Periodic boundary conditions apply in the direction perpendicular to grain growth.
Table 1. Phase-field model parameters analyzed during this work to study their impact on surface texture.
| MODEL VARIABLES |
|---|
| Symbol | Meaning | Symbol | Meaning |
|---|
|
| Order parameter representing Ni grains |
| Ion concentration |
|
| Order parameter representing NPs |
| Electrostatic potential field |
| CONSTANTS
|
| Symbol
| Meaning
| Units
| Value
|
|
| Interface mobility |
s |
|
|
| Symmetry number | - |
|
|
| Cation valence | - |
|
|
| Faraday constant | sA/mol |
|
|
| Gas constant | J
|
|
|
| Bath Temperature | K |
|
|
| Electrical conductivity in the electrolyte phase | S/m | 1 |
|
| Electrical conductivity in Ni grains | S/m |
|
| MODEL PARAMETERS
|
| Symbol
| Meaning
| Symbol
| Meaning
|
|
| Mobility-related prefactor |
| Nucleation Strength by NPs |
|
| Gradient Coefficient |
| Effect of NPs on the Ion Diffusion |
|
| Overpotential |
| Effect of NPs on the Conductivity |
|
| Diffusion Coefficient of Ions |
| Site Density |
|
| Thermal Noise |
| Ion Concentration in electrolyte |
Figure 2 shows the range of values used in 2500 phase-field simulations, with 3 circular NPs and 5 Ni grains.40 These plots show the number of stable and non-stable simulations, where simulations are classified as stable if they reach the final simulation time while satisfying the convergence criteria of the nonlinear solver at each time step. Conversely, simulations are labeled as unstable when numerical convergence is not achieved and the solver fails to proceed. This classification reflects numerical stability of the solution procedure rather than a physical instability of the electrodeposition process. However, since sensitivity analyses demonstrate that the observed instability is independent of mesh refinement or time-step, we conclude that it is a characteristic of the selected parameter set. Dynamic visualizations of both scenarios are available as supplementary materials (Video S1 for the columnar-growth case and Video S2 for the grain suppression case). Here we can see that, in the first case, the system maintains steady-state columnar growth while the presence of two NPs induces a localized instability that leads to the suppression of one of the columnar grains given a specific choice of model parameters. According to Figure 2, we can see that large overpotential values can lead to unstable simulations, but, regarding the other variables, there is no direct correlation between them individually and the simulation stability. In order to understand the impact of the different variables listed in
Table 1 in the stability of the phase-field simulations, we used the SHAP technique with a trained random forest classifier as surrogate model. According to this xAI technique, as we can see in Figure 3, the variables with a larger impact on the simulation stability are the overpotential, as we could deduce from Figure 2 for large absolute values, the mobility prefactor, the site density and the effect of NPs on ion mobility. This analysis underscores that both process conditions (e.g., overpotential) and material properties (e.g., mobility) must be carefully selected for stable and smooth electrodeposition.
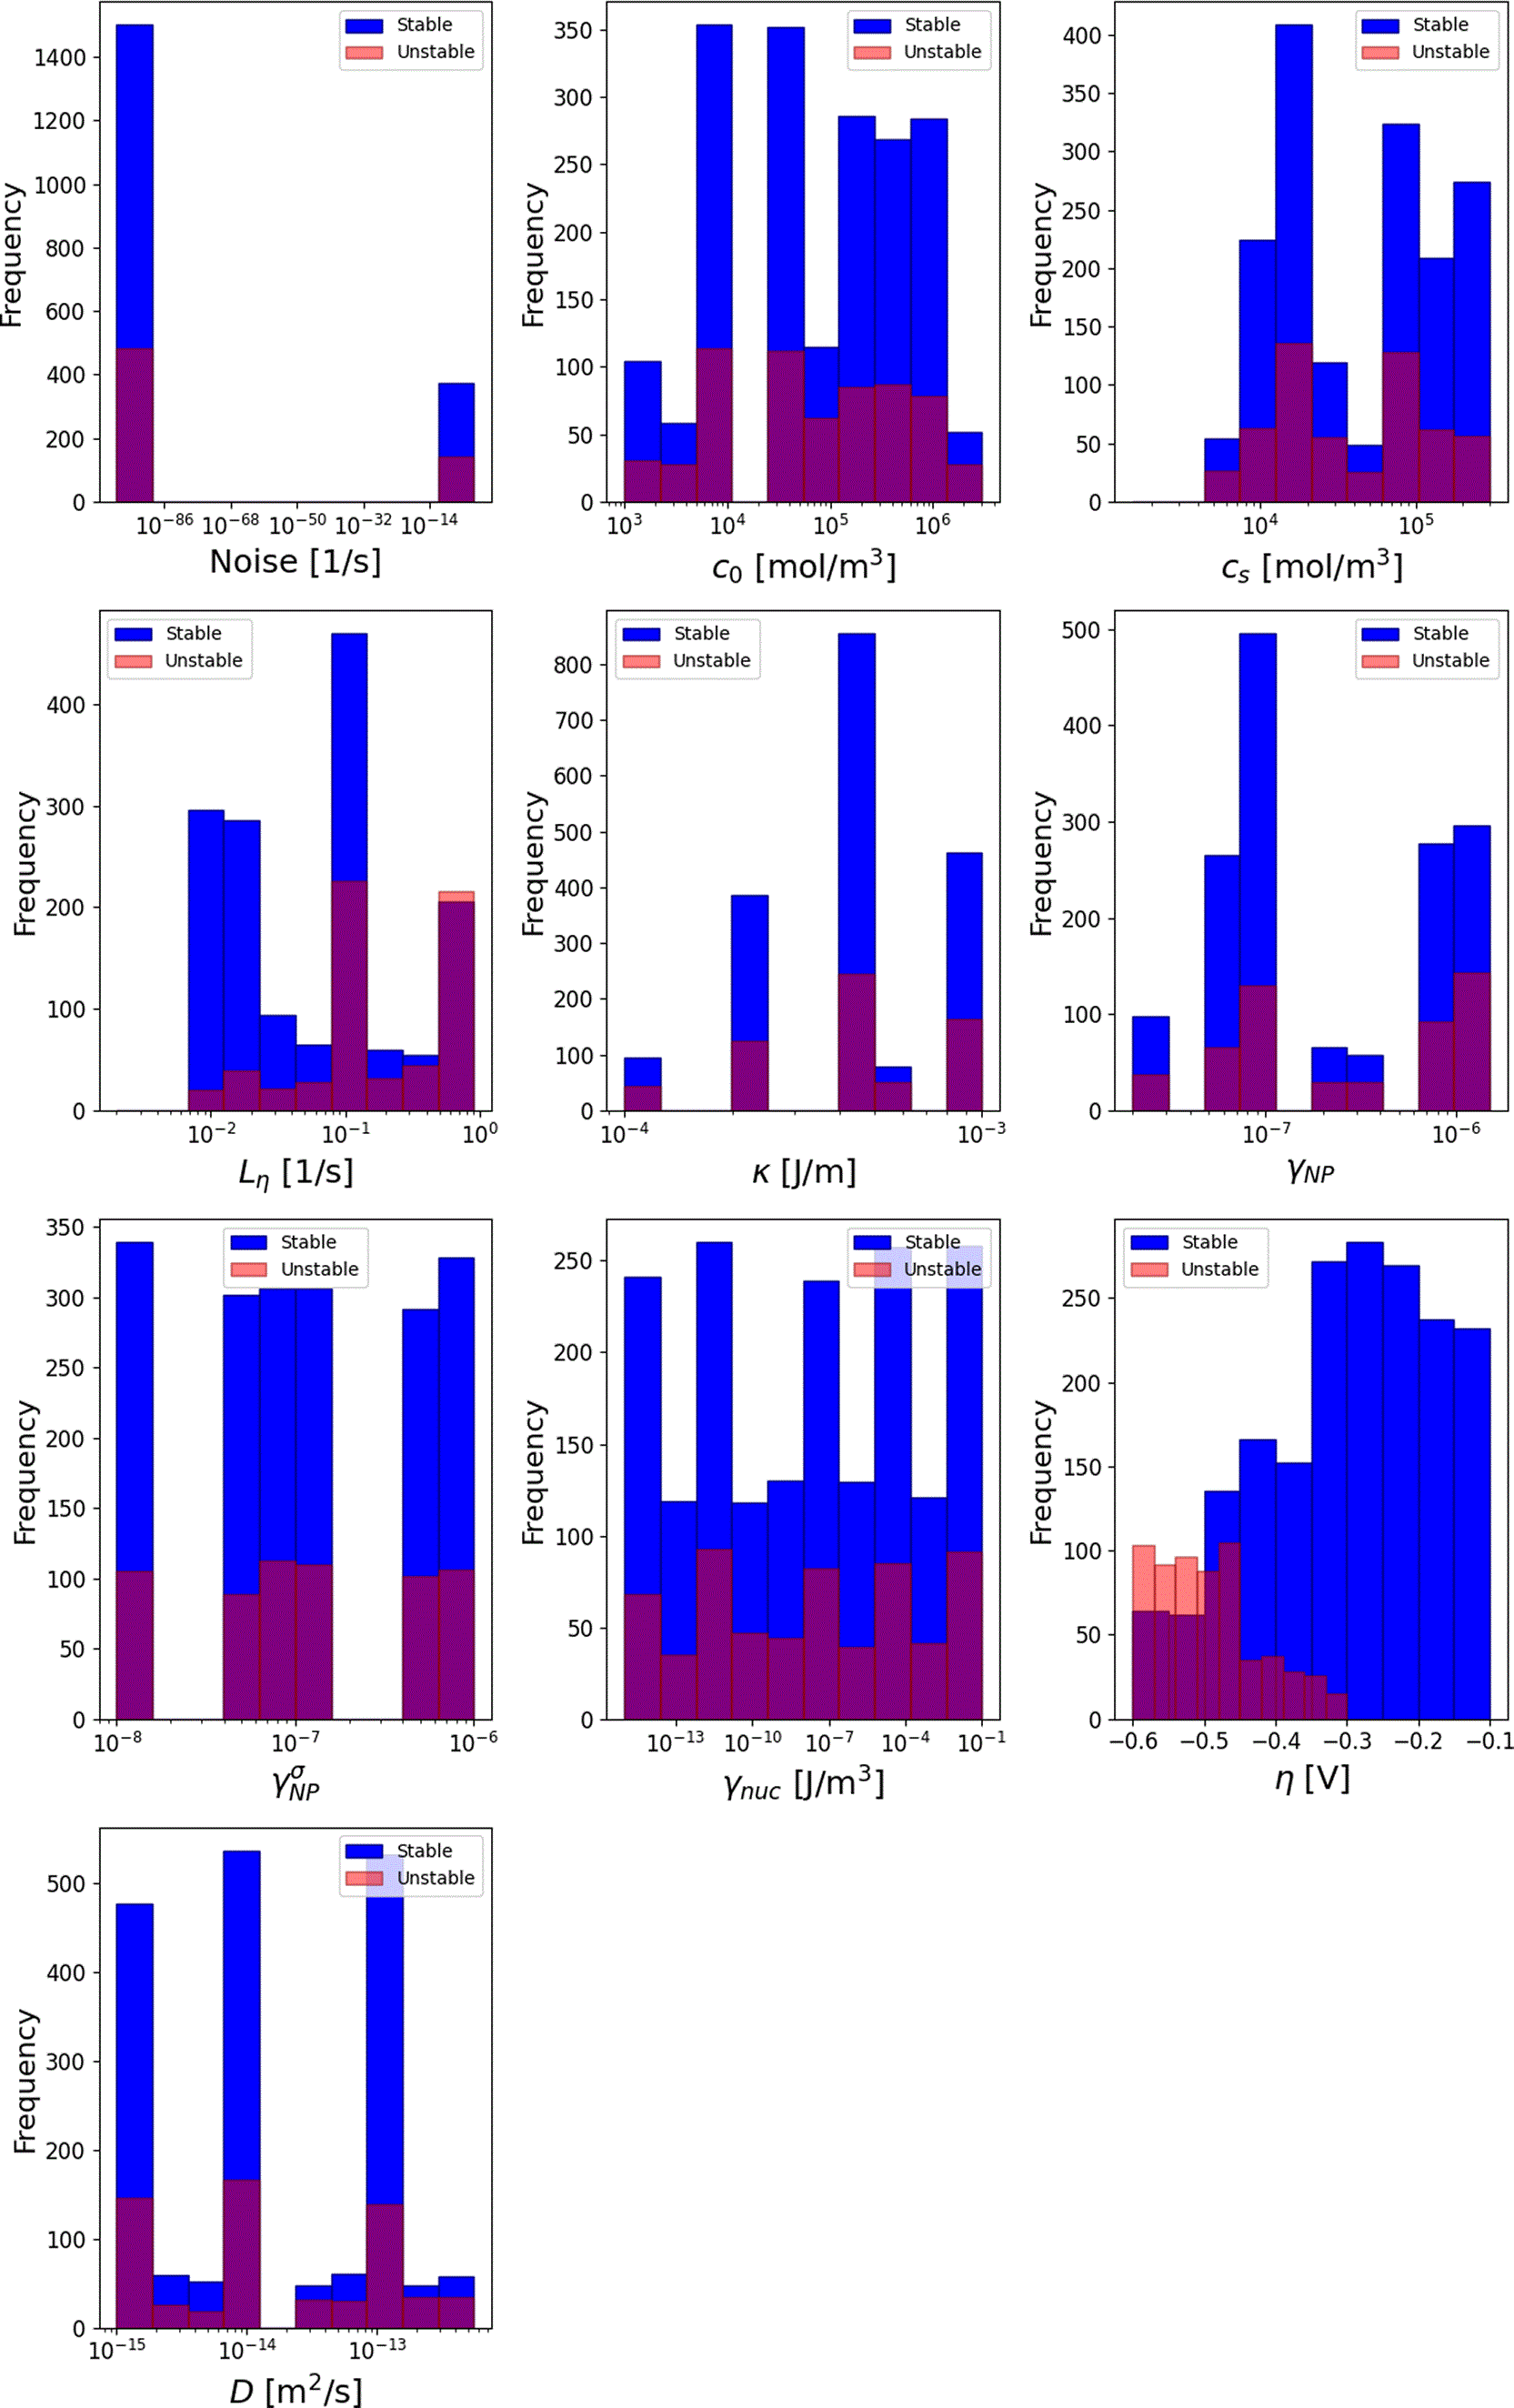
Figure 2. Histograms showing the ranges of values used for the variables listed in
Table 1 in phase-field simulations.
Simulations were classified into stable or unstable, whether they were completed correctly without crashing or not, respectively.
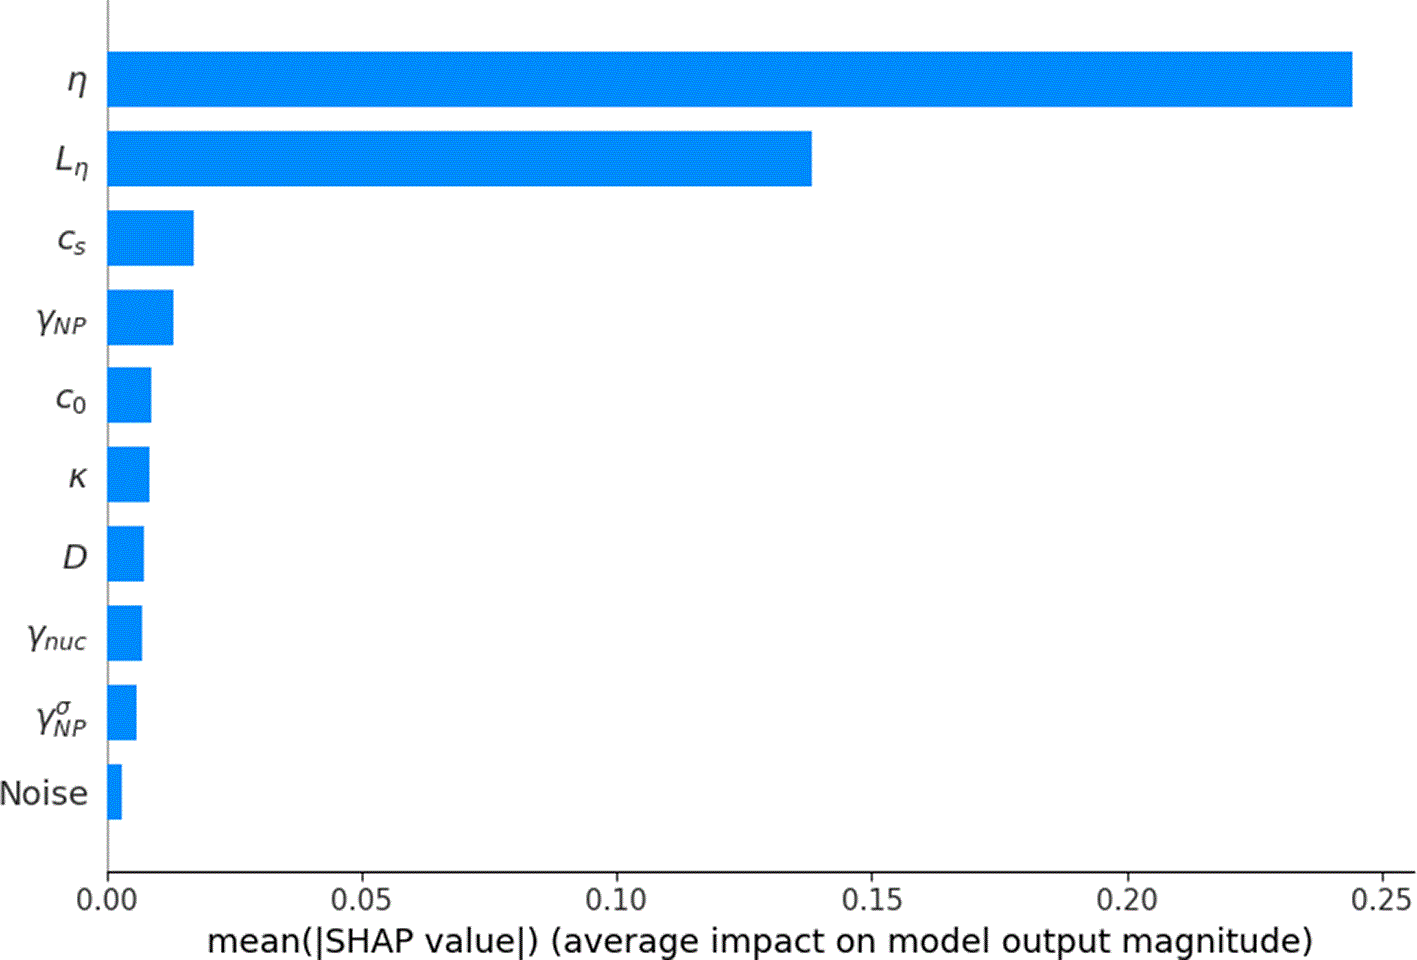
Figure 3. SHAP values indicating the impact of each input model parameter on the final output values, during the classification of simulations into stable or unstable.
The model parameters are ranked by their average impact on the output across all simulations. The bar length for each parameter represents the mean absolute SHAP value, a measure of how strongly that parameter influenced the prediction of stable vs unstable simulation, with longer bars indicating greater influence.
For the stable simulations, we also studied the solidification process and distinguished between simulations with columnar and non-columnar grain growth.40 To distinguish between columnar and non-columnar microstructures, we introduced a quantitative classification criterion based on grain morphology. Columnar growth was identified when at least one of the following conditions was satisfied: one or more grains exhibited negative lateral growth, indicating shrinkage or suppression by neighboring grains; there was a strong disparity in lateral growth between grains, reflected by a large normalized width spread (the difference between the most dominant grain and the most suppressed grain accounts for more than 50% of the total lateral growth); or there was a pronounced anisotropy along the growth direction, indicated by a large normalized height spread, when the difference between the fastest-growing and slowest-growing grains in the growth direction accounts for more than 70% of the total vertical growth. Otherwise, the microstructure is classified as non-columnar. Thus, we observed columnar growth in most simulations, but this behaviour was strongly influenced by the choice of the model parameters. As in the study of the stability of simulations, we used the SHAP technique with a trained random forest classifier as surrogate model to understand the impact of the different variables listed in
Table 1 in the type of grain growth during phase-field simulations. As we can see in Figure 4, the gradient coefficient, overpotential, mobility prefactor, site density and nucleation strength are the parameters with a larger impact on columnar growth in the presence of NPs during electrodeposition. While the overpotential is a process parameter that can be set manually, the others are material-dependent, meaning that the choice of the right chemistry is essential to prevent or promote columnar growth. The gradient coefficient parameter and lattice site concentration depend on the chemical specie of the matrix, but the mobility prefactor and nucleation strength can be modified by choosing the right NP type. Therefore, it is important to analyze how the size, concentration, shape and type of NP affects columnar growth.
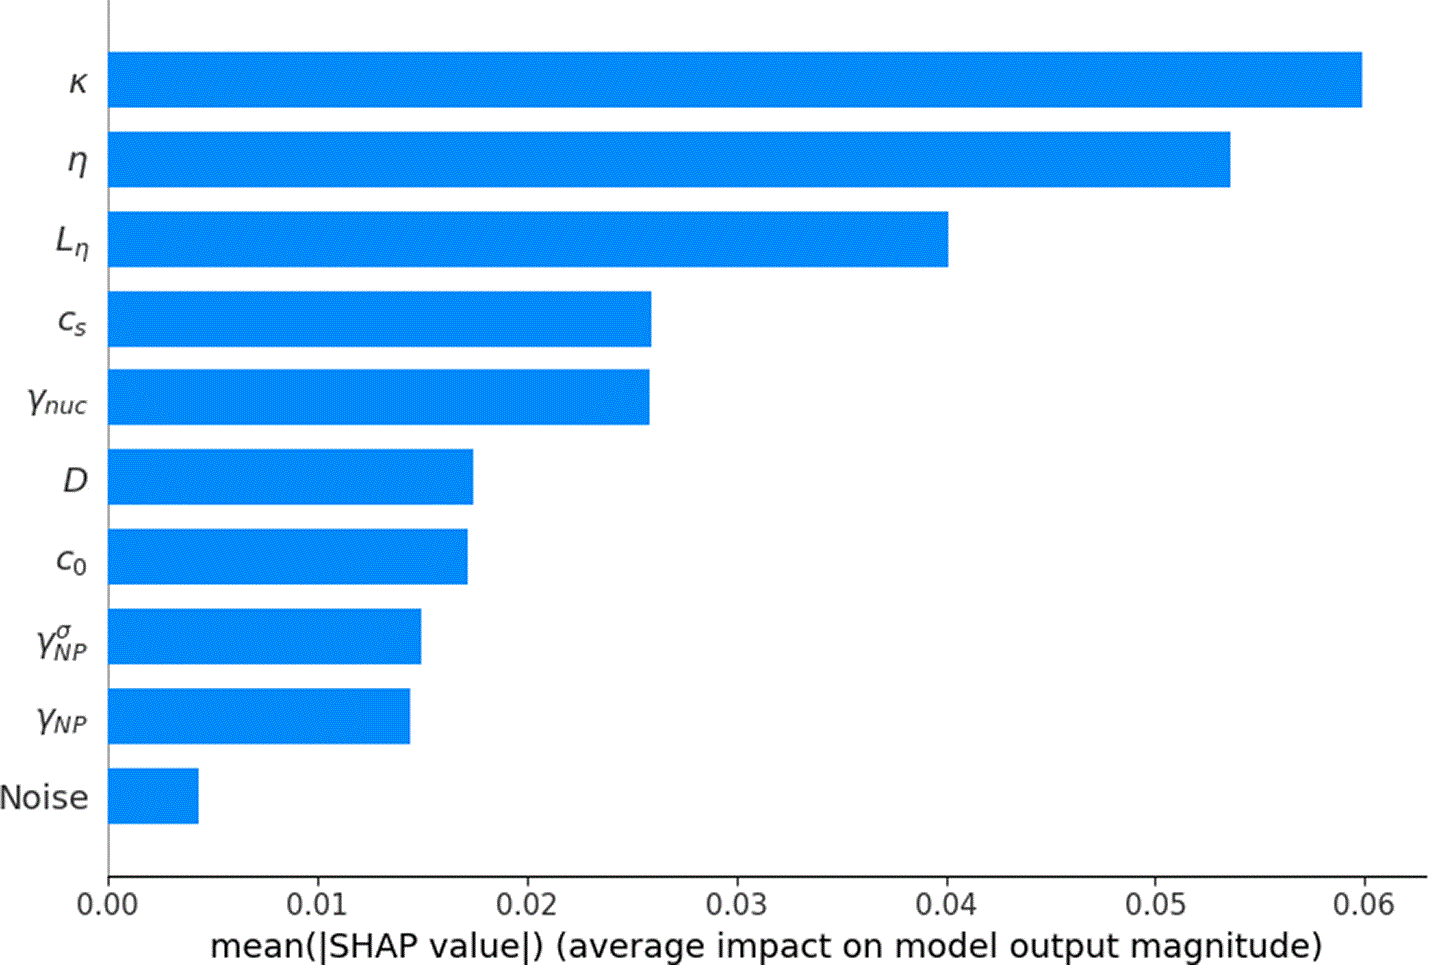
Figure 4. SHAP values showing the impact of each input parameter on the final output values, during the classification of grain growth into columnar or non-columnar.
The bar length indicates the average SHAP value of each parameter’s effect on grain growth. Since the values are sorted, the first features have larger impact on the detection of columnar or non columnar growth.
Figure 5 shows the frequency of simulations in which columnar grain growth was observed, for different NP volume fractions and sizes as a function of the most relevant input features: varying gradient coefficient, overpotential, mobility prefactor, site density and nucleation strength. In this figure, we can see that larger mobility prefactor values and higher NP concentrations inhibit columnar growth. In general, NPs can reduce impurities or defects at solid-liquid interfaces and often restrict grain growth while indirectly promoting controlled mobility for finer structures. Furthermore, hydrophilic NPs enhance wetting and reduce drag at the interface. As a consequence, metal oxides like MgO or
, which enhance interface wettability, and 2D materials like
or graphene, which reduce drag and promote smooth interface movement, appear as perfect candidates to control columnar growth during electrodeposition. Additionally, columnar growth is usually less frequent with larger overpotential absolute values and lattice site concentration, in part because the electrodeposition becomes more unstable at large absolute overpotential values. Our results have been validated through experimental data, which confirm that the presence of NPs disrupts the steady-state columnar growth characteristic of traditional Ni plating.34,35,36,37 This suppression of columnar structures in Ni-SiC nanocomposite coatings, a high-performance alternative to conventional chromium electrodeposition, yields significantly higher hardness and wear resistance, demonstrating how ceramic NP integration enhances overall coating characteristics.
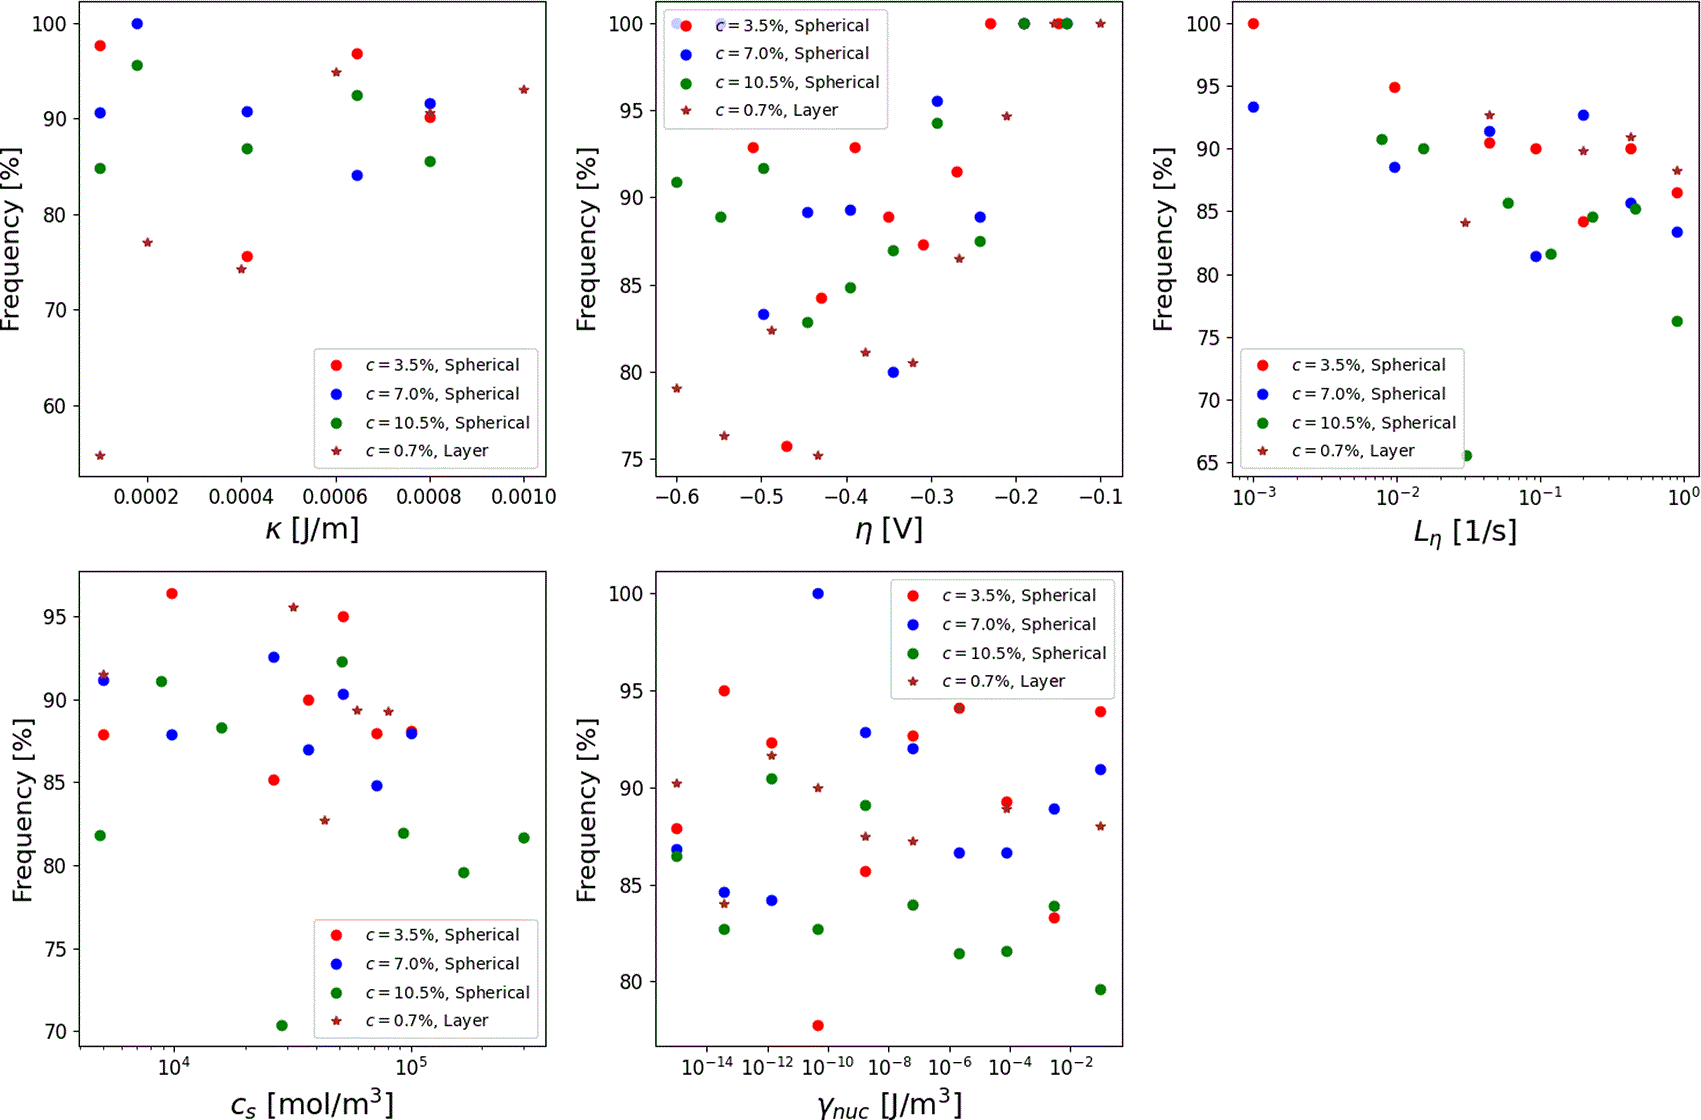
Figure 5. Frequency of simulations in which columnar grain growth was observed, for different NP concentrations and shapes, when varying gradient coefficient, overpotential, mobility prefactor, site density and nucleation strength.
The most striking trend is the systematic decrease in columnar growth frequency with increasing NP concentration. At low concentrations (e.g., 1–2 vol%), particles have a marginal effect and they do not inhibit columnar growth efficiently. However, at higher concentrations (e.g., more than 3 vol%), the probability of columnar growth drops. This is a direct demonstration of the Zener pinning effect, where a critical particle density is required to effectively start pinning grain boundaries and slow down their motion. This cobservations are in good agreement with experimental observations of solidification during additive manufacturing by Narayana Samy et al.,38 who found that larger particle size and higher volume fraction promoted fine-grained equiaxed structures. Additionally, for a given volume concentration, we observed that 2D NPs consistently outperform spherical ones in suppressing columnar growth. This can be attributed to their larger surface-to-volume ratio, the presence of sharp edges and greater physical footprint, which provides more effective coverage of the grain boundary, creating a stronger drag force.
Aditionally, as observed in Figure 5, several model parameters play an important role in the microstructure when they are studied independently. High
values, associated with high grain boundary energy, inherently resist the curved interfaces of equiaxed structures, favoring columnar growth. However, high NP concentrations can counteract this effect, pinning the boundaries. Similarly, high mobility prefactors (
) values, indicating fast interface kinetics, generally promote non-columnar growth by allowing grains to adjust their shape rapidly. With larger values, the electrochemical reaction occurs faster and very little “overpotential” (driving force) is required to proceed. Then, since the surface is highly active for the reaction, the deposition rate becomes more uniform across the entire surface and growth is not columnar or anisotropic. Additionally, for high overpotentials, the driving force is immense, often leading to non stability and non homogenous growth. Finally, larger nucleation strengths inhibit columnar growth, especially at larger NP concentrations. This parameter accounts for the impact of NPs on liquid/solid/NP interfaces, and is in good agreement with experiments, which highlight that NPs increase the ionic transport on the interface,39 thus promoting anisotropic growth.
4. Conclusion
In this work, a combined phase-field model and ML approach was used to investigate the role of NPs in controlling the microstructure during nickel electrodeposition. We observed that the stability of the electrodeposition process and the resulting grain morphology (columnar vs. equiaxed) are highly sensitive to key parameters, with the overpotential being the dominant factor for stability, and the gradient coefficient, mobility prefactor and NP characteristics (nucleation strength, concentration and shape) being critical in controlling microstructure. The results indicate that, within the explored parameter space and modelling assumptions, NPs can therefore influence microstructural evolution by modifying interface dynamics and grain growth behavior. The simulations demonstrate that NPs effectively inhibit columnar grain growth by promoting a finer, more equiaxed microstructure. Additionally, with similar concentrations in surface, 2D NPs can produce better results than circular ones, showing that this process is anisotropic and only the direction of the solidification front growth is relevant. Specifically, spherical metal oxides (e.g., MgO,
) enhance wettability and disrupt interface progression, while 2D materials (e.g.,
, graphene) reduce drag and promote smoother solidification fronts, leading to superior surface quality. By preventing the formation of long, straight columnar grain boundaries, which are preferred paths for crack propagation, the NP-induced microstructures predicted by our model are expected to exhibit improved mechanical properties, such as higher toughness and wear resistance. Specifically, we observed that 2D nanomaterials like
or graphene are more efficient to prevent columnar growth when their volume fraction is larger than 3%. Therefore, this study based on combined phase-field and ML framework via 2D simulations and SHAP analysis provides insights on the best NP types and concentrations for guiding the design of NP-reinforced electrodeposits. Future work will focus on extending this approach to 3D phase-field modelling to capture more complex topological effects, and on guided experimental validation of the predicted microstructures using the identified optimal parameters (e.g., larger than 3 vol% nanomaterials).
Ethics and consent
Ethical approval and consent were not required.







