Introduction
Expanding Internet of Things (IoT) connectivity to remote and underserved regions remains a major challenge to achieve global digital inclusion (Chaoub et al. 2022). Areas lacking basic network infrastructure, due to geographic, economic, or political constraints, require alternative connectivity solutions that can establish connectivity where none exists or enhance and complement existing systems. Typical applications include herd and wildlife tracking (López-Escobar et al. 2025), forest fire detection (Chan et al. 2024), agricultural and aquaculture monitoring, offshore ship tracking (Ullah et al. 2022), and cargo monitoring (Aslam et al. 2023).
As a potential solution, Low Earth Orbit (LEO) satellites offer global coverage and scalability (Fraire et al. 2022). Their reduced costs and recent technological advancements make them an attractive option for extending IoT connectivity. They provide wide coverage per satellite, and their non-stationary orbits enable communication with remote regions. However, a large constellation is required to ensure continuous service and, in most cases, devices must coordinate with the satellites to determine when transmission opportunities occur (Qi et al. 2024). Furthermore, the link budget can restrict device operation, especially in indoor environments or areas without line-of-sight, where higher antenna gains, transmission power, or specific configurations may be needed to maintain reliable communication. Furthermore, since LEO satellites simultaneously cover large portions of the Earth’s surface due to their high orbital altitude, they can lead to interference challenges in massive IoT scenarios (Le et al. 2025).
Another alternative for non-terrestrial networks (NTN) is the High Altitude Platform (HAPS) mounted network, which is a quasi-stationary aerial system operating in the stratosphere, typically between 8 and 50 km of altitude (Karabulut Kurt et al. 2021). Positioned above weather disturbances, yet much closer to the ground than satellites, HAPS can provide direct communication links to IoT devices with a more favorable link budget and lower round trip time latencies. These characteristics allow for intermittent or regional coverage, eliminate the need for gateway synchronization, and offer greater flexibility compared to terrestrial base stations (BS). Recent developments, such as SoftBank’s Sunglider (SoftBank Corp. 2025) and Aalto’s Zephyr (AALTO HAPS Ltd. 2025), have demonstrated the feasibility of multi-week autonomous solar-powered operation, with both companies planning to begin commercial services in 2026. However, the technology remains at an early stage of maturity, with limited large-scale deployments and cost structures that are still difficult to estimate. In addition, multiple platforms may be required to provide coverage in very sparse or geographically dispersed regions.
In this work, we conduct a comparative evaluation of HAPS and LEO satellite systems for IoT connectivity in remote regions. We also analyze their performance when integrated with existing terrestrial infrastructure. Furthermore, both solutions are compared to terrestrial networks in sparse and moderately deployed gateway scenarios. The main contributions of this work are as follows.
• A simulation framework for comparing HAPS, LEO satellites, and terrestrial networks in remote areas, each with its own spatial deployment and channel model.
• An analysis of the success probability for IoT devices communicating directly with HAPS and LEO satellites.
• An evaluation of hybrid scenarios in which a sparse terrestrial network is complemented by either a HAPS or a LEO satellite.
• A cost assessment comparing the deployment of HAPS and the utilization of commercial LEO constellation services.
The remainder of this paper is organized as follows. In Section 2, we present the state of the art literature on HAPS and LEO satellite as solutions for remote IoT connectivity. In Section 3, we present all the aspects and considerations of the system model used in this work, while in Section 4, we analyze and discuss the simulations and numerical results. Finally, we aggregate our thoughts and conclusions in Section 5. A previous version of this work was made available as a preprint [Sant’Ana et al. 2026]. The present article includes revisions made during the Open Research Europe publication process.
HAPS and LEO satellites for IoT
HAPS are quasi-stationary aerial communication platforms operating in the stratosphere, typically between 8 and 50 km altitude. They provide wide-area wireless coverage by hosting cellular BSs as transmitters or relays, the former being particularly relevant for direct-to-device communication. HAPS platforms can be either aerostatic (e.g., balloons) or aerodynamic (e.g., solar-powered fixed-wing aircraft). Real-world initiatives include SoftBank (previously HAPSMobile) (SoftBank Corp. 2025), Aalto (previously Airbus) (AALTO HAPS Ltd. 2025), and World Mobile (previously Stratospheric Platforms Limited) (World Mobile Team 2025), which have demonstrated long-endurance flights and high-bandwidth communications. For instance, SoftBank’s Sunglider achieved multi-week flights with LTE connectivity, World Mobile demonstrated direct-to-device 5G using a hydrogen-powered platform, and Aalto’s Zephyr reached a 67-day flight record. These platforms are designed for long-duration missions (weeks to months) and integration within multi-layer NTN architectures. Deployment scenarios include disaster recovery (e.g., Germany floods, Japan earthquake), rural broadband (e.g., Hokkaido), and offshore coverage (HAPS Alliance 2025). The literature on HAPS has grown significantly, particularly in the context of 6G and NTN integration. In (Abbasi et al. 2024), HAPS are presented as key enablers of vertical heterogeneous networks, supporting both access and backhaul while interacting with terrestrial and satellite layers. Similarly, (Lou et al. 2023) analyzes routing latency, coverage probability, and energy efficiency in HAPS-assisted architectures, showing notable performance gains when HAPS act as relays or coordination nodes. The HAPS Alliance white paper reports throughput of 5–50 Gbps, latency below 10 ms, and support for over 100 beams (HAPS Alliance 2025). Earlier surveys such as (Karabulut Kurt et al. 2021) discuss HAPS evolution and challenges including spectrum management, backhaul, and energy constraints, while (Svistunov et al. 2025) highlights their role as flying BSs for remote IoT. In IoT scenarios, most works consider HAPS as relays rather than standalone BSs (Jia et al. 2023; Andreadis et al. 2023). Exceptions include (Uyanık and Ovatman 2022), which proposes a wake-up mechanism for LoRaWAN based on HAPS coverage, and (Giambene and Korre 2022; Almarhabi et al. 2021), which evaluate LoRa performance with HAPS-mounted gateways considering altitude, power, and collisions. Despite these efforts, gaps remain: few studies address direct IoT communication via HAPS, and none provide comparative analyses against LEO and terrestrial solutions or integrate cost evaluation with coverage analysis.
Low Earth Orbit (LEO) satellites are a central component of modern NTNs for IoT, operating at altitudes between 500 and 1,500 km (Ericsson 2023). Their proximity enables round-trip latencies of 25–50 ms (Fraire et al. 2022), making them suitable for diverse IoT applications, particularly in remote areas where terrestrial deployment is costly. Compared to HAPS, LEO systems are more mature, with extensive literature and commercial deployments. For example, Lacuna Space is expanding IoT connectivity through a 16-satellite constellation in partnership with Spire Global (Lacuna Space 2023). However, challenges remain for massive IoT data collection. Satellite mobility introduces Doppler effects that degrade performance; (Ullah et al. 2025) proposes a beacon-based compensation method, though optimal design remains open. Synchronization is another key issue, with solutions including visibility prediction algorithms (Ortigueira et al. 2024) and trajectory-aware transmission strategies (Tondo et al. 2025). Predictive synchronization mechanisms are also employed in practice, where satellites broadcast control signals to assist low-power devices (Lacuna Space 2025; LoRa Alliance 2025). Additionally, LEO systems rely on large-scale constellations of hundreds to thousands of satellites (Qu et al. 2017; Capez et al. 2022).
From an economic perspective, LEO satellite viability has been widely studied. In (Osoro and Oughton 2021), the estimated cost per satellite is approximately US$0.6 M (Starlink), US$5.6 M (OneWeb), and US$3 M (Kuiper). Comparative analyses such as (Toka et al. 2024) show that although HAPS have higher upfront costs, their longer lifetime (20 years vs 5 years for LEO) reduces annualized costs. Nevertheless, LEO systems remain more cost-effective overall due to technological maturity.
System model
In this section, we introduce the system model and the performance metrics to compare the suitability of HAPS and LEO satellites for remote IoT connectivity.
Figure 1 illustrates an example of several application scenarios, with IoT devices transmitting to terrestrial gateways, HAPS, or LEO satellites. Further, they would relay the information to a ground station backbone or directly to a network server. Note that, for the sake of common notation, we show angles, such as elevation angle and orbit inclination, in degrees. All equations are set in radians, unless otherwise stated.
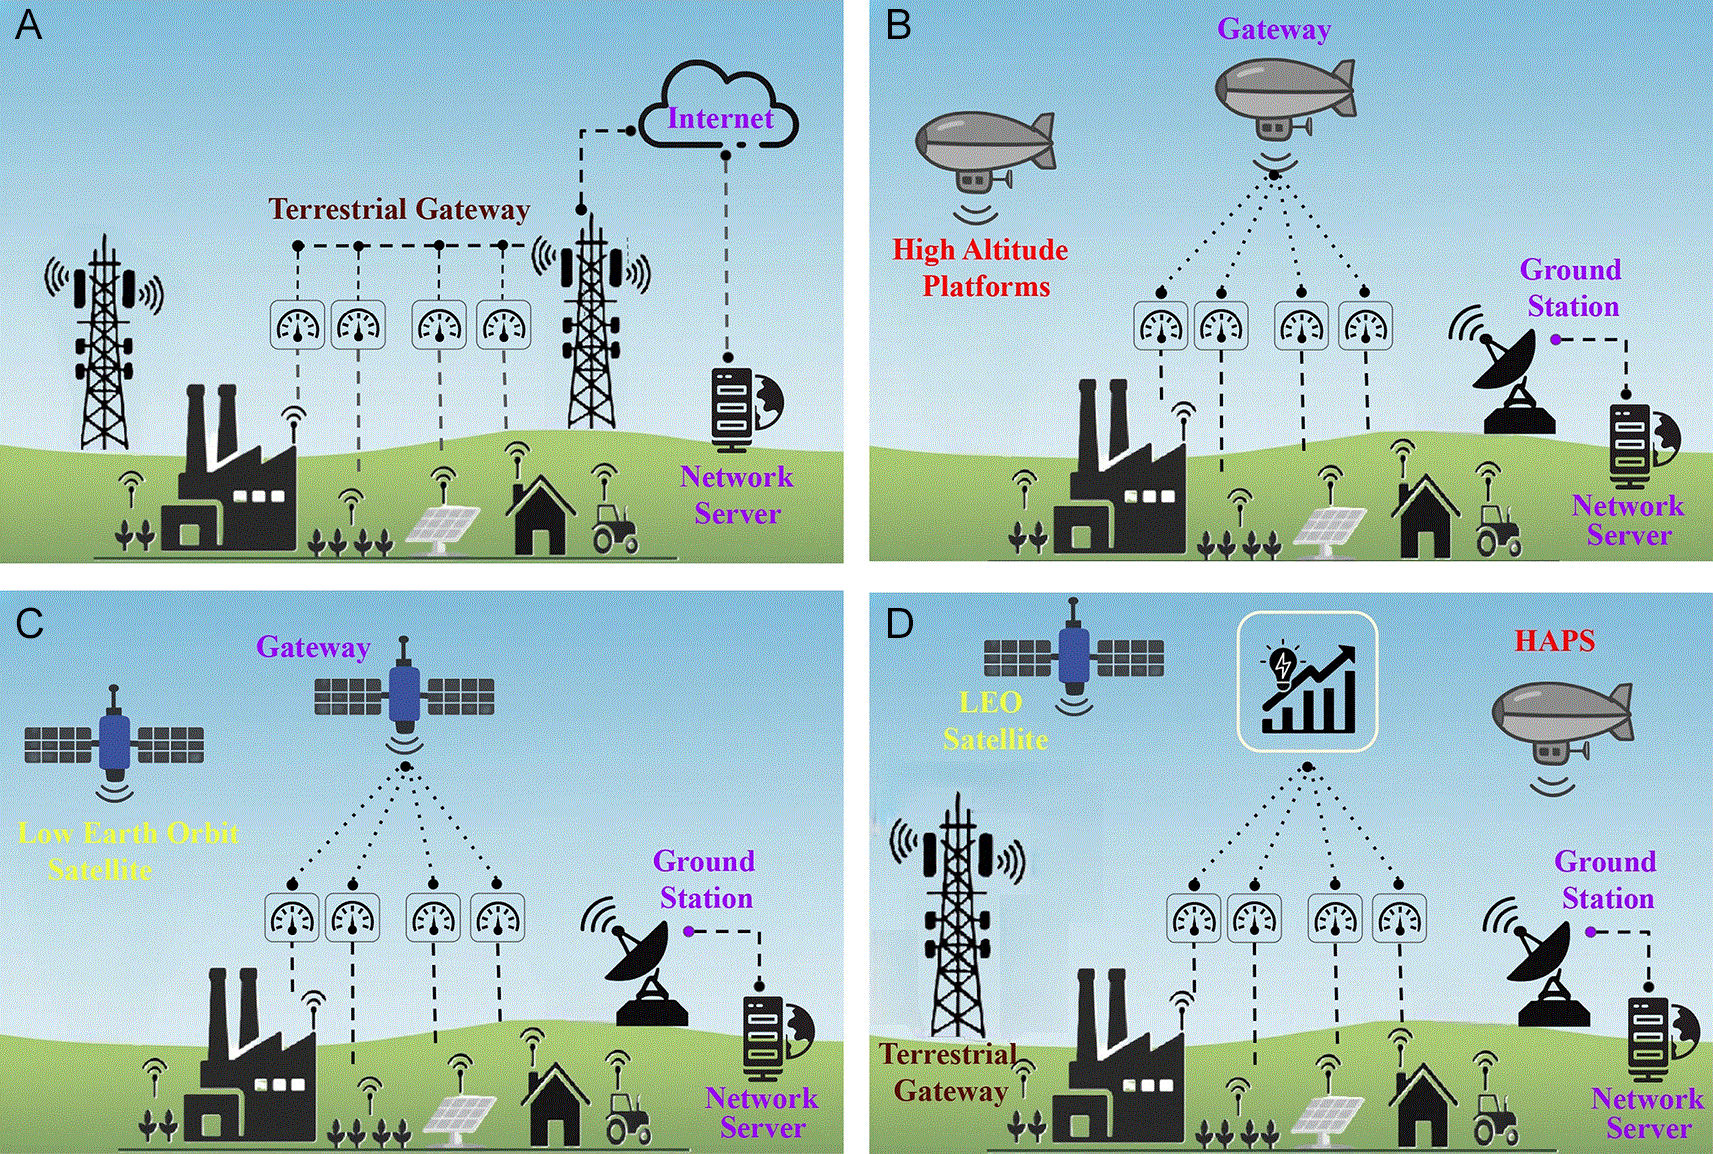
Figure 1. The illustration of the proposed architectures comprises TNs and NTNs networks, as well as the Ground Station and the Network Server components.
(a) Terrestrial Network (TN). (b) HAPS-based NTN. (c) Satellite-based NTN. (d) All architectures
Spatial deployment model
First, we start by modeling the distribution of devices and BSs. We assume that the
devices are distributed at random in a circular area of radius
.
The HAPS is considered stationary on top of the center of the circular region, at altitude
. The distance from a given device
at position
to the HAPS is
(1)
assuming that the devices are at ground level
. Moreover, the elevation angle between the device and HAPS is given in radians by
(2)
where
m is the mean equatorial radius of Earth.
For the satellite, we assume a large enough constellation so that there is always one and only one satellite in coverage, with a minimum elevation angle
. We also assume a fixed altitude
, orbit inclination of
degrees and circular orbit. The period in which one satellite is in coverage is called a lap. The duration of each lap
is modeled as a random variable, with its PDF given as (Seyedi and Safavi 2012)
(3)
where
, with
is the angular velocity of the satellite,
m
/s
is Earth’s gravitational parameter,
is the satellite altitude from central Earth. Moreover,
is Earth’s rotation angular velocity, and
s is the sidereal day time. We also have
(4)
as Earth’s central angle corresponding to the minimum elevation angle
, where
is the satellite altitude. Finally, we have that
as the maximum coverage time per satellite lap. With the duration of a lap, we can calculate the elevation angle relative to the origin point of the circular region as a function of time during the given lap
as
(5)
Note that all variables that depend on
are time-dependent, but we decided to omit them from now on for the sake of clarity. To calculate the performance metrics of a given device, we first calculate the satellite position vector as
(6)
where
is the azimuth angle at the central point, which is different for each satellite lap. Thus, by the Cartesian-to-spherical relation, the elevation angle between the satellite and a given device
at position
,
(7)
The distance between the satellite and the given device is
(8)
Figure 2 depicts the basic geometry of the system model. Although shown as a plane, we take into account the effect of a spherical earth when calculating distances and angles.
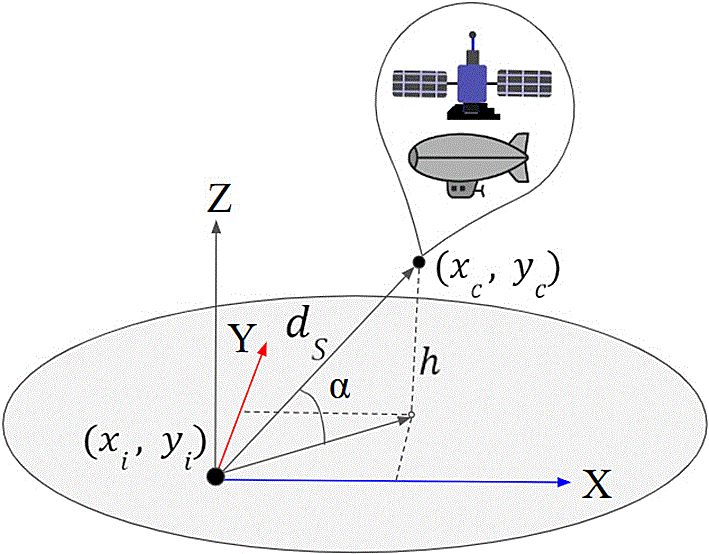
Figure 2. The illustration of the NTN network geometry, which is composed by the device coordinates
, elevation angle
, altitude
and the distance
.
For the terrestrial network, we assume that
ground BSs are deployed in the circular area at random, such that each BS is separated by a minimum of
km. The separation is to avoid a concentration of BSs in one unique region, which affects the simulation convergence. In addition, we choose
small enough so that
represents a reasonable distance for a communication to occur, so that we do not create artificial regions or coverage gaps where communication would fail. Finally, we also consider an annular guard region, with inner radius of
and outer radius of
, where we deploy
BSs, so that devices on the border of the circular region do not suffer from the border effect. The number of BSs in the guard region
can be defined as
(9)
so that we maintain the same density of BSs in both regions. For simulation tractability, we round it to the nearest integer. Given a device
and a terrestrial BS
, at positions
and
, the distance between them is given by
(10)
Channel model
We define two different channel models, one for the HAPS and LEO satellite, and another for the terrestrial network. For both cases, we assume that all devices use the same transmit power
and carrier frequency
. Thus, the received power of a single transmission at the gateway from device
is given as
(11)
where
is the distance-dependent path loss and
models the fading and other effects, both of which depend on whether the communication is through a terrestrial network or HAPS and LEO satellite.
For the terrestrial network, we model the path loss with an empirical log-normal model from (Petajajarvi et al. 2015) as
(12)
where
is the distance from the device to the BS,
is the 1 km reference distance,
is the pathloss at
, and
is the path loss exponent. Moreover, we model a shadow fading
as a Gaussian with standard deviation
in dB.
For communication between devices and the HAPS and LEO satellite, we consider the free space path loss given as
(13)
where
and
are the antenna gains of the transmitter and receiver, respectively, and
is the signal wavelength with
m/s as the speed of light. Note that the receiver antenna gain depends on whether we consider HAPS (
) or LEO satellite (
).
We model channel fading for HAPS and LEO satellite communication
as (Abdi et al. 2003), a shadowed Rice model with LOS amplitude characterized by the Nakagami distribution. This model is relevant to our scenario, as it accounts for the elevation angle’s impact on fading and shadowing. Moreover, this model can be approximated by a gamma distribution (Talgat et al. 2024), which results in easier mathematical tractability. The PDF of
is (Talgat et al. 2024)
(14)
where
is the Gamma function,
and
are the shape and scale parameters, and
,
and
are empirical expression parameters derived as a function of the elevation angle
(in degrees), given as
(15)
Performance metrics
In this work, we assume LoRaWAN LR-FHSS technology to evaluate the performance of the scenarios. LR-FHSS is a frequency-hopping uplink scheme in LoRaWAN that uses GMSK modulation over 488 Hz physical channels. In our case, we consider the European ISM carrier frequency of 868 MHz, and each transmission hops over 35 such channels following a pseudorandom sequence derived from the header seed. Each packet contains three header copies, each lasting 233.472 ms, sent on different physical channels. The payload is convolutionally coded at a coding rate of
and split into fragments of 102.4 ms. The number of fragments is
(16)
which for
bytes and
yields
. Devices use unslotted ALOHA, randomly selecting a seed and hopping to a new physical channel for every header and fragment. A receiver that decodes at least one header can reconstruct the hop sequence. The packet is successfully decoded if the header and at least one third of the fragments (rounded up) are received.
We use two metrics to evaluate performance. The first is the erasure condition, which is the probability that the received signal power is below a given technology threshold
. This is the most interesting performance metric for this work, as it directly shows the impact of the topology of the scenarios, regardless of the number of devices. This probability can be written as
(17)
For the LR-FHSS scenario, we consider that each header or fragment perceives a different realization of
. However, they will be correlated because of the elevation angle (in the case of NTN) and the distance between the device and the gateway. Although LR-FHSS has coding and replication schemes, we believe it is most important to analyze the erasure probability of single headers and fragments, as this value could easily be translated to any other technology, with the proper
.
The second metric is the packet success probability. For each packet, we assume it to have been successfully decoded if at least one header and
of the payload fragments have been decoded. Headers and fragments are susceptible to erasure as in the first metric, and collisions, in case other headers or fragments transmissions occur at the same in the same physical channel. We analyze the LR-FHSS transmission success probability using an LR-FHSS network simulator (Sant’Ana et al. 2024). Here, we assume that all collisions are destructive, i.e., no capture effect. See that this is a common practice for LR-FHSS analysis, since the technology does not specify a capture effect ratio. The same packet can be decoded by multiple BSs, while we assume a centralized network server responsible for dealing with duplicates.
Costs analysis
Here we present the cost models for all scenarios. Inspired by (Toka et al. 2024), we consider the total cost by bringing it to the present value, with a discount factor
, to take into account the opportunity costs. Thus, we have
(18)
where CAPEX represents the deployment costs, OPEX the yearly operational costs and years the time-window horizon in years.
According to (Toka et al. 2024), the CAPEX costs for HAPS are $4 M, with an OPEX of $30,000. In addition, they utilize a discount factor
and a window of 20 years, both of which we will adopt in this work. For the LEO satellite, we consider a commercial connectivity provider as the reference for satellite-based NTN services. In this context, companies such as Wyld Networks (Wyld Networks, n.d.), Myriota (Myriota, n.d.), and LacunaSpace (Lacuna Space 2023) offer satellite connectivity on a pay-per-message or subscription basis, partnering with LEO satellite operators to deliver data from remote devices to the cloud. According LacunaSpace page, they offer services of around $24 per device per year, where this value could be smaller for services of more than 5000 devices. Thus, we have a null CAPEX, with an OPEX of $
. Finally, for terrestrial BSs, we account the average yearly tower leasing according to (Steel In The Air, n.d.), which is $12,600. Thus, we have again a null CAPEX and an OPEX of $12,600
.
Numerical results and discussions
In this section, we analyze the numerical results from the model proposed in the previous sections. If not explicitly mentioned, we utilize the simulation parameters in
Table 1. We picked scenarios with a single HAPS, a system with always one LEO satellite in coverage, a terrestrial network with 10 and 30 BSs, and a combination of them. With that in mind, we intend to analyze the performance of each system and also evaluate the benefits of using them together. Finally, we understand that with 10 BSs we have a sparsely deployed network, with low coverage and several gaps, while 20 BSs represent a scenario with relatively good coverage.
Table 1. Simulation parameters.
| Parameter | Symbol |
Value |
|---|
| Network radius |
| 80 km |
| HAPS altitude |
| 30 km |
| Satellite altitude |
| 750 km |
| Orbit inclination |
| 60 ° |
| Reference distance |
| 1 km |
| Log-normal path loss exponent |
| 2.32 |
| Path loss at the reference distance |
| 128.96 dB |
| Shadow fading standard deviation |
| 7.8 dB |
| Minimum terrestrial BS separation |
| 20 km |
| Guard region radius |
| 240 km |
| Transmission power |
| 14 dBm |
| Carrier frequency |
| 868 MHz |
| HAPS antenna gain |
| 6 dBi |
| Satellite antenna gain |
| 13.5 dBi |
| Terrestrial BS antenna gain |
| 6 dBi |
| Payload size |
| 10 bytes |
| Receiver sensitivity |
| −132 dBm |
| Average transmission interval | - | 15 minutes |
| Minimum elevation angle |
| 20 degrees |
Erasure probability
Each figure scenario in this subsection represents data from headers and fragments transmissions for 5000 simulation runs, each one with 1000 devices over a period of 24 hours. Each data point is the average erasure experienced by a device in given position during each simulation.
Figure 3 depicts a heat map of the erasure probability in the circular area where the devices are deployed. Thus, we can identify the probability that a transmission will fail to reach a BS. First, we can see in
Figure 3a that the LEO satellite model shows a uniform distributed coverage, which means that the geographical positioning of the device in the area does not affect performance. A similar idea applies to the terrestrial network case in
Figure 3h, however, it presents a higher variance due to the dependency on the distribution of BSs over the area. The HAPS scenario in
Figure 3d presents devices in the network border with worse performance compared to the ones in the center, as expected. We can see that 10 terrestrial BSs in
Figure 3h present coverage issues, going under 30% in several points. Moreover, depending on the BS deployment, some areas can be without any coverage. Moreover, while HAPS presents an unfair distribution compared to LEO, we can see that HAPS presents a lower erasure probability in a large portion of the area. In addition, the combination of HAPS with the terrestrial network (
Figure 3e and
Figure 3f) works in favor of reducing the worse unbalanced performance on the network border. Moreover, it presents a lower erasure probability than LEO satellite for both cases in
Figure 3b and
Figure 3c. Finally, a combination of LEO and HAPS in
Figure 3g shows to outperform the terrestrial case with 20 BSs in
Figure 3i, which presents an interesting idea in which the integration of multiple different non-terrestrial systems might be even more competitive than dense terrestrial network systems in terms of coverage/erasure probabilities.
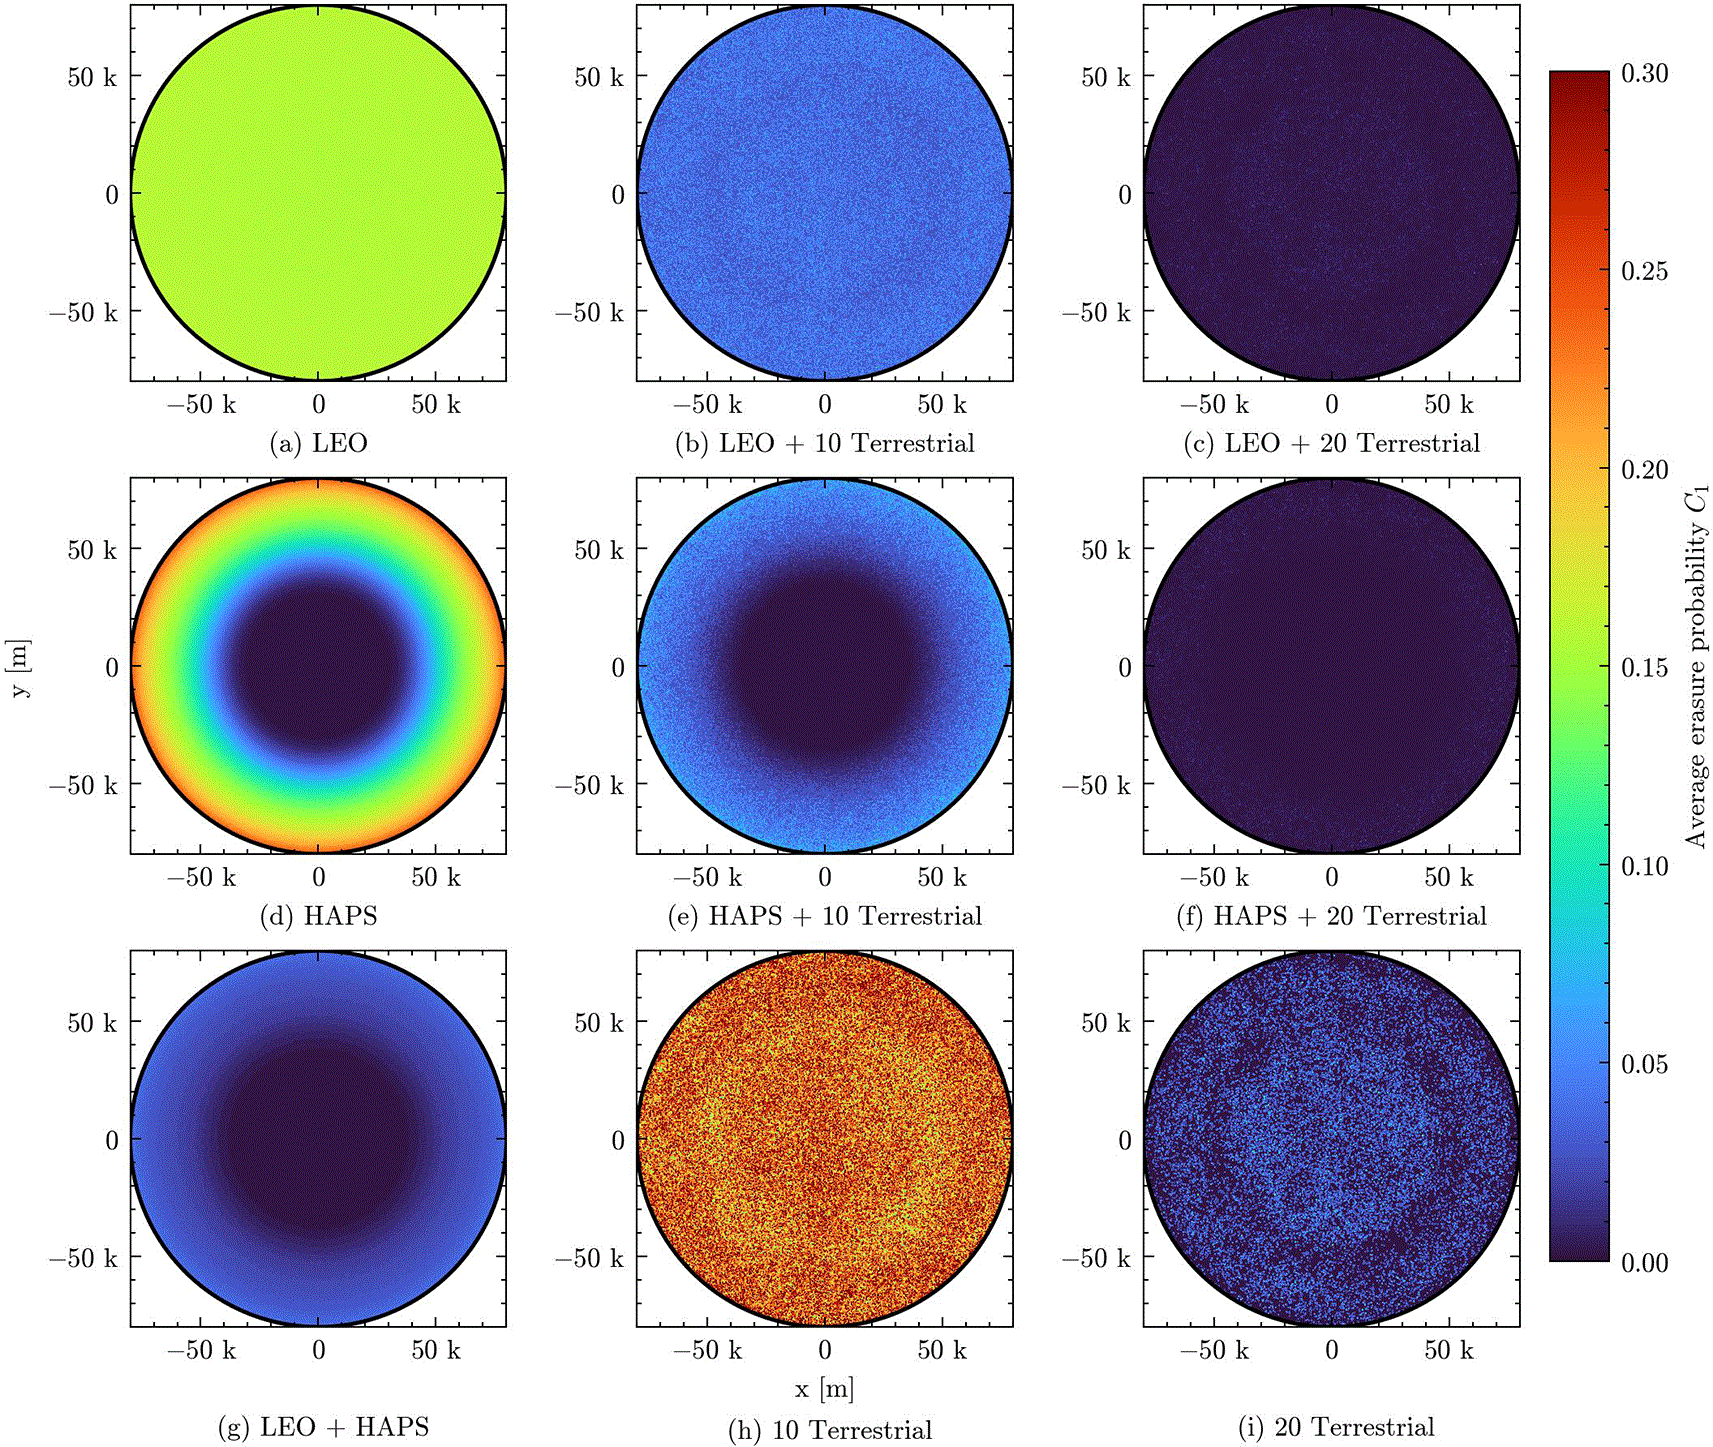
Figure 3. Heat map of the erasure probability over the area where devices are deployed for all proposed scenarios.
Figure 4 shows a violin graph with the distribution of the erasure probability in the aforementioned scenarios. In this figure, the height of each curve represents the distribution of the erasure probability, while the width shows the density of the erasure probability value. Each violin has to be interpreted separately, as the width is accounted for individually. Finally, a black line on them represents the average erasure probability for each case. As seen before, the LEO probability varies less over the area compared to the other cases. In this figure, the effect is represented as a smaller vertical spread. In the HAPS case, we see a higher variation due to the geographical distribution seen before. However, although the terrestrial erasure probability did not change over the area, a high variance is observed even in the scenario with 20 terrestrial BSs. This shows us that the performance of this system is highly dependent on the distribution of the BSs. Even guaranteeing a certain distance between the BSs, the scenario presents cases where devices did not have coverage. On the other hand, the same behavior was not seen in the non-terrestrial scenarios. Also, the terrestrial and non-terrestrial integration scenarios did not present this very high variance, showing that they can help mitigating the deployment dependence of terrestrial networks. Finally, the combination of LEO and HAPS presents a slightly higher erasure probability average than the 20 terrestrial BSs, in exchange of the benefit of guaranteeing coverage fairness over the whole area without the need to take into account BS deployment planning.
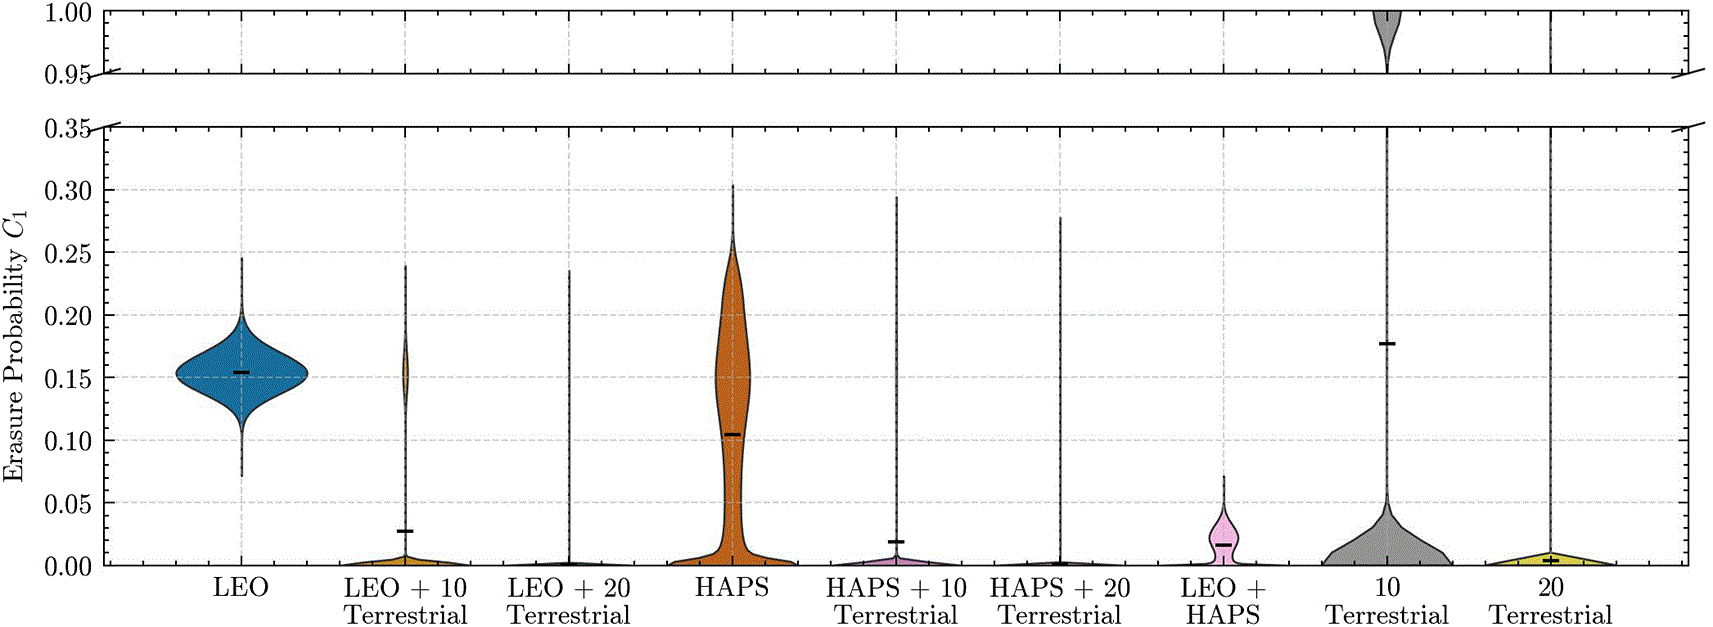
Figure 4. Erasure probability violin graph for all proposed scenarios.
Wider graphs represent a higher density of that probability, and the white line shows the median.
Success probability
In this subsection, each data point is acquired by averaging the success probability of all devices in each run, and then averaging over 5000 runs with 1 hour duration each.
Figure 5 shows the transmission success probability for the proposed scenario. This analysis is particularly interesting when we plan to understand the network scalability in scenarios with a large number of devices active in the system. The first behavior to note in both cases is that in the case of terrestrial networks, both for 10 and 20, the success rate changes little with the number of nodes. Since path loss tends to act stronger on terrestrial communication, it is common that each terrestrial BS has less interference from devices transmitting from far away. The number of devices seen by each BS is smaller, thus there are fewer collisions happening compared to the non-terrestrial scenarios. In
Figure 5a, we illustrate that the performance of the terrestrial network is very low, due to the high erasure probability seen in the previous section. We see HAPS slightly outperforming LEO, and the combination of LEO and HAPS outperforming the integration of HAPS and LEO with terrestrial BSs until around 10 k devices. This tells us that even sparsely deployed terrestrial BSs can help in the scalability of the network by integrating with non-terrestrial options. In
Figure 5b, the terrestrial network exhibits a very high success probability, proving that it is in fact a scenario under strong coverage conditions. The integration of LEO and HAPS with the terrestrial network still improves the success probability, even if the number of IoT devices increases within the network. This is highlighted by the purple and orange lines at the top of
Figure 5b.
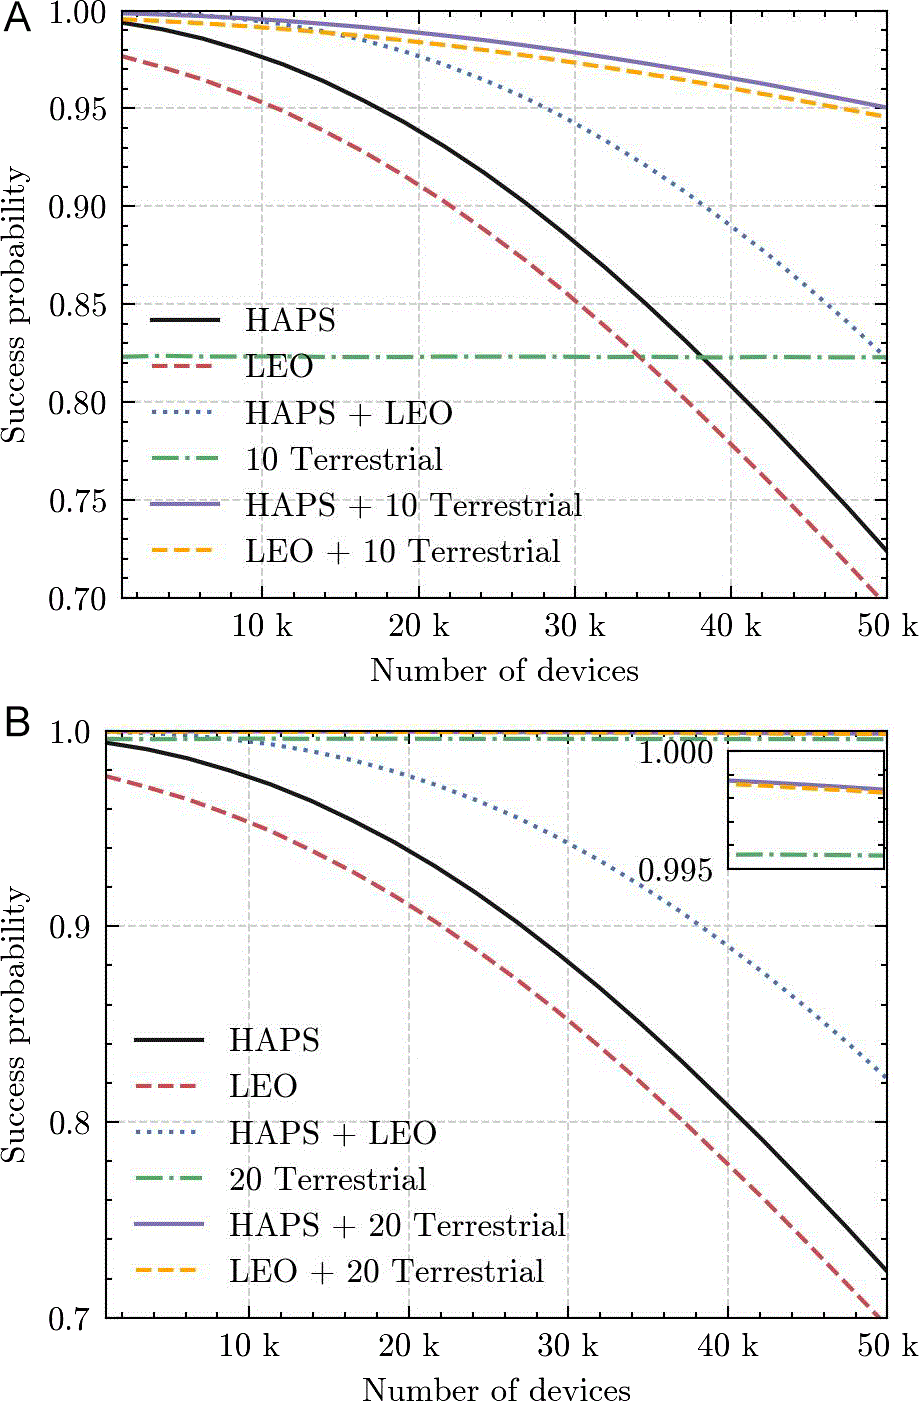
Figure 5. Success probability as a function of the number of devices for all proposed scenarios.
(a)
Connectivity Costs Analysis
In this section, we evaluate the costs considering HAPS, LEO satellite and terrestrial networks. To simplify and provide a more realistic point of view, we consider a commercial connectivity provider as the reference for satellite-based NTN services. Also, due to the lack of commercial services of HAPS, we could not find any data for it as a service. In addition, we did not consider the deployment of a LEO constellation, as it is intended to cover multiple regions due to its non geostationary behavior, and thus the cost would be higher. The cost values adopted in our analysis are derived from publicly available information and indicative pricing from such providers, enabling a practical comparison with the potential costs of deploying a HAPS-based connectivity solutions. The costs of terrestrial networks are related to the leasing costs of communication towers, while we disregard the hardware costs.
The values used in the analysis are shown in
Table 2. We assume a 20 year span time analysis for fairness, since our data assume the HAPS system would last for at least 20 years.
Figure 6 presents the cost considering HAPS, LEO and terrestrial solutions as a function of the number of devices, assuming one message per hour over one month. We can see that even though the HAPS costs are higher, they are already competitive with the costs of 20 terrestrial BSs. The LEO solution is shown to be interesting when the number of devices is not too large (
), although lower prices can even be negotiable with these providers in case of this massive number of devices. This shows that LEO solutions are interesting in the case that the number of devices is not too large, at a price of slightly smaller performance than HAPS, while being more flexible than a terrestrial network. In addition, terrestrial networks tend to perform better when well deployed, subject to deployment availability, as its costs may increase significantly if there is a need to install non-existing infrastructures. The authors also acknowledge that the simplicity of the cost analysis, especially in terms of scalability, as most likely the LEO service would give a quality of service guaranty, either by improving the infrastructure or increasing the operational bandwidth. On the other hand, the constant values in the owned infrastructure options actually decrease the performance per-device as the number of devices increases, as seen in
Figure 5.
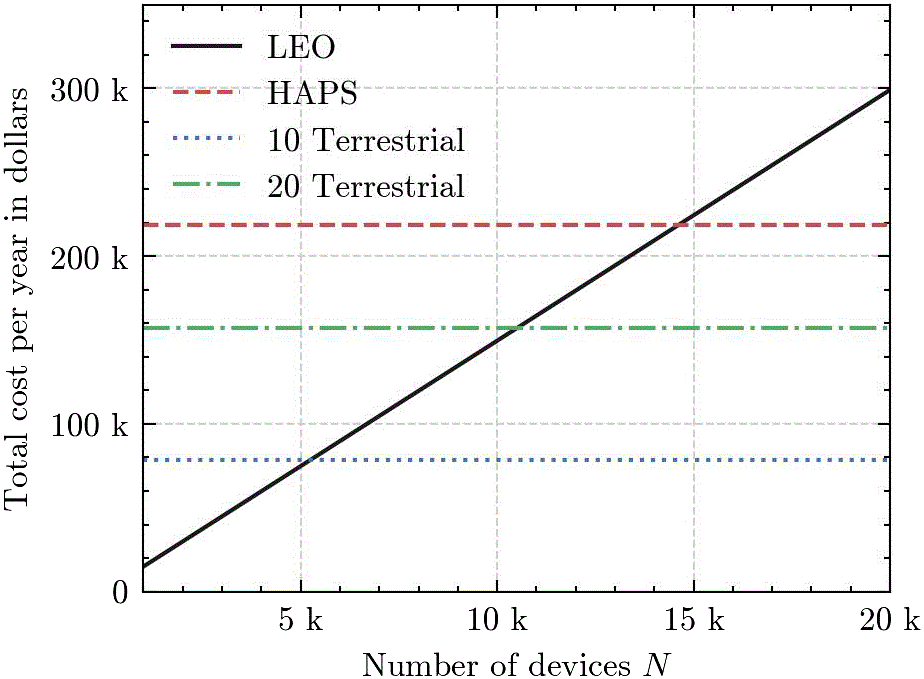
Figure 6. Total cost per year as a function of the number of devices for LEO, HAPS and terrestrial networks.
Conclusions
In this work, we compared the impact of HAPS and LEO satellites as an alternative to IoT connectivity in remote regions with a lack of terrestrial connectivity. We also consider cases where HAPS and LEO could work together with existing terrestrial networks and also a combination of both HAPS and LEO. We analyze the transmission erasure probability behavior and conclude that HAPS can be a good addition to existing sparse terrestrial networks, and also to the LEO satellite system. Moreover, we also conducted an economic analysis of the deployment of an HAPS versus using LEO satellite IoT services, as well as the deployment of terrestrial networks. The results highlight that HAPS outperforms LEO in terms of success probability and average erasure probability, and that the combination of sparse terrestrial networks with non-terrestrial solutions as a potential enabler for massive connectivity. Finally, we show that although the costs of HAPS are higher, they were shown to be in a similar magnitude order, and with the advancements of this technology, they can be an promising alternative to IoT connectivity. Future work includes the investigation of smarter diversity techniques to exploit simultaneous reception from multiple receivers, the incorporation of multi-satellite visibility and HAPS mobility into the system model, and the design of transmission strategies that leverage knowledge of HAPS and LEO movement patterns.
Ethics and consent
Ethical approval and consent were not required.







