Disclaimer. This Data Note forms part of a coordinated, multi-site series following a shared protocol.1,2 While each dataset was collected by its own team and may vary in scale and implementation details, the overarching study design and reporting structure are harmonized. Accordingly, text that describes protocol-level elements in introduction and methods (for example, the study rationale, key measures, and core procedures) is intentionally reused across the series to preserve clarity and facilitate cross-site comparison.
Introduction
Environmental light is a fundamental regulator of human physiology and health, extending far beyond its role in visual perception.3 Light provides the principal environmental cue for aligning the internal circadian timing system with the external day–night cycle, thereby coordinating daily physiological and behavioural rhythms.4 In contemporary societies, however, increased reliance on artificial illumination together with predominantly indoor lifestyles has substantially altered natural patterns of light exposure. These changes may weaken circadian entrainment and have been associated with adverse effects on sleep, metabolism, mood, and overall health.5–8 The physiological responses underlying these non-image-forming effects are primarily driven by intrinsically photosensitive retinal ganglion cells (ipRGCs), a specialized class of retinal photoreceptors that exhibit peak sensitivity to short-wavelength (blue-enriched) light.9,10
Understanding how people are exposed to light in their everyday environments is essential for evaluating the health implications of contemporary lighting patterns. While controlled laboratory studies have established many of the physiological effects of light, the highly standardized lighting conditions used in these experiments often differ substantially from those experienced in daily life.11,12 Wearable light loggers enable continuous assessment of personal light exposure under real-world conditions, providing valuable insights into exposure behaviours and their potential implications for sleep, alertness, circadian regulation, and long-term health.
Advances in wearable sensing technologies have made it possible to objectively quantify personal light exposure under free-living conditions.13–16 Modern light loggers and dosimeters continuously record the spectral characteristics of ambient light, allowing the calculation of both visual metrics, such as photopic illuminance, and biologically relevant non-visual metrics, including alpha-opic irradiance and melanopic equivalent daylight illuminance (melanopic EDI).17,18 These measurements can subsequently be summarised into standardized exposure metrics that characterize the intensity, timing, duration, and regularity of individual light exposure patterns.19–21 When combined with self-reported measures of light-related behaviours and daily activities, objective recordings provide a more complete representation of how people experience and interact with their lighting environments.22 However, despite increasing adoption of wearable light monitoring technologies, datasets from geographically and culturally diverse populations remain limited, restricting our understanding of population-level variability in light exposure and its implications for health.
To date, most research on personal light exposure has focused on populations in Europe and North America.23,24 Comparative studies across different regions highlight substantial variability driven by cultural practices, environmental conditions, and climate; for example, recent work comparing Malaysia and Switzerland demonstrates marked differences in light exposure patterns.25 However, datasets from underrepresented regions remain scarce, and publicly available data are even more limited, constraining the assessment of generalisability and the identification of population-specific determinants of light exposure and its health impacts. In this context, data collected in Türkiye provide a valuable opportunity to examine how environmental conditions, sociocultural behaviours, and daily routines shape individual light exposure patterns.26 This is particularly relevant for populations residing along the Western Anatolian Aegean coast, where unique geographic and lifestyle factors may influence physiological responses to light.
Recent studies in Türkiye indicate significant increases in light pollution, supported by both satellite-based observations and ground-based measurement technologies.27 High-resolution satellite analyses report an approximately 80% increase in upward radiance from Türkiye between 2012 and 2019, reflecting rapid urbanisation and the expansion of artificial lighting.28 Furthermore, national-level assessments rank Türkiye among the countries with the highest average surface brightness.29 These findings suggest that artificial light sources are increasing in an unregulated manner, raising concerns about potential environmental and public health consequences.29 Against this backdrop, the assessment of individual light exposure is critical for accurately evaluating behavioural patterns and health-related outcomes, thereby contributing to a more comprehensive understanding of light’s role in human physiology.
This data note presents a publicly available dataset describing personal light exposure in a cohort from İzmir, Türkiye. The dataset was collected to characterize real-world patterns of daily light exposure and associated behavioural, sleep, and environmental factors within the Turkish population. By following the harmonized multi-site protocol developed for the MeLiDos project,1 these data can be directly compared with datasets collected in other participating countries, including Germany, the Netherlands, Sweden, Spain, Ghana, and Costa Rica. The public release of this dataset in accordance with the FAIR (Findable, Accessible, Interoperable, and Reusable) data principles30 expands the global evidence base on personal light exposure and provides a resource for future studies investigating geographic, cultural, and behavioural determinants of light exposure, as well as the development of personalized light-based strategies to support health and well-being.
Methods
This dataset was collected in an observational field study in which participants were recruited in Izmir, Türkiye (coordinates 38.3 N, 26.6 E) (
Figure 1), to evaluate their personal light exposure patterns using wearable light loggers and questionnaires following a standardized, multi-site protocol.1 This study was conducted within the framework of the Metrology for wearable light loggers and optical radiation dosimeters (MeLiDos) project that aims to quantify individual light exposure using wearable light loggers and solar UV dosimeters.31 17 participants were recruited for the study.
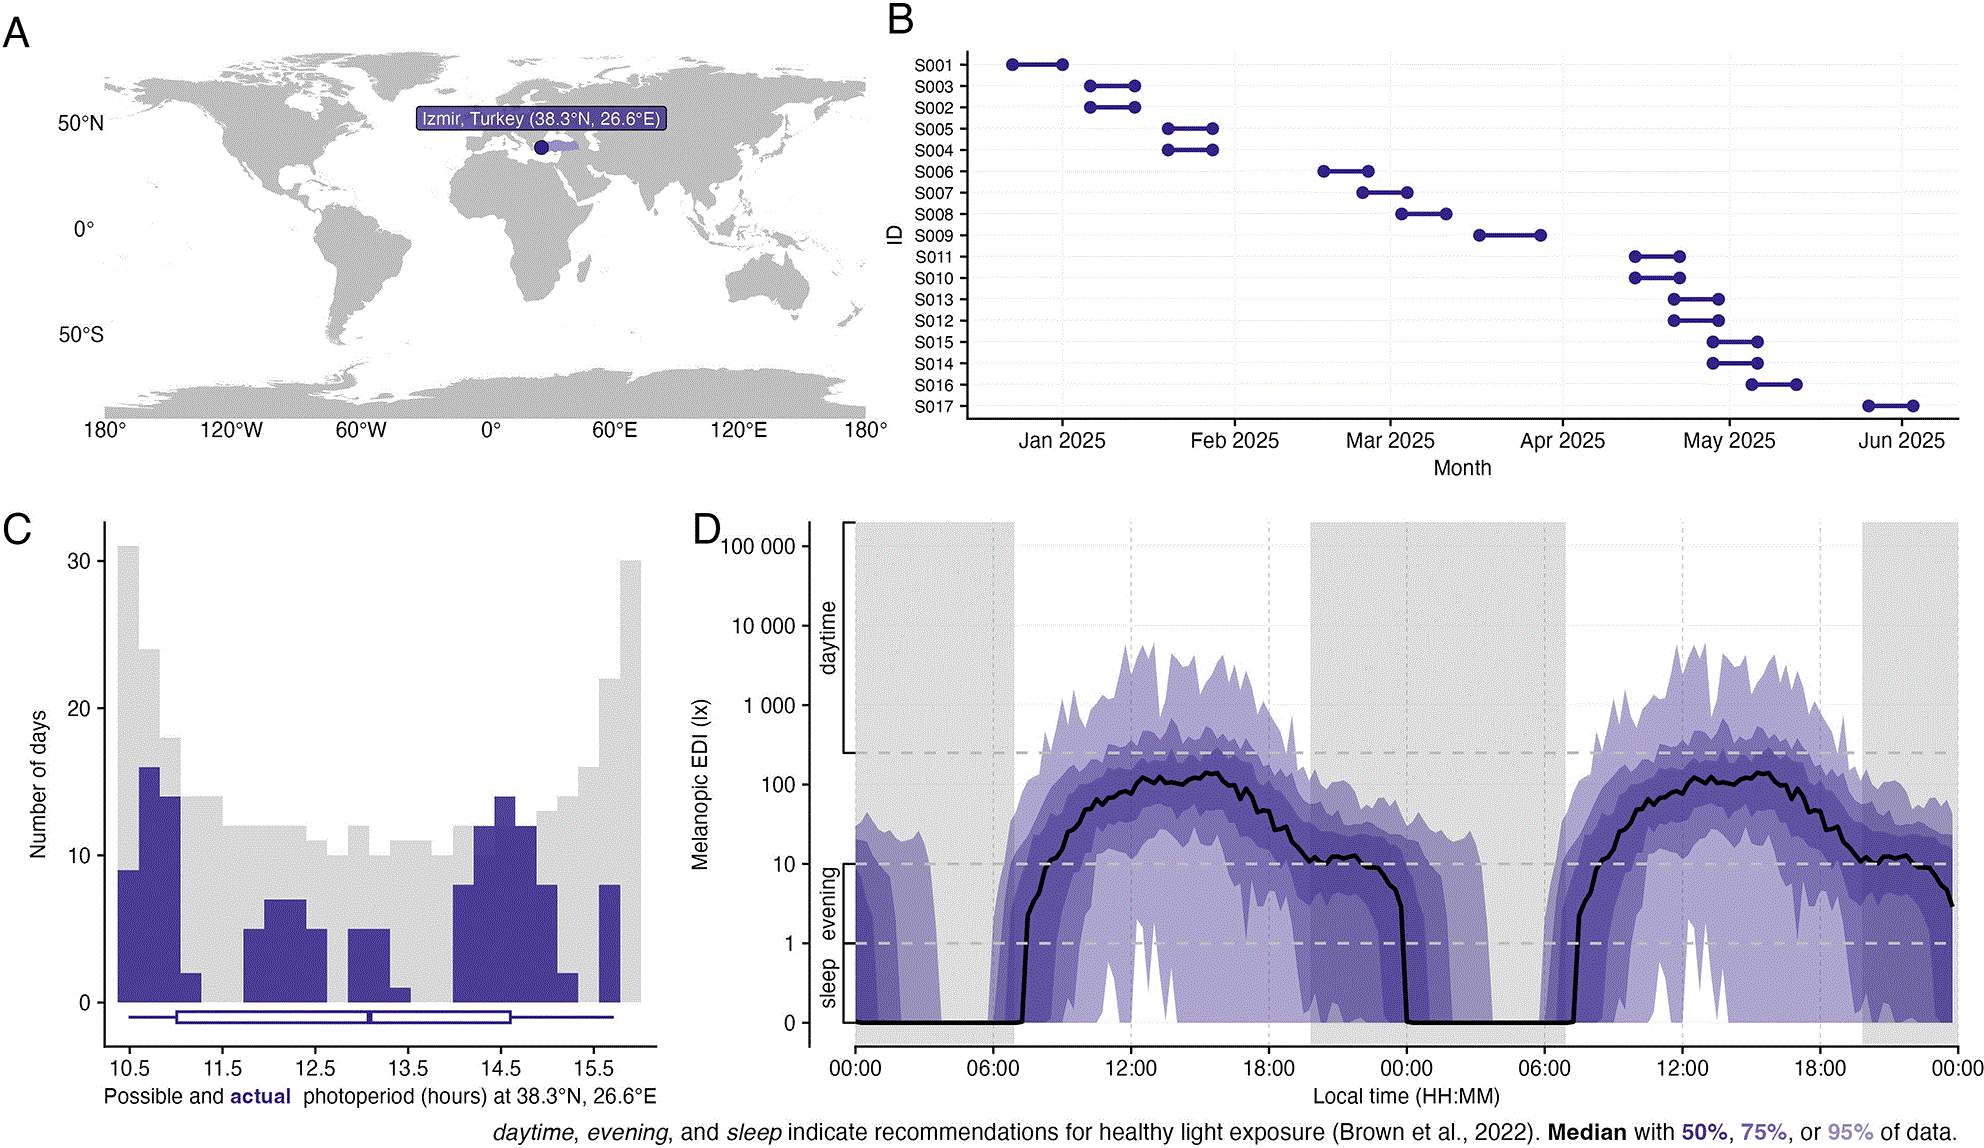
Figure 1. An overview of the study design.
A, Study location shown on map. B, Participants recording periods including implicit missing data in grey. C, Actual photoperiod duration in Izmir, Türkiye (purple). D, Recommended healthy daytime, evening and sleep light exposure (melanopic equivalent daylight illuminance, melanopic EDI).
Methods for data collection are described in greater detail in both the protocol paper and the accompanying data paper, which applied the same protocol in Ghana.2 Briefly, the following instruments and assessment tools were used in the present study:
1. ActLumus light loggers (Condor Instruments, São Paulo, Brazil) were used to objectively measure personal light exposure (10-second sampling interval) and activity at different locations (forehead, chest, wrist)
2. Munich Chronotype Questionnaire (MCTQ)32
3. Morning-Eveningness Questionnaire (MEQ)33
4. Visual Light Sensitivity Questionnaire (VLSQ-8)34
5. Light Exposure Behaviour Assessment (LEBA)22
6. Assessment of Sleep Environment (ASE)35
7. Morning sleep diary
8. Ecological momentary assessment (“Current conditions”)
a. Mood Zoom questionnaire36
b. Karolinska Sleepiness Scale (KSS)37
c. Harvard Light Exposure Assessment Diary (H-LEA)38
9. Evening diaries
10. Wear log
11. Experience log
12. Modified Theoretical Framework of Acceptability (mTFA)40
The following section summarises all site-specific deviations from the published multicentre protocol:
1. Participants received financial remuneration of approximately €40 at the end of the study based on their compliance with the experimental light study, which required them to wear the light logger for at least 80% of their waking hours.
2. To capture environmental light exposure patterns, a static monitoring approach was employed. One ActLumus device was installed on the south-facing exterior wall of the Izmir Institute of Technology Molecular Biology and Genetics Building for each participant.
3. Participants were also allowed to complete an additional momentary assessment immediately upon awakening, following the completion of the sleep diary.
Dataset description
The data collected in REDCap was exported as a comma-separated (CSV) file and processed using Microsoft Excel 2016. Each participant was given a unique participant ID (PID) ranging from IZTECH_S001 to IZTECH_S017 and the position of the light logger was labelled as “e” for the environment, “w” for the wrist, “c” for the chest and “h” for the head. This dataset is publicly available on Zenodo under https://doi.org/10.5281/zenodo.20398056.41 The dataset was further cleaned and processed to harmonise it with the rest of the MeLiDos cohort, and the final curated dataset structure is available in the project’s GitHub repository.41 The dataset is organised into two main categories: Group (containing files for all participants) and Individual (containing participant-specific files and logs).
Group-level folder
This folder contains structured data to facilitate import during data analysis (
Table 1).
Table 1. Description of group-level folders.
| Folder Name | Description |
|---|
| Chronotype | Two CSV files: one for the Morningness-Eveningness Questionnaire (MEQ), another for the Munich Chronotype Questionnaire (MCTQ), each containing N = 17 responses |
| Demographics | One CSV file: one with demographics data for all participants. |
| Discharge | One CSV file: one containing responses to five post-study questionnaires: LEBA, ASE, VLSQ-8, mTFA and general feedback for 17 participants |
| Screening | One CSV file: one with health screening data for all participants. |
Individual-level folder
This contains the 17 participants’ folders with subfolders named by domain. The individual files reflect the data collection schedule and instruments used (
Table 2).
Table 2. Description of individual-level folder.
| Subfolder | Filename | Description |
|---|
| chronotype/ | PID_mctq_yyyymmdd.csv/PID_meq_yyyymmdd.csv | Contains two CSV files: one for MEQ and the other for MCTQ chronotype questionnaires completed on Day 1 of light study (Monday) |
| continuous/actlumus_chest/ | PID_c.txt | Contains two CSV files: one for light exposure (10s intervals, 7 days) and the other an automated report |
| continuous/actlumus_head/ | PID_h.txt | Contains two CSV files: one for light exposure (10s intervals, 7 days) and the other an automated report. Note: Participant IZTECH_S004 has two separate light exposure measurement files. |
| continuous/actlumus_wrist/ | PID_w.txt | Contains two CSV files: one for light exposure (10s intervals, 7 days) and the other an automated report. Note: Participant IZTECH_S016 has a sampling interval of 120 seconds instead of 10 seconds. |
| continuous/actlumus_environment/ | PID_e.txt | Contains two CSV files: one for light exposure and the other an automated report. Note: One ActLumus device was placed on the south-facing exterior wall of the Izmir Institute of Technology Molecular Biology and Genetics Building, one for each participant. |
| continuous/currentconditions/ | PID_currentconditions_yyyymmdd.csv | Contains one CSV file: EMA on mood (MoodZoom), light and alertness (Karolinska Sleepiness Scale); 4× daily |
| continuous/exercisediary/ | PID_exercisediary_yyyymmdd.csv | Contains one CSV file: Evening exercise log |
| continuous/experiencelog/ | PID_experiencelog_yyyymmdd.csv | Contains one CSV file: Self-reports of experiences wearing light loggers |
| continuous/mHLEA_digital/ | PID_mHLEA_digital_yyyymmdd.csv | Contains one CSV file: Daily digital subjective light exposure reports |
| continuous/mHLEA_paper/ | PID_mHLEA_paper_yyyymmdd.xlsx | Contains one Excel file: Transcribed paper version of mHLEA |
| continuous/sleepdiary/ | PID_sleepdiary_yyyymmdd.csv | Contains one CSV file: Morning sleep log |
| continuous/wearlog/ | PID_wearlog_yyyymmdd.csv | Contains one CSV file: Light logger wear/removal events |
| continuous/wellbeingdiary/ | PID_wellbeingdiary_yyyymmdd.csv | Contains one CSV file: Evening well-being rating |
| demographics/ | PID_demog_yyyymmdd.csv | Contains one CSV file: Pre-study screening data completed online to gather information about participant age, sex, employment status, etc. |
| screening/ | PID_health_yyyymmdd.csv | Contains one CSV file: Information about participants lifestyle and health |
| discharge/ | PID_ASE_yyyymmdd.csv, PID_feedback_yyyymmdd.csv, PID_LEBA_yyyymmdd.csv, PID_mTFA_yyyymmdd.csv, PID_VLSQ8_yyyymmdd.csv | Contains five CSV files: Post-study assessments (ASE, LEBA, VLSQ-8, Feedback, mTFA), completed on Day 8 |
Pre-processed, screened, and imported data
All modalities have been prepared and labelled for easy import through the R software package melidosData (v1.0.6).42 For four reasons, it is the recommended entry point for reproducible dataset loading and downstream analysis pipelines, instead of the raw data in the group-level and individual-level folder:
- The package allows for the combined import of a modality across individual, several, or all sites in the project, making comparisons across sites much easier
- Sites can have specific deviations in the raw data. While these are described in the Quarto43 HTML files in the files scripts/import_[modality].html (and.qmd), they are already handled in the package
- Raw data columns are mostly ambiguous without cross-referencing the code-books: https://github.com/MeLiDosProject#codebooks-and-metadata-conventions
. The data downloaded through the package is already labelled, i.e. columns have a “label” attribute explaining the content, and factor-labels are also correctly implemented, instead of just their numeric representation in the raw data
- The package will always download the most current version of the data from the GitHub repositories.
Exploratory descriptive results
Analytical approach
All analyses were conducted for exploratory and descriptive purposes. Comparisons were performed between the Izmir site and all other study sites combined for each variable. Statistical testing was used as a screening approach rather than for confirmatory inference. Accordingly, p-values <0.05 are reported as indicators of potential differences but should be interpreted with caution due to multiple testing and the potential non-independence across site comparisons. Descriptive statistics for continuous variables are presented as medians with interquartile ranges (Q1, Q3). Categorical variables are summarised as counts (n) and corresponding percentages (%), and item-level distributions are reported where relevant. Group comparisons were conducted using the Wilcoxon rank-sum test for continuous variables, and either Fisher’s Exact Test for count data or Pearson’s Chi-squared test, as appropriate. If comparisons were statistically significant, corresponding p-values are reported. Relevant full comparison and descriptive tables can be found at https://github.com/MeLiDosProject/site_comparisons.
All processing and analyses of wearable data were performed using the LightLogR21 package, and the full workflow is documented at https://github.com/MeLiDosProject. Raw light exposure data were cleaned to address missing and irregular values, remove implausible light levels, and restrict observations to the defined study start and end dates. Subsequently, summary light exposure metrics were calculated at both the participant and participant-day levels.
Participant characteristics
The Izmir site included 17 participants, compared to 174 participants across all other sites. Participants in Izmir were younger, with a median age of 24 years (Q1–Q3: 23–26), compared to 28 years (24–39) in the other sites (p = 0.003). The sample was predominantly female, with 65% identifying as female and 35% as male, similar to the distribution observed across other sites. All participants at the Izmir site reported that the questionnaire language was their native language (100%), whereas this proportion was lower in other sites (66%) (p = 0.004). In terms of employment status, the Izmir cohort was primarily composed of those who are both studying and employed (59%), with a higher proportion than observed in other sites (p = 0.003). In contrast, other sites exhibited a more heterogeneous employment distribution, including a greater proportion of full-time employed participants.
Device wear and compliance
At the Izmir site (
Table 3), a total of 17 participants contributed 140 participant-days of data (wear statistics of glasses). Of these, 102 days met the predefined completeness criterion of ≥80% valid data coverage, indicating generally good compliance with the measurement protocol. Non-wear time was relatively low at 3.2% (equivalent to 3 days and 19 hours), indicating good adherence compared to other sites. The median daily photoperiod duration was 13 h 5 min (Q1–Q3: 10 h 31 min–15 h 33 min), capturing variability in day length. The dataset included 106 workdays, providing substantial coverage of typical weekday routines.
Table 3. General descriptive statistics about the site and participants.
| Izmir (TR) |
Other sites
1 |
|---|
| Participants
2 | 17(g:17, c:17) | 22(g:16, c:18) |
| Participant-days
2,
3 | 140d (g:140d, c:140d) | 168d (g:124d, c:139d) |
| Weekday/weekend | 106wd/34we | 125wd/42we |
| Workday/free | 99work/38free | 91work/52free |
| Participant time
3 | 17w 2d | 15w 1d |
| Nonwear time (%)
3 | 3d 19 h (3.2%) | 4d 11 h (4.2%) |
| Complete days (>80% data)
2,
3 | 140d (g:102d, c:140d) | 160d (g:89d, c:139d) |
The duration of the reported non-wear state was longer in İzmir compared to other sites (p = 0.030). However, non-sleep-related non-wear time was significantly lower in İzmir compared to the other study sites (p = 0.005). The reasons for removing the light glasses were comparable across sites, with no specific factor showing a statistically significant difference.
Ocular light exposure
Light exposure metrics derived from the wearable glasses (
Table 4) indicated overall lower daytime light levels in the İzmir cohort, as reflected by reduced M10 levels (p < 0.001) and lower cumulative light dose (p = 0.003). The median light exposure dose was 4.23 klx.h (1.52, 9.99) in Izmir but 4.85 klx.h (1.85, 11.92) in other sites. In addition, nighttime light exposure level was higher compared to other sites, as reflected by increased L10 levels (p = 0.003). Although MDER values were comparable—if not slightly lower—these findings suggest that, despite high daylight availability, participants may not be effectively utilizing natural sunlight. Weekly light exposure patterns were broadly similar to other sites, though with a tendency toward slightly less stable and more fragmented dynamics. All timing-related variables were consistently delayed by approximately 30 minutes to 1 hour, indicating a generally later light exposure profile across both daytime and nighttime periods. The median mean timing of exposure above 250 melanopic lux was 13:50 (12:58, 14:52) in Izmir but 13:26 (12:20, 14:32) in other sites (p < 0.001). In addition, the duration of daytime wake light exposure above the recommended threshold of 250 melanopic lux was reduced by nearly one hour compared to other sites (p < 0.001). Notably, evening and nighttime light exposure patterns appeared more aligned with recommendations, with shorter durations below 10 melanopic lux in the three hours before sleep and below 1 melanopic lux during sleep, suggesting a relatively healthier pre-sleep and nocturnal light environment. Similarly, the duration of exposure above 1000 melanopic lux was reduced (p < 0.001), further indicating lower exposure to bright natural daylight.
Table 4. Melanopic EDI derived light exposure metrics. Descriptive summary (glasses).
|
Unit |
Izmir (TR) |
Other sites |
Difference |
Significance
1 |
|---|
| Dynamics
|
| Interdaily stability | — | 0.28 (0.24, 0.39)
0.32 ± 0.10
n = 17 | 0.31 (0.25, 0.38)
0.32 ± 0.09
n = 124 | −0.03 (±0.03) | p = 0.9; t(20) = −0.17 |
| Intradaily variability | — | 1.36 (0.95, 1.54)
1.31 ± 0.39
n = 17 | 1.32 (0.96, 1.54)
1.27 ± 0.38
n = 124 | 0.04 (±0.10) | p = 0.7; t(20) = 0.41 |
| Level
|
| Mean | lx (rescaled from geometric mean) | 5.7 (3.6, 7.9)
7.6 ± 7.0
n = 102 | 5.1 (2.6, 9.2)
7.5 ± 9.7
n = 709 | 0.6 (±0.8) | p > 0.9; t(163) = 0.08 |
| Brightest 10 h mean | lx (rescaled from geometric mean) | 83.2 (54.8, 151.5)
121.3 ± 102.3
n = 102 | 118.3 (44.6, 265.6)
237.3 ± 548.4
n = 709 | −35.1 (±23.0) | p < 0.001; t(774) = −5.05 |
| Darkest 10 h mean | lx (rescaled from geometric mean) | 0.1 (0.0, 0.5)
0.5 ± 0.9
n = 102 | 0.1 (0.0, 0.2)
0.2 ± 0.4
n = 709 | 0.1 (±0.1) | p = 0.003; t(107) = 3.00 |
| Timing
|
| Brightest 10 h midpoint | HH:MM (time-of-day) | 14:12 (13:26, 15:27)
14:19 ± 02:04
n = 102 | 13:39 (12:49, 14:57)
13:54 ± 01:48
n = 709 | 00:33 (±00:13) | p = 0.061; t(124) = 1.89 |
| Brightest 10 h onset | HH:MM (time-of-day) | 09:13 (08:27, 10:28)
09:20 ± 02:04
n = 102 | 08:40 (07:50, 09:58)
08:55 ± 01:48
n = 709 | 00:33 (±00:13) | p = 0.061; t(124) = 1.89 |
| Brightest 10 h offset | HH:MM (time-of-day) | 19:12 (18:26, 20:27)
19:19 ± 02:04
n = 102 | 18:39 (17:49, 19:57)
18:54 ± 01:48
n = 709 | 00:33 (±00:13) | p = 0.061; t(124) = 1.89 |
| Darkest 10 h midpoint | HH:MM (time-of-day) | 03:32 (02:35, 04:20)
03:25 ± 01:27
n = 102 | 02:39 (01:45, 03:41)
02:41 ± 01:57
n = 709 | 00:53 (±00:09) | p < 0.001; t(160) = 4.54 |
| Darkest 10 h onset | HH:MM (time-of-day) | −01:27 (−02:24, −00:38)
−01:33 ± 01:27
n = 102 | −02:19 (−03:12, −01:16)
−02:11 ± 01:51
n = 709 | 00:52 (±00:09) | p < 0.001; t(153) = 3.92 |
| Darkest 10 h offset | HH:MM (time-of-day) | 08:30 (07:32, 09:17)
08:11 ± 02:25
n = 102 | 07:37 (06:43, 08:37)
07:27 ± 02:36
n = 709 | 00:53 (±00:15) | p = 0.005; t(137) = 2.84 |
| Mean timing above 250 | HH:MM (time-of-day) | 13:50 (12:58, 14:52)
14:04 ± 01:33
n = 96 | 13:26 (12:20, 14:32)
13:25 ± 01:50
n = 682 | 00:24 (±00:10) | p < 0.001; t(135) = 3.72 |
| First timing above 250 | HH:MM (time-of-day) | 10:02 (09:05, 11:54)
10:21 ± 02:40
n = 96 | 09:01 (07:58, 10:30)
09:19 ± 02:25
n = 682 | 01:01 (±00:17) | p < 0.001; t(118) = 3.55 |
| Last timing above 250 | HH:MM (time-of-day) | 18:37 (16:45, 19:37)
18:13 ± 02:16
n = 96 | 18:00 (16:06, 19:37)
17:46 ± 02:39
n = 682 | 00:37 (±00:15) | p = 0.078; t(134) = 1.78 |
| Duration
|
| Duration above 1000 | Hrs:Mins (duration) | 00:29 (00:05, 01:03)
00:43 ± 00:50
n = 102 | 00:43 (00:11, 01:41)
01:13 ± 01:31
n = 709 | −00:13 (±00:06) | p < 0.001; t(213) = −4.95 |
| Duration above 250 | Hrs:Mins (duration) | 01:39 (00:40, 03:25)
02:11 ± 01:56
n = 102 | 02:30 (00:55, 04:54)
03:09 ± 02:38
n = 709 | −00:50 (±00:13) | p < 0.001; t(160) = −4.48 |
| Period above 250 | Hrs:Mins (duration) | 00:33 (00:14, 00:56)
00:42 ± 00:41
n = 102 | 00:38 (00:18, 01:16)
00:58 ± 01:07
n = 709 | −00:04 (±00:04) | p = 0.001; t(191) = −3.30 |
| Duration below 10 pre-Sleep
| Hrs:Mins (duration) | 01:24 (00:46, 02:12)
01:32 ± 00:59
n = 100 | 01:44 (00:55, 02:32)
01:45 ± 01:02
n = 680 | −00:20 (±00:06) | p = 0.039; t(133) = −2.08 |
| Duration below 1 sleep | Hrs:Mins (duration) | 06:45 (05:07, 08:15)
06:39 ± 02:06
n = 99 | 07:10 (06:00, 08:15)
07:04 ± 01:58
n = 691 | −00:25 (±00:13) | p = 0.073; t(124) = −1.81 |
| Duration above 250 wake | Hrs:Mins (duration) | 01:31 (00:41, 03:25)
02:08 ± 01:54
n = 98 | 02:31 (00:54, 04:47)
03:03 ± 02:30
n = 657 | −00:59 (±00:12) | p < 0.001; t(152) = −4.27 |
| Exposure History
|
| Dose | — | 4.23 (1.52, 9.99)
7.05 ± 8.55
n = 102 | 4.85 (1.85, 11.92)
10.17 ± 16.51
n = 709 | −0.62 (±1.05) | p = 0.003; t(229) = −2.97 |
| Spectrum
|
| MDER | — | 0.69 (0.61, 0.79)
0.71 ± 0.12
n = 91 | 0.71 (0.63, 0.78)
0.70 ± 0.12
n = 634 | −0.02 (±0.01) | p = 0.7; t(121) = 0.42 |
Light sensitivity and exposure behaviours
The median VLSQ-8 sum score in the Izmir cohort was 23.0 (Q1–Q3: 19.0–29.0), indicating moderate levels of self-reported light sensitivity, comparable to other sites. The only notable difference was in the reported severity of light sensitivity, which was higher in the Izmir cohort compared to other sites (p = 0.007).
Light exposure behaviours, assessed using the LEBA instrument, showed comparable scores across all main factors, including time spent outdoors (F2), use of phones and smartwatches before sleep (F3), controlling and using ambient light before bedtime (F4), and use of light during the morning and daytime (F5). At the item level, behaviours related to evening light exposure, such as mobile phone use in bed, were more frequently reported in the Izmir cohort (p = 0.001). Participants also reported less frequent use of minimal lighting during nighttime awakenings (p = 0.027). In contrast, adaptive behaviours aimed at reducing pre-sleep light exposure, such as dimming screens, were reported more often (p = 0.050).
Acceptability and user experience
Acceptability of the light glasses, assessed using the mTFA framework, indicated lower comfort levels in the Izmir cohort compared to other sites. A majority of participants reported discomfort, with 29% describing the device as “very uncomfortable” and 47% as “uncomfortable,” whereas only 12% reported feeling comfortable or very comfortable. This distribution differed significantly from other sites (p = 0.036). Despite this, perceived effort required to use the device and overall acceptability ratings were comparable across sites, with 77% of participants in Izmir rating the experience as acceptable or completely acceptable. Participants’ perceptions of the device’s effectiveness and understanding of its purpose were high, with all participants agreeing or strongly agreeing that the light glasses could measure daily light exposure and that their function was clear. Confidence while wearing the device and perceived interference with daily priorities were also similar to other sites, with no statistically significant differences observed.
Experience sampling data further indicated differences in subjective user experience. Participants in Izmir reported a higher proportion of negative experiences (45%) compared to other sites (29%), alongside fewer positive experiences (12% vs. 30%) (p = 0.003). Experiences were most frequently reported in office or work-related environments (51%), followed by public spaces (29%) and home settings (13%), with the distribution differing significantly from other sites (p = 0.037). Social feedback during these experiences was common (55%), often originating from strangers (45%) or colleagues (24%), though the type and source of feedback were broadly comparable across sites.
Chronotype and sleep characteristics
Chronotype distributions based on the MEQ were broadly similar between the Izmir cohort and other sites, with no statistically significant differences observed. However, there was a tendency toward a higher proportion of evening types in Izmir (30% moderately or definitely evening types) compared to other sites (15%). The median MEQ score was 52 (Q1–Q3: 40–57) in Izmir and 54 (45–62) in other sites.
MCTQ-derived measures indicated a later sleep timing in the Izmir cohort. Mid-sleep on free days (sleep-corrected) occurred at 05:28 (05:07–05:56) in Izmir compared to 03:58 (03:03–04:47) in other sites (p < 0.001). Similarly, mid-sleep on working days (p < 0.001) and free days (p < 0.001) were consistently delayed. Despite these differences in timing, social jetlag was comparable between groups.
Sleep diary data supported these findings, showing later bedtimes, sleep onset, final awakening, and getting-out-of-bed times in the Izmir cohort (all p < 0.001). Sleep latency was slightly longer in Izmir, with a median of 15 minutes (10–20) compared to 10 minutes (5–20) in other sites (p = 0.019). However, overall sleep duration and subjective sleep quality ratings were comparable between groups.
Assessment of the sleep environment (ASE) revealed several notable differences. Participants in Izmir more frequently reported their sleep environment as too dark (p = 0.008) and too quiet (p < 0.001). In addition, higher proportions reported the presence of unpleasant smells (p = 0.023), feelings of reduced safety or security (p = 0.030), and sleeping surfaces that were too soft (p = 0.025). Other environmental factors, such as noise, temperature, and bedding comfort, were largely comparable across sites.
Physical activity and wellbeing
Daily physical activity patterns in the Izmir cohort were broadly comparable to those observed across other sites. Participants most frequently reported engaging in light (38%) or no physical activity (39%) on a given day, with smaller proportions reporting vigorous (13%) or moderate activity (10%), showing no significant differences compared to other sites. Among those who were active, the majority reported exercising outdoors (53%), followed by indoor activity (35%) or a combination of both (12%), with no significant between-site differences.
In contrast, subjective daily wellbeing differed between the Izmir cohort and other sites. Participants in Izmir reported lower overall wellbeing scores, with a median WHO-5 percentage score of 60 (48–72) compared to 68 (56–76) in other sites (p < 0.001). Item-level responses indicated that participants in Izmir less frequently reported feeling cheerful, calm, or active (all p < 0.001). However, they more frequently reported that their daily life was filled with things that interest them compared to other sites (p < 0.001). Despite these differences, self-reported sleep quality from the wellbeing diary was similar between groups.
Ecological momentary assessments (EMA)
Momentary sleepiness, assessed using the Karolinska Sleepiness Scale (KSS), was comparable between the Izmir cohort and other sites, with no statistically significant differences observed. In contrast, affective states differed across all assessed mood dimensions. Participants in Izmir reported feeling less energetic (p = 0.027) but also more elated (p < 0.001), and higher levels of negative affect, including feeling more anxious, sad, angry, and irritable (all p ≤ 0.002).
Contextual EMA data further indicated differences in environmental light exposure. Primary light source reporting showed that data in the Izmir cohort were more frequently collected under indoor lighting conditions, with relatively lower exposure to outdoor daylight (p < 0.001). Additionally, reports of exposure to emissive screens were less frequent compared to other sites.
Ethical approval
This study was conducted as part of the international MeLiDos multicentre study, for which a common research protocol was developed and implemented across all participating sites. Ethical approval for the overarching multicentre protocol was obtained from the Medical Ethics Committee of the Technical University of Munich (2024–118-S-SB), covering the overall study design and procedures across participating countries. In addition, local ethical approval was obtained at each participating site to ensure compliance with national regulations and institutional requirements for participant recruitment and study implementation. For the Izmir site, the study protocol was approved by the Izmir Institute of Technology Science and Engineering Scientific Research and Publication Ethics Committee (E-41752998-050.04-2400027343). All participants provided written informed consent before enrolment after receiving detailed information about the study objectives, procedures, potential risks, and their right to withdraw at any time without consequences. All study procedures were conducted in accordance with the principles of the Declaration of Helsinki.