Introduction
Potato cyst nematodes (PCN), particularly Globodera rostochiensis with its five pathotypes (Ro1–Ro5), continue to pose significant challenges to potato cultivation, with breeding for resistance remaining the most effective control strategy (Finkers-Tomczak et al. 2011). The H1 resistance locus, derived from Solanum tuberosum ssp. andigena CPC1673 (Bakker et al. 2004), confers resistance to pathotypes Ro1 and Ro4 and has been extensively utilised in commercial breeding programs. High-resolution mapping in the diploid clone SH83–92-488 has revealed that this region is divergent between haplotypes, characterized by an abundance of R-gene clusters and repeats, and exhibits suppressed recombination (Finkers-Tomczak et al. 2011). The SCAR marker 57R, situated near the resistance-determining region, has been a useful diagnostic tool for H1, although its gel-based format restricts high-throughput selection.
Efforts to convert H1-linked polymorphisms into scalable marker formats have been numerous. Direct conversion of gel-based assays to alternative platforms such as HRM or KASP has shown variable success. As an alternative strategy, Meade et al. (2020) used bulked whole-genome resequencing of genotypes contrasting for the 57R SCAR marker to identify a diagnostic SNP and develop the first publicly available KASP assay for H1. In the absence of a precisely defined H1 sequence, they used the mapped position of 57R on the DM reference genome to delimit a candidate region for SNP discovery. The resulting marker enabled high-throughput selection, although the diagnostic SNP was located approximately 0.2 Mb from the historical 57R locus.
Haplotype-specific k-mer approaches provide an alternative framework for identifying resistance-associated variation directly from sequencing reads. The publicly available bulked resequencing data generated by Meade et al. (2020) offer an opportunity to revisit the H1 locus using such a strategy. In this study, we applied Comparative Subsequence Set Analysis (CoSSA) (Prodhomme et al. 2019) to extract k-mers specific to the resistant bulk, localised the enriched region relative to the historic 57R marker, and nominated candidate SNPs for conversion into KASP assays.
Materials and Methods
Comparative Subsequence Set Analysis (CoSSA)
Analyses were performed using publicly available whole-genome resequencing data generated by Meade et al. (2020). These data consisted of four bulks: one resistant bulk (H1) composed of 15 H1-carrying tetraploid cultivars and three susceptible bulks (neg1, neg2, neg3), each containing 15 H1-negative cultivars. Raw reads were downloaded from ENA project PRJEB31308 (https://www.ebi.ac.uk/ena/browser/view/PRJEB31308). k-mer analysis was performed using the CoSSA workflow (Prodhomme et al. 2019) (
Figure 1), with minor modifications as outlined. Forward and reverse reads from each bulk were quality-trimmed using fastp (Chen et al. 2018) and k-mer tables were generated using KMC3 (Kokot et al. 2017) with a k-mer length of 31 bp. Singleton k-mers (frequency = 1) were removed. The retained k-mers and their counts were stored in compressed KMC tables for subsequent set operations.
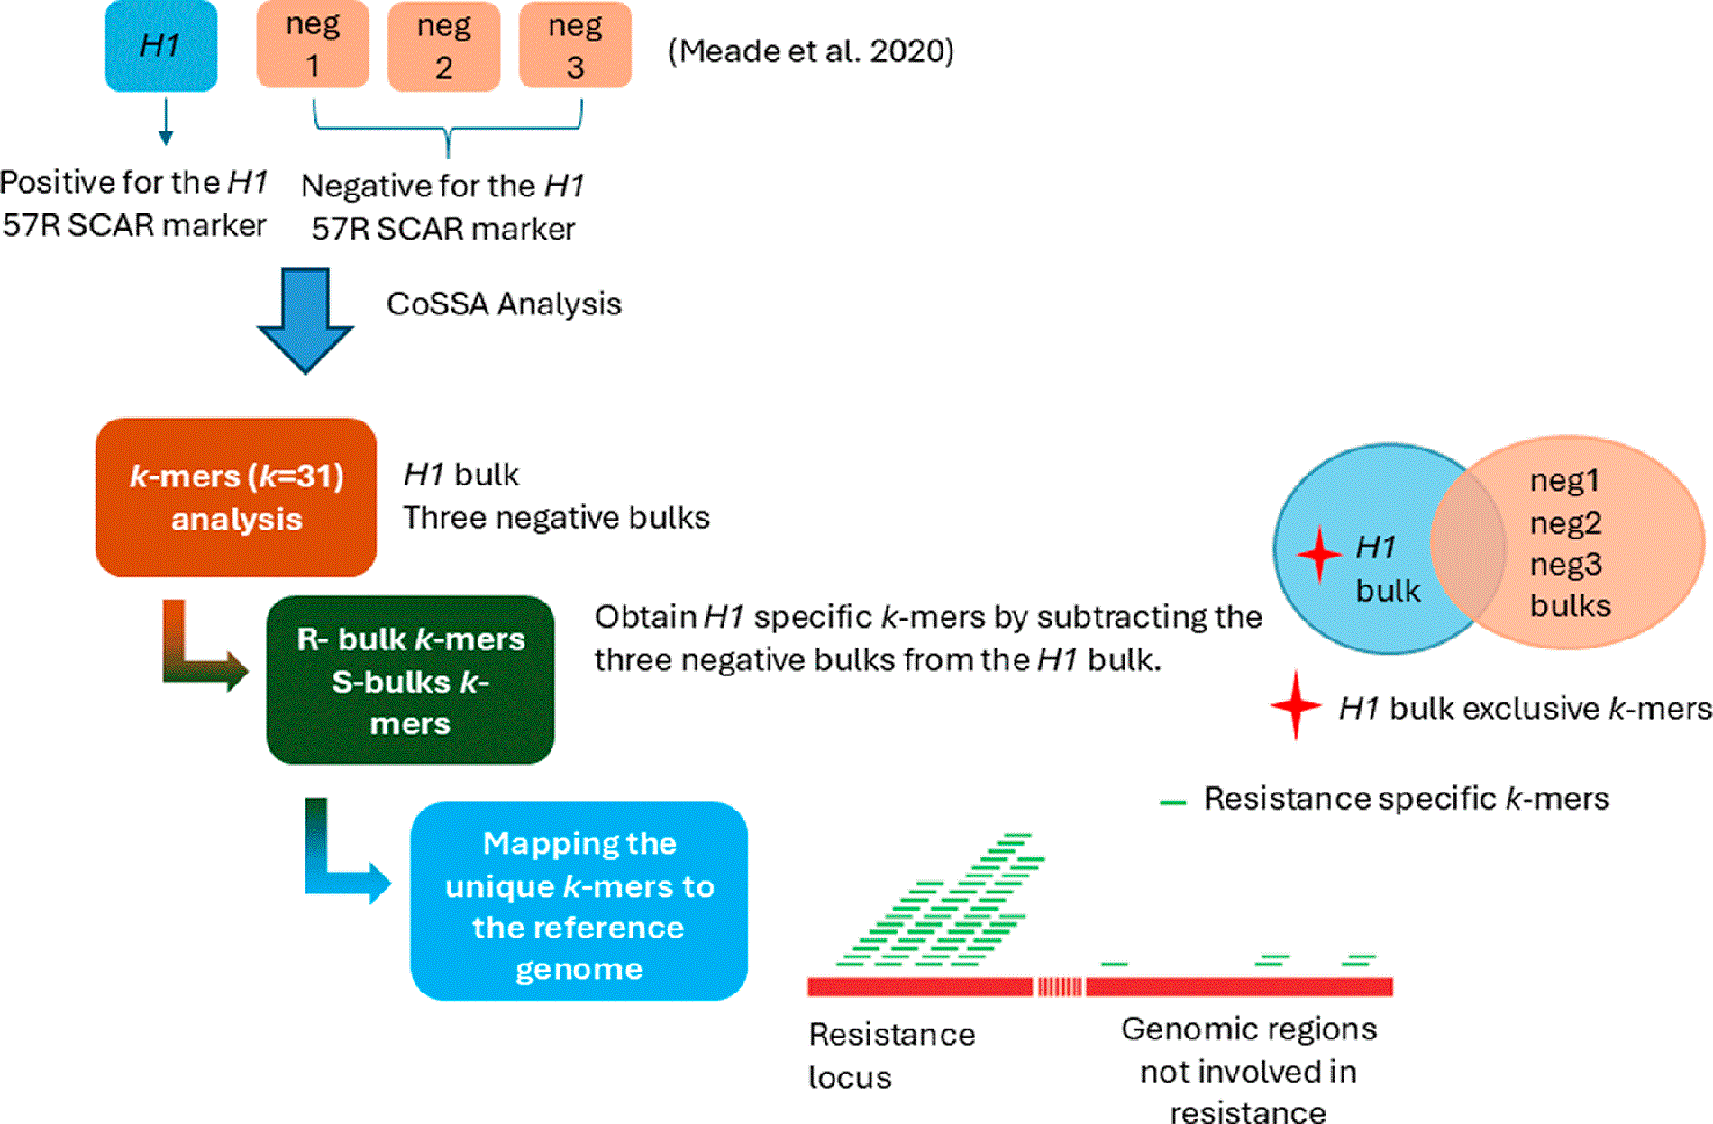
Figure 1. CoSSA analysis pipeline, adapted from Prodhomme et al. (2019), for identifying H1-associated k-mers from bulked sequencing data.
k-mer subtraction between H1-positive and H1-negative bulks (Meade et al. 2020) identifies resistance-specific k-mers, which are mapped to the reference genome to localise the H1-associated region for SNP discovery.
To obtain a set of k-mers enriched for the H1 resistance haplotype, we performed set subtraction across the four bulks:
This operation retains only k-mers present in the resistant bulk and absent from all susceptible bulks. The resulting H1-specific k-mers represent haplotype-associated subsequences independent of any reference genome.
Although the DM genome does not contain the H1 gene, it provides a useful chromosomal coordinate framework for locating the region corresponding to the historic 57R SCAR marker. H1-specific k-
mers were aligned to the Solanum phureja DM v4.04 reference genome (Sharma et al. 2013; Xu et al. 2011) using bwa aln v0.7.12 (Li and Durbin 2009) with up to three mismatches permitted to account for divergence between DM and the introgressed H1 haplotype. Aligned k-mers were processed using SAMBLASTER (Faust and Hall 2014) for read-splitting, and SAMtools (Li et al. 2009) for sorting and indexing.
Genome-wide distribution and optimisation of k-mer depth threshold
Mapped H1-specific k-mers were summarised in 1 Mb genomic bins using BEDtools v2.25 (Quinlan and Hall 2010) and visualised in R. To reduce background signal from low-abundance and repetitive k-
mers, a depth-based filter was applied. Filter thresholds were optimised using a signal-to-noise ratio (SNR), defined as enrichment of H1-specific k-mers at the chromosome 5 H1 peak relative to genome-wide background, and the selected threshold was used to define the working k-mer set for SNP discovery.
Development of KASP marker and genotyping
Candidate SNPs were identified from mismatches in H1-specific k-mers mapping to the chromosome 5 interval defined by the 57R SCAR primer sites (coordinates from Finkers-Tomczak et al. 2011 on the DM v4.04 reference). Variants supported by multiple independent H1-specific k-mers and compatible with KASP assay design were prioritised.
KASP assays were designed and validated through the KASP on Demand service provided by LGC Genomics (Herts, UK). Two SNPs flanking the 57R region were selected for assay development: chr05_49452878_T/C and chr05_49701152_G/A. Both assays were initially tested; however, only chr05_49452878_T/C showed consistent diagnostic performance and was retained for further analysis (
Table 1).
Table 1. Primer sequences and target sequence for the KASP assay targeting chr05_49452878_T/C (hereafter referred to as H1_v2).
| Primer_AlleleX
| AATTTAATCGAACGAAAAATATAATGGTCAA |
| Primer_AlleleY
| AATTTAATCGAACGAAAAATATAATGGTCAG |
| Primer_Common
| GCGGCACAGTCCACAGTAATGCAT |
| Sequence
| TGCGGCACAGTCCACAGTAATGCATCCCCA [T/C]TGACCATTATATTTTTCGTTCGATTAAATT |
Over three years, 240 potato cultivars were genotyped in parallel with the published KASP marker (H1_v1; Meade et al. 2020) and the new k-
mer–derived marker (H1_v2) as part of the Teagasc/IPM Potato Group Breeding Programme. A subset of 193 cultivars with data for both markers was used for paired comparison (full lists in ESM S5). Marker performance was judged as correct/incorrect by agreement with at least one phenotypic PCN resistance assessment available from variety descriptions; 2 × 2 confusion matrices were constructed from these binary outcomes and compared with McNemar’s test. Analyses and plots were produced in R v4.2.1.
Language editing
ChatGPT (GPT-4o, OpenAI’s large-scale language model) was used for language editing. The edits were reviewed and revised by the authors, who take full responsibility for the final content of this publication.
Results
Identification of H1-associated k-mers from public BSA data
Bulked resequencing data from Meade et al. (2020) were quality trimmed and filtered to yield ~47 Gb per bulk (~55× per bulk for an 844 Mb haploid genome), equivalent to ~3.7× per individual across 15 tetraploid genotypes. CoSSA subtraction (H1 – (neg1 U neg2 U neg3)) produced 139,323,028 H1specific k-
mers (ESM S1), which were mapped to the DM v4.04. Mapped k-
mers formed a strong peak at the distal end of chr5 corresponding to the H1 locus but also showed secondary peaks, notably on chr12 (ESM S2). To assess whether these reflected background signal from low-abundance k-mers, the analysis was repeated using a series of minimum k-mer depth thresholds ranging from 3 to 24. Increasing the lower threshold progressively reduced secondary peaks across the genome, while the chr5 peak remained stable until very stringent thresholds (≥20), indicating that much of the background signal was driven by low-count k-mers. Signal-to-noise ratio (SNR), calculated as enrichment under the chr5 peak relative to background signal across the genome, increased with increasing threshold (ESM S2–S3). Based on these observations, a working depth range with a lower cut-off of 8 and an upper cut-off of 28 was selected for downstream analyses. This range is consistent with the expected k-mer coverage for a simplex haplotype in the bulked material, improves separation of the chromosome 5 signal from background, and limits both loss of informative k-mers due to low sequencing depth and inclusion of k-mers derived from multi-copy sequences. At this depth cut-off [8:28], the dataset comprised 4,222,236 H1-specific k-mers, of which 1.42% mapped to the chr5 H1-associated peak (
Figure 2).
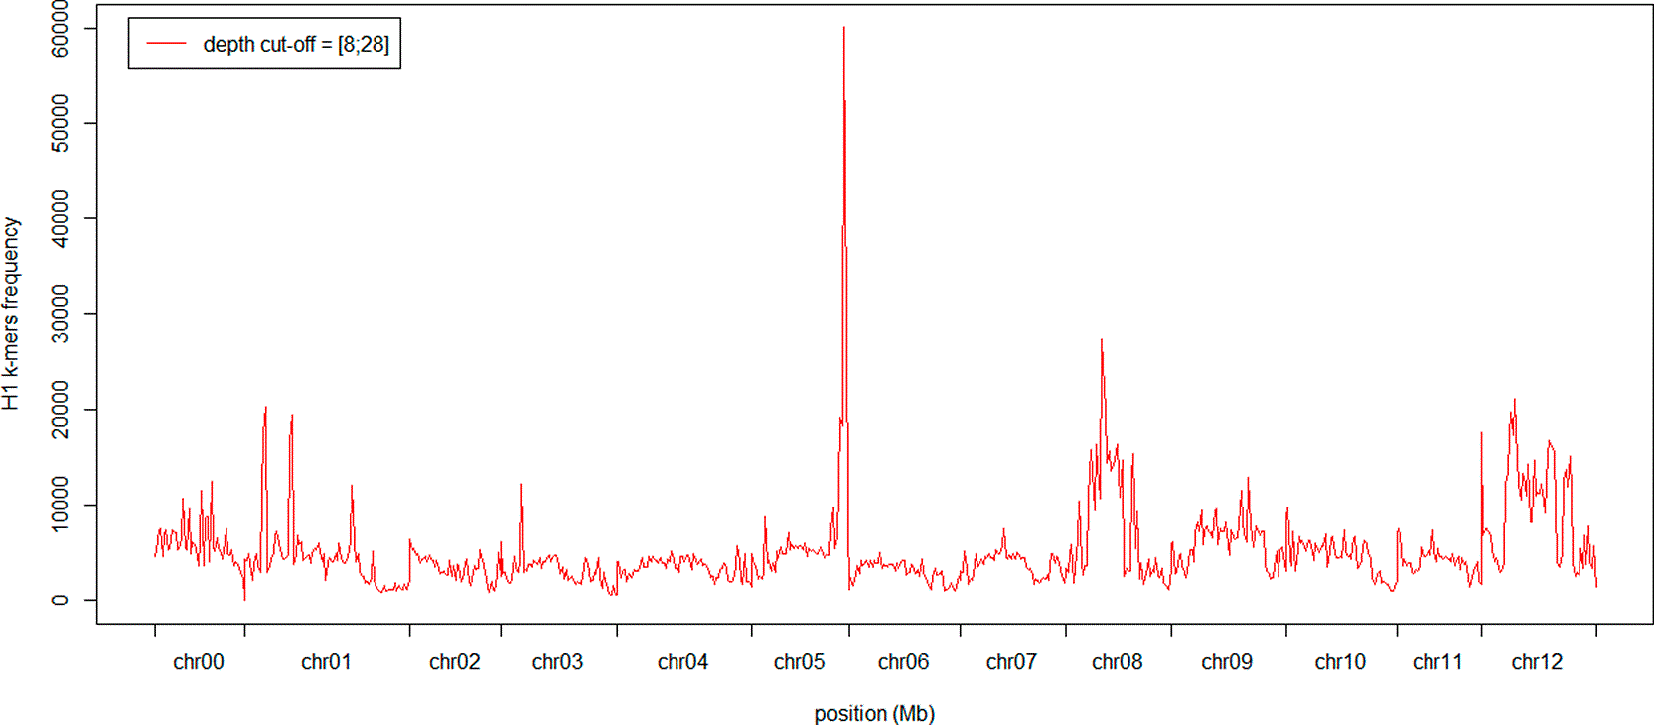
Figure 2. Genome-wide distribution of H1-specific k-mers mapped to DM reference genome.
Counts of H1-specific k-mers were summarised in 1 Mb bins after applying a depth filter of 8–28. A strong enrichment is observed at the distal end of chromosome 5, corresponding to the known H1 diagnostic region, while lower-level background signal is distributed across the remainder of the genome.
At 100 kb resolution the refined H1-specific k-mer set ([8:28]) defined a contiguous H1-associated interval on chr5 ≈ 49–50 Mb (DM v4.04), encompassing the 57R SCAR marker. Of 4,222,236 k-mers retained at [8:28], 60,140 mapped within this 1-Mb region and were screened for SNPs. Sites with neighbouring polymorphisms within ±30 bp were excluded (i.e. non-isolated SNPs; max 31 overlapping 31-mers), and remaining candidates were inspected in IGV v2.3.72. This yielded 99 candidate SNPs (ESM S5); only those at or distal to 49,238,169 (Meade et al. 2020) were retained, with the closest flanking SNPs being chr05_49452878_T/C and chr05_49701152_G/A (Figure 3).
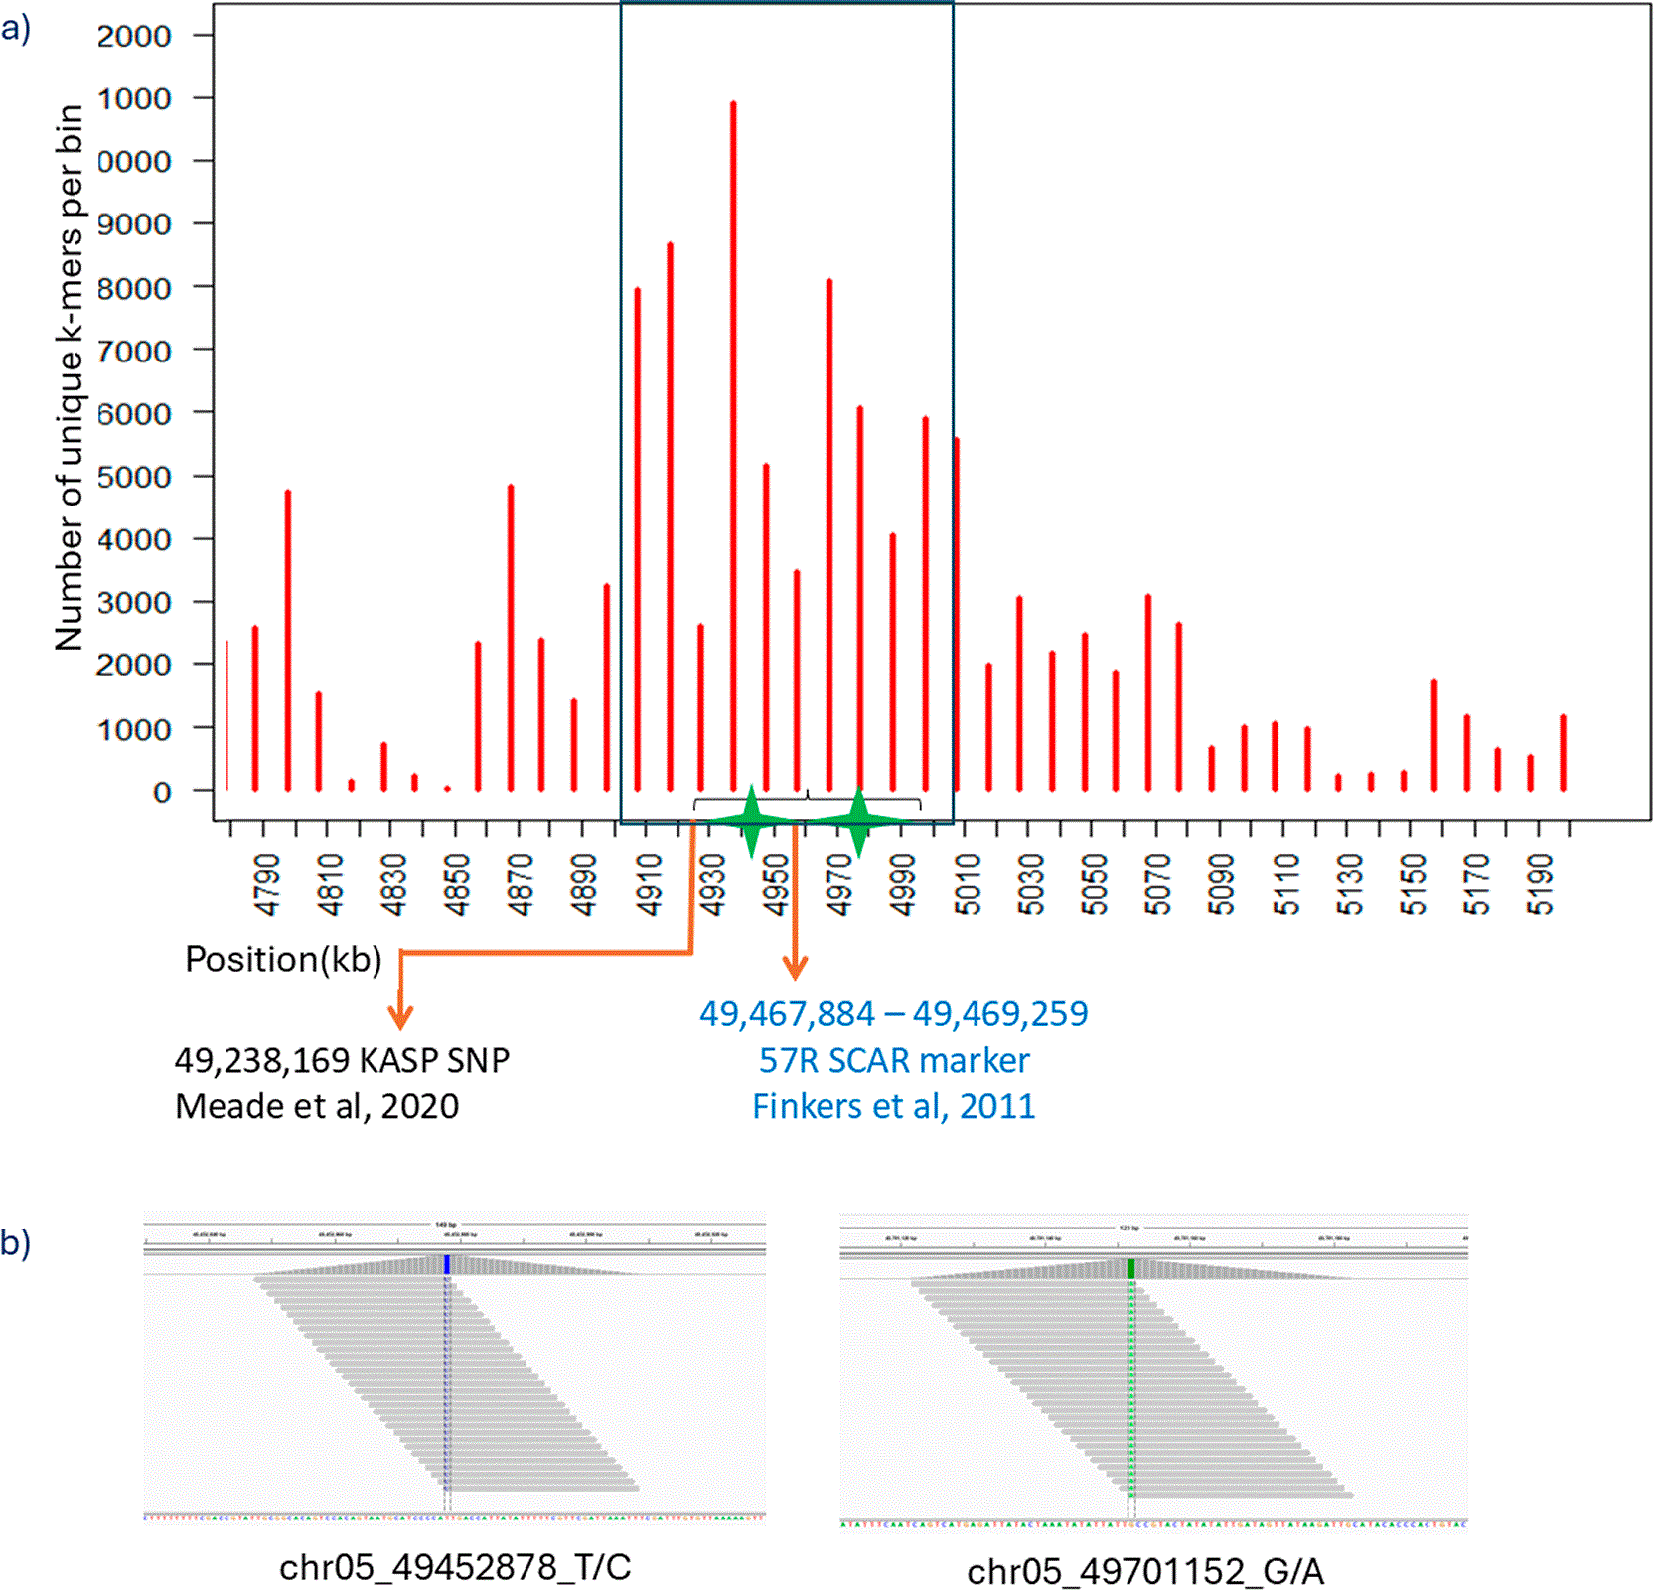
Figure 3. Candidate H1-associated SNPs identified by k-mer analysis.
a) Genomic positions of candidate SNPs (green stars) relative to the original 57R SCAR marker and the previously published KASP marker. b) IGV visualisation of H1-specific k-mer alignments covering the two candidate SNPs chr05_49452878_T/C and chr05_49701152_G/A.
KASP assay performance and marker validation
The previously published KASP (H1_V1) marker was used as a reference. The, two candidate SNPs identified as described above were converted to KASP and tested across 240 cultivars over multiple years using publicly available resistance data (ESM S4); 193 cultivars had data for all three markers. chr05_49701152_G/A showed no reliable association and was dropped; chr05_49452878_T/C (H1_V2) displayed clear clustering and consistent behaviour. Against phenotypic Globodera rostochiensis resistance, H1_V2 had fewer false negatives and improved sensitivity and overall accuracy versus H1_V1 (accuracy 0.899 vs 0.846; sensitivity 0.903 vs 0.822;
Figure 4) while maintaining similar specificity and precision. Performance metrics were derived from confusion matrices summarising true positive (TP), true negative (TN), false positive (FP), and false negative (FN) classifications. Accuracy represents the proportion of correctly classified genotypes overall. Precision reflects the proportion of resistant predictions that are correct, sensitivity (recall) measures the proportion of resistant genotypes correctly identified, and specificity represents the proportion of susceptible genotypes correctly classified. The F1-score summarises the balance between precision and sensitivity. In the paired comparison across the 193 cultivars, H1_V2 corrected 13 misclassifications made by H1_V1, whereas H1_V1 corrected only one made by H1_V2; this difference was significant (McNemar’s test, p = 0.0033), indicating a modest but meaningful improvement in marker performance.
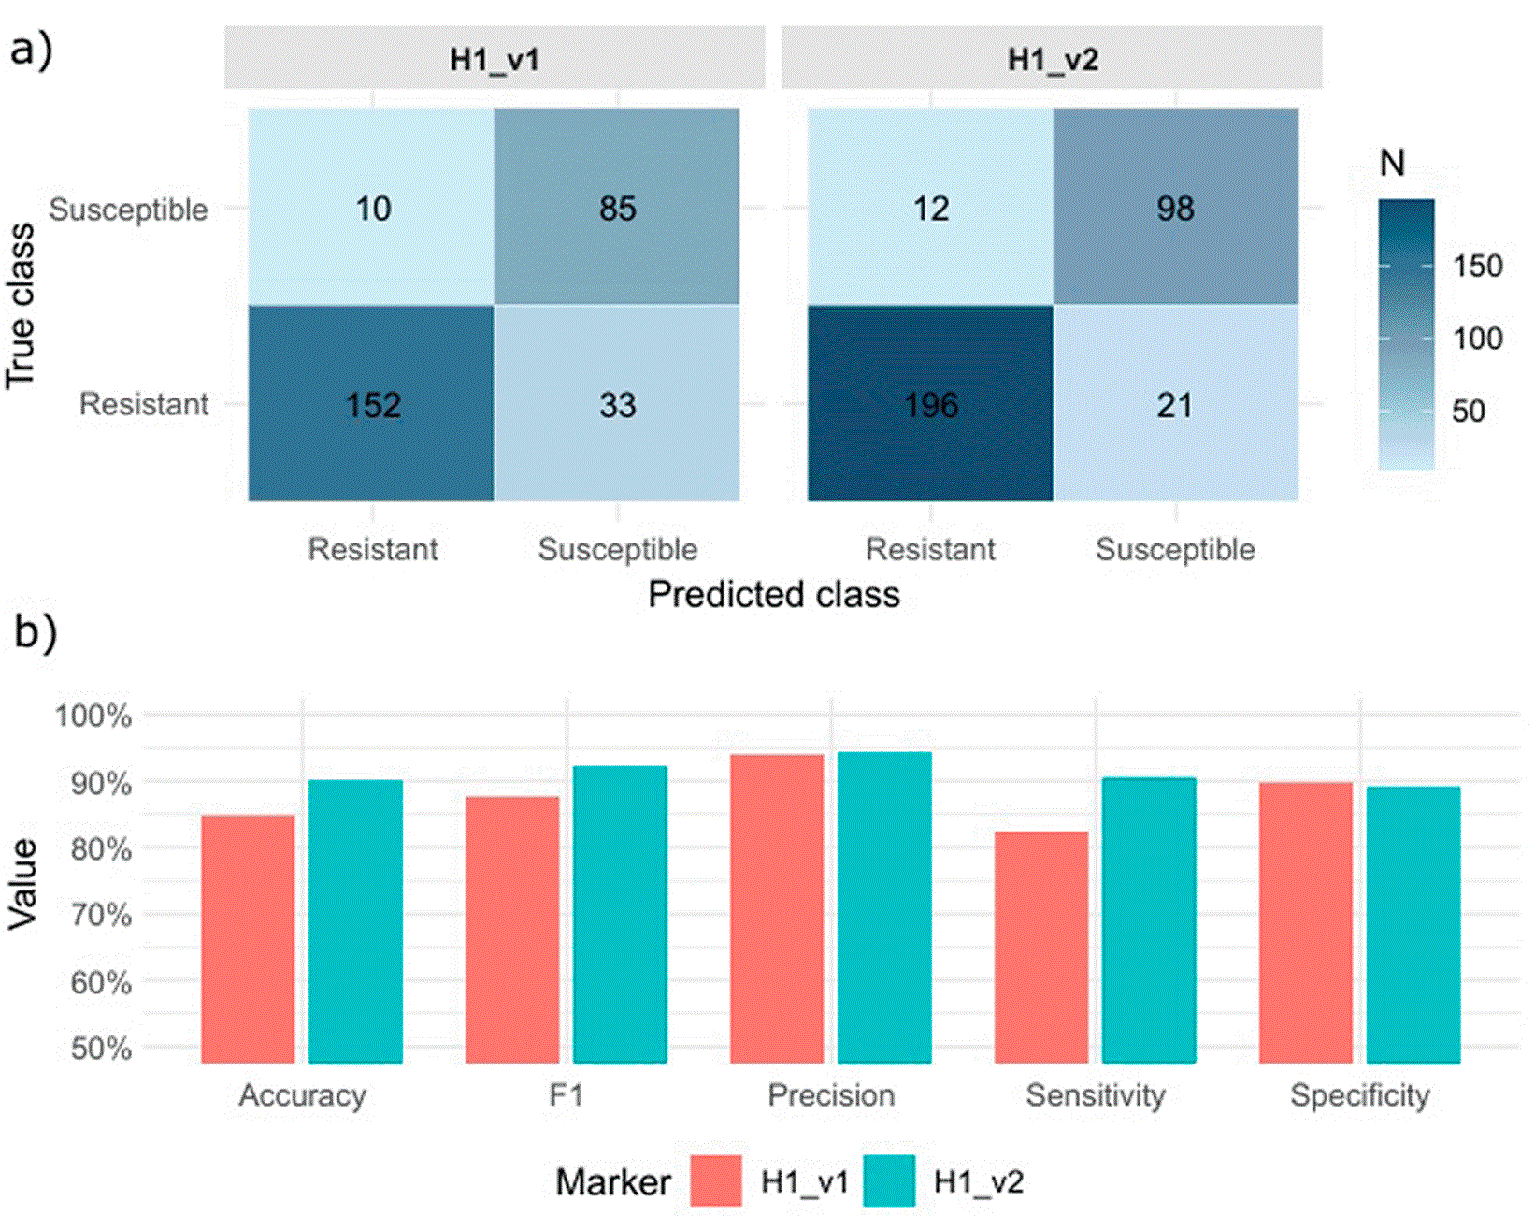
Figure 4. Performance of H1_V1 and H1_V2 KASP markers for PCN resistance detection a) Confusion matrices for H1_V1 (left) and H1_V2 (right), showing the number of true resistant (TP), true susceptible (TN), false positive (FP), and false negative (FN) classifications relative to phenotypic resistance to Globodera rostochiensis, combining data from all years.b) Comparison of classification metrics for H1_V1 and H1_V2, including accuracy, sensitivity, specificity, precision, and F1-score. Values are calculated using all genotypes for which both marker calls and phenotypic data were available.
Discussion
Marker-assisted selection depends on diagnostic markers that are both tightly linked to the causal gene and compatible with high-throughput platforms. Meade et al. (2020) demonstrated a practical strategy to convert PCR-based markers such as 57R into KASP assays using pooled whole-genome resequencing and alignment to the DM reference genome. While successful, SNP nomination relied on semi-manual inspection of aligned reads, and the resulting marker lies ~0.2 Mb from the historical 57R SCAR site, allowing scope for recombination. Here, applying a haplotype-specific k-mer subtraction framework to the same sequencing dataset, we systematically recovered 99 candidate SNPs associated with the resistant haplotype. From these, two SNPs flanking the 57R region and in closer physical proximity to the original SCAR locus were prioritised for KASP conversion and downstream evaluation. Of the two SNPs evaluated, one showed diagnostic value and produced a modest but statistically significant improvement in performance relative to the previously published marker, consistent with reduced recombination between marker and gene.
A key advantage of the k-mer–based approach is that it enables the discovery of resistance-associated variation without relying on variant calling against a reference genome. By directly comparing subsequences derived from whole-genome sequencing reads, CoSSA identifies sequence differences linked to resistance while avoiding several limitations of reference-based analyses. This is particularly important in the present study because the DM reference genome lacks the H1 resistance haplotype. Through set subtraction of susceptible bulks from the resistant bulk, the k-
mer method effectively removes background variation unrelated to resistance and minimizes the influence of sequencing errors, which typically appear as low-abundance k-
mers and are filtered out.
This difference in methodology is illustrated by comparison with the variant filtering strategy used by Meade et al. (2020). In that study, the SNP at position chr05:49,435,040 was excluded because the resistant allele appeared in only a single read within one susceptible bulk. In contrast, the k-mer approach evaluates sequence differences across the entire dataset rather than relying on individual variant calls. True resistance-associated variants are supported by multiple overlapping k-mers, providing a more robust signal for downstream prioritisation. Moreover, despite the absence of the H1 locus from the reference genome, mapping informative k-
mers to the DM assembly still enabled positioning of candidate variants relative to existing markers, ultimately leading to the identification of a KASP assay (H1_V2) closer to the diagnostic 57R region than the previously reported marker. Because the identification of informative k-mers is reference-free, the resulting sequence signals can subsequently be interpreted against any genome assembly of interest. In practice, the same k-mers could be mapped either to the DM reference genome used for marker development, where the 57R marker was originally positioned, or to a de novo assembly of the H1 resistance haplotype, without the need to repeat reference-specific variant calling.
The resulting improvement in marker performance is modest but meaningful. Across multiple years of breeding material, H1_V2 reduced the number of false negatives relative to the H1_V1 marker while maintaining comparable specificity. Given the scale at which such markers are deployed in breeding programmes, even incremental gains can translate into substantial practical benefits by lowering the misclassification rate of resistant genotypes.
The availability of a defined set of H1-specific k-mers also enables iterative improvement of diagnostic markers as new sequencing or assembly data become available. For example, the pedigree of the 21 false negatives and 12 false positives identified here could be examined to investigate potential causes of misclassification, such as recombination between the marker and the H1 locus or the presence of other non-tuberosum introgressions. Such information could then be incorporated into additional k-mer intersection or subtraction analyses to refine the set of haplotype-associated sequences, reducing false positives or false negatives and enabling redesign of markers with improved F1 scores. In this way, CoSSA provides a practical framework for the continual refinement of diagnostic markers as additional genomic resources become available.
In summary, reanalysis of existing bulked resequencing data using CoSSA, a haplotype-specific k-mer framework, can substantially expand the pool of candidate variants available for marker development without additional sequencing or phenotyping. In this study, k-mers enriched in the resistant bulk were localised relative to the H1 interval using DM as reference genome. Although the DM assembly does not contain the H1 introgression itself, it provides a useful positional scaffold for prioritising candidate variants. The principal distinction of the k-mer approach lies not in avoiding the reference, but in the systematic recovery of haplotype-associated sequence differences prior to localisation, thereby reducing reliance on semi-manual inspection of individual variant calls. As additional haplotype-resolved assemblies and pan-genome resources become available, such frameworks will further refine localisation and prioritisation of diagnostic variants across diverse germplasm. Recent haplotype-resolved pan-genome analyses of European potato (Sun et al. 2025) indicate that ten historical cultivars (40 haplotypes) already capture roughly 85% of European haplotype diversity; continued expansion of these resources is likely to approach near-complete haplotype representation, including those present in the bulks analysed here.
Ethics and consent
Ethical approval and consent were not required.
Data availability
Underlying data
European Nucleotide Archive (ENA): Whole genome resequencing of five pools of 15 tetraploid potato cultivars. https://www.ebi.ac.uk/ena/browser/view/PRJEB31308 (Meade et al. 2020).
The project contains the following underlying data:
Raw whole-genome resequencing FASTQ files for resistant and susceptible pooled potato samples used for k-mer analysis and SNP discovery. Sequencing runs ERR3417257–ERR3417261 corresponding to the pooled samples analysed in this study.
Extended data
Zenodo: Electronic supplementary materials (ESM) for k-mer analysis of publicly available resources enables rapid development of an improved KASP marker linked to the H1 resistance locus in potato
https://doi.org/10.5281/zenodo.19629845
(Vexler et al. 2026).
This project contains the following extended data:
ESM S1: Overview of k-mer data sets from the read archives used and of set operations.
ESM S2: Effect of k-mer depth thresholds on genome-wide signal and enrichment at the H1 locus.
ESM S3: Effect of k-mer depth cut-offs on signal-to-noise enrichment at the H1 locus.
ESM S4: Multi-year KASP marker calls and phenotypic PCN resistance data for validation panel.
ESM S5: 99 Candidate SNPs associated with H1 identified on the DM reference genome.
Data are available under the terms of the Creative Commons Attribution 4.0 International license (CC-BY 4.0).
Acknowledgements
We thank Alejandro Thérèse Navarro for his assistance with the data wrangling and visualisations in R.
References
- Bakker E, Achenbach U, Bakker J, et al.:
A high-resolution map of the H1 locus harbouring resistance to the potato cyst nematode Globodera rostochiensis.
Theor. Appl. Genet.
2004; 109(1): 146–152. PubMed Abstract
| Publisher Full Text
- Chen S, Zhou Y, Chen Y, et al.:
fastp: an ultra-fast all-in-one FASTQ preprocessor.
Bioinformatics.
2018; 34(17): i884–i890. PubMed Abstract
| Publisher Full Text
| Free Full Text
- Faust GG, Hall IM:
SAMBLASTER: fast duplicate marking and structural variant read extraction.
Bioinformatics.
2014; 30(17): 2503–2505. PubMed Abstract
| Publisher Full Text
| Free Full Text
- Finkers-Tomczak A, Bakker E, de Boer J , et al.:
Comparative sequence analysis of the potato cyst nematode resistance locus H1 reveals a major lack of co-linearity between three haplotypes in potato (Solanum tuberosum ssp.).
Theor. Appl. Genet.
2011; 122: 595–608. PubMed Abstract
| Publisher Full Text
| Free Full Text
- Kokot M, Długosz M, Deorowicz S:
KMC 3: counting and manipulating k-mer statistics.
Bioinformatics.
2017; 33(17): 2759–2761. PubMed Abstract
| Publisher Full Text
- Li H, Durbin R:
Fast and accurate short read alignment with Burrows–Wheeler transform.
Bioinformatics.
2009; 25(14): 1754–1760. PubMed Abstract
| Publisher Full Text
| Free Full Text
- Li H, Handsaker B, Wysoker A, et al.:
The Sequence Alignment/Map format and SAMtools.
Bioinformatics.
2009; 25(16): 2078–2079. Publisher Full Text
- Meade F, Byrne S, Griffin D, et al.:
Rapid development of KASP markers for disease resistance genes using pooled whole-genome resequencing.
Potato Res.
2020; 63: 57–73. Publisher Full Text
- Prodhomme C, Esselink D, Borm T, et al.:
Comparative Subsequence Sets Analysis (CoSSA) is a robust approach to identify haplotype specific SNPs; mapping and pedigree analysis of a potato wart disease resistance gene Sen3.
Plant Methods.
2019; 15(1): 60. PubMed Abstract
| Publisher Full Text
| Free Full Text
- Quinlan AR, Hall IM:
BEDTools: a flexible suite of utilities for comparing genomic features.
Bioinformatics.
2010; 26(6): 841–842. PubMed Abstract
| Publisher Full Text
| Free Full Text
- Sharma SK, Bolser D, de Boer J , et al.:
Construction of Reference Chromosome-Scale Pseudomolecules for Potato: Integrating the Potato Genome with Genetic and Physical Maps.
G3 Genes Genomes Genet.
2013; 3: 2031–2047. Publisher Full Text
- Sun H, Tusso S, Dent CI, et al.:
The phased pan-genome of tetraploid European potato.
Nature.
2025; 642(8067): 389–397. PubMed Abstract
| Publisher Full Text
| Free Full Text
- Vexler L, Byrne S, Milbourne D:
k-mer analysis of publicly available resources enables rapid development of an improved KASP marker linked to the H1 resistance locus in potato. [Data set].
Zenodo
2026. Publisher Full Text
- Xu X, Pan S, Cheng S, et al.:
Genome sequence and analysis of the tuber crop potato.
Nature.
2011; 475(7355): 189–195. Publisher Full Text







