Introduction
The rumen harbours one of the most complex microbial ecosystems studied in animal science, and understanding how this community is organised has direct implications for livestock productivity, methane mitigation, and feed efficiency.1,2 While diet is the dominant driver of rumen microbial composition, mounting evidence indicates that other factors such as host genetics, life stage, management and even protozoal community structure can independently shape bacterial and archaeal assemblages.3–5 These drivers do not operate in isolation: the same diet can select for different microbial communities depending on host breed6 and protozoal communities can structure prokaryotic composition independently of both diet and host.3 Disentangling these overlapping influences requires analytical approaches that can detect subtle, potentially nonlinear signals masked by the dominant effect of diet.
Co-occurrence network analysis has become a standard tool for exploring microbial community organisation.7,8 Correlation-based approaches such as Pearson correlation and SparCC9 detect pairwise linear associations, while precision-based approaches implemented in tools such as SPIEC-EASI10 estimate conditional dependencies (i.e. dependencies that persist after accounting for all others in the dataset) that distinguish direct from indirect associations. These include graphical lasso (GLasso) and neighbourhood selection (MB), which estimate sparse precision matrices to identify conditional dependencies.11,12 Despite these methodological differences, most approaches assume that underlying relationships are approximately linear or can be adequately represented through conditional independence framework, which may fail to detect nonlinear or context-dependent dependencies (i.e. associations present only in a subset of samples). In the rumen, many ecological interactions are inherently nonlinear: fermentation cascades create sequential dependencies, substrate competition produces threshold-driven exclusion patterns, and cross-feeding between metabolically distinct guilds generates context-dependent abundance relationships.1,2 Linear methods may miss these nonlinear relationships entirely or conflate them with other signals, producing network communities (modules, i.e. groups of densely connected taxa) that blend multiple ecological drivers rather than separating them.
To address these limitations, AI-driven strategies such as deep learning13 and consensus-based strategies such as OneNet14 have emerged. Although these can improve predictions, they typically require large sample sizes, substantial computational resources, and often sacrifice interpretability by blending outputs from heterogeneous algorithms.15 What remains lacking is a computationally tractable framework that explicitly captures nonlinear dependencies while maintaining transparency about which associations drive the resulting network structure.
To address this gap, we developed FANCY (Frequency And Nonlinear Correlation hYbrid), a network inference framework that explicitly captures nonlinear and context-dependent dependencies. FANCY combines two complementary measures across bootstrap replicates: distance correlation (dCor), which detects any form of statistical dependence including nonlinear and nonmonotonic relationships,16 and k-nearest neighbour mutual information with maximum relevance filtering (kNN-MI MRNET), which identifies reproducible associations while reducing redundancy by removing edges whose mutual information is already explained by other edges17,18 (Figure 1.). These measures are integrated through a multiplicative hybrid score with tuneable exponents that control the relative influence of edge reproducibility versus dependency stability, retaining only edges that score well on both dimensions (Figure 1; see Methods). This design is particularly suited to high-dimensional, compositional microbiome data, where over-dispersion and zero-inflation can obscure linear signals.19
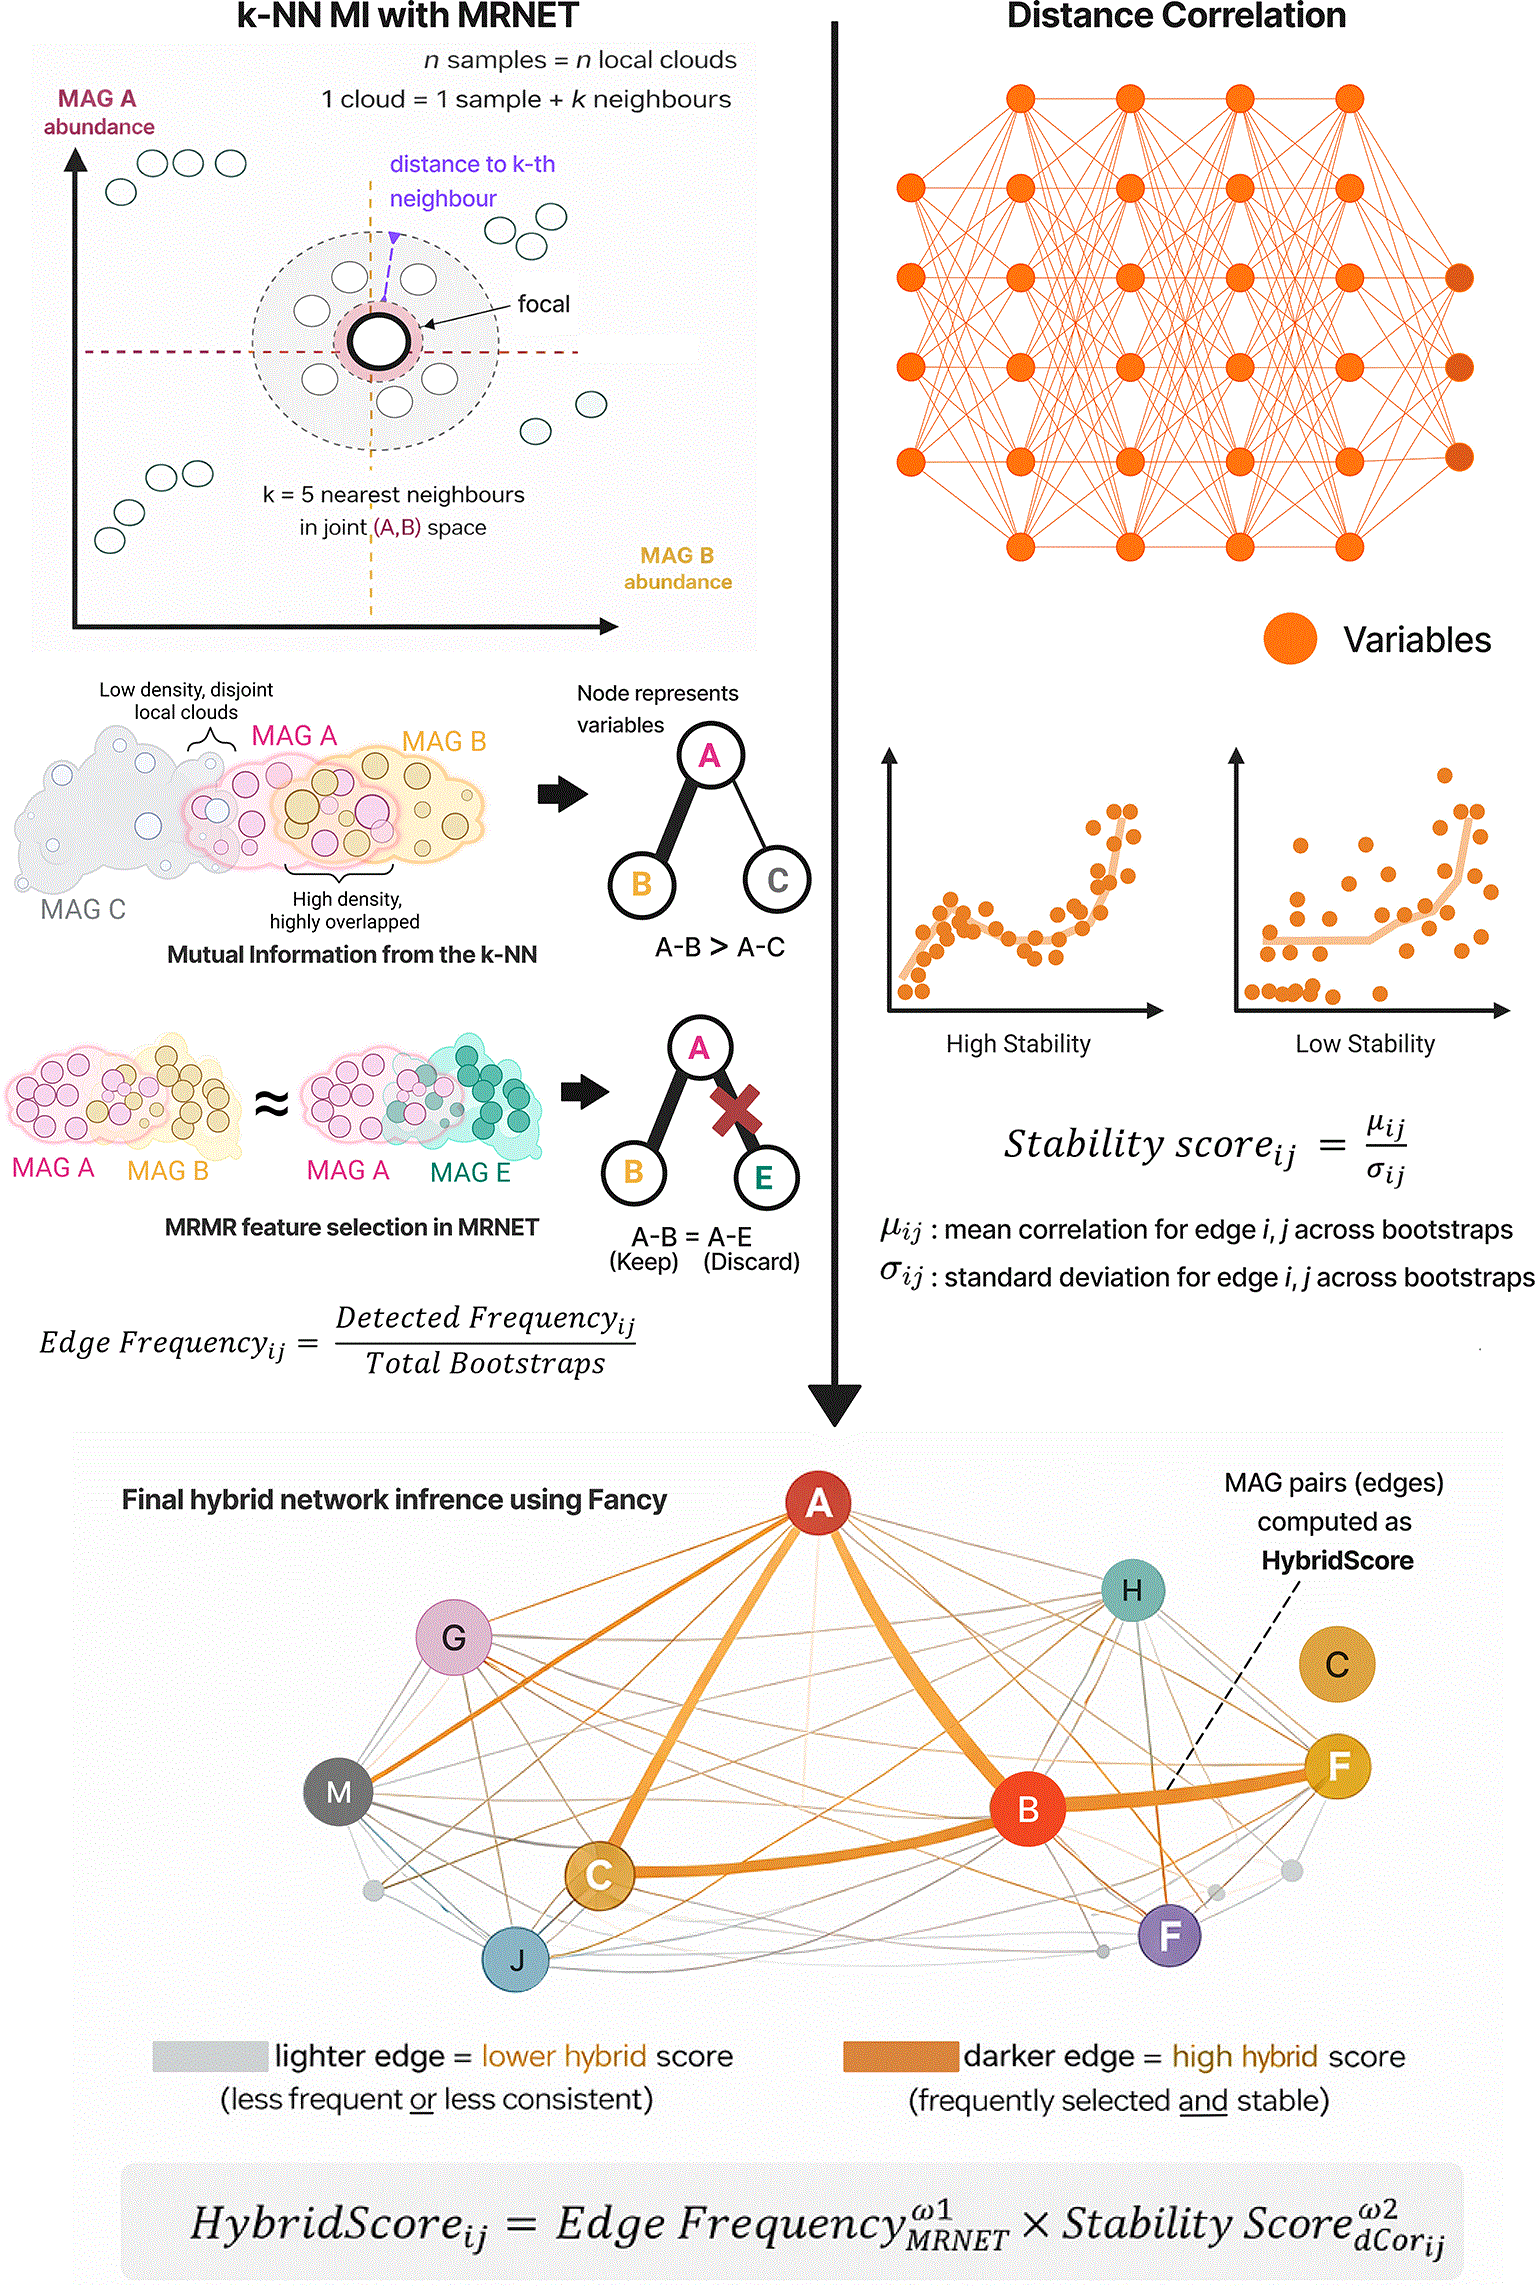
Figure 1. Overview of the FANCY hybrid network inference framework.
For each bootstrap resample of the abundance matrix, two complementary measures of association between MAGs are computed and subsequently combined into a hybrid score. Left: Pairwise dependencies between MAG abundances are estimated using k-nearest neighbour mutual information (kNN-MI), where local neighbourhood structure in the joint (A,B) space is used to quantify shared information between MAG pairs. These mutual information values are provided to MRNET, which applies a maximum relevance–minimum redundancy (MRMR) criterion to select informative, non-redundant edges. Repeating this procedure across bootstrap resamples yields an edge frequency, defined as the proportion of runs in which a given MAG pair is selected, reflecting reproducibility. Right: Distance correlation (dCor) is computed for all MAG pairs within each bootstrap resample to capture both linear and nonlinear dependencies. Across bootstraps, a stability score is calculated as the ratio of the mean to the standard deviation of dCor values, quantifying the consistency of each association. Bottom: The final network is constructed by combining edge frequency and dCor stability into a hybrid score for each MAG pair. Edge colour intensity represent the magnitude of the hybrid score, with stronger, darker edges indicating associations that are both frequently selected by MRNET and stable across resamples. Edges with low hybrid scores are down-weighted or excluded from the final network.
Here, we applied FANCY to a rumen metagenome-assembled genome (MAG) dataset and compared the results to four established network inference methods. We found that FANCY resolved two independent biological axes that other methods entangled: protozoal community structure, hereafter referred to as Rumen Community Type (RCT; Kobel et al.3) and host genetics.
Results
Residual community structure after diet removal
We analysed 321 beef steers from four breeds (Aberdeen Angus, n = 101; Luing, n = 92; Charolais, n = 68; Limousin, n = 60) fed either a forage-based or concentrate-based diet, with individual methane emissions measured by respiration chamber (Figure 2A). Metagenomic sequencing yielded relative abundances for 2,178 MAGs after filtering for presence in at least 50 samples, which were centred log-ratio (CLR) transformed to address compositionality.20
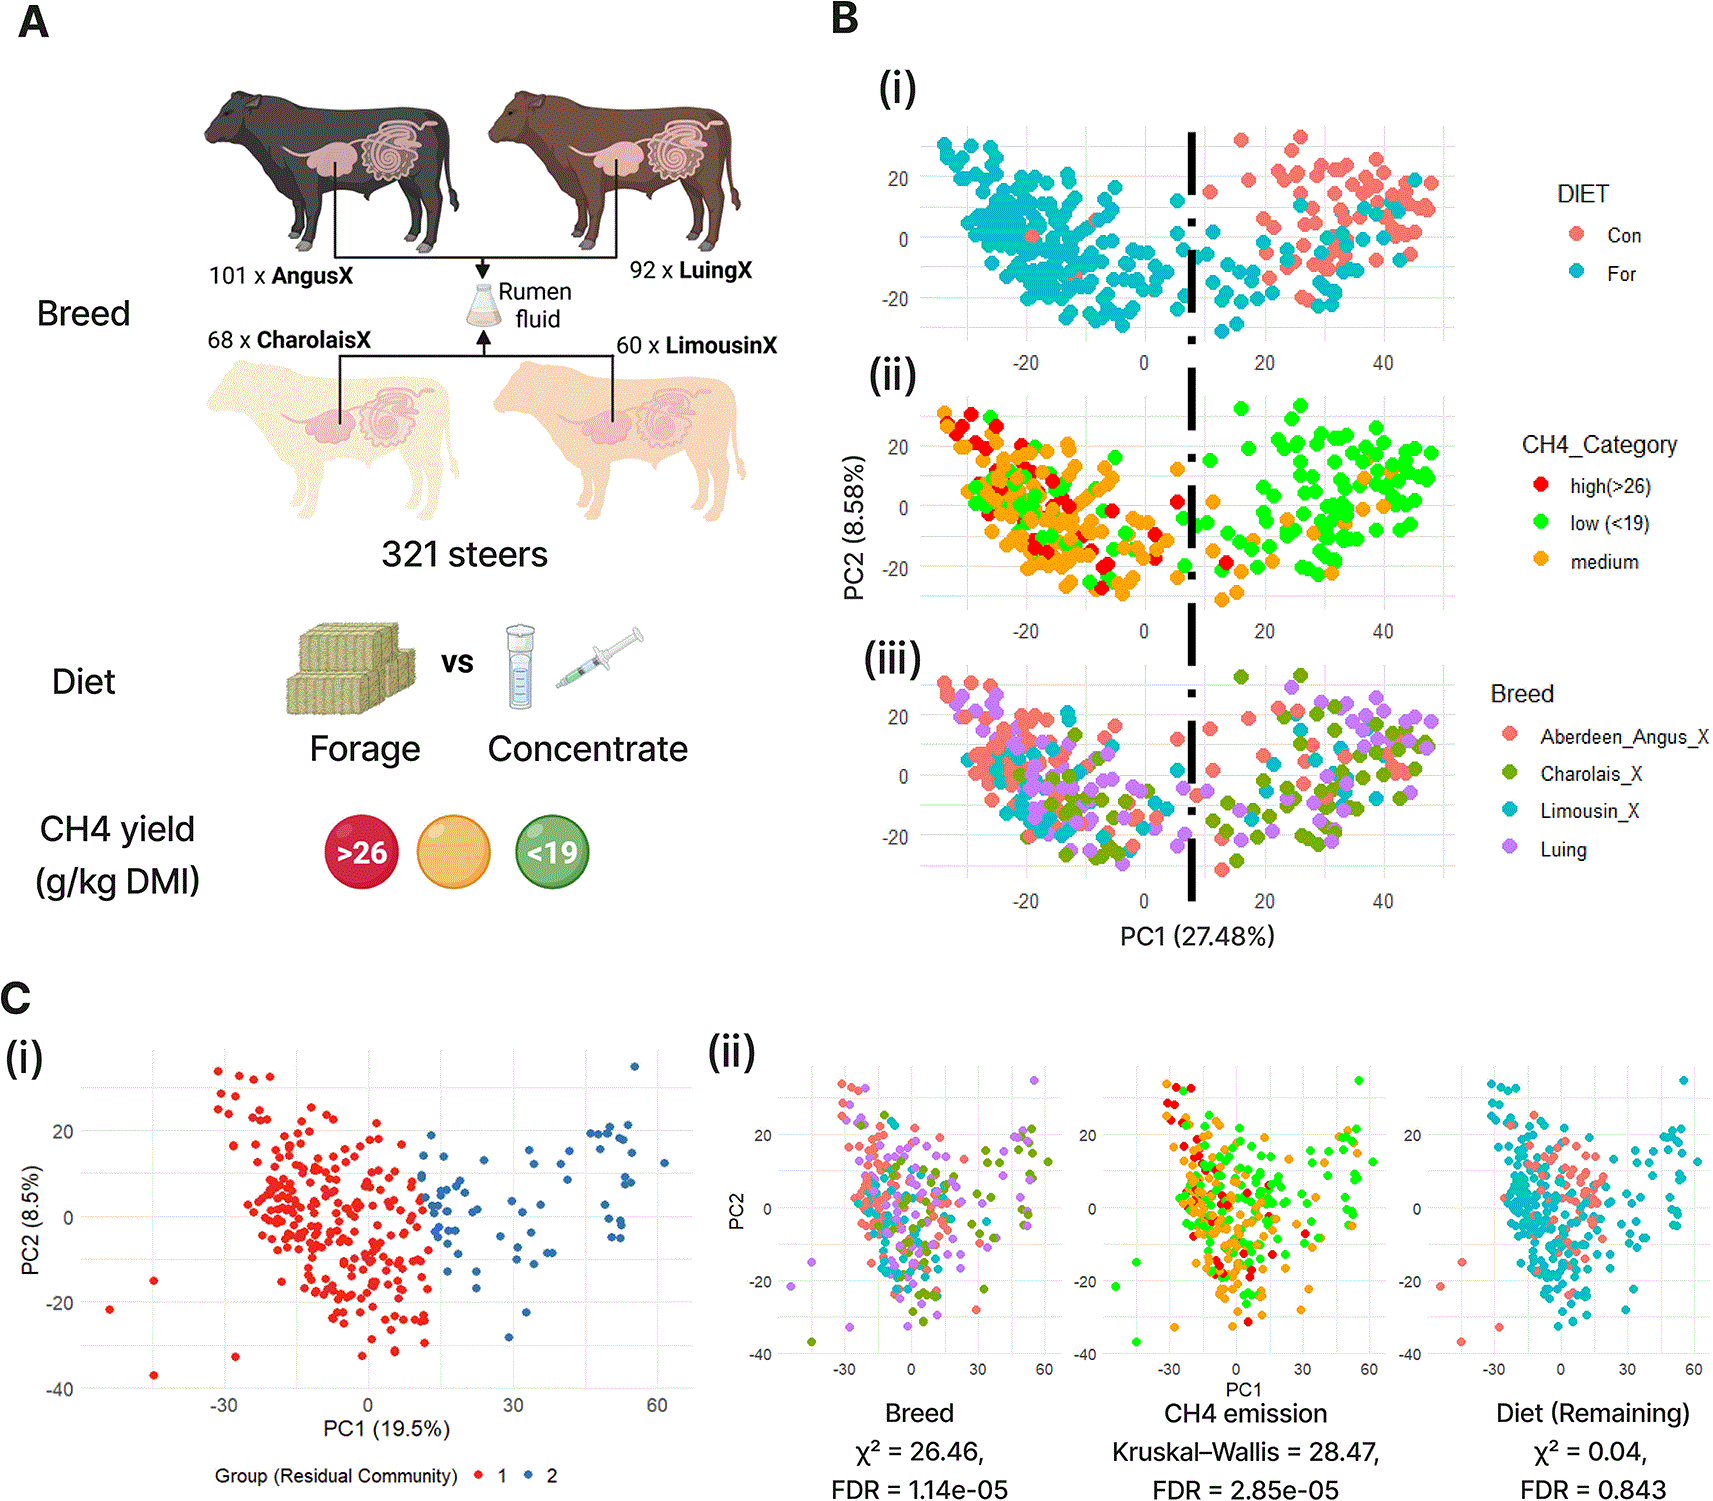
Figure 2. Experimental design and residual community structure.
(A) Schematic of the experimental system showing steer breeds, diet groups, and methane emission measurement. (B) PCA on MAG abundances showing diet-driven separation along PC1 (27.5% variance). (C) (i) PCA on diet-residualised abundances revealing Residual Community structure (PC1: 19.5%). Samples were partitioned by k-means clustering, k = 2 was selected to capture the dominant binary structure observed in the residual PCA space; clustering results were subsequently evaluated against independent RCT assignments for validation. (ii) Residual Community was significantly associated with breed and methane emissions but not with diet.
Principal component analysis (PCA) of MAG abundances showed that diet dominated variation along PC1 (27.5% of variance; Figure 2B), partially separating forage- and concentrate-fed animals. To isolate non-diet structure, we regressed out diet effects and repeated PCA on the residual matrix. The first two residual principal components explained 19.5% and 8.5% of remaining variation, respectively (Figure 2C). We partitioned samples into two groups by k-means clustering using PC1 and PC2 (Figure 2C). These groups were termed “Residual Community”, which were significantly associated with breed (FDR = 1.14 × 10⁻⁵) and methane emission category (FDR = 2.85 × 10⁻⁷) but not with diet (FDR = 0.843), confirming that the regression effectively removed diet-driven variation while preserving biologically relevant structure. No strong multicollinearity was detected between predictors, with all variance inflation factors below 1.8 (Figure S1).
FANCY captures nonlinear associations missed by linear methods
To evaluate whether FANCY captures associations missed by established methods, we compared five network inference approaches differing in the types of dependencies they detect (
Table 1): Pearson correlation, SparCC,9 Graphical Lasso (GLasso11;), Meinshausen–Bühlmann neighbourhood selection (MB12;), and our hybrid approach FANCY (Figure 1; details see Methods).
Table 1. Comparison of network inference approaches.
| Method | Dependency type | Compositionality | Nonlinear sensitivity | Edge selection |
|---|
| Pearson | Pairwise linear | CLR (pre-transform) | None | Threshold on r |
| SparCC9 | Pairwise linear | Log-ratio
| None | Threshold on ρ |
| Graphical Lasso (GLasso)11 | Conditional linear | Precision matrix | None | L1 regularisation |
| Meinshausen–Bühlmann (MB)12 | Conditional linear | Regression | None | L1 regularisation |
| FANCY (this study) | Pairwise hybrid | CLR (pre-transform) | dCor | Hybrid score |
At matched edge density (top 10%; 237,075 edges), FANCY shared 72% of its edges with the two correlation-based methods (Figure 3). This comparison was restricted to FANCY, Pearson, and SparCC because these three methods could be evaluated at equal density, whereas precision-based methods produce sparser networks through internal regularisation (GLasso: 51,310 edges; MB: 39,076 edges). The large overlap confirms that FANCY reliably detects strong linear associations captured by existing tools. However, FANCY also contributed 13% of edges (30,928) not recovered by either Pearson or SparCC. Visual inspection of these FANCY-unique edges revealed nonmonotonic and threshold-like dependency structures inconsistent with linear approximations (Figure 3). Edges shared by Pearson and SparCC but absent from FANCY were weaker linear associations that fell below FANCY’s hybrid score threshold.
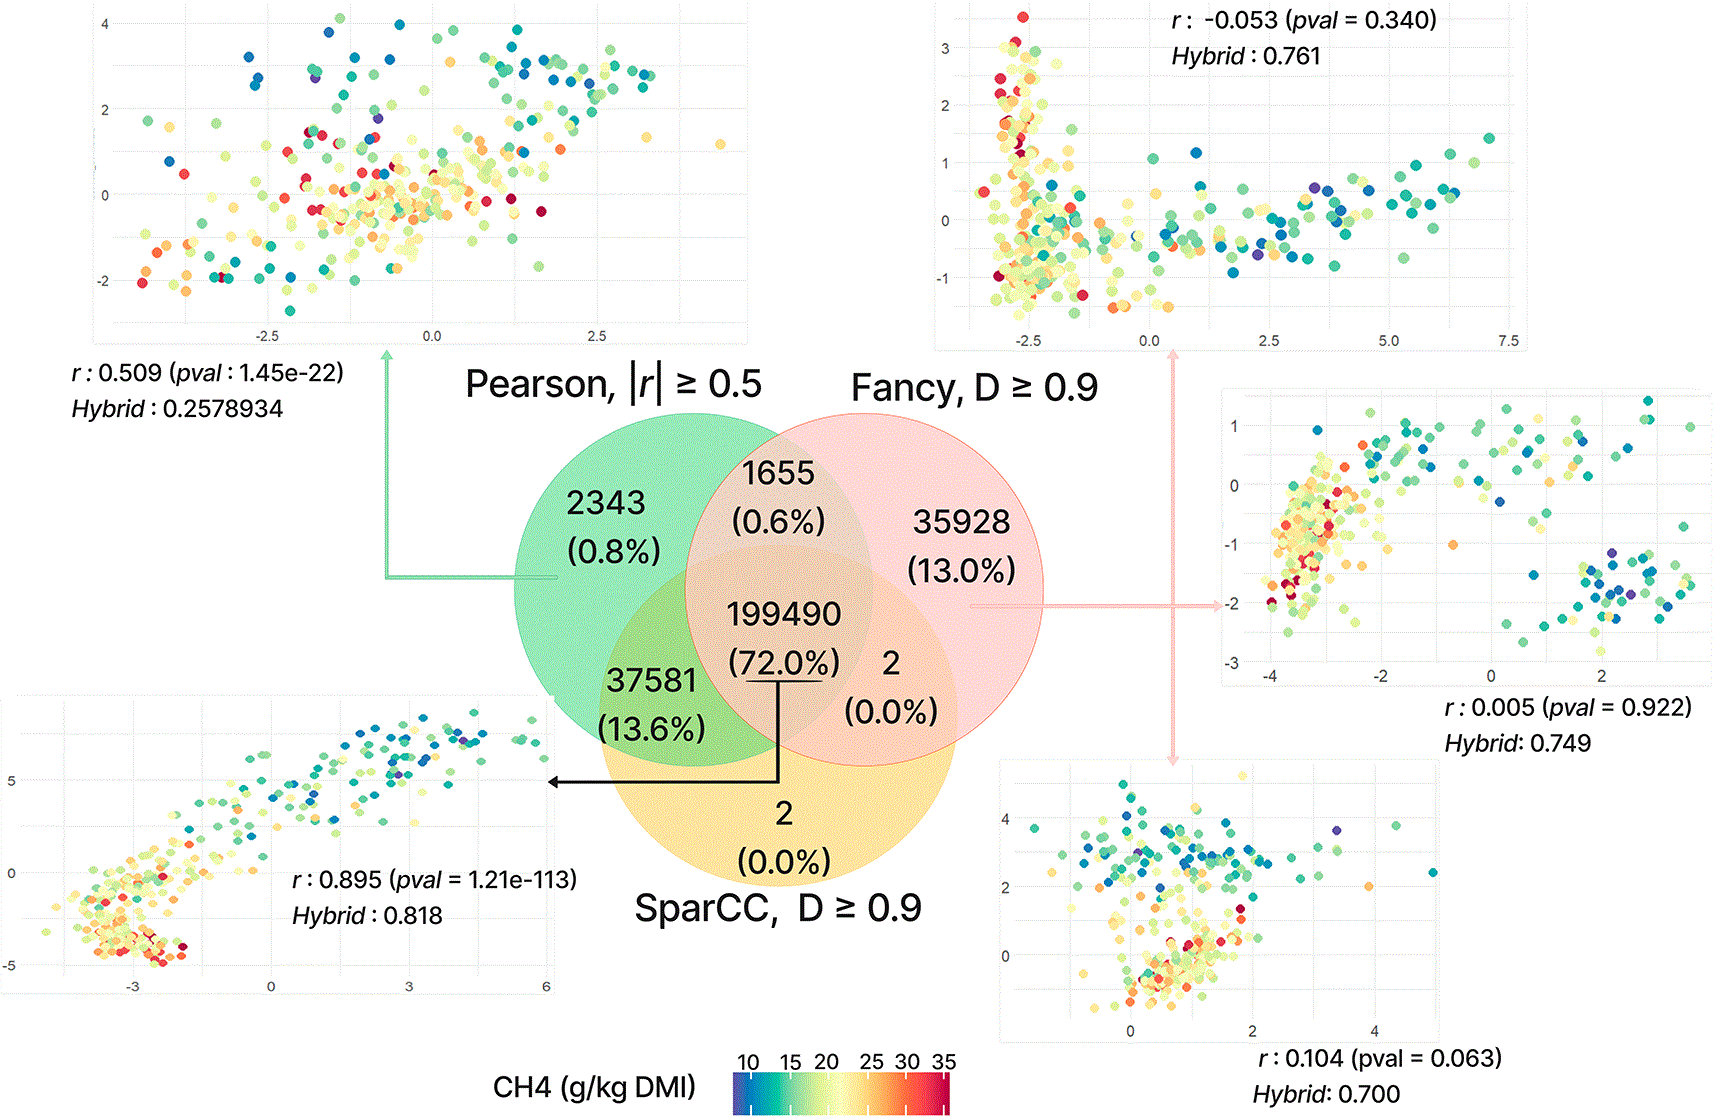
Figure 3. FANCY recovers nonlinear associations missed by linear methods.
(Centre) Venn diagram showing overlap of inferred edges between Pearson (|r| ≥ 0.5), FANCY and SparCC (D ≥ 0.9) at matched density (top 10%; 237,075 edges). (Outer panels) Each scatterplot shows CLR-transformed abundances of a representative MAG pair across 321 samples (each point is one sample; colour indicates methane emission level). Arrows link regions of the Venn diagram to example MAG pairs. The bottom-left
shows an edge detected by all methods (shared region) while the top-left
panel shows an edge detected only by Pearson; both showing strong monotonic relationships. Right panels: edges unique to FANCY (pink region), illustrating examples for threshold or context-dependent interactions (associations whose strength or direction changes depending on host phenotype or environmental condition) that are not captured by Pearson or SparCC. For each example, Pearson correlation (r) and the FANCY hybrid score are reported. These examples highlight that FANCY identifies stable, nonlinear associations even when linear correlation is weak or absent.
At 1% density, where all five methods could be compared at equal edge count, FANCY contributed 18% unique edges versus less than 1% for Pearson and SparCC (Figure S2). GLasso and MB contributed higher fractions of unique edges (31% and 40%), reflecting their use of conditional independence to identify direct associations after accounting for other variables. In contrast, FANCY’s unique edges capture nonlinear dependencies that these conditional approaches are not designed to detect.
FANCY modules separate distinct ecological drivers
To determine whether FANCY’s nonlinear edges organise taxa into ecologically interpretable groups, we identified modules using GLay community clustering. Because network interpretation depends on edge density selection, we evaluated module robustness across density thresholds using an edge-perturbation bootstrap sweep (Figure S19A & C; Supplementary Dataset 3). Across cutoffs between 5 and 24% of possible edges, the same three dominant modules (≥100 MAGs each) remained detectable, and partition similarity peaked near 10% density (Figure S20A). We therefore focused on the three dominant modules (Figure 4A).
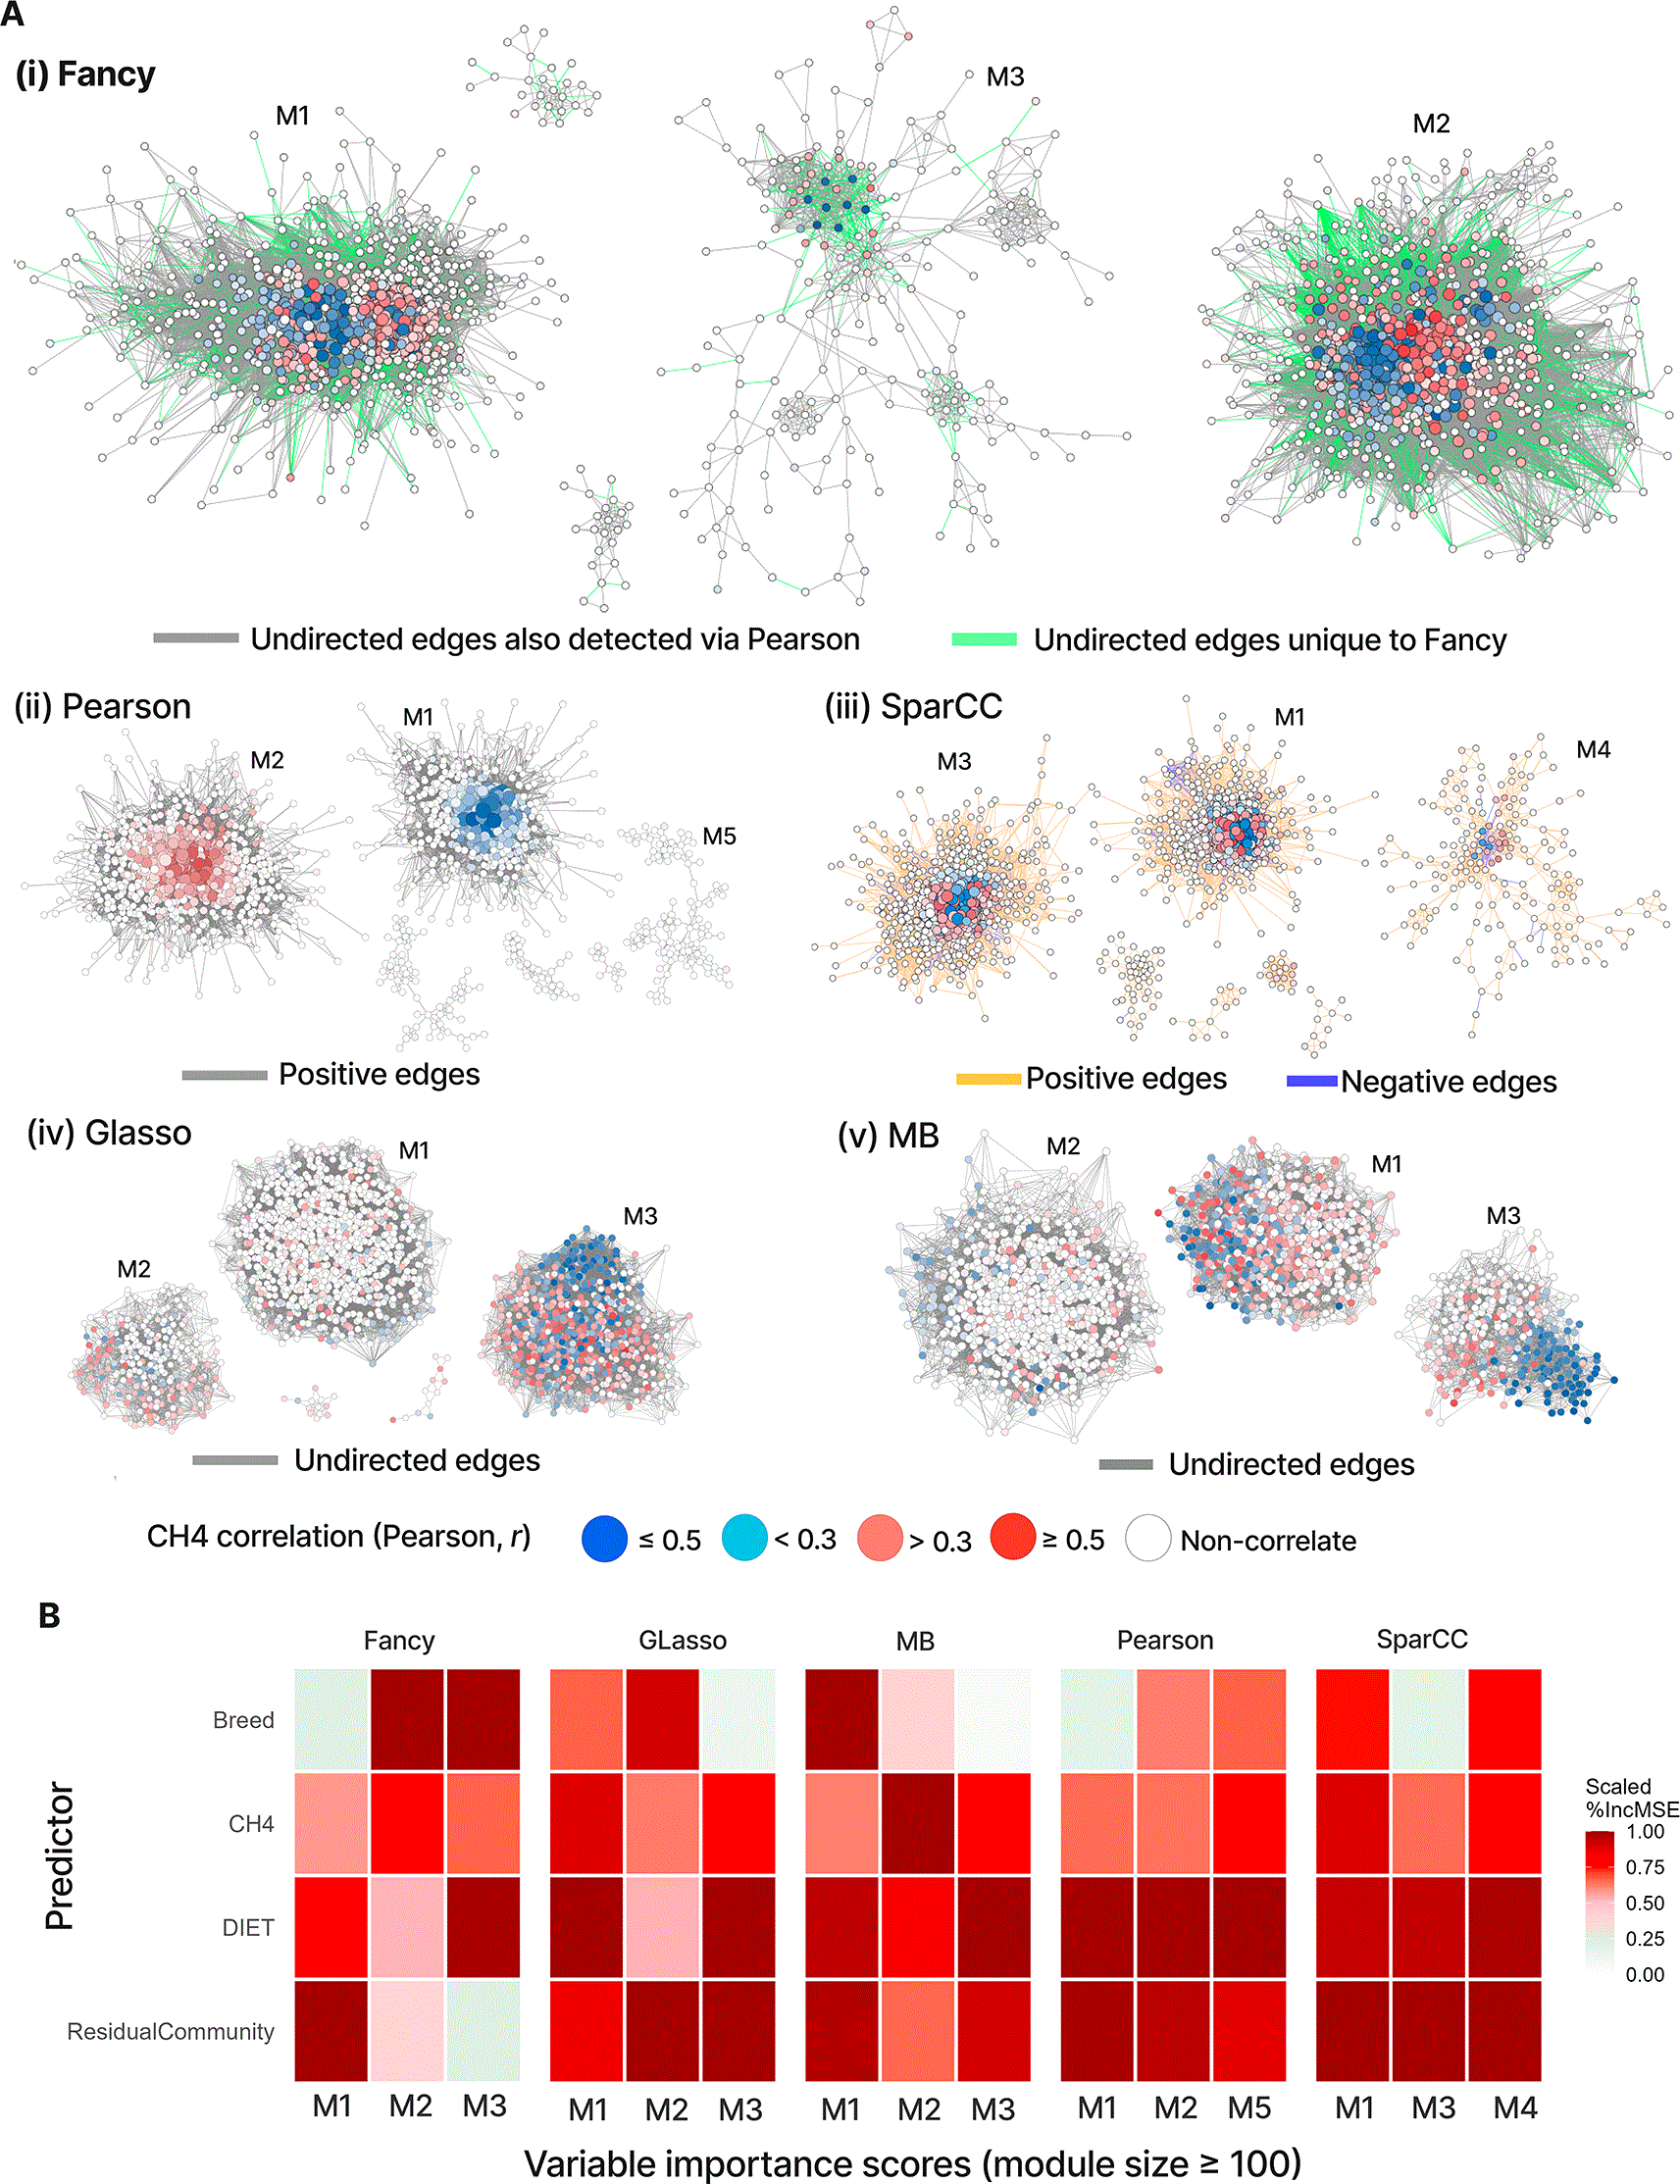
Figure 4. (A) GLay community clustering of networks inferred by Fancy, Pearson, SparCC, and SPIEC-EASI (GLasso and MB).
Node size reflects connectivity (degree), and node colour indicates Pearson correlation of each MAG with methane emission. (B) FANCY modules are driven by distinct ecological predictors. Random Forest predictor importance (%IncMSE) for dominant modules (≥100 MAGs). Colour intensity indicates scaled importance. Show clear separation: Module 1 (M1) driven by Residual Community (the diet-independent microbiome axis defined by k-means clustering on residualised PCA), Module 2 (M2) by Breed, Module 3 (M3) jointly by Diet and Breed. In contrast, other methods show overlapping importance profiles. Modules were either co-dominated by diet (Pearson, GLasso), dominated by Residual Community across multiple modules (SparCC), or failed to capture the Residual Community axis (MB), indicating limited separation between ecological drivers.
Their ecological relevance was evaluated using Random Forest (RF) regression with 5 × 5 cross-validation, predicting module-level mean relative abundance from four metadata variables: diet, breed, methane emissions (CH4), and Residual Community. This revealed a pattern that was unique to FANCY (Figure 4B): each dominant module was best explained by a different driver. Module 1 (883 MAGs) by Residual Community (26.0% IncMSE), Module 2 (831 MAGs) by breed (19.6% IncMSE), and Module 3 (209 MAGs) jointly by diet and breed (17.8% and 17.9% IncMSE, respectively). In contrast, modules from other methods showed entangled driver profiles: Pearson and SparCC, and GLasso modules were co-dominated by diet and Residual Community with no module dominated by breed. This separation of breed-associated structure into a distinct module was unique to FANCY.
Module 1 captures protozoal community type structure
We next investigated the ecological meaning of each module’s dominant predictor, beginning with Module 1 (883 MAGs), which was best predicted by Residual Community (the diet-independent microbiome axis; Figure 2C). Its internal structure was bipolar: multilevel pattern analysis revealed taxa separating into two opposing poles, one enriched in Bacillota (Anaerobutyricum, Limivicinus, Limimorpha, RUG762) and the other dominated by populations affiliated to the Prevotella, Succiniclasticum, Ruminococcus, and Methanomethylophilus (|r| > 0.23, p < 0.001; Figure 6 Ci). These pole genera corresponded directly to the RCT taxa described by Kobel et al.,3 who identified two stable rumen community types (RCT-A and RCT-B) using Dirichlet Multinomial Mixture clustering on 16S rRNA gene data: genera enriched at one pole (Anaerobutyricum, Limivicinus) correspond to RCT-A-associated taxa, while those at the opposing pole (Prevotella, Succiniclasticum, Methanomethylophilus) correspond to RCT-B-associated taxa (Figure 6 Ci), aligning with the functional profiles reported by Kobel et al.3 Critically, Kobel et al.3 showed that RCTs are linked to protozoal community patterns that structure the wider prokaryotic community, independent of host breed or phenotype. Consistent with this, in the animals overlapping our dataset, RCT distribution did not differ by breed and RCT-associated (Aberdeen Angus 8A/4B, Luing 7A/5B; Fisher p = 1.0) mirroring the absence of a breed–RCT association in their full cohort (Fisher p = 0.81, n = 71; Kobel et al.3; Figure S8).
To determine whether the Residual Community signal identified by RF (26% IncMSE) in Module 1 corresponds to the RCT framework, we obtained RCT assignments for 24 animals (15 RCT-A, 9 RCT-B) overlapping with our dataset. These RCT assignments explained 19% of microbiome variance across the 24-animal subset (PERMANOVA on Aitchison distances, p = 0.0001; Table S4). We then tested all 2,178 MAGs for differential abundance between RCT groups (Figure S4A). 636 (29%) differed significantly (Wilcoxon p < 0.05, CLR values averaged per animal), 5.8 times the number expected by chance alone. Of the 347 MAGs whose abundance was higher in RCT-A animals, 214 were over-represented in Module 1 (fold = 1.52, Fisher p = 5.6 x
; Figure S4B). While at least one module from every other tested network inference method also contained RCT-associated MAGs (Supplementary Dataset 1), only FANCY isolated the RCT axis as an independent module.
Module 2 captures host-genetics-associated community structure
Module 2 (831 MAGs) was uniquely explained by breed (19.6% IncMSE), a signal not detected by any other method. It spanned multiple phyla including Bacteroidota, Bacillota, Fibrobacterota, and Methanobacteriota. Module 2’s mean relative abundance differed significantly across breeds (Kruskal–Wallis p = 3.4 × 10⁻⁶; Figure 5B), with Limousin showing the highest abundance.
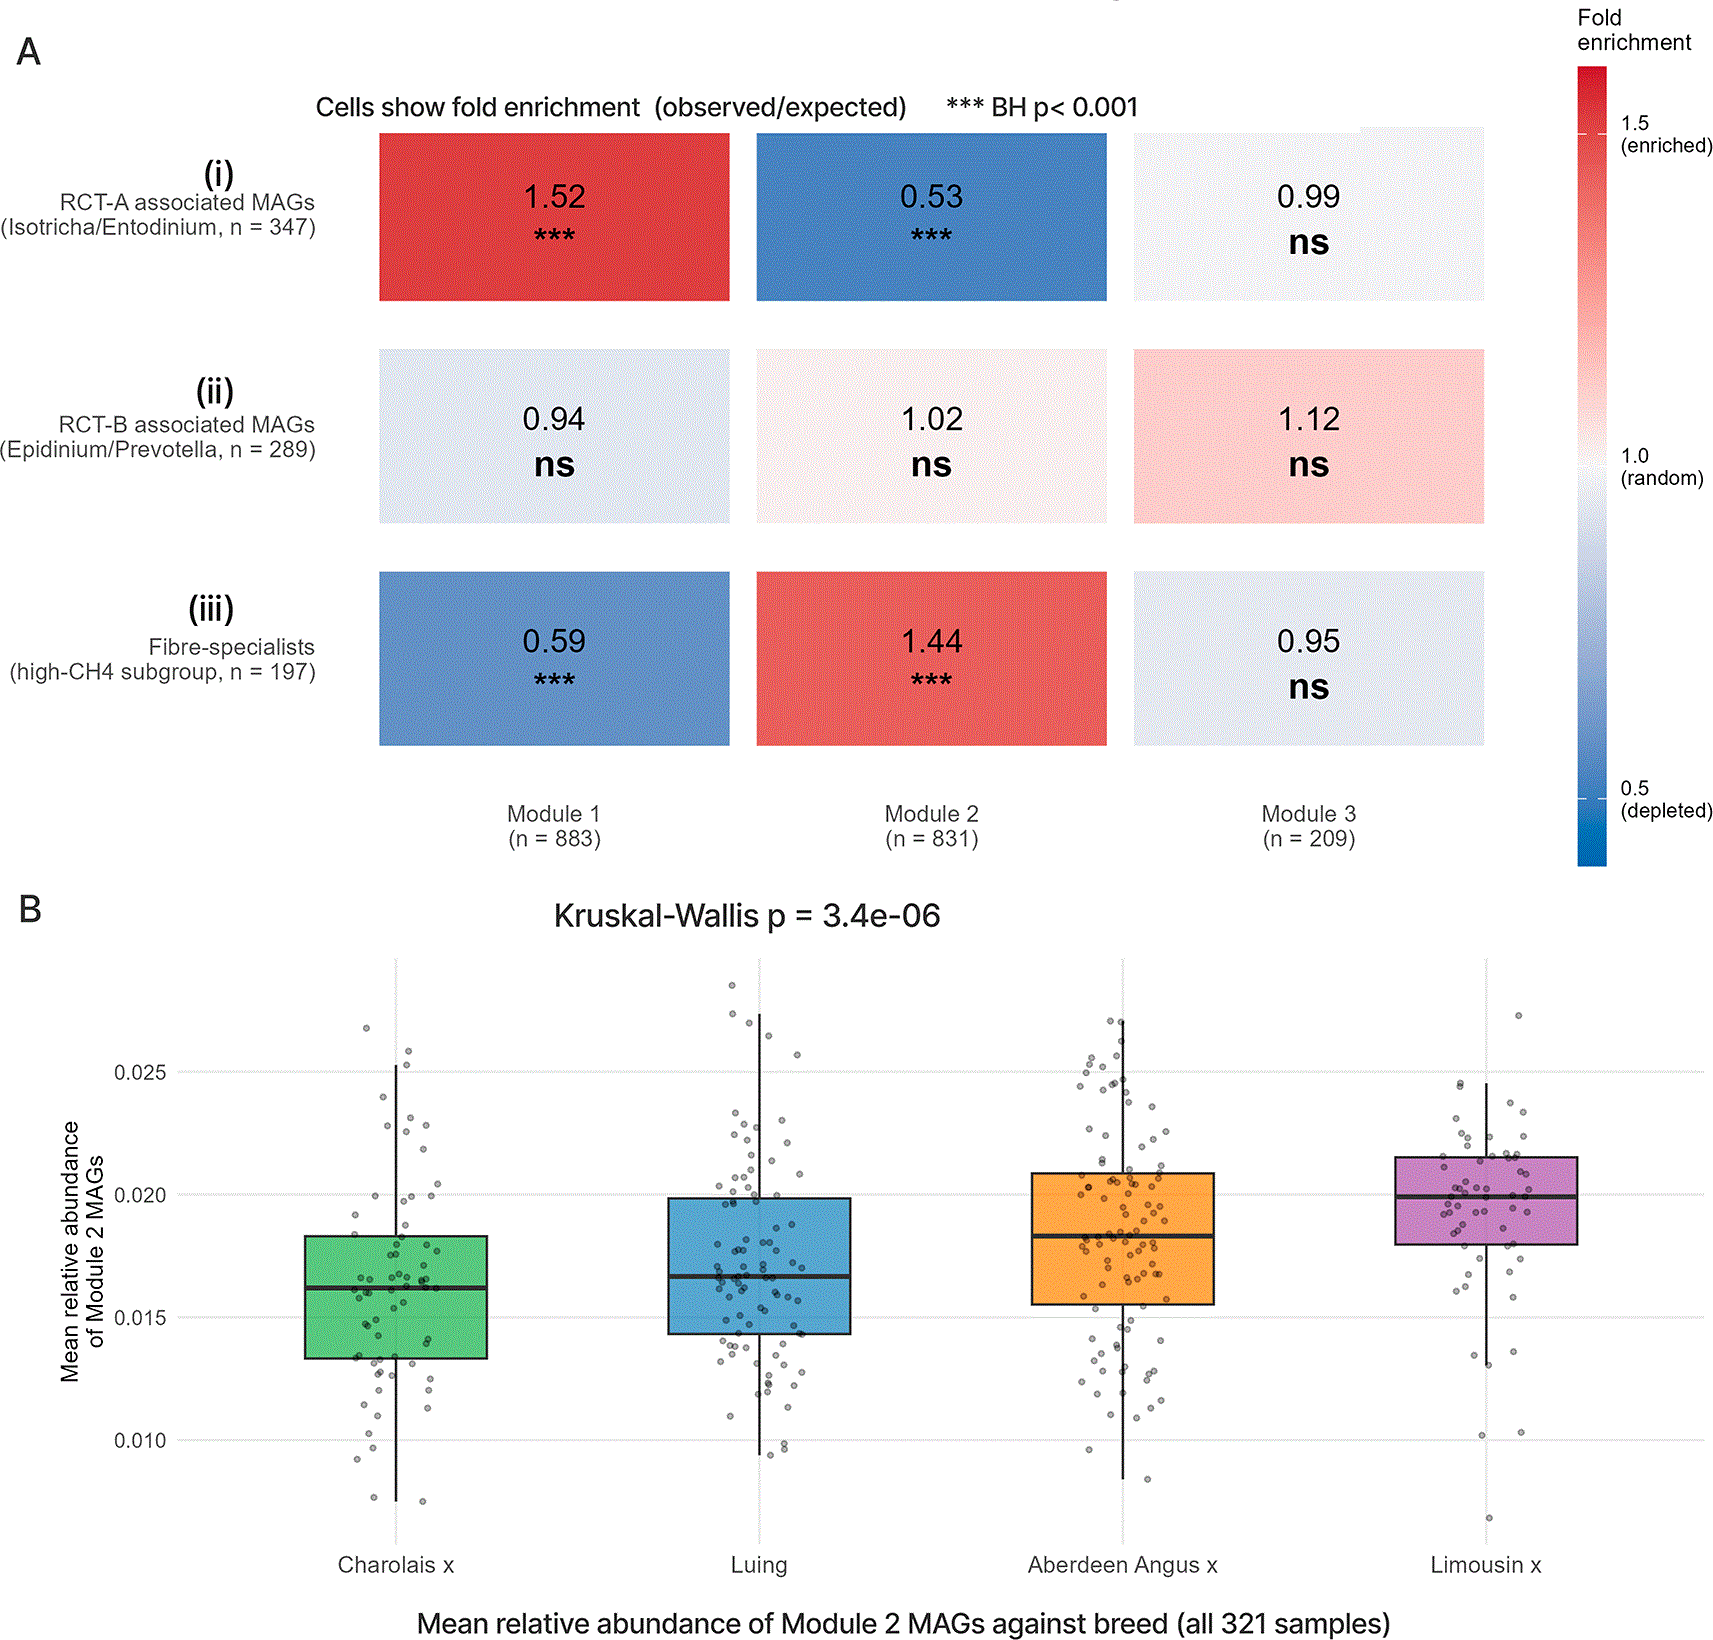
Figure 5. Validation of two independent biological axes.
(A) Enrichment heatmap showing overlap between three biologically defined MAG sets and three dominant FANCY modules. Set definitions: (i-ii) MAGs significantly enriched in RCT-A animals (n = 347) and (ii) RCT-B animals (n = 289), both from animal-level Wilcoxon (CLR averaged per animal across 15 RCT-A and 9 RCT-B animals.3 (iii) MAGs significantly enriched in the seven high-CH4 outlier steers from Trial 2011 versus the remaining 56 animals (n = 197, Wilcoxon p < 0.05 after regressing out diet effects; Figures S5–S721; these are labelled “Fibre-specialists” because the set is dominated by Fibrobacterota, Verrucomicrobiota and Spirochaetota MAGs. Cells show fold enrichment (observed/expected); colour scale from blue (depleted) through white (random) to red (enriched). *** BH-adjusted p < 0.001. RCT-A MAGs converge on Module 1; fibre-specialists converge on Module 2, confirming that each biological axis maps onto a different module. (B) Mean relative abundance of Module 2 MAGs across four cattle breeds (all 321 samples); Module 2 abundance differs significantly across breeds (Kruskal–Wallis p = 3.4 × 10⁻⁶).
To test whether Module 2’s breed signal corresponds to known host-genetic effects, we specifically examined the 63 steers in our dataset that came from a 2011 animal trial (Roehe et al.21). Roehe et al.21 used gene-level (KEGG) metagenomic profiling and sire progeny group analysis to demonstrate that host genetics significantly influences rumen microbial methane production. We again used regression on the 63 steers to remove the dominant diet effect. PCA on the residual abundances revealed seven forage-fed steers that separated from the remaining 56 animals (Figure S5Ai-ii
). These seven steers were distributed across five of the sire progeny groups analysed from the 2011 cohort, with abundances not differing significantly among sires (Kruskal–Wallis p = 0.90; Table S5). This pattern is consistent with the Module 2 host-genetic signal being polygenic rather than driven by a single sire lineage.5,21 These outliers were characterised by significantly higher methane emissions (mean 22.3 vs 17.1 g CH4/kg DMI, p = 0.008) (Figure S5Aiii) and a distinctive microbiome enriched in fibre-degrading taxa (Fibrobacterota, Verrucomicrobiota, Spirochaetota) with depleted Prevotella-affiliated populations (Figure S6, S7A,Bi).22 At the genome level, the 107 fibre-phyla MAGs in Module 2 encoded a median of 94 polysaccharide-degrading EC hits per genome, 2.4× more than the 23 fibre-phyla MAGs assigned to other modules (median 33; Hodges–Lehmann difference 56, 95% CI 36–73; Wilcoxon p = 2.3 × 10⁻⁷; Figure S7Bii), indicating that the Module 2 fibre-degrading signal is genome-encoded and module-specific.
Overall, MAGs enriched in these seven outlier steers were significantly over-represented in Module 2 (fold = 1.44; Fisher p = 7.1 × 10⁻⁷; Figure 5Aiii), indicating that Module 2 captures a reproducible fibre-associated ecological structure and consistent with the host-genetic methane effects reported by Roehe et al.21
Module 3 links metabolic specialisation to the methanogenesis pathway
To assess whether FANCY modules correspond to functionally distinct communities, we compared their metabolic capacity indices (MCI; a genome-level measure of encoded metabolic potential; see Methods). Average MCI differed significantly across modules (Kruskal–Wallis p =
; Figure 6B). Module 3 showed the lowest mean MCI (0.55) suggesting a comparatively higher number of populations that could be considered as metabolic “specialists”. However, interestingly Module 3 also returned the widest MCI range (0.103–0.965) (Figure S9,
Table S6), suggesting the module spans metabolically specialised populations such as archaeal methanogens but also fermentative generalists.
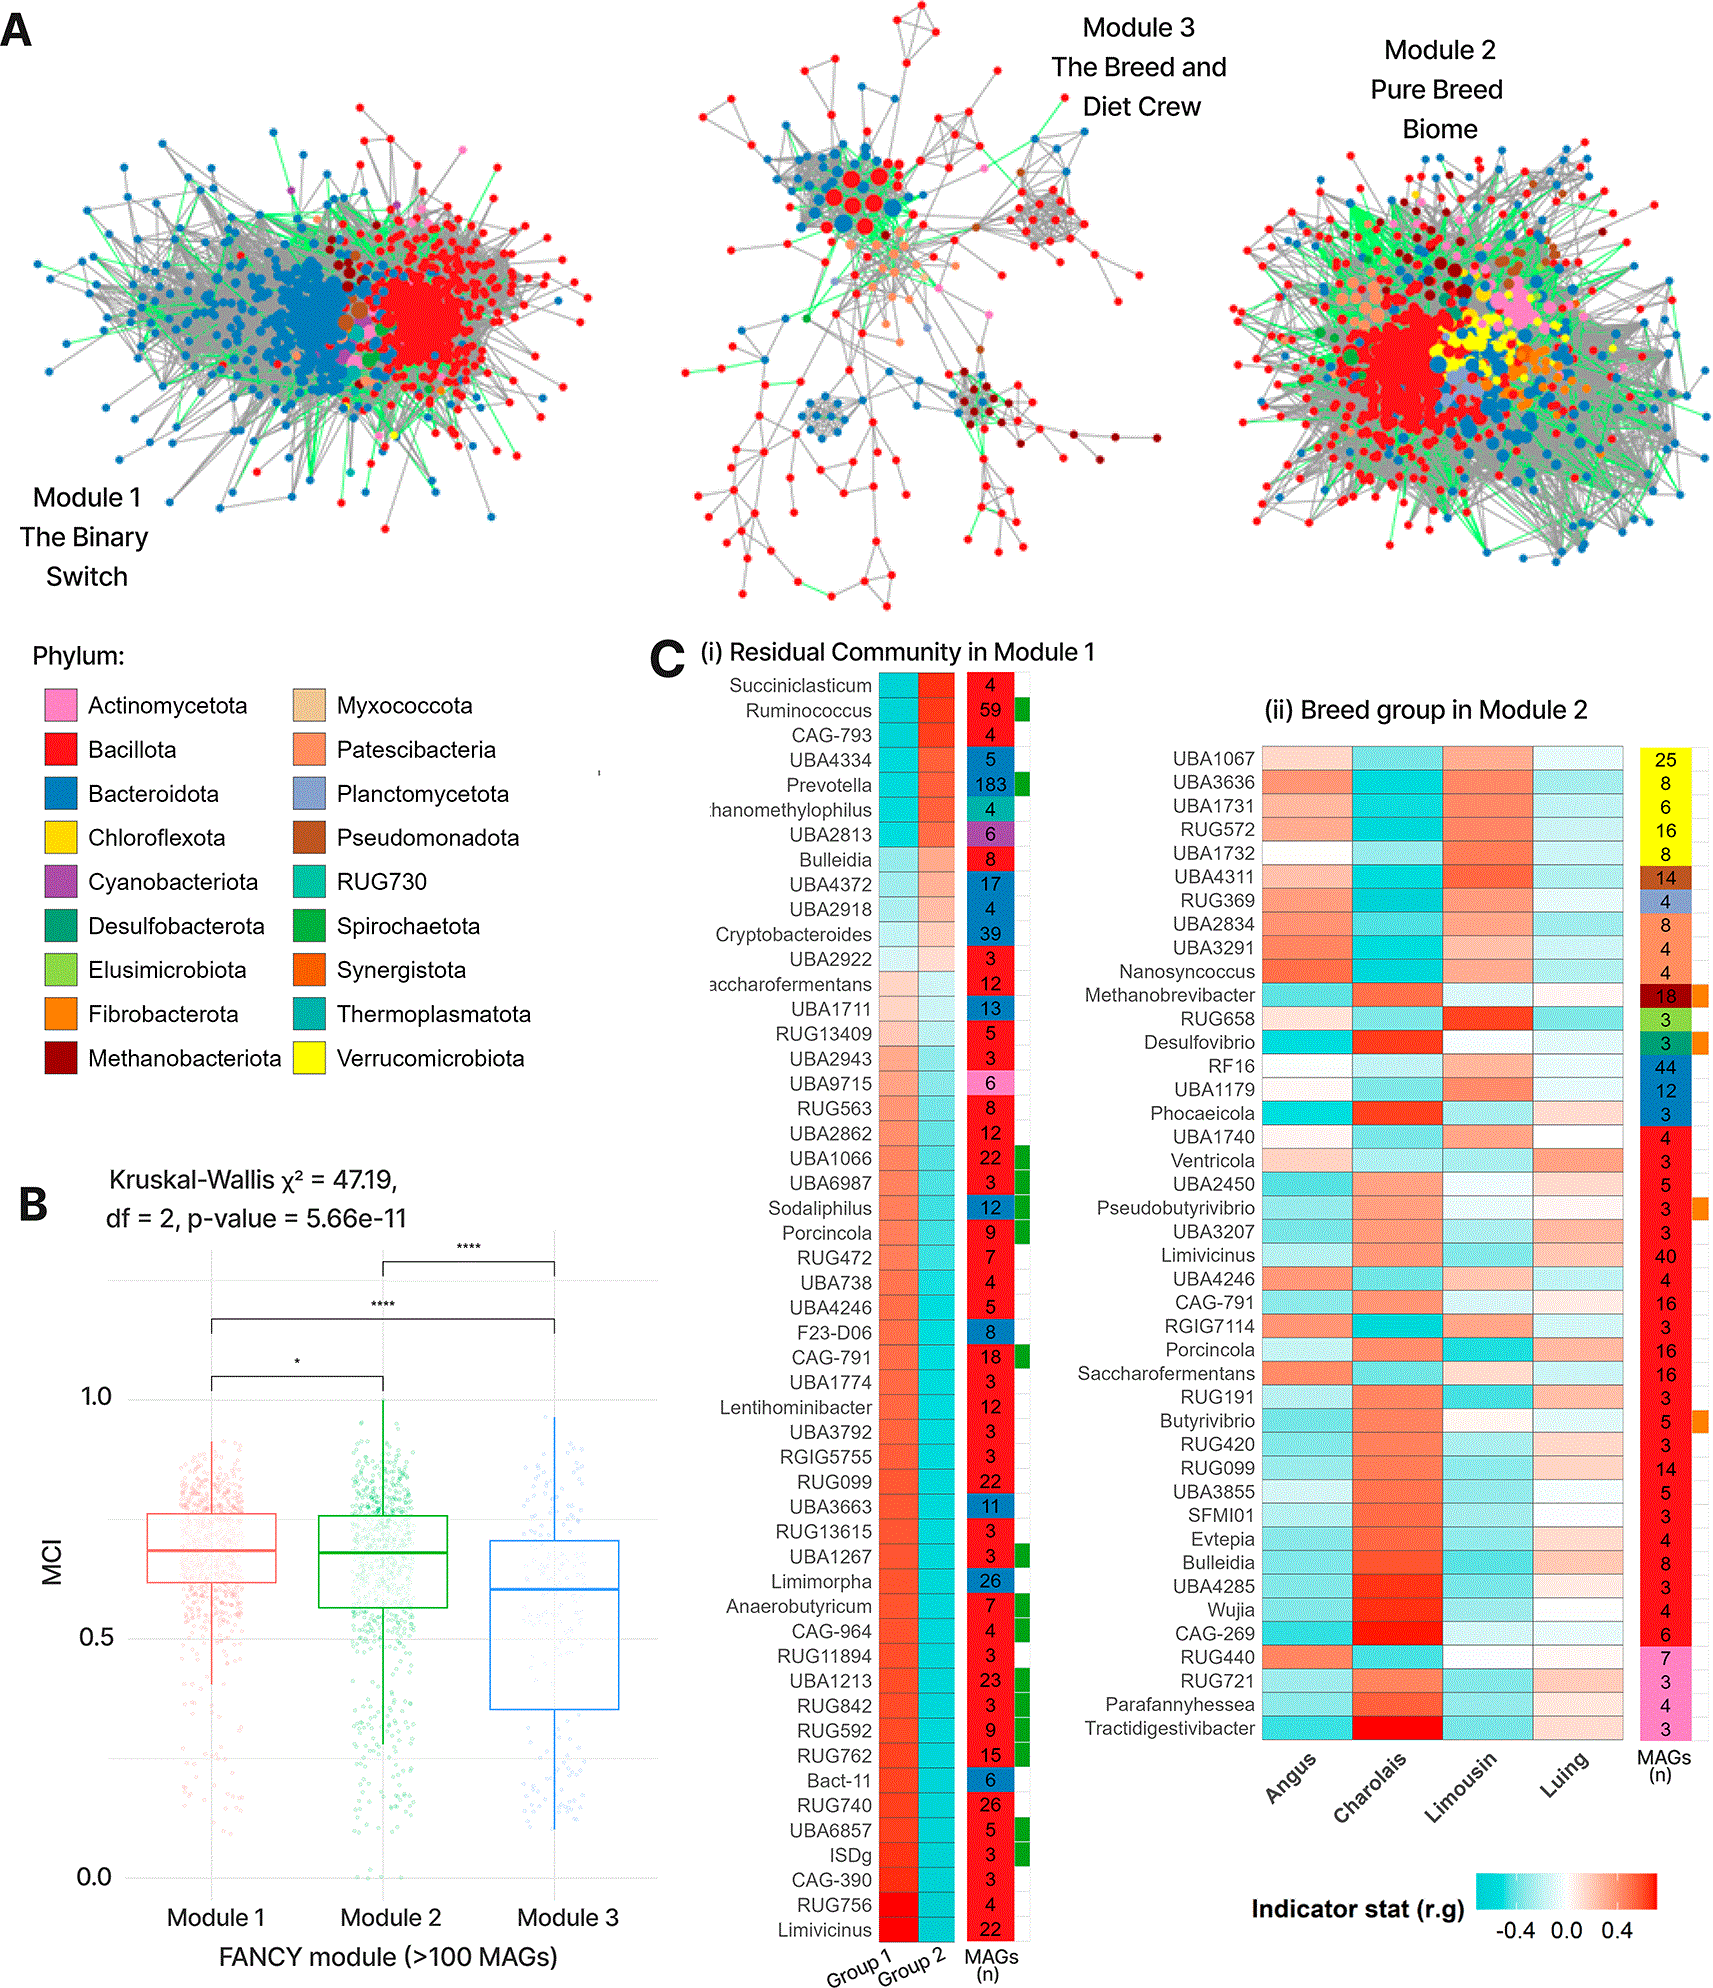
Figure 6. (A) Co-abundance network of 2,178 MAGs coloured by phylum.
The three largest FANCY modules are shown separately and labelled according to their dominant host-associated signal identified by Random Forest analyses: Module 1, “The Binary Switch”; Module 2, “Pure Breed Biome”; and Module 3, “The Breed and Diet Crew.” Although Modules 1 and 2 are both large and densely connected, their biological distinction is revealed by differences in metabolic capacity and indicator taxa rather than by gross network structure alone. (B) Distribution of mean metabolic capacity index (MCI) across modules containing more than 100 MAGs. Boxes show medians and interquartile ranges; points represent individual MAGs. A Kruskal–Wallis test indicates a significant difference in MCI across modules, with pairwise comparisons shown. (C) (i) Module 1: Heatmap of genus-level association strength with “Residual Community” groups (multipatt indicator analysis, p < 0.05). Each row represents a genus enriched in Module 1 (Fisher’s exact test, BH-adjusted p < 0.05, ≥3 MAGs). Colour intensity reflects the indicator statistic (r.g): red indicates strong association with one residual community group, and blue with the other. The green strip marks genera previously reported by Kobel et al.3 as distinguishing rumen community types (RCTs). Numbers in the sidebar indicate MAG count per genus, and colours denote phylum membership. (ii) Module 2: Same analysis for breed associations. The orange strip marks genera previously reported by Roehe et al.21 and Wallace et al.23 as associated with methane emission or fibre-related rumen ecology.
To test whether Module 3 captures the methanogenesis pathway characterised by Roehe et al.,21 we cross-referenced their 20 methane-associated KEGG genes (
Table S3 in21) with functional annotations of all MAGs in the FANCY network. Restricting the analysis to the 12 genes encoding the core hydrogenotrophic methanogenesis pathway (KEGG module M00567: CO2 → CH4), MAGs carrying at least one of these genes were significantly enriched in Module 3 (fold = 3.06, BH-adjusted p = 1.3 × 10⁻⁵; Figure S10) but not in Module 2 (fold = 0.91, BH-adjusted p = 0.70; Figure S11) or Module 1 (fold = 0.68, BH-adjusted p = 0.059). Module 3 archaeal MAGs carried near-complete M00567 gene complements (Figure S11). The enrichment is consistent with Module 3’s RF profile: jointly driven by diet and breed at nearly equal importance (17.8% and 17.9% IncMSE), mirroring the balanced breed x diet experimental design from which Roehe’s genes were originally discovered.21 A significant breed × diet interaction (PERMANOVA R2 = 0.016, p < 0.001;
Table S3) confirms the biological basis of this design: diet selects for different microbial communities depending on host breed. Module 2 was also observed to contain archaeal MAGs carrying methanogenesis genes, but these were not enriched in Module 2 relative to the 831 predominantly fibre-degrading bacterial MAGs, consistent with its role as the upstream H2-producing community rather than the methanogenic layer. Conversely, [Fe-Fe] H2-producing hydrogenases (KOs K00532, K00533, K00534, K06441) were significantly depleted in Module 3 (29/209 MAGs = 13.9% carriers, vs 45.4 expected; Fisher fold = 0.64, BH-adjusted p = 0.010) but present at network-wide baseline carriage in both Module 1 (fold = 1.04, ns) and Module 2 (fold = 1.05, ns; Figure S10). Module 3 was enriched for methanogenesis genes but depleted for [Fe-Fe] H2-producing hydrogenases, supporting a functional distinction between the archaeal methanogen assemblage in Module 3 and the bacterial fermenter community in Module 2.Furthermore, within Module 3, low-MCI specialists enriched in SCFA biosynthesis pathways co-occurred with fermentative generalists and Methanobrevibacter (Figure S12), consistent with a syntrophic community where bacterial fermenters supply H2 to archaeal methanogens.
Discussion
We tested whether nonlinear network inference could reveal ecological structure missed by linear and conditional-independence approaches in a rumen MAG abundance dataset. FANCY resolved two independent biological axes: protozoal-driven RCT and host genetics that were not separated as distinct module by Pearson correlation, SparCC, GLasso, and MB. Each axis was validated against classifications derived through independent analytical frameworks, and their independence was confirmed.
The RCT structure captured by Module 1 adds to growing evidence that protozoa are major organisers of bacterial community composition in the rumen.3,24 FANCY recovered the RCT axis described by Kobel et al.3 using only prokaryotic MAG abundances. This suggests that protozoal structure leaves a strong imprint on bacterial ecology that can be detected by methods sensitive to nonlinear dependencies but is obscured by linear approaches that conflate it with other drivers. Notably, RCT assignments were not associated with animal performance,3 suggesting functional redundancy between community types. Module 1 thus captures community variation that is ecologically structured but functionally silent at the host level, which is precisely the kind of hidden organisation missed by phenotype-based validation.
The host-genetics axis captured by Module 2 connects to work showing that cattle breed influences rumen microbial composition and function.4,6,21 Where Roehe et al.21 identified host-genetic effects at the gene level, FANCY recovers a coordinated shift at community level from MAG co-abundance alone, without gene annotations, 16S profiles, or protozoal data. This builds on prior findings by showing that host-genetic effects manifest not only in individual gene abundances but also in higher-order community organisation. Notably, Roehe’s core methanogenesis genes do not concentrate in Module 2 but in Module 3, the archaeal-enriched module jointly driven by diet and breed. In contrast, Module 2 is enriched for bacterial taxa linked to fibre degradation, consistent with a potential upstream role in hydrogen production and supported by the depletion of [Fe-Fe] H2-producing hydrogenases in Module 3 but not in Module 2. Together, these results indicate that FANCY resolves the methanogenesis ecosystem into two functional layers: upstream H2 producers (Module 2, primarily breed-associated) and downstream H2 consumers (Module 3, associated with both breed + diet), a distinction that is not readily captured by the PLS gene-abundance approach used by Roehe et al.,21 which treats methanogenesis as a single functional axis rather than resolving its upstream and downstream components.
Why did linear methods fail to separate these axes? One explanation is that RCT-driven co-abundance patterns involve taxa whose relationships change direction across community types. When the communities are analysed together, positive associations in one RCT-type can offset negative associations in another, yielding weak or near-zero global Pearson correlations (as shown for Module 2 taxa in Figure S7B). In contrast, FANCY detects such context-dependent dependencies even when the direction of association changes across community states, retaining them as stable associations. Similarly, breed effects likely arise through multiple mechanisms such as rumen physiology, behaviour, feed intake patterns and immune variation, which may generate threshold-like or context-dependent relationships between taxa. These are precisely the dependency structures that linear methods can either miss or blur into the dominant diet signal, and that FANCY’s multiplicative hybrid score is designed to retain. Topology and concordance analyses of the modules support this interpretation: FANCY showed moderate overlap with SparCC (Jaccard edge similarity ≈ 0.68, Mantel r for cluster assignment = 0.46) but diverged from precision-based methods (Jaccard <0.10, Mantel r ≈ 0), confirming that nonlinear edges substantively alter module organisation (Figure S13).
One might ask whether linear methods could recover these axes at different edge densities. At 1% density, where all five methods can be compared at matched edge count (23,708 edges), FANCY already contributed 18% unique edges, while Pearson and SparCC each contributed less than 1% (Figure S2). These differences are accompanied by substantial changes in network topology (
Table S7), indicating that FANCY does not simply recover a denser or sparser version of the same structure. Instead, nonlinear edges reorganise modules in ways that allow the RCT and host-genetic axes to emerge as distinct biological signals. The separation achieved by FANCY therefore appears to reflect dependencies that conventional linear frameworks do not capture.
More broadly, these results illustrate a general limitation of linear and conditional-independence frameworks in microbial ecology. Fermentation ecosystems are inherently nonlinear: cross-feeding cascades, substrate competition, threshold-driven community shifts, and context-dependent interactions produce dependencies that do not conform to linear or Gaussian assumptions. When multiple ecological drivers act simultaneously (as diet, host genetics, and RCT do in the rumen), linear methods may collapse these overlapping signals into modules that blend drivers rather than separating them. Nonlinear network inference offers a way to disentangle these signals, not by replacing linear methods but by recovering the additional structure they miss.
Although developed for the rumen, FANCY is applicable to any high-dimensional abundance dataset where overlapping ecological drivers and nonlinear interactions are expected. In other datasets, the optimal network density cutoff will vary because the location and width of the stability plateau depend on network size, modular structure, and the distribution of HybridScore values. We therefore recommend applying the same edge-perturbation bootstrap diagnostic to each new dataset and selecting a cutoff within the resulting stability plateau identified for that dataset.
Several limitations should be acknowledged. FANCY detects associations, not causal relationships. Our biological interpretation of Module 1 rests on taxonomic correspondence with Kobel et al.3 rather than direct protozoal measurements, and the RCT validation involved only 24 animals. Module 3’s enrichment for core methanogenesis genes provides functional support but has not been validated against an independent cohort; its interpretation as the archaeal consumer module remains hypothesis-generating until confirmed by meta-transcriptomic or metabolomic data. Hyperparameter choices (exponent weighting, density threshold) may influence results, and systematic sensitivity analysis is recommended.
Methods
Animal cohort and sampling
We analysed 321 beef steers from four breeds (Aberdeen Angus, Luing, Charolais, Limousin) sampled across five experiments (2011–2017) at SRUC’s Beef and Sheep Research Centre. Animals were fed either a forage-based (480:520 forage:concentrate, DM basis) or concentrate-based (80:920) diet. Methane emissions were measured individually using indirect open-circuit respiration chambers over 48 hours and expressed as g CH4/kg dry matter intake. Rumen content was collected at slaughter for metagenomic sequencing. After quality filtering, 2,178 MAGs present in at least 50 samples were retained and transformed using the centred log-ratio (CLR) method to address compositionality.20 This dataset comprised 321 samples from 292 individual animals: 268 steers from Trials 2011–2014 contributed one sample each, while 24 SuPAcow animals from Kobel et al.3 (Trial 2021) contributed between one and six longitudinal samples each (53 samples total). Full experimental details are provided in Rooke et al.,25 Duthie et al.6 and Martínez-Álvaro, Auffret.5
Residual community derivation
Diet effects were regressed out from each MAG’s CLR-transformed abundance using linear models (R function lm()). PCA on the residual matrix was performed with prcomp(), and the first two principal components were clustered using kmeans() (k = 2) to define Residual Community groups. Associations with metadata were tested using using chi-square tests for categorical variables (Breed, Diet) and Kruskal–Wallis tests (CH4) with FDR correction.
FANCY network inference
Pairwise associations were inferred using two approaches applied to 100 bootstrap resamples of the 321 samples:
1.
Edge frequency (information-theoretic). K-nearest neighbour mutual information (kNN-MI) was computed for each bootstrap replicate using the “knnmi” R package and used as input for MRNET from the “minet” R package,17 which applies maximum relevance–minimum redundancy filtering to produce a network. Edge frequency was calculated as the proportion of bootstrap replicates in which MRNET recovered a given edge.
2.
Stability score (dependency-based). Distance correlation (dCor) was computed for each bootstrap replicate using the “energy” R package.16 dCor captures both linear and nonlinear associations. The stability score was defined as mean dCor across replicates divided by its standard deviation (undefined ratios were adjusted by replacing the denominator with a small constant, 0.001). dCor was computed for all 2,370,753 possible MAG pairs. Stability scores were rescaled to [0, 1] using the 20th and 99th percentiles.
Edges were retained if detected in more than 60% of bootstrap replicates (edge frequency > 0.6); edges with moderate frequency (0.3 ≤ edge frequency ≤ 0.6) were retained if their stability score exceeded the 80th percentile. After filtering, 1,121,587 edges remained. For each retained pair of MAGs i and j, a hybrid score was calculated as:
where ω
1 and ω
2 are tuneable exponents controlling the relative influence of reproducibility versus stability. The multiplicative form penalises edges weak in either dimension. We applied ω
1 = 0.3 and ω
2 = 0.7 in this study. The top 10% of all possible MAG pairs (237,075 edges), ranked by hybrid score, defined the final weighted network (
Figure S14).
Comparison methods
Pearson correlations were computed in R using the cor() function on CLR-transformed abundances. SparCC correlations were computed using the R package “SPIEC-EASI” on filtered count data using default settings9; signed edges were supplied to GLay so that negative associations could influence clustering topology. SPIEC-EASI was run using both the GLasso11 and MB12 network inference models. Model stability and parameter selection were determined using the PULSAR framework implemented within SPIEC-EASI.10
To compare network topology between methods, we ranked edges by association strength (hybrid score for FANCY, absolute Pearson r, SparCC ρ, partial correlation for GLasso, regression coefficients for MB) and retained the top 1% across all five methods to enable comparison at equal edge count. Global network statistics were computed on these 1% networks using absolute weights to avoid sign-driven metric biases (
Table S7).
For module detection and biological interpretation, we retained the top 10% of edges for FANCY (Figure S19) and the correlation-based methods (237,075 edges; positive-only for Pearson, signed for SparCC). To facilitate comparison across methods, sensitivity curves (Figure S15) show how network size (edge count) changes as the association threshold is varied for each method. For precision-based methods, which perform internal edge selection through regularisation, all inferred edges were included (GLasso: 51,310; MB: 39,076). To assess similarity across methods, pairwise Jaccard indices quantified the proportion of shared top-ranked edges between networks. Module-level concordance was evaluated using co-assignment matrices (1 if two MAGs shared a module, 0 otherwise), converted to distance matrices and compared across methods using the Mantel test (Spearman correlation, 999 permutations; vegan R package; see Figure S13; Table S7).
Module detection and evaluation
Networks were clustered with the Newman-Clauset-Moore fast-greedy community-detection algorithm26 as implemented in the GLay/ClusterMaker plugin for Cytoscape v3.9.027, which uses the igraph C library.28 For each module, mean relative abundance across samples was predicted from breed, diet, CH4, and Residual Community using Random Forest regression (R package randomForest) with 5-fold cross-validation repeated five times. For each microbial module c, mean module abundance across samples was modelled as a function of these predictors:
Predictor importance was quantified as %IncMSE upon variable permutation, reported as a relative measure of predictive contribution. Community-level effects were assessed by PERMANOVA on Bray–Curtis dissimilarities (adonis2, 9,999 permutations).29
Post hoc validation
Protozoal community type validation. RCT assignments for 24 SuPAcow animals (15 RCT-A, 9 RCT-B) were obtained from Kobel et al.3 All 2,178 MAGs were tested for differential CLR abundance between RCT-A and RCT-B using Wilcoxon rank-sum tests. Enrichment of RCT-significant MAGs in each FANCY module was assessed by Fisher’s exact test.
Host-genetics validation. To validate the host-genetic signal recovered by FANCY, we analysed 63 steers from Trial 2011.21 After regressing out diet effects, principal component analysis identified seven animals with distinct fibre-specialist microbiome profiles. MAGs that differed significantly between these outlier animals and the remaining cohort (Wilcoxon p < 0.05) were then tested for enrichment within FANCY modules using Fisher’s exact test.
Methanogenesis gene validation. MAGs were annotated with eggNOG-mapper v230 to obtain KEGG orthologue assignments. The 20 methane-associated KEGG genes identified by Roehe et al.21 were classified into 12 core methanogenesis pathway genes (KEGG module M00567), 4 methanogen-associated genes, and 4 general anaerobic genes (Figure S11). Enrichment of MAGs carrying these genes in each FANCY module was assessed by Fisher’s exact test (Figure S10).
Functional and ecological annotation
MAGs were functionally annotated using DRAM31 and summarised into a metabolic capacity index (MCI) via the DistillR pipeline, which integrates KEGG and MetaCyc into custom Genome Inferred Functional Trait (GIFT) annotations32 (Figure S16). Module-level metabolic differences were assessed by Kruskal-Wallis tests on MCI values. Overrepresented genera within each module were identified by Fisher’s exact test against global background frequencies, with p-values corrected by the Benjamini-Hochberg method (FDR < 0.05; Figure S17). To assess functional capabilities per module, each MAG’s trait profile was weighted by its relative abundance:
where
= MAG,
= trait (e.g., SCFA biosynthesis element),
is the GIFTs capacity index for trait
t in MAG
m, and
is the mean relative abundance of MAG
m across all samples, normalised by the summed abundance of all MAGs within the same module. Weighted values were aggregated by module and genus (the “Module-Genus level”). To prioritise ecologically informative features, we retained the top 30% most variable traits across Module-Genus combinations and excluded genera represented by fewer than three MAGs per module (
Figures S17-S18).
Robustness of the dominant module structure to network density cutoff
To assess whether the dominant modules are sensitive to the choice of the 10% density cutoff, we treated the threshold as a tuneable parameter and performed an edge-perturbation bootstrap sweep across eleven density cutoffs from 1 to 35%, with 100 replicates per cutoff. For a given density d, let m denote the number of retained edges. Each bootstrap replicate was generated by first defining a candidate edge set consisting of the top ranked HybridScore edges up to (m + 0.5% of all possible undirected edges), from which m edges were randomly sampled without replacement. Fast-greedy community detection was applied to each perturbed graph using the igraph R package.28 For each density and bootstrap replicate, we derived the partition membership, total module count, sizes of the five largest modules, and modularity Q, which quantifies community structure strength relative to random network.
To test whether the modular signal exceeded random expectation, we additionally generated 100 Erdős-Rényi null graphs, preserving node and edge count at each density and ran fast-greedy on each, recording the null distribution of Q. Within-method partition stability across adjacent density cutoffs was assessed by paired-bootstrap normalised mutual information (NMI), adjusted Rand index (ARI), and co-assignment phi coefficient between the bootstrap partitions at consecutive cutoffs matched by bootstrap index (Figure S19–22; Supplementary Dataset 2–4).
Ethics and consent statement
This study is a secondary computational analysis of previously published, publicly available metagenomic datasets; no new experiments on animals were performed by the authors, and no additional ethical approval was therefore required for the work reported here. All animal trials that generated the underlying data were conducted with prior ethical approval, as reported in the original publications. The beef cattle trials21,6 and the SuPAcow trial3 were carried out at the Beef and Sheep Research Centre of Scotland’s Rural College (SRUC), Edinburgh, UK. In each case the experiment was approved by the Animal Experiment Committee of SRUC and was conducted in accordance with the requirements of the UK Animals (Scientific Procedures) Act 1986. Specific project licence (permit) numbers were not reported in the original publications; readers are referred to those studies and their corresponding authors for further detail.








