Introduction
Soil is a finite resource on human timescales, and its capacity to support food production, regulate water and store carbon depends on keeping it in place and in good chemical condition.1,2 In Europe these two aspects of soil health are under separate pressures. Water erosion removes an estimated 970 Mt of soil from EU land each year, at a mean rate of 2.46 t ha−1 yr−1,3 and more intense rainfall is expected to increase losses further by 2050.4 At the same time, large parts of the continent have strongly acidic or alkaline topsoils, and organic matter has declined in many intensively cultivated areas.5,6
Land use links the two. Clearing vegetation, cultivating slopes and sealing soils increase runoff and erosion, whereas afforestation and the abandonment of marginal farmland usually reduce them.7,8 Land use also changes topsoil chemistry: conversion of forest or grassland to cropland typically lowers soil organic carbon, while liming and fertilisation shift the pH of farmed soils.9 Whether places that are vulnerable to erosion are also those with poor topsoil condition is, however, rarely tested at continental scale.
Resilience, the capacity of a system to absorb disturbance and retain its structure and function,10,11 is a useful organising idea here, but it has to be made specific: resilience of what, to what.12 In this study, two measurable properties are considered. The first is the response of modelled soil loss to land use and vegetation-cover change, taken from the Global Soil Erosion Modelling platform (GloSEM), which provides consistent estimates for 2001 and 2012.13 The second is the physicochemical condition of the topsoil, measured directly in the three surveys of the Land Use/Cover Area frame Survey (LUCAS) Topsoil programme in 2009, 2015 and 2018.14–17
The study had three aims: (1) to describe national changes in modelled soil loss between 2001 and 2012; (2) to construct a Soil Resilience Index (SRI) from LUCAS pH, electrical conductivity (EC) and soil organic matter (SOM), describe its variation across Europe and between land cover classes, and test how sensitive it is to its formulation and to differences between surveys; and (3) to test whether national soil loss is associated with topsoil condition. The results are discussed in relation to the EU Soil Strategy for 2030,18 the Directive on soil monitoring and resilience19 and the Nature Restoration Regulation.20
Methods
Modelled soil loss
Soil loss by sheet and rill erosion was taken from GloSEM, developed by the Joint Research Centre of the European Commission.13 GloSEM applies the Revised Universal Soil Loss Equation (RUSLE):
A = R × K × LS × C × P
where A is mean annual soil loss (t ha−1 yr−1), R is rainfall erosivity, K is soil erodibility, LS is the slope length and steepness factor, C is the cover-management factor and P is the support practice factor. In GloSEM, R is interpolated from high-resolution rainfall records,21 K is derived from SoilGrids topsoil properties, LS from the SRTM and ASTER elevation models, and C from national crop statistics combined with MODIS vegetation-cover data; P is set to 1 in the baseline.13 The maps for 2001 and 2012 share the same R, K and LS layers and differ only in land use and vegetation cover, so the difference between them isolates the effect of land cover change on modelled soil loss.13
National mean soil loss for 2001 and 2012 was calculated as the mean of all GloSEM cells within each national boundary for the 27 EU Member States and the United Kingdom. The boundaries used were sovereign-state units, which for Denmark and France also contain Greenland and the overseas territories; all country-level tests were therefore repeated without these two countries. Change was expressed in t ha−1 yr−1 and as a percentage of the 2001 value, and the paired difference across countries was tested with a Wilcoxon signed-rank
test.
European erosion factors
To examine the drivers behind national soil loss and to add a point-level comparison, three European RUSLE factor maps from the European Soil Data Centre were used: rainfall erosivity (R; 500 m, MJ mm ha−1 h−1 yr−1),22 soil erodibility (K; 500 m, t ha h ha−1 MJ−1 mm−1)23 and the support practice factor (P; 100 m, dimensionless), which represents contour farming, stone walls and grass margins on arable land.24 All three maps are in the ETRS89 Lambert Azimuthal Equal Area projection. Values were extracted at the location of each LUCAS point from 2015 and 2018, and country means were calculated with each location counted once; P was averaged over cropland points only. Country means were reported only where at least 30 locations (or, for P, 30 cropland locations) were available. Because the K map was derived from the texture and organic carbon of LUCAS 2009 samples,23 it was not compared with SOM or with the SRI.
LUCAS topsoil data
Point data were taken from the LUCAS Topsoil surveys of 2009,14 201515 and 2018.16 In each survey, topsoil (0–20 cm) was sampled at points of the LUCAS grid and analysed in a single laboratory for pH in water (ISO 10390), EC (ISO 11265) and organic carbon (ISO 10694).17 EC was not measured in 2009. Coordinates were taken from the GPS fields of the 2009 file and from the theoretical point coordinates supplied with the 2015 and 2018 data. Country and land cover were taken from the NUTS 0 and land cover fields of the 2015 and 2018 files. Points were linked between surveys through the LUCAS point identifier.
Organic carbon (g kg−1) was converted to SOM (%) with the conventional factor of 1.724,25 capped at 100% for peat soils. EC was kept in mS m−1, the unit reported by LUCAS. Values below the limit of detection in 2018 were treated as missing, and only 2018 samples from 0–20 cm were used. In the 2018 file, 402 elevation values between 8,888 and 11,464 m, higher than any point in Europe, were treated as invalid. For 109 samples from Cyprus in 2009 that had no grid identifier, an identifier was created from the laboratory sample number. The final data comprised 19,899 points in 2009, 21,859 in 2015 and 18,744 in 2018.
Soil resilience index
Each point was assigned a pH class: acidic stress (pH < 5.5), optimal (5.5 ≤ pH < 8.0) or alkaline stress (pH ≥ 8.0).2,6 The primary composite index was designed so that departures from favourable conditions lower the score:
SRI = [−Z (pH_dev) − Z (log10 EC) + Z (log10 SOM)] /3
where pH_dev is the distance of pH outside the range 5.5–8.0 (zero inside it) and Z is a z-score. EC enters with a negative sign as an indicator of salinity, and EC and SOM were log-transformed because their distributions are strongly skewed. A linear version in which all three variables contribute positively, SRI_lin = [Z (pH) + Z (EC) + Z (SOM)] /3, was calculated as a sensitivity analysis. For both versions, z-scores were computed on the pooled 2015 and 2018 data so that the two surveys share one scale, and the index was divided into low, moderate and high classes at the tertiles of the pooled distribution. Because EC was missing in 2009, the SRI was computed for 2015 and 2018 only.
Statistical analysis
All analyses were done in R 4.326 with the sf and ggplot2 packages.27,28 For mapping, points were aggregated into about 70 hexagonal bins across the map extent, each showing the mean pH, the median SOM or the most frequent SRI class. The association between EC and SOM was measured with Spearman’s rank correlation, and the relationship between elevation and pH (2018) with ordinary least squares. Differences in SOM and SRI between the main land cover classes (woodland, shrubland, grassland, cropland and bare land) were tested with Kruskal–Wallis tests for each survey year.
Changes between surveys were assessed on revisited points only, that is, points with the same identifier in both surveys, so that differences in the sample of locations could not affect the comparison. Paired differences in pH, SOM and EC were tested with Wilcoxon signed-rank tests, and pH classes in 2009 and 2018 were cross-tabulated.
For the national comparison, LUCAS points from 2015 and 2018 were pooled by country, and countries with fewer than 30 points were excluded, which removed Malta and left 27 countries. For each country, the median SRI, the median SOM and the percentages of points with optimal and with acidic pH were calculated. Their association with national mean soil loss in 2012 was tested with Spearman’s rank correlation, as was the association of national soil loss with mean R and K. At point level, the SRI and SOM were correlated with R for all points and for cropland points only. The complete code and derived data are openly available.29
Results
National soil loss, 2001–2012
Mean soil loss in 2012 ranged from 0.04 t ha−1 yr−1 in Finland to 5.90 t ha−1 yr−1 in Malta (
Figure 1). The highest national values after Malta were in Italy (4.03), Greece (4.01), Austria (2.35), Spain (2.17) and Slovenia (2.09 t ha−1 yr−1), and the lowest in Finland, Estonia (0.09) and Latvia (0.13 t ha−1 yr−1). Between 2001 and 2012, soil loss increased in 13 countries and decreased in 15, and the change was within ±5% in 21 of the 28 countries. The median across countries was 0.83 t ha−1 yr−1 in 2001 and 0.82 t ha−1 yr−1 in 2012, and there was no consistent direction of change (Wilcoxon p = 0.15). The largest relative decreases were in Poland (−13.7%), Italy (−12.4%), Portugal (−7.8%) and Bulgaria (−6.1%). The largest relative increases were in Lithuania (+20.5%) and Latvia (+15.1%), where soil loss remained below 0.2 t ha−1 yr−1.
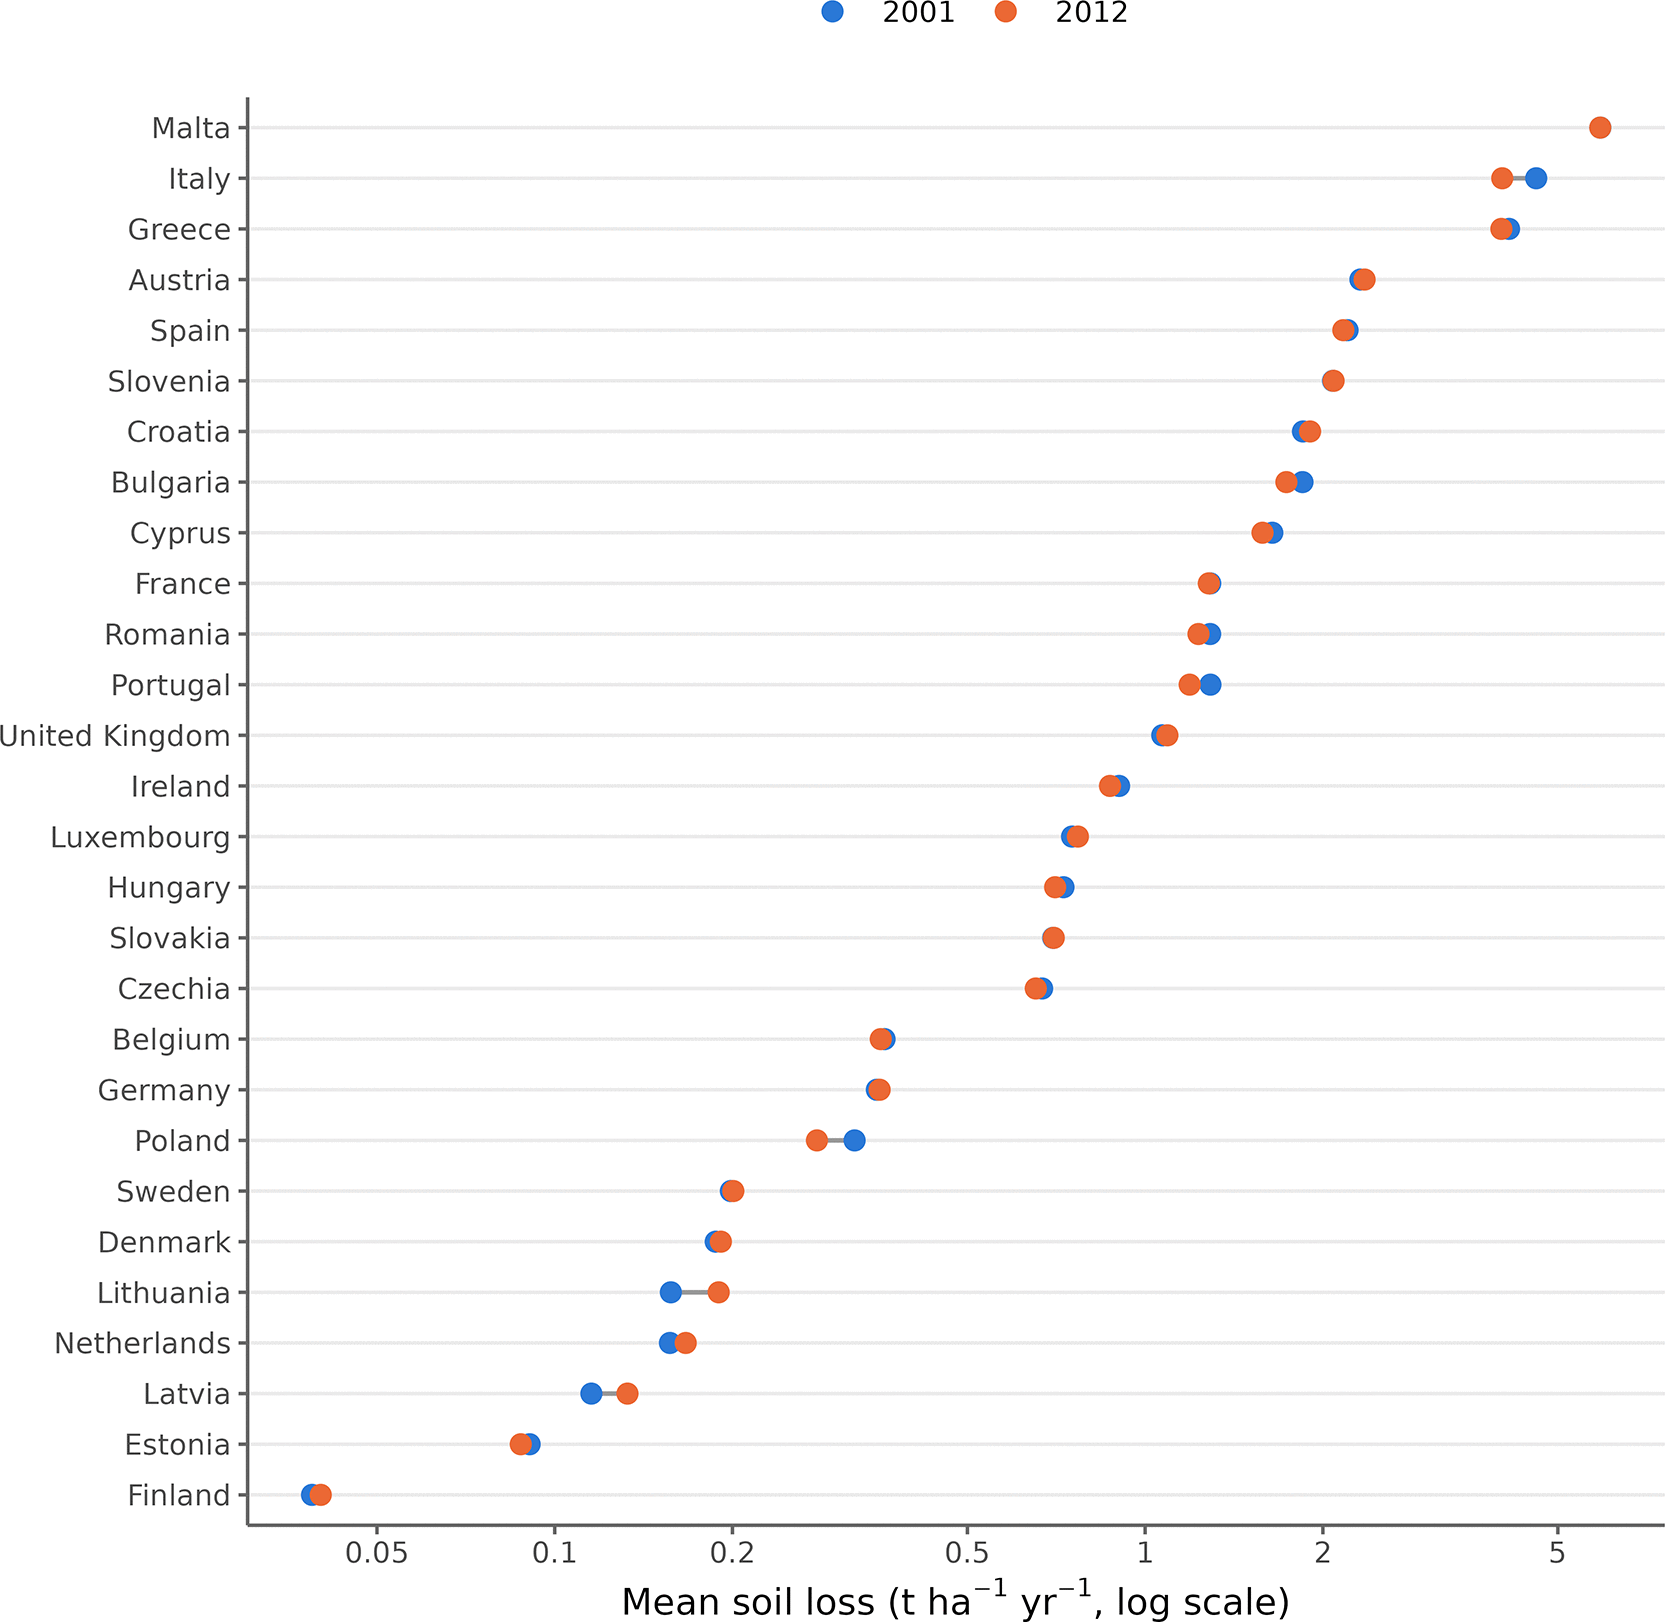
Figure 1. National mean soil loss in 2001 and 2012.
Mean soil loss by sheet and rill erosion (t ha−1 yr−1, log scale) for the 27 EU Member States and the United Kingdom, calculated from the GloSEM maps for 2001 (blue) and 2012 (orange). Differences between the two years reflect land use and vegetation-cover change only. Countries are ordered by soil loss in 2012.
Erosion factors
National soil loss followed rainfall erosivity closely (
Table 1). Mean R was highest in Slovenia (2,344 MJ mm ha−1 h−1 yr−1), Italy (1,624), Croatia (1,308) and Austria (1,073), and lowest in Finland (294) and Sweden (389), and across 27 countries it was strongly correlated with soil loss in 2012 (ρ = 0.90, p < 0.001). Soil erodibility varied less between countries (mean K 0.024–0.044) and was not significantly related to soil loss (ρ = 0.32, p = 0.11; n = 26). Mean P on cropland was lowest in Portugal (0.85), Spain (0.90), the United Kingdom and Italy (both 0.91), where support practices are more widespread, and close to 1 in most central and northern countries.
Table 1. National mean soil loss in 2001 and 2012 and mean RUSLE erosion factors at LUCAS locations.
| Country | Soil loss 2001 (t ha−1 yr−1) | Soil loss 2012 (t ha−1 yr−1) | Change (%) | R (MJ mm ha−1 h−1 yr−1) | K (t ha h ha−1 MJ−1 mm−1) |
P, cropland |
|---|
| Malta | 5.90 | 5.90 | 0.0 | – | – | – |
| Italy | 4.60 | 4.03 | −12.4 | 1,624 | 0.033 | 0.91 |
| Greece | 4.13 | 4.01 | −3.0 | 770 | 0.031 | 0.92 |
| Austria | 2.32 | 2.35 | +1.7 | 1,073 | 0.031 | 0.95 |
| Spain | 2.20 | 2.17 | −1.7 | 869 | 0.037 | 0.90 |
| Slovenia | 2.08 | 2.09 | +0.2 | 2,344 | 0.030 | – |
| Croatia | 1.85 | 1.90 | +2.8 | 1,308 | 0.038 | – |
| Bulgaria | 1.85 | 1.73 | −6.1 | 676 | – | 0.98 |
| Cyprus | 1.64 | 1.58 | −3.8 | 563 | 0.037 | 0.97 |
| France | 1.29 | 1.28 | −0.6 | 710 | 0.037 | 0.94 |
| Romania | 1.29 | 1.23 | −4.5 | 781 | 0.043 | 0.97 |
| Portugal | 1.29 | 1.19 | −7.8 | 768 | 0.034 | 0.85 |
| United Kingdom | 1.07 | 1.09 | +2.0 | 567 | 0.029 | 0.91 |
| Ireland | 0.90 | 0.87 | −3.5 | 559 | 0.024 | – |
| Luxembourg | 0.75 | 0.77 | +2.3 | 677 | 0.039 | – |
| Hungary | 0.73 | 0.70 | −3.2 | 685 | 0.035 | 0.98 |
| Slovakia | 0.70 | 0.70 | +0.2 | 576 | 0.038 | 0.99 |
| Czechia | 0.67 | 0.65 | −2.5 | 516 | 0.039 | 0.99 |
| Belgium | 0.36 | 0.36 | −1.5 | 588 | 0.044 | 0.92 |
| Germany | 0.35 | 0.36 | +1.1 | 503 | 0.034 | 0.95 |
| Poland | 0.32 | 0.28 | −13.7 | 540 | 0.031 | 0.95 |
| Sweden | 0.20 | 0.20 | +1.0 | 389 | 0.028 | 0.94 |
| Denmark | 0.19 | 0.19 | +2.0 | 429 | 0.025 | 0.98 |
| Lithuania | 0.16 | 0.19 | +20.5 | 488 | 0.034 | 1.00 |
| Netherlands | 0.16 | 0.17 | +6.4 | 467 | 0.027 | 0.95 |
| Latvia | 0.12 | 0.13 | +15.1 | 481 | 0.031 | 1.00 |
| Estonia | 0.09 | 0.09 | −3.4 | 439 | 0.028 | 0.99 |
| Finland | 0.04 | 0.04 | +3.5 | 294 | 0.027 | 0.93 |
Soil pH
Topsoil pH showed a clear and persistent geographical pattern (
Figure 2). Acidic soils dominated Fennoscandia, the Baltic states, the British Isles and north-western Iberia, whereas alkaline soils were concentrated in eastern and southern Spain and parts of Italy and Greece, in line with the distribution of siliceous and calcareous parent materials.5 Of all points, 34.5% were in the acidic stress class, 55.9% in the optimal class and 9.6% in the alkaline stress class in 2009, compared with 32.0%, 58.8% and 9.3% in 2018 (
Table 2). Among the 12,898 points sampled in both years, 81.0% kept the same pH class, and the median paired change was −0.01 pH units. Elevation explained only 2.6% of the variation in pH in 2018 (n = 18,354; Extended data).
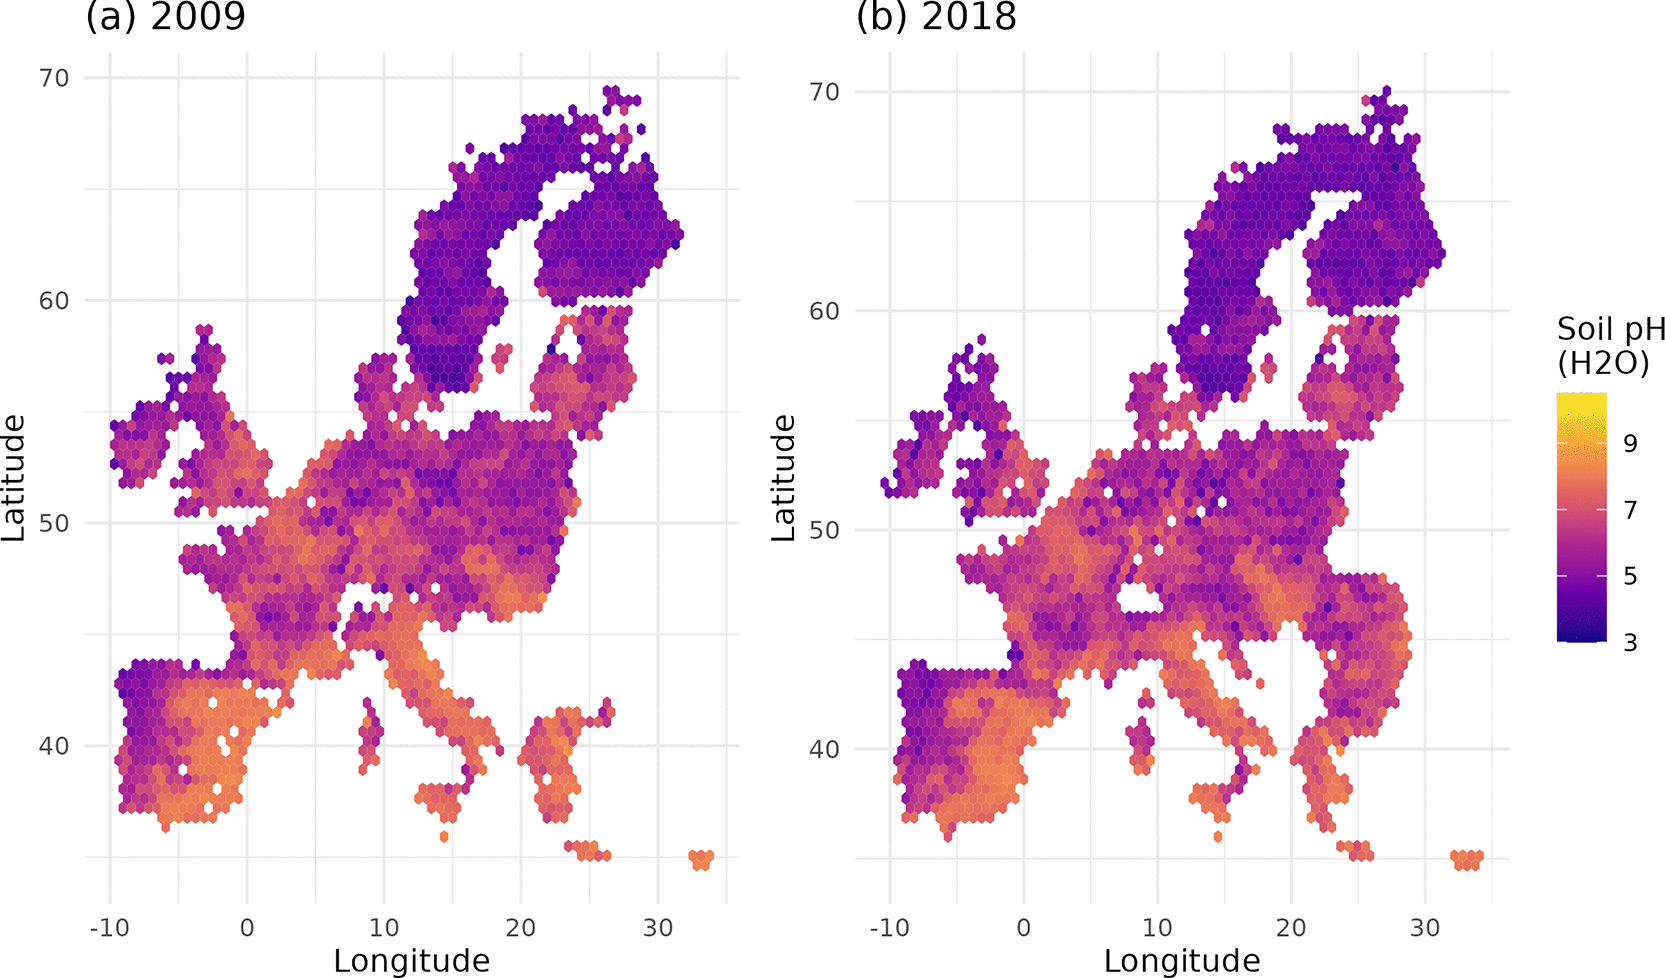
Figure 2. Mean topsoil pH across Europe in 2009 and 2018.
Mean pH in water per hexagon, LUCAS Topsoil (a) 2009 (n = 19,899) and (b) 2018 (n = 18,744).
Table 2. Soil pH and Soil Resilience Index classes by survey year (% of points).
| Indicator | Class | 2009 | 2015 |
2018 |
|---|
| pH (H₂O) | Acidic stress (< 5.5) | 34.5 | – | 32.0 |
| Optimal (5.5 to <8.0) | 55.9 | – | 58.8 |
| Alkaline stress (≥ 8.0) | 9.6 | – | 9.3 |
| SRI, threshold-based (primary) | Low | – | 41.5 | 23.8 |
| Moderate | – | 32.9 | 33.8 |
| High | – | 25.6 | 42.4 |
| SRI, linear (sensitivity) | Low | – | 33.5 | 33.1 |
| Moderate | – | 31.9 | 35.0 |
| High | – | 34.6 | 31.9 |
Soil organic matter and electrical conductivity
SOM was highest in the organic soils of Fennoscandia, Ireland and Scotland and in mountain areas, and lowest in the agricultural lowlands of southern and eastern Europe (
Figure 3). At the 12,872 points sampled in 2009 and 2018, median SOM rose from 3.35% to 3.55% (median paired difference + 0.12 percentage points; p < 0.001), a small change compared with the spatial range. EC and SOM were positively correlated, moderately in 2015 (ρ = 0.41; n = 21,859) and weakly in 2018 (ρ = 0.22; n = 18,705) (
Figure 4). The association was partly driven by organic soils, which combine high SOM with elevated EC.
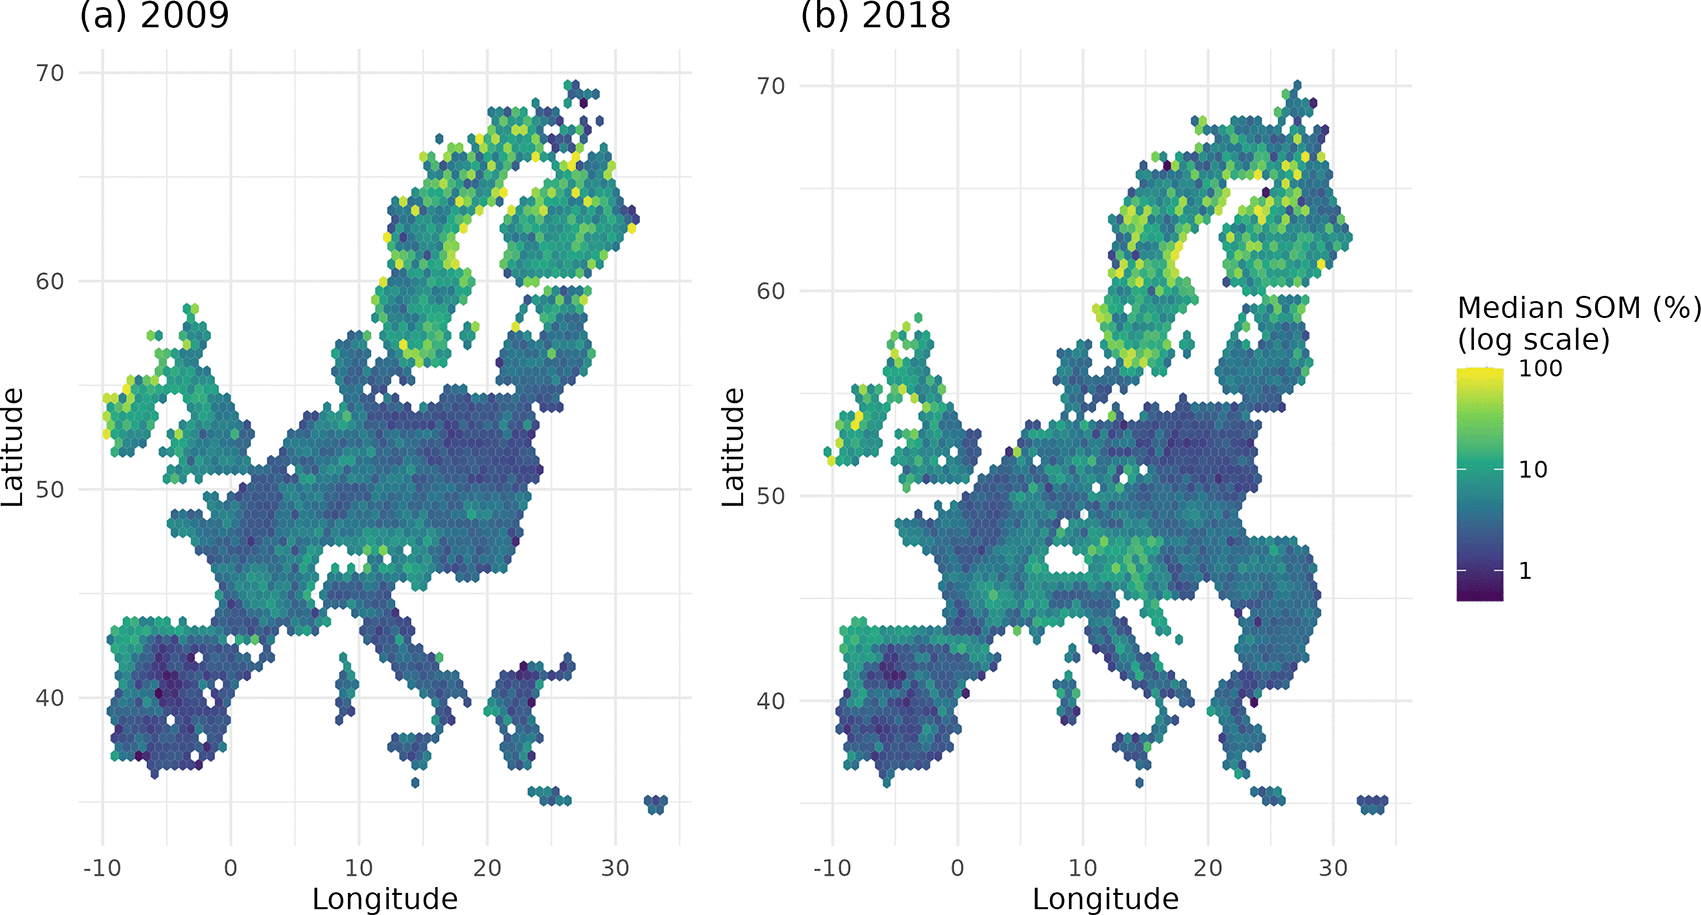
Figure 3. Soil organic matter across Europe in 2009 and 2018.
Median soil organic matter (%) per hexagon, LUCAS Topsoil (a) 2009 and (b) 2018, on a logarithmic colour scale. SOM = organic carbon × 1.724, capped at 100%.
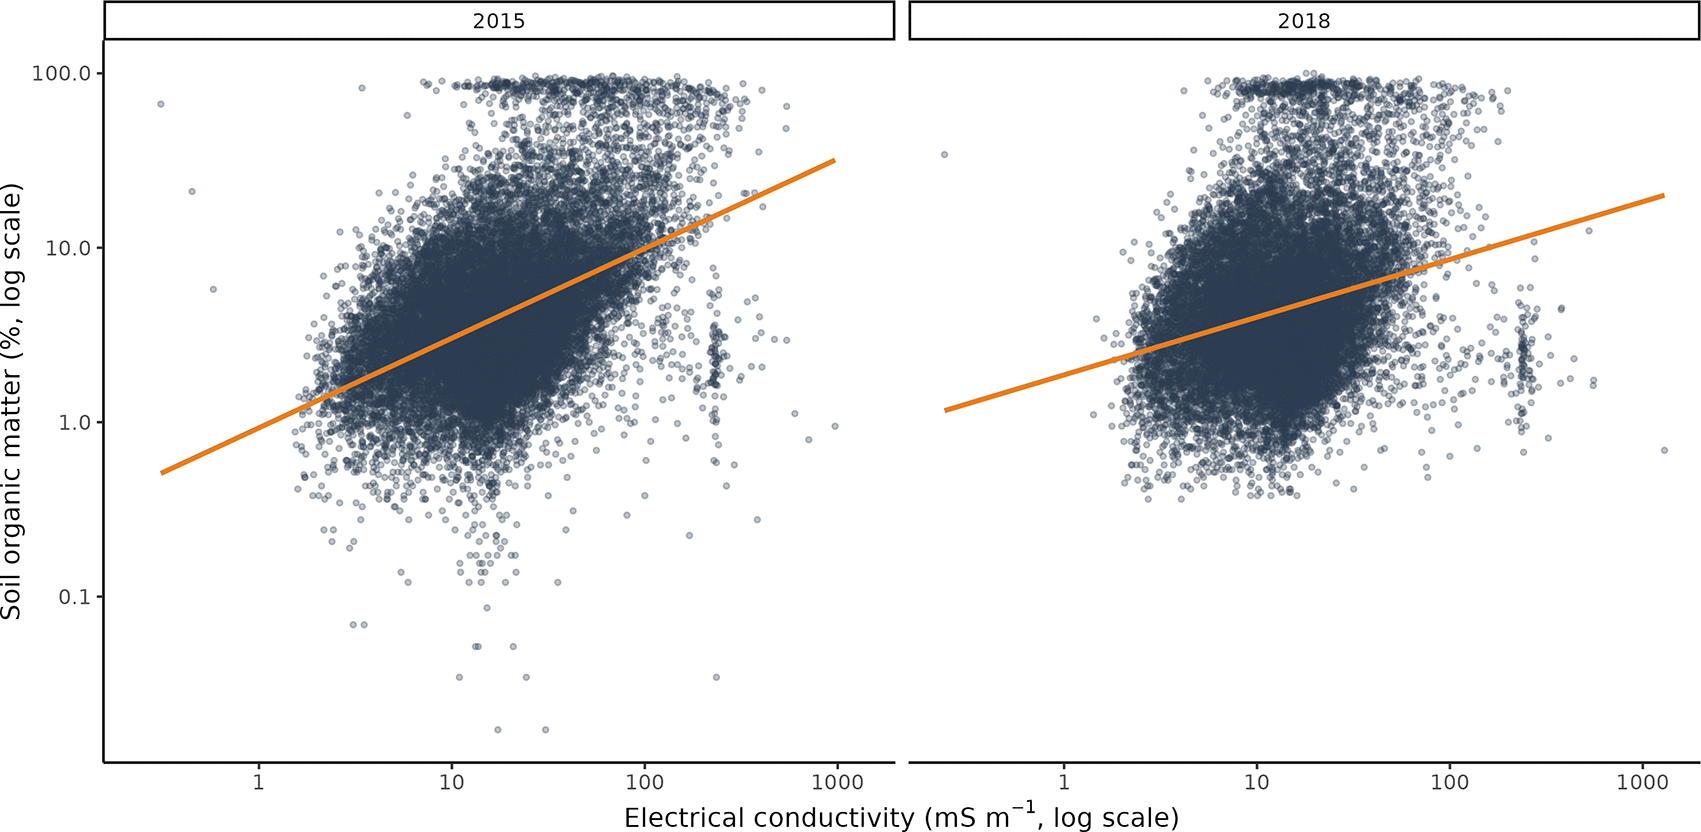
Figure 4. Electrical conductivity and soil organic matter.
LUCAS Topsoil 2015 (n = 21,859) and 2018 (n = 18,705), both axes on a logarithmic scale; EC in mS m−1. The line is a linear fit on the logarithmic scale. EC was not measured in 2009.
Soil resilience index
The threshold-based SRI varied at regional rather than continental scale (
Figure 5). Country medians were highest in Slovenia, Portugal, Croatia, Latvia and Estonia (0.25–0.26) and lowest in Ireland (−0.17), Cyprus (−0.12), Poland, the United Kingdom and the Netherlands (all about −0.10). In Finland and Sweden, where 88–89% of points were acidic, high SOM offset the pH penalty and the medians were close to zero.
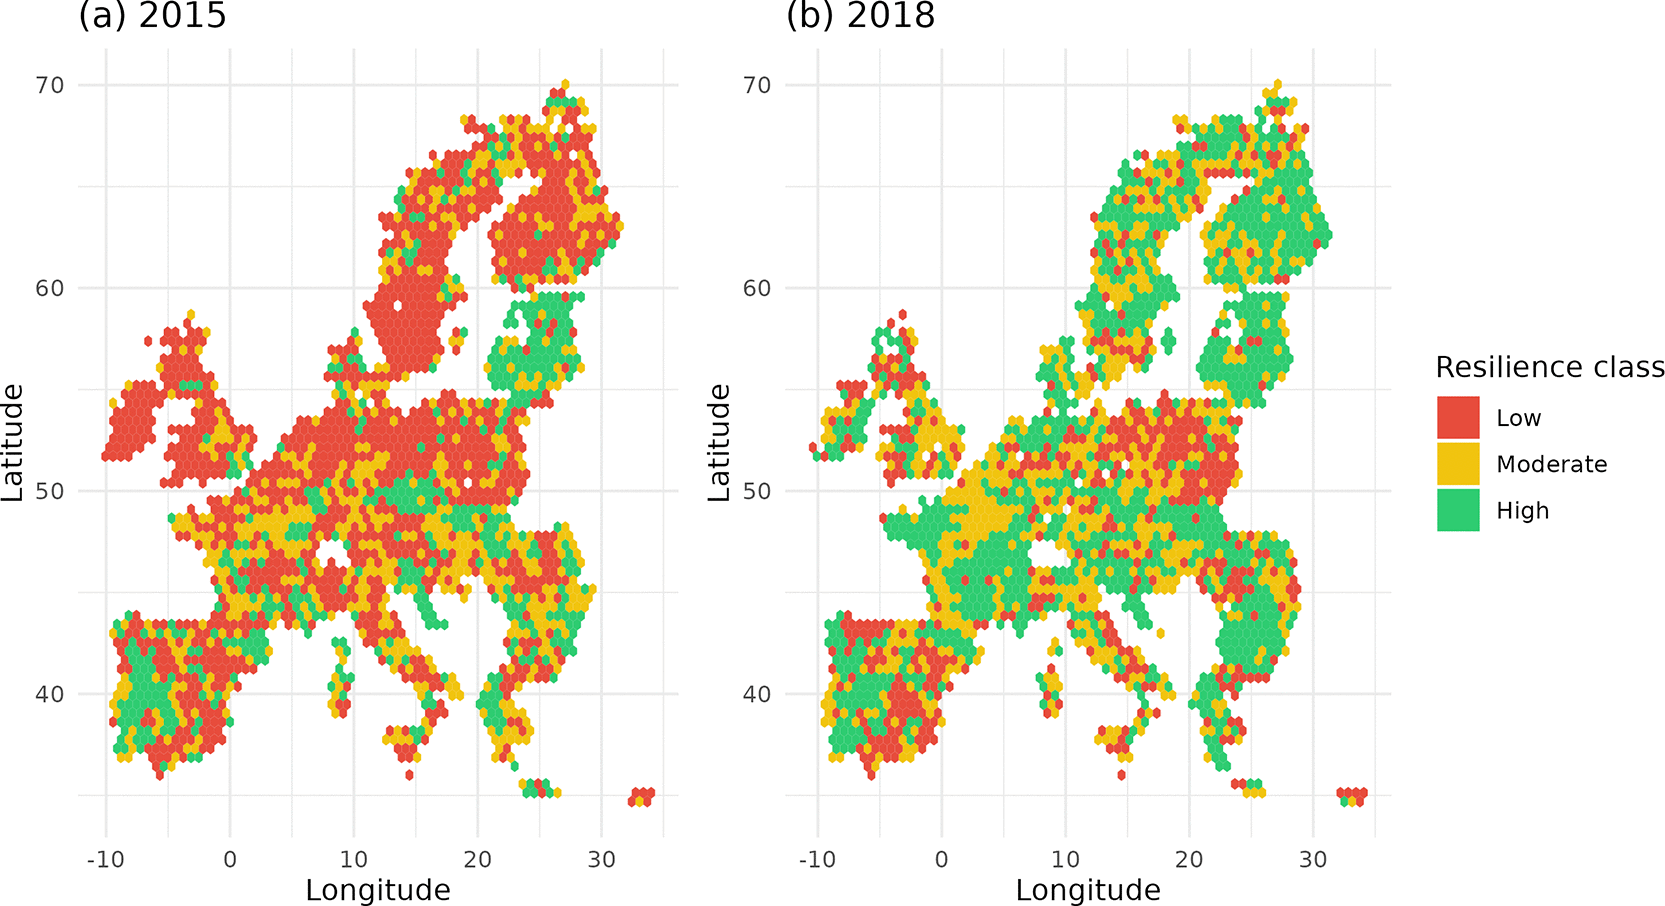
Figure 5. Soil Resilience Index classes across Europe in 2015 and 2018.
Most frequent class of the threshold-based SRI per hexagon, LUCAS Topsoil (a) 2015 and (b) 2018. Classes are tertiles of the pooled 2015–2018 index. Differences between the panels partly reflect inter-survey differences in pH and EC (see Results).
The index differed strongly between land cover classes in both years (Kruskal-Wallis p < 0.001;
Figure 6,
Table 3). Woodland had the highest median SOM (6.5% in 2015) but the smallest share of points with optimal pH (28.0%). Cropland showed the opposite pattern, with the highest share of optimal pH (72.9%) and low SOM (2.5%). As a result, the share of points in the high SRI class was greatest under shrubland (49.6%) and grassland (33.1%) and smallest under cropland (18.6%) and bare land (11.8%). The ranking of land cover classes was the same in 2015 and 2018.
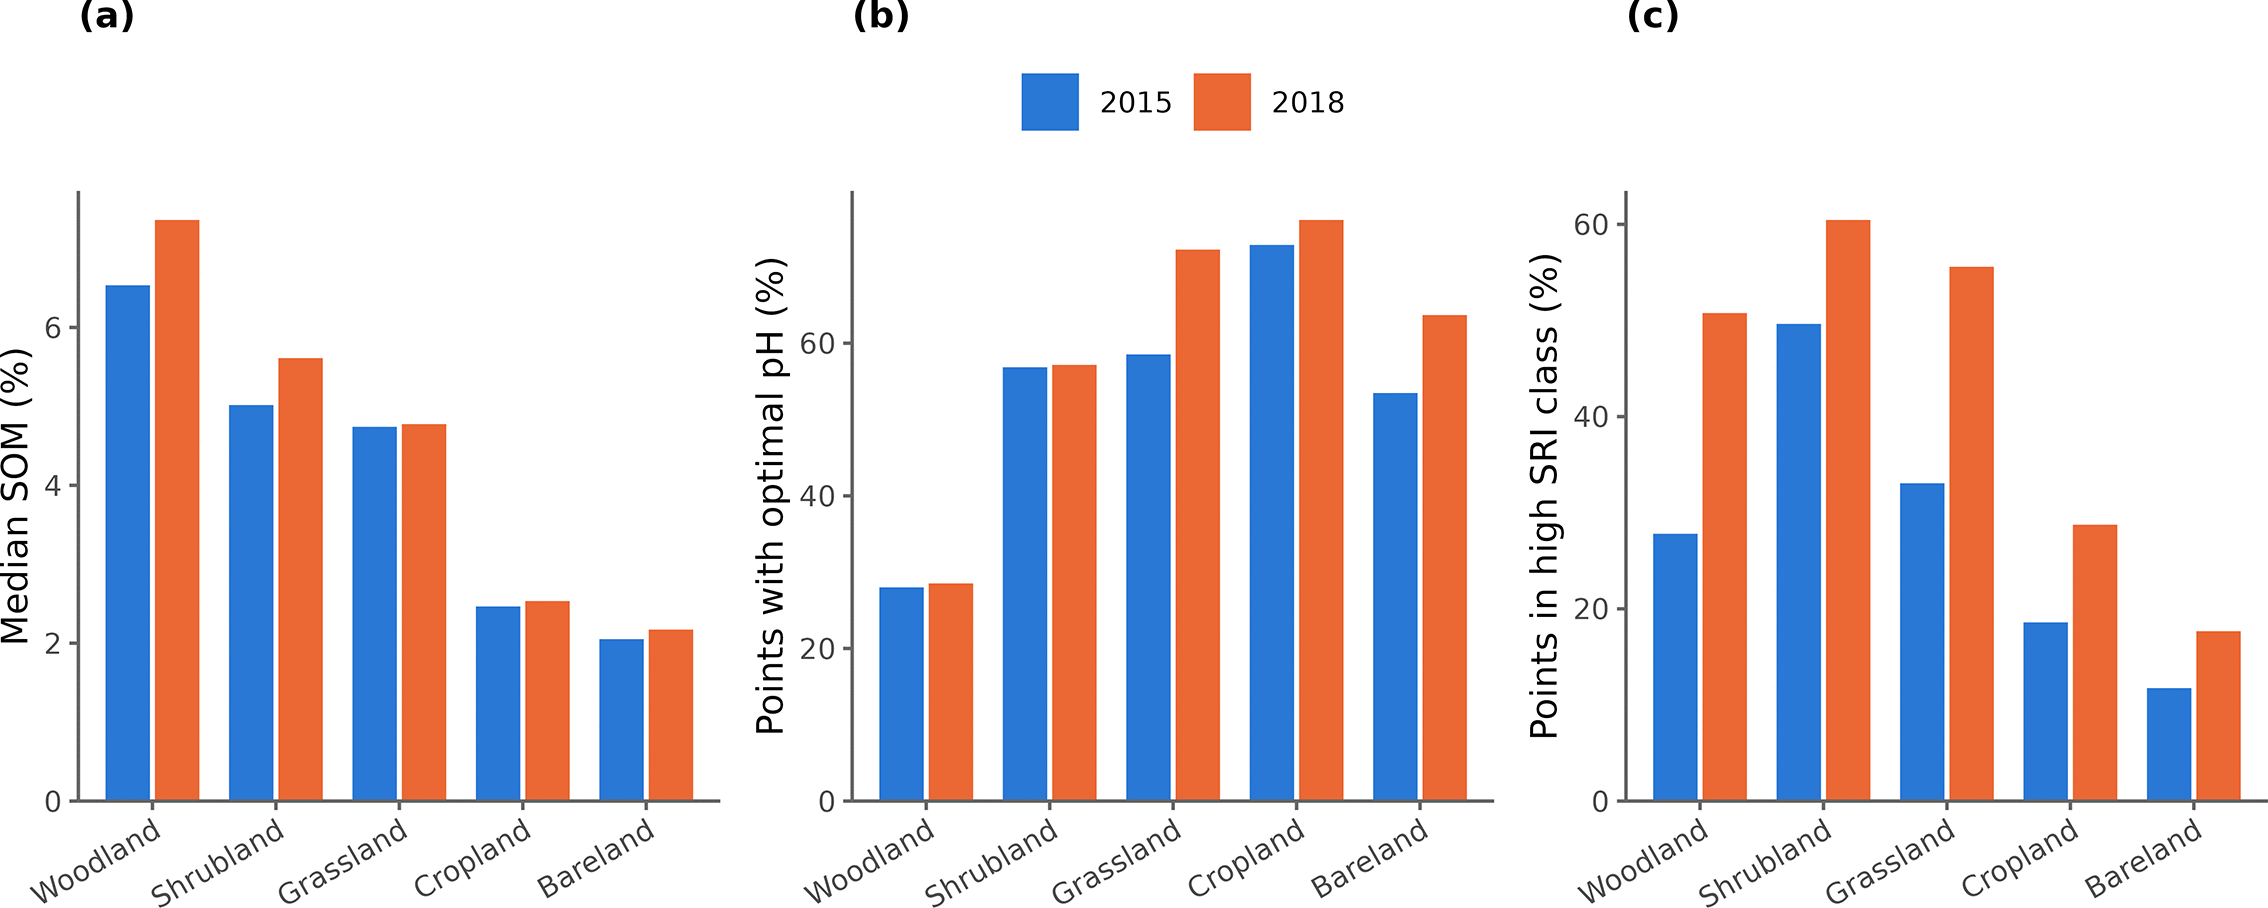
Figure 6. Topsoil indicators by land cover class.
(a) Median soil organic matter, (b) percentage of points with optimal pH (5.5 ≤ pH < 8.0) and (c) percentage of points in the high class of the threshold-based SRI, for LUCAS Topsoil 2015 (blue) and 2018 (orange).
Table 3. LUCAS topsoil indicators by land cover class, 2015 and 2018.
| Land cover | Points 2015/2018 | Median SOM (%) 2015/2018 | Optimal pH (%) 2015/2018 | High SRI class (%) 2015/2018 |
|---|
| Woodland | 6,581/5,991 | 6.5/7.4 | 28.0/28.5 | 27.8/50.8 |
| Shrubland | 846/698 | 5.0/5.6 | 56.9/57.2 | 49.6/60.5 |
| Grassland | 4,751/3,938 | 4.7/4.8 | 58.5/72.3 | 33.1/55.6 |
| Cropland | 8,972/7,335 | 2.5/2.5 | 72.9/76.2 | 18.6/28.8 |
| Bare land | 604/628 | 2.1/2.2 | 53.5/63.7 | 11.8/17.7 |
Change in the SRI between surveys was not robust. With the threshold-based index, the share of points in the high class rose from 25.6% in 2015 to 42.4% in 2018 and the share in the low class fell from 41.5% to 23.8% (
Table 2); the revisited points gave the same result (16,521 points; high class 25.5% to 41.2%). With the linear index the shares hardly changed (high class 34.6% to 31.9%). The two formulations diverge because, at revisited points, median pH increased by 0.12 units and median EC decreased by 1.73 mS m−1 between 2015 and 2018 (both p < 0.001), and the formulations weight these shifts in opposite directions. Changes of this size in three years are more likely to reflect differences in sampling or laboratory procedures than real change in the soil, so the change in the SRI between 2015 and 2018 is not interpreted further.
National soil loss and topsoil condition
Across 27 countries, national soil loss in 2012 was not associated with the median SRI (Spearman ρ = −0.04, p = 0.83), the median SOM (ρ = −0.15, p = 0.44) or the share of points with optimal pH (ρ = 0.07, p = 0.75) (
Figure 7). There was a weak tendency for countries with higher soil loss to have fewer acidic soils (ρ = −0.38, p = 0.054), reflecting the combination of high modelled erosion and calcareous soils in Mediterranean countries and of low erosion and acidic soils in Finland and Sweden. The results were practically unchanged when Denmark and France were excluded (median SRI: ρ = −0.04, p = 0.86; acidic share: ρ = −0.37, p = 0.066; n = 25).
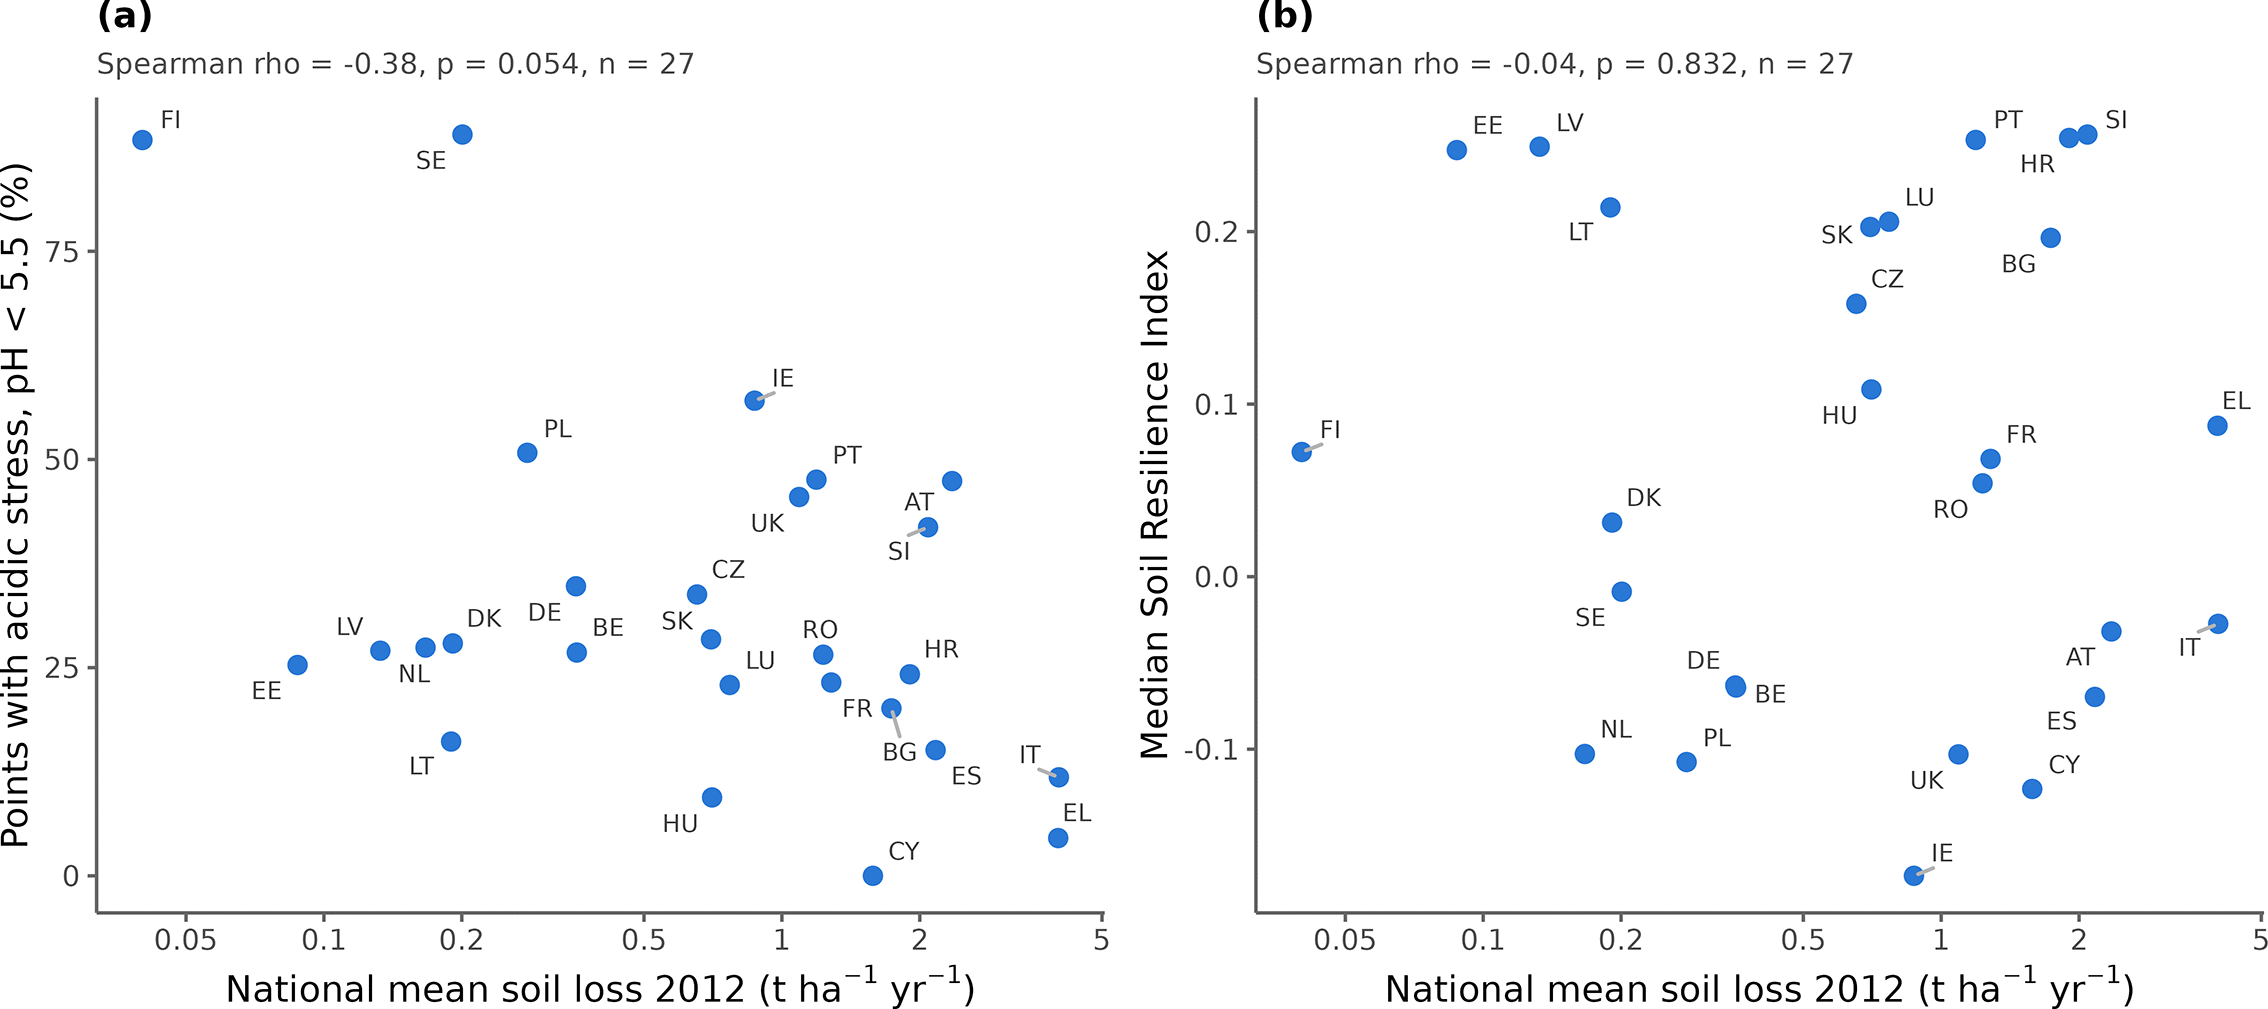
Figure 7. National soil loss and topsoil condition.
National mean soil loss in 2012 (log scale) against (a) the percentage of LUCAS points with acidic stress (pH < 5.5) and (b) the median threshold-based SRI, for 27 countries (2015 and 2018 points pooled; Malta excluded because it had fewer than 30 points). Labels are NUTS country codes.
The same absence of association held at point level. Across 40,501 LUCAS observations from 2015 and 2018, rainfall erosivity was practically unrelated to the SRI (ρ = 0.02) and to SOM (ρ = −0.06), and on cropland the correlation with the SRI was also negligible (ρ = −0.09; n = 16,297). These coefficients are statistically significant only because of the very large sample, and they explain less than 1% of the variation.
Discussion
Erosion pressure and topsoil condition are largely independent
The main finding is that erosion pressure tells little about the chemical condition of the topsoil, both between countries and between individual LUCAS points. Countries with high soil loss, such as Italy, Greece and Spain, had mostly calcareous soils with near-neutral to alkaline pH, while the countries with the lowest soil loss, Finland and Sweden, had predominantly acidic but organic-rich soils. The two properties are controlled by different factors. Soil loss in RUSLE-based models is driven mainly by rainfall erosivity, slope and cover,3,13 as the close correspondence between national soil loss and rainfall erosivity found here confirms, whereas topsoil pH and SOM depend largely on parent material, climate and land use history.5,9 For soil health assessment this means that erosion indicators and chemical indicators provide complementary information, and a region that performs well on one may perform poorly on the other. This supports the multi-descriptor approach of the Directive on soil monitoring and resilience, which requires Member States to assess physical, chemical and biological descriptors together.19
The national analysis has clear limits. Correlations between country aggregates cannot be transferred to individual sites, and 27 countries give limited statistical power, so weak associations may have been missed. Some countries also cover several environmental zones, which averages out contrasts within them. The point-level test with rainfall erosivity reduces this concern, but a comparison with modelled soil loss at each LUCAS point, stratified by climatic zone, would be a useful next step.
Land cover change and modelled soil loss
Because the 2001 and 2012 GloSEM maps differ only in land use and vegetation cover,13 the national changes reported here isolate the effect of land cover change and exclude any effect of changing rainfall. On this basis, land cover change between 2001 and 2012 had only a small net effect on soil loss in most countries. The decreases in Italy and Portugal are consistent with long-term contraction of cultivated land and vegetation recovery in parts of the Mediterranean,8 although this study does not attribute them to particular transitions. The relative increases in Latvia and Lithuania started from very low values and have little practical importance. Climate is likely to matter more in future: rainfall erosivity is projected to raise mean soil loss on EU and UK agricultural land by 13–22.5% by 2050, with the largest increases in central and northern Europe.4
Land cover and topsoil condition
The contrast between woodland and cropland shows that a composite index can hide opposing trends in its components. Woodland soils had the most organic matter but were mostly acidic, whereas cropland soils had little organic matter but largely favourable pH, probably because farmed soils are regularly limed and fertilised. The high index values under grassland and shrubland arise because these soils combine moderate to high SOM with pH values closer to neutral. The loss of soil carbon after conversion of forest or pasture to cropland is well documented,9 and the low SOM of cropland points is consistent with that evidence.
Robustness of composite indices and survey comparisons
The sensitivity analysis showed that both the spatial pattern and the apparent change over time of a composite index depend on how it is specified. A linear combination treats higher pH and higher EC as beneficial, which conflicts with their agronomic meaning2; the threshold-based version is more defensible, but the choice of thresholds remains a judgement. More importantly, the differences in pH and EC between the 2015 and 2018 surveys at the same points were large enough to reverse the apparent direction of change. Temporal analyses of LUCAS chemistry should therefore rely on revisited points, report more than one formulation of any composite index and, where available, use harmonisation factors published by the data producers.16,17 The stability of pH classes between 2009 and 2018 and the small increase in SOM are more reliable than the index change, because they are based on single variables at revisited points.
Implications for EU soil policy
The EU Soil Strategy for 2030 aims for all EU soils to be in healthy condition by 2050,18 and the Directive on soil monitoring and resilience, in force since 16 December 2025, requires harmonised monitoring of soil health.19 The results suggest three practical points. First, erosion and chemical indicators should be assessed and reported separately before they are combined, because they are not interchangeable. Second, composite indices used for reporting should be accompanied by sensitivity analyses of their formulation. Third, detecting change requires repeated measurements at the same locations with consistent methods, which is what LUCAS revisited points provide. The workflow presented here uses data already collected at EU level and is openly available,29 and it could support the targeting of living labs and lighthouses under the EU Mission ‘A Soil Deal for Europe’ and restoration planning under the Nature Restoration Regulation.20
Limitations
GloSEM represents sheet and rill erosion only, not gully or tillage erosion or sediment deposition, and with P set to 1 it does not reflect local conservation practices.24 National means from sovereign-state boundaries include Greenland for Denmark and overseas territories for France, although excluding these countries did not change the results. The K map was derived from LUCAS 2009 soil properties, so it could not serve as an independent predictor of topsoil condition, and the P map describes arable land only. On the LUCAS side, EC was not measured in 2009, sampling density differs between countries, and the theoretical coordinates may differ slightly from the actual sampling locations. The SRI includes no biological or physical indicators such as microbial activity, bulk density or infiltration, which are part of the soil health descriptors in the Directive.19
Conclusions
Across Europe, national modelled soil loss changed little between 2001 and 2012 and was not associated with the physicochemical condition of the topsoil. Topsoil pH was stable over the decade 2009–2018, and SOM increased slightly at revisited points. Topsoil condition differed more between land cover classes than between countries with high and low erosion, and a composite index of that condition proved sensitive both to its formulation and to differences between surveys. Soil resilience therefore has to be assessed on several dimensions at once: erosion pressure and chemical condition should be monitored side by side, composite indices should be tested for sensitivity, and change should be measured at revisited locations.
Ethics and consent
Ethical approval and consent were not required.
Data availability
Underlying data
This study used the following third-party data, which the author is not permitted to redistribute:
Extended data
Zenodo: Pan-European soil resilience: derived erosion and LUCAS Topsoil resilience indicators, figures and R code. https://doi.org/10.5281/zenodo.22943329.29
This project contains the following extended data:
•
glosem_country_mean_soil_loss_2001_2012.csv and country_soil_loss_change_2001_2012.csv and country_soil_loss_summary.csv (national mean soil loss and its change; Figure 1).
•
country_erosion_table1.csv and rusle_factor_spearman_results.csv (national soil loss with mean R, K and P, and correlation results; Table 1).
•
pH_resilience_class_points_2009_2018.csv and soil_resilience_index_points_2015_2018.csv (pH class and SRI values for each LUCAS point).
•
country_LUCAS_vs_soil_loss.csv and country_spearman_results.csv (national aggregates and correlation results; Figure 7).
•
landcover_LUCAS_indicators_2015_2018.csv and landcover_kruskal_tests.csv (Table 3 and Figure 6).
•
class_shares_by_year.csv, paired_change_revisited_points.csv, pH_class_transitions_2009_2018.csv, SRI_class_shares_revisited_points_2015_2018.csv and statistical_results.csv (Table 2 and other results).
•
Figures 1-7 and three extended data figures (pH resilience zones, elevation-pH relationship and the linear SRI).
• README.txt (description of all files, variables and methods).
Data are available under the terms of the Creative Commons Attribution 4.0 International license (CC-BY 4.0).
Acknowledgements
The author thanks the Joint Research Centre of the European Commission and Eurostat for providing the GloSEM and LUCAS Topsoil data. Claude (Anthropic; Opus 5.5 model) was used, to check reference details of the manuscript. All code was run and checked by the author, all results were verified against the data, and the author takes full responsibility for the content of this article.
References
- 1.
Pimentel D, Harvey C, Resosudarmo P, et al.:
Environmental and economic costs of soil erosion and conservation benefits.
Science.
1995; 267(5201): 1117–1123. Publisher Full Text
- 2.
Bünemann EK, Bongiorno G, Bai Z, et al.:
Soil quality – A critical review.
Soil Biol. Biochem.
2018; 120: 105–125. Publisher Full Text
- 3.
Panagos P, Borrelli P, Poesen J, et al.:
The new assessment of soil loss by water erosion in Europe.
Environ Sci Policy.
2015; 54: 438–447. Publisher Full Text
- 4.
Panagos P, Ballabio C, Himics M, et al.:
Projections of soil loss by water erosion in Europe by 2050.
Environ Sci Policy.
2021; 124: 380–392. Publisher Full Text
- 5.
Ballabio C, Lugato E, Fernández-Ugalde O, et al.:
Mapping LUCAS topsoil chemical properties at European scale using Gaussian process regression.
Geoderma.
2019; 355: 113912. PubMed Abstract
| Publisher Full Text
| Free Full Text
- 6.
FAO:
Voluntary Guidelines for Sustainable Soil Management.
Rome:
Food and Agriculture Organization of the United Nations;
2017.
- 7.
Boardman J, Poesen J:
Soil Erosion in Europe.
Chichester:
John Wiley & Sons;
2006. Publisher Full Text
- 8.
García-Ruiz JM, Nadal-Romero E, Lana-Renault N, et al.:
Erosion in Mediterranean landscapes: Changes and future challenges.
Geomorphology.
2013; 198: 20–36. Publisher Full Text
- 9.
Guo LB, Gifford RM:
Soil carbon stocks and land use change: a meta analysis.
Glob Change Biol.
2002; 8(4): 345–360. Publisher Full Text
- 10.
Holling CS:
Resilience and stability of ecological systems.
Annu. Rev. Ecol. Syst.
1973; 4: 1–23. Publisher Full Text
- 11.
Folke C, Carpenter S, Walker B, et al.:
Regime shifts, resilience, and biodiversity in ecosystem management.
Annu. Rev. Ecol. Evol. Syst.
2004; 35: 557–581. Publisher Full Text
- 12.
Carpenter S, Walker B, Anderies JM, et al.:
From metaphor to measurement: Resilience of what to what?.
Ecosystems.
2001; 4(8): 765–781. Publisher Full Text
- 13.
Borrelli P, Robinson DA, Fleischer LR, et al.:
An assessment of the global impact of 21st century land use change on soil erosion.
Nat. Commun.
2017; 8(1): 2013. PubMed Abstract
| Publisher Full Text
| Free Full Text
- 14.
Tóth G, Jones A, Montanarella L:
LUCAS Topsoil Survey: methodology, data and results. EUR 26102 EN.
Luxembourg:
Publications Office of the European Union;
2013.
- 15.
Jones A, Fernandez-Ugalde O, Scarpa S:
LUCAS 2015 Topsoil Survey: Presentation of dataset and results. EUR 30332 EN.
Luxembourg:
Publications Office of the European Union;
2020. Publisher Full Text
- 16.
Fernandez-Ugalde O, Scarpa S, Orgiazzi A, et al.:
LUCAS 2018 Soil Module: Presentation of dataset and results. EUR 31144 EN.
Luxembourg:
Publications Office of the European Union;
2022. Publisher Full Text
- 17.
Orgiazzi A, Ballabio C, Panagos P, et al.:
LUCAS Soil, the largest expandable soil dataset for Europe: a review.
Eur. J. Soil Sci.
2018; 69(1): 140–153. Publisher Full Text
- 18.
European Commission:
EU Soil Strategy for 2030: Reaping the benefits of healthy soils for people, food, nature and climate. COM(2021) 699 final.
Brussels:
2021.
- 19.
European Parliament and Council of the European Union:
Directive (EU) 2025/2360 of 12 November 2025 on soil monitoring and resilience.
Official Journal of the European Union;
26 November 2025.
- 20.
European Parliament and Council of the European Union:
Regulation (EU) 2024/1991 on nature restoration and amending Regulation (EU) 2022/869.
Official Journal of the European Union;
29 July 2024.
- 21.
Panagos P, Borrelli P, Meusburger K, et al.:
Global rainfall erosivity assessment based on high-temporal resolution rainfall records.
Sci. Rep.
2017; 7(1): 4175. PubMed Abstract
| Publisher Full Text
| Free Full Text
- 22.
Panagos P, Ballabio C, Borrelli P, et al.:
Rainfall erosivity in Europe.
Sci. Total Environ.
2015; 511: 801–814. Publisher Full Text
- 23.
Panagos P, Meusburger K, Ballabio C, et al.:
Soil erodibility in Europe: A high-resolution dataset based on LUCAS.
Sci. Total Environ.
2014; 479-480: 189–200. PubMed Abstract
| Publisher Full Text
- 24.
Panagos P, Borrelli P, Meusburger K, et al.:
Modelling the effect of support practices (P-factor) on the reduction of soil erosion by water at European scale.
Environ Sci Policy.
2015; 51: 23–34. Publisher Full Text
- 25.
Pribyl DW:
A critical review of the conventional SOC to SOM conversion factor.
Geoderma.
2010; 156(3–4): 75–83. Publisher Full Text
- 26.
R Core Team:
R: A language and environment for statistical computing.
Vienna, Austria:
R Foundation for Statistical Computing;
2023.
- 27.
Pebesma E:
Simple Features for R: Standardized Support for Spatial Vector Data.
R J.
2018; 10(1): 439–446. Publisher Full Text
- 28.
Wickham H:
ggplot2: Elegant Graphics for Data Analysis.
New York:
Springer;
2nd ed2016. Publisher Full Text
- 29.
Toumasis N:
Pan-European soil resilience: derived erosion and LUCAS Topsoil resilience indicators, figures and R code. [Dataset and software].
Zenodo.
2026. Publisher Full Text







