1. Introduction
Dairy production is one of the most important agro-industries in the planet. This production of milk is expected to keep increasing, with estimates of 1.7% annual rate increase up to 981 Mt by 2028 (Moscovici Joubran et al., 2021). The production of dairy generates increasing amounts of wastewater and sludge with over 2.4 million tons of dairy processing waste (DPW) produced in Europe in 2020 (Hu et al., 2021; Velasco-Sánchez, 2024). DPW are considered nutrient rich by products that could be used directly as fertilizers or as source materials for nutrient recovery (Ashekuzzaman et al., 2021; Hu et al., 2021; Shi et al., 2022b).
One of the most relevant nutrients in DPW is phosphorus (P), which can exceed 5% of its dry weight, making DPW a valuable P fertilizer (Ashekuzzaman et al., 2019). In addition, due to the existing regulations in the dairy production sector it is expected that the contaminants in DPW are in lower concentrations compared to other types of industrial byproducts (Delgado Sancho et al., 2019). Consequently, significant efforts have been put into studying the fertilizer potential of DPW (Shi et al., 2022b; Khomenko et al., 2023; Velasco-Sánchez et al., 2025), their impact in the environment (Frąc and Jezierska-Tys, 2011; Hu et al., 2023), their use as source to produce other P fertilizers (Numviyimana et al., 2020; Khalaf et al., 2022), or their life cycle assessment (Behjat et al., 2022).
One of the main concerns of DPW is heterogeneity. The nutrient composition of DPW can change across different production plants (Ashekuzzaman et al., 2019). This is because the techniques used to precipitate P from wastewater or to stabilize solid DPW are notably different between plants. For example, some plants use limestone to stabilize DPW or they add iron and aluminium chlorides to precipitate P (Shi et al., 2021). Furthermore, the properties of DPW can vary during the year and be dependent on the marketed product of each factory (e.g. cheese, butter, yogurt, etc.) (Ashekuzzaman et al., 2019; Shi et al., 2021). Finally, the properties of DPW can vary across countries because of different legislations in wastewater treatment (Kellis et al., 2013; Román-Sánchez et al., 2015; Collivignarelli et al., 2019). However, the potential effects of this heterogeneity in treatments and legislations on physicochemical properties remain largely unknown.
Current legislation is reducing the threshold for contamination in recycled fertilizers. In Europe, the most recent fertilizer legislation (EU Regulation 2019/1009) classifies potential fertilizing materials into Product Function Categories (PFCs) and Component Material Categories (CMCs) (
European Commission, 2019). DPW could fall under PFC 1 (Fertilizer), particularly in subcategories such as A (organic fertilizer) or B (solid organic fertilizer), and under CMC 6 (food industry by-products). The regulation provides precise limits for the levels of contaminants allowed in fertilizing materials. Concentration of cadmium (Cd), chromium (Cr), mercury (Hg), nickel (Ni), lead (Pb), arsenic (As), copper (Cu), zinc (Zn) and biuret (C2H5N3O2) must comply certain thresholds which have been reinforced compared to previous standards. In addition, guidelines are provided regarding the acceptable levels of pathogens (Faecal coliforms and Salmonella spp.) in recycled fertilizers. Data remains too sparse to conclude whether DPW are within or beyond those safety limits defined by the EU.
In this manuscript, we visited and characterized the DPW from 10 dairy processing plants producing various dairy products in northern France. Our objective was to survey the nutrient, pollutant content and biological contamination of DPW and to assess their fertilizer potential in accordance with the current EU Regulation 2019/1009.
2. Materials and methods
2.1 Plant description, sample collection and preparation
Samples were collected during the summer of 2020 from 10 different dairy processing plants located in northern France, more precisely in the regions of Normandy, Hauts-de-France, and Centre-Val de Loire. For confidentiality reasons, the names of each plant are not disclosed; instead, each plant received an identification code ranging from 1 to 10. The plants produced either solely yogurt (4), cheese (3), butter (1), or a wide array of products (2). At the time of sampling, the DPW generated by these plants was being disposed on nearby agricultural fields.
At each plant, DPW was collected, when possible, from the sludge storage tank (
Figure 1). When this was not feasible for accessibility reasons, we collected our sample just before the DPW was discharged into the sludge storage tank. Additionally, we collected operational information from each plant from site managers. A composite representative sample of at least 10 kg of DPW was collected at each plant between the 3rd and the 19th of June of 2020.
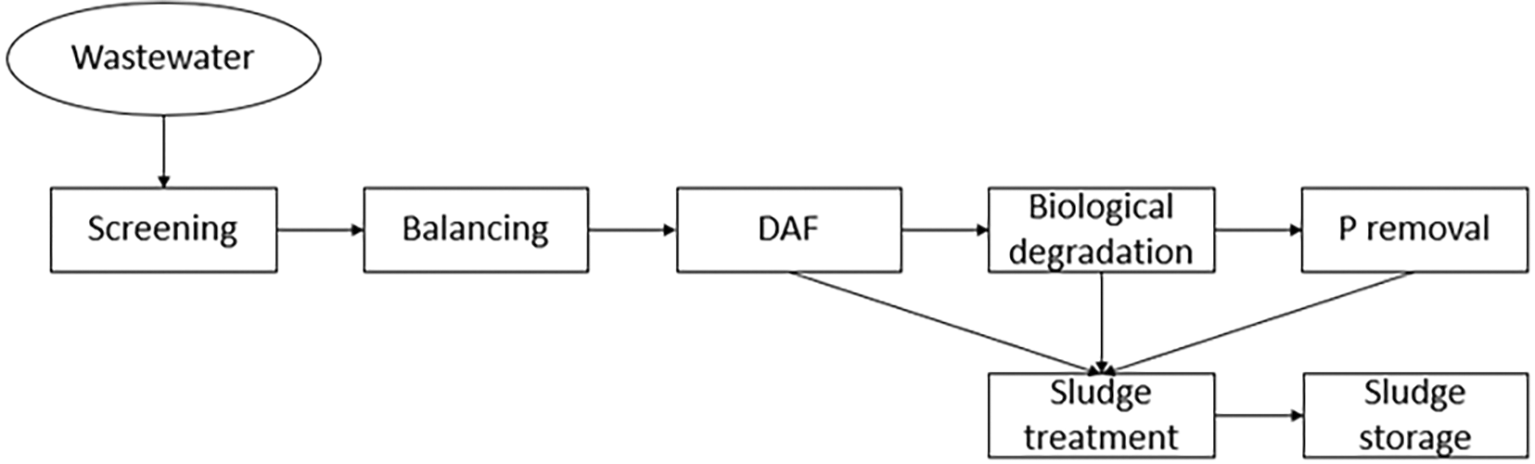
Figure 1. Simplified flow chart of a dairy wastewater treatment plant.
Adapted from Shi et al. (2021). Screening = Removal of large particles, Balancing = Homogenization of flow and composition, DAF = Dissolved Air Flotation, degrease, Biological degradation = aerobic and anaerobic treatments, P removal = biological or chemical precipitation of P and Sludge treatment = thickening and dewatering.
After the samples were collected, they were further homogenised and a subsample was taken and freeze-dried. Then, the dried samples were milled, sieved, and homogenized using a 1 mm mesh. Fresh DPW samples were stored at 4 °C, while the dried ones were stored in hermetically closed jars at room temperature.
2.2 Sample analyses
2.2.1 Chemical analyses
The chemical characterization of DPW was performed on dried samples. Carbon (C) and nitrogen (N) contents were determined using a CHNS elemental analyser (FlashSmart™Thermo Scientific, Waltham, U.S.A.). Water soluble C (WSC) was also quantified by mixing 4 g of dried DPW sample with 30 mL of ultra-pure water, followed by agitation for 30 min at 150 rpm in an orbital shaker. The mixture was then centrifuged for 20 min at 3000 rpm and C was measured using a liquid total C analyser (TOC-V CSH, Shimadzu, Kyoto, Japan) (Ghani et al., 2003). The relative proportion of soluble C (Crel) was calculated as the ratio of WSC to total carbon.
Two different fractions of P were measured. Firstly, sodium bicarbonate extractable P (P-NaHCO3) was measured by shaking 5 g of dried DPW sample with 100 mL of a 0.5 M solution of NaHCO3 (pH 8.5) for 30 min at 150 rpm in an orbital shaker. To reduce the colour interference from the organic material, 1 g of P-free activated charcoal was added. After filtration through a whatmann paper filter (porosity 5–8 μm), P concentration was determined colorimetrically using the sulfomolibdic blue coloration method at 825 mm in a spectrophotometer (Cary 50 Scan, Varian, Palo Alto, USA) (ISO 11263:1994). We also measured total P in dried DPW samples. Total P was measured with an Agilent 5800 ICP-OES (Agilent Technologies, Santa Clara, USA) after calcination of 0.2 g of DPW samples at 450 °C for 3 h, followed by extraction with 20 mL of 3.5 M HCl for 16 h (Ghanim et al., 2018). The relative proportion of soluble phosphorus (Prel) was calculated as the ratio of P-NaHCO₃ to total P.
The same extract used for the determination of total P was used to measure the total concentration of nutrients, micronutrients and inorganic pollutants by ICP-OES. We measured the following nutrients: potassium (K), aluminium (Al), calcium (Ca), iron (Fe), magnesium (Mg), manganese (Mn), sodium (Na) and zinc (Zn), and the following pollutants: cadmium (Cd), chromium (Cr), nickel (Ni) and lead (Pb).
Electrical conductivity (EC) and pH were measured in a 1:5 (v:v) suspension of dried DPW samples in ultra-pure water after shaking for 1 h (ISO 10390: 2005). Both EC and pH were measured in the same extract using a dual pH/conductometer instrument (SevenMulti, Mettler Toledo, Greifensee, Switzerland).
2.2.2 Biological analyses
The abundance of faecal coliforms and the presence of salmonella (Salmonella spp.) was assessed in fresh DPW samples. 25 g of fresh DPW was homogenized with 225 ml buffered peptone water. 3 ml of this preparation were diluted and transferred to VRBL medium (Violet Red Bile Lactose) and then incubated 24 h at 44 °C for faecal coliforms enumeration. Results are given as CFU g−1. For salmonella detection, the preparation was pre-enriched 24 h at 37 °C. Then, 100 μl were transferred to RVS medium (Rappaport Vassiliadis Soja) and incubated 24 h at 41.5 °C. After the enrichment, salmonella was detected using singlepath® immunological lateral flow tests (Merck, Darmstadt, Germany).
2.2.3 Physical analyses
The physical structure of dried DPW was evaluated through particle size distribution and particle morphology. Particle size was determined using laser diffraction with a Mastersizer 2000 analyzer equipped with the SIROCCO 2000 dry dispersion module (Malvern Instruments, Malvern, UK).
The shape of the dried DPW particles was assessed by observing the samples through a scanning electron microscope (SEM) (JEOL-JSM100 Scanning Electron microscope, Tokyo, Japan) under 15 kV at magnifications ranging from 50x to 1000x.
2.2.4. Thermal analyses
Thermal properties of dried DPW samples were assessed using thermogravimetric analysis (TGA) with TG 209 F1instrument (NETZSCH, Selb, Germany), equipped with a high-precision balance. Between 12 to 34 mg of powdered sample (1 mm) were placed in alumina (Al2O3) crucibles for combustion under an oxidizing atmosphere (80% N2/20% O2) at a flow rate of 30 mL min−1. The combustion range is from 25 °C (ambient temperature) to 900 °C with constant heating rate of 10 K min−1 to ensure complete combustion of the material. During combustion, the TGA results were recorded in real-time on a computer as thermograms with exothermic peaks, allowing the determination of mass loss (%) through the TG curve. The onset and the end temperatures of TGA event were identifies using the first derivative of the TG signal (DTG). Key thermal parameters derived from the analysis are summarized in the supplementary material (
Table 1).
Table 1. Description of the parameters obtained from thermogravimetric analysis (TGA) of dried DPW samples.
| Measurements | Description |
|---|
| Total Loss (TG), % | Percentage of total organic mass loss relative to the initial mass of the sample, measured between 25 °C and 900 °C |
| TGn, % | Percentage of mass loss from a peak relative to the total organic mass loss of the sample |
| Residues, % | Residual mass at the end of the combustion |
| T_Peak, °C | Temperature of organic degradation |
| T_OOnset, °C | Onset temperature of organic degradation |
| T_Max, °C | Corresponds to the peak of the DTG curve where the rate of mass loss is at its maximum. |
| T_5%, °C | Temperature corresponding to 5% of mass loss |
| T_50%,°C | Temperature corresponding to 50% of mass loss |
| T_EEnd, °C | Final temperature of organic degradation |
| Peak-number
| Number of degradation steps identified from the DTG curves |
3. Results
3.1 Dairy factories description
The ten dairy processing plants visited exhibited a great heterogeneity in terms of sizes, product types and wastewater treatment processes (
Table 2). None of the 10 plants treated their wastewater in a similar manner. The most common step among all the plants was the use of polymers to coagulate the DPW, implemented in 8 out 10 plants. The addition of chelants to precipitate P from wastewater was also common in 7 out 10 plants. With iron chloride being the favourite as 6 plants made use of it, while aluminium chloride was applied in only one plant. The removal of lipids (degrease) was performed in 4 plants. Lastly, the addition of limestone for stabilization and sanitation of DPW was reported in 2 plants. These variations highlight the diversity of operational strategies across the sector.
Table 2. Overview of DPW samples and more common chemical additives used in the wastewater treatment.
Multiple = more than one single product.
| Plant | Main product | Polymer | Degrease | Iron chloride | Aluminium chloride |
Lime |
|---|
| 1 | Multiple -milk/desserts/multiproducts | X | | | | |
| 2 | Cheese - soft-ripened cheese | X | | X | | |
| 3 | Cheese - soft-ripened cheese | | | | | |
| 4 | Cheese - fresh cheese | X | X | | | |
| 5 | Yogurt | X | X | X | | |
| 6 | Yogurt | X | | X | | X |
| 7 | Butter | X | X | | X | |
| 8 | Multiple - butter/cheese/multiproducts/dessert/milk powder | X | X | X | | X |
| 9 | Yogurt | | | X | | |
| 10 | Yogurt | X | | X | | |
3.2 Nutrient content and chemical properties
DPW samples were principally composed of C with a mean value of 307.37 ± 91.74 g kg−1 (
Table 3). The C content in DPW was highly soluble in water, with an average WSC content of 32.41 ± 22.37 g kg−1, representing approximately 12% of the total C average content. N was the second most abundant nutrient in DPW with an average content of 56.26 ± 17.87 g N kg−1. P was also abundant in DPW with an average content of 25.47 ± 23.77 g kg−1.
Table 3. Carbon (C) content and average macronutrients of the assessed dairy production plants.
Results are shown in g kg−1 for C, WSC, N, P, P-NaHCO3 and K. WSC = Water soluble C, Crel = relative proportion of soluble C, Prel = relative proportion of soluble P. EU limit represents the minimum thresholds for more than one declared primary nutrient (10, 4 and 8 g kg−1 for N, P and K respectively), or only one declared primary nutrient (25, 9 and 17 g kg−1 for N, P and K respectively), according to the Regulation (EU) 2019/1009 for PFC 1 A.
| Plant | C | WSC | Crel | N | P | P-NaHCO3 | Prel |
K |
|---|
| 1 | 188.03 | 41.16 | 0.22 | 36.05 | 11.51 | 0.29 | 0.03 | 5.15 |
| 2 | 182.02 | 10.27 | 0.06 | 38.31 | 58.22 | 0.27 | 0.00 | 4.72 |
| 3 | 297.35 | 9.48 | 0.03 | 57.24 | 77.91 | 0.35 | 0.00 | 7.65 |
| 4 | 440.56 | 24.34 | 0.06 | 82.48 | 11.47 | 0.17 | 0.01 | 3.38 |
| 5 | 376.71 | 11.39 | 0.03 | 71.79 | 29.76 | 0.18 | 0.01 | 4.11 |
| 6 | 226.4 | 82.12 | 0.36 | 41.28 | 5.36 | 0.22 | 0.04 | 2.34 |
| 7 | 312.99 | 27.44 | 0.09 | 48.79 | 12.68 | 0.24 | 0.02 | 5.27 |
| 8 | 318.31 | 49.77 | 0.16 | 46.33 | 14.84 | 0.29 | 0.02 | 5 |
| 9 | 296.25 | 26.93 | 0.09 | 55.22 | 13.94 | 0.19 | 0.01 | 6.28 |
| 10 | 435.09 | 41.16 | 0.09 | 85.11 | 19.05 | 0.27 | 0.01 | 1.71 |
| Mean | 307.37 | 32.41 | 0.12 | 56.26 | 25.47 | 0.25 | 0.02 | 4.56 |
| St. dev. | 91.74 | 22.37 | 0.10 | 17.87 | 23.77 | 0.06 | 0.01 | 1.77 |
| Median | 305.17 | 27.19 | 0.09 | 52.01 | 14.39 | 0.26 | 0.01 | 4.86 |
| EU limit | 150 | -- | -- | 10/25 | 4/9 | -- | -- | 8/17 |
The amount of P was also very variable across the plants, the lowest total P content was found in plant 6 with 5.36 g kg−1, while the highest was recorded in plant 3 with 77.91 g kg−1. On the other hand, the amount of available P (P-NaHCO3) was relatively low, with a mean value of 0.25 ± 0.06 g·kg−1, less than 3% of the total P. The amount of K was the lowest among the macronutrients with an averaged value of 4.56 ± 1.77 g kg−1. All plants were eligible to be considered solid organic fertilizers of N and P according to the (EU) 2019/1009 regulation.
DPW samples were also rich in micronutrients relevant for agronomic application (
Table 4). The most common micronutrient in DPW was Ca with an averaged content 110.09 g kg−1, followed by Fe 53.78 g kg−1, Na 8.84 g kg−1, Al 2.77 g kg−1, Mg 2.73 g kg−1, Zn 0.18 g kg−1 and Mn 0.1 g kg−1. The content of Al was, as expected, increased significantly due to addition of aluminium chloride during the treatment process in plant 7.
Table 4. Average micronutrients in DPW.
Results are shown in g kg−1.
| Plant | Al | Ca | Fe | Mg | Mn | Na |
Zn |
|---|
| 1 | 0.08 | 142.32 | 0.22 | 2.34 | 0.01 | 6.75 | 0.09 |
| 2 | 1.84 | 64.04 | 170.42 | 2.11 | 0.27 | 11.40 | 0.12 |
| 3 | 0.23 | 147.97 | 0.53 | 4.86 | 0.04 | 7.23 | 0.12 |
| 4 | 0.25 | 35.18 | 0.91 | 2.30 | 0.01 | 10.07 | 0.14 |
| 5 | 0.27 | 64.21 | 96.73 | 2.12 | 0.14 | 12.06 | 0.25 |
| 6 | 0.63 | 300.23 | 1.12 | 3.08 | 0.03 | 8.40 | 0.19 |
| 7 | 23.77 | 10.48 | 0.23 | 2.40 | 0.01 | 6.01 | 0.08 |
| 8 | 0.28 | 174.15 | 17.38 | 3.64 | 0.10 | 6.91 | 0.41 |
| 9 | 0.16 | 111.94 | 33.38 | 2.42 | 0.07 | 12.41 | 0.20 |
| 10 | 0.21 | 50.39 | 216.90 | 2.02 | 0.28 | 7.14 | 0.17 |
| Mean | 2.77 | 110.09 | 53.78 | 2.73 | 0.10 | 8.84 | 0.18 |
| St. dev. | 7.40 | 85.67 | 80.24 | 0.90 | 0.10 | 2.43 | 0.10 |
| Median | 0.26 | 88.08 | 9.25 | 2.37 | 0.06 | 7.82 | 0.15 |
The pH in DPW samples was generally alkaline across most treatment plants with the exception of plant 7, which was treated with aluminium chloride (
Table 5). The addition of lime increased the pH as shown in plants 6 and 8, which were above 12. The EC showed an average conductivity of 5.89 ± 2.73 mS cm−1. The addition of lime exhibited also an increase in EC, limed samples showed an average EC of 9.45 mS cm−1 whereas non-limed samples averaged 5.01 mS cm−1.
Table 5. pH and electrical conductivity (EC) of the collected sludge.
EC values are expressed in mS cm−1.
| Plant | pH |
EC |
|---|
| 1 | 8.15 | 3.38 |
| 2 | 8.47 | 8.73 |
| 3 | 7.91 | 4.51 |
| 4 | 8.54 | 4.20 |
| 5 | 8.49 | 2.84 |
| 6 | 12.33 | 7.61 |
| 7 | 6.77 | 5.10 |
| 8 | 12.39 | 11.28 |
| 9 | 8.53 | 7.31 |
| 10 | 7.85 | 3.95 |
| Mean | 8.94 | 5.89 |
| St. dev. | 1.88 | 2.73 |
| Median | 8.48 | 4.81 |
3.3 Particle shapes, sizes and TGA
A SEM analysis at ×100 magnification was conducted to observe the surface characteristics of the sludge powder and to provide information on its morphology and texture. DPW samples showed a great variability in shapes and sizes across the visited plants. Firstly, the shapes of the particles were markedly different across DPW samples (
Figure 2). We observed that particles of DPW have irregular shapes and presented very sharp and rough edges in plants 1, 2, 3, 4, 6, 9 and 10, while the edges of plants 5, 7 and 8 were less pronounced. The number of particles per plant is relatively high, indicating a fine dispersion of the powdered material, particularly for plants 2 and 8.
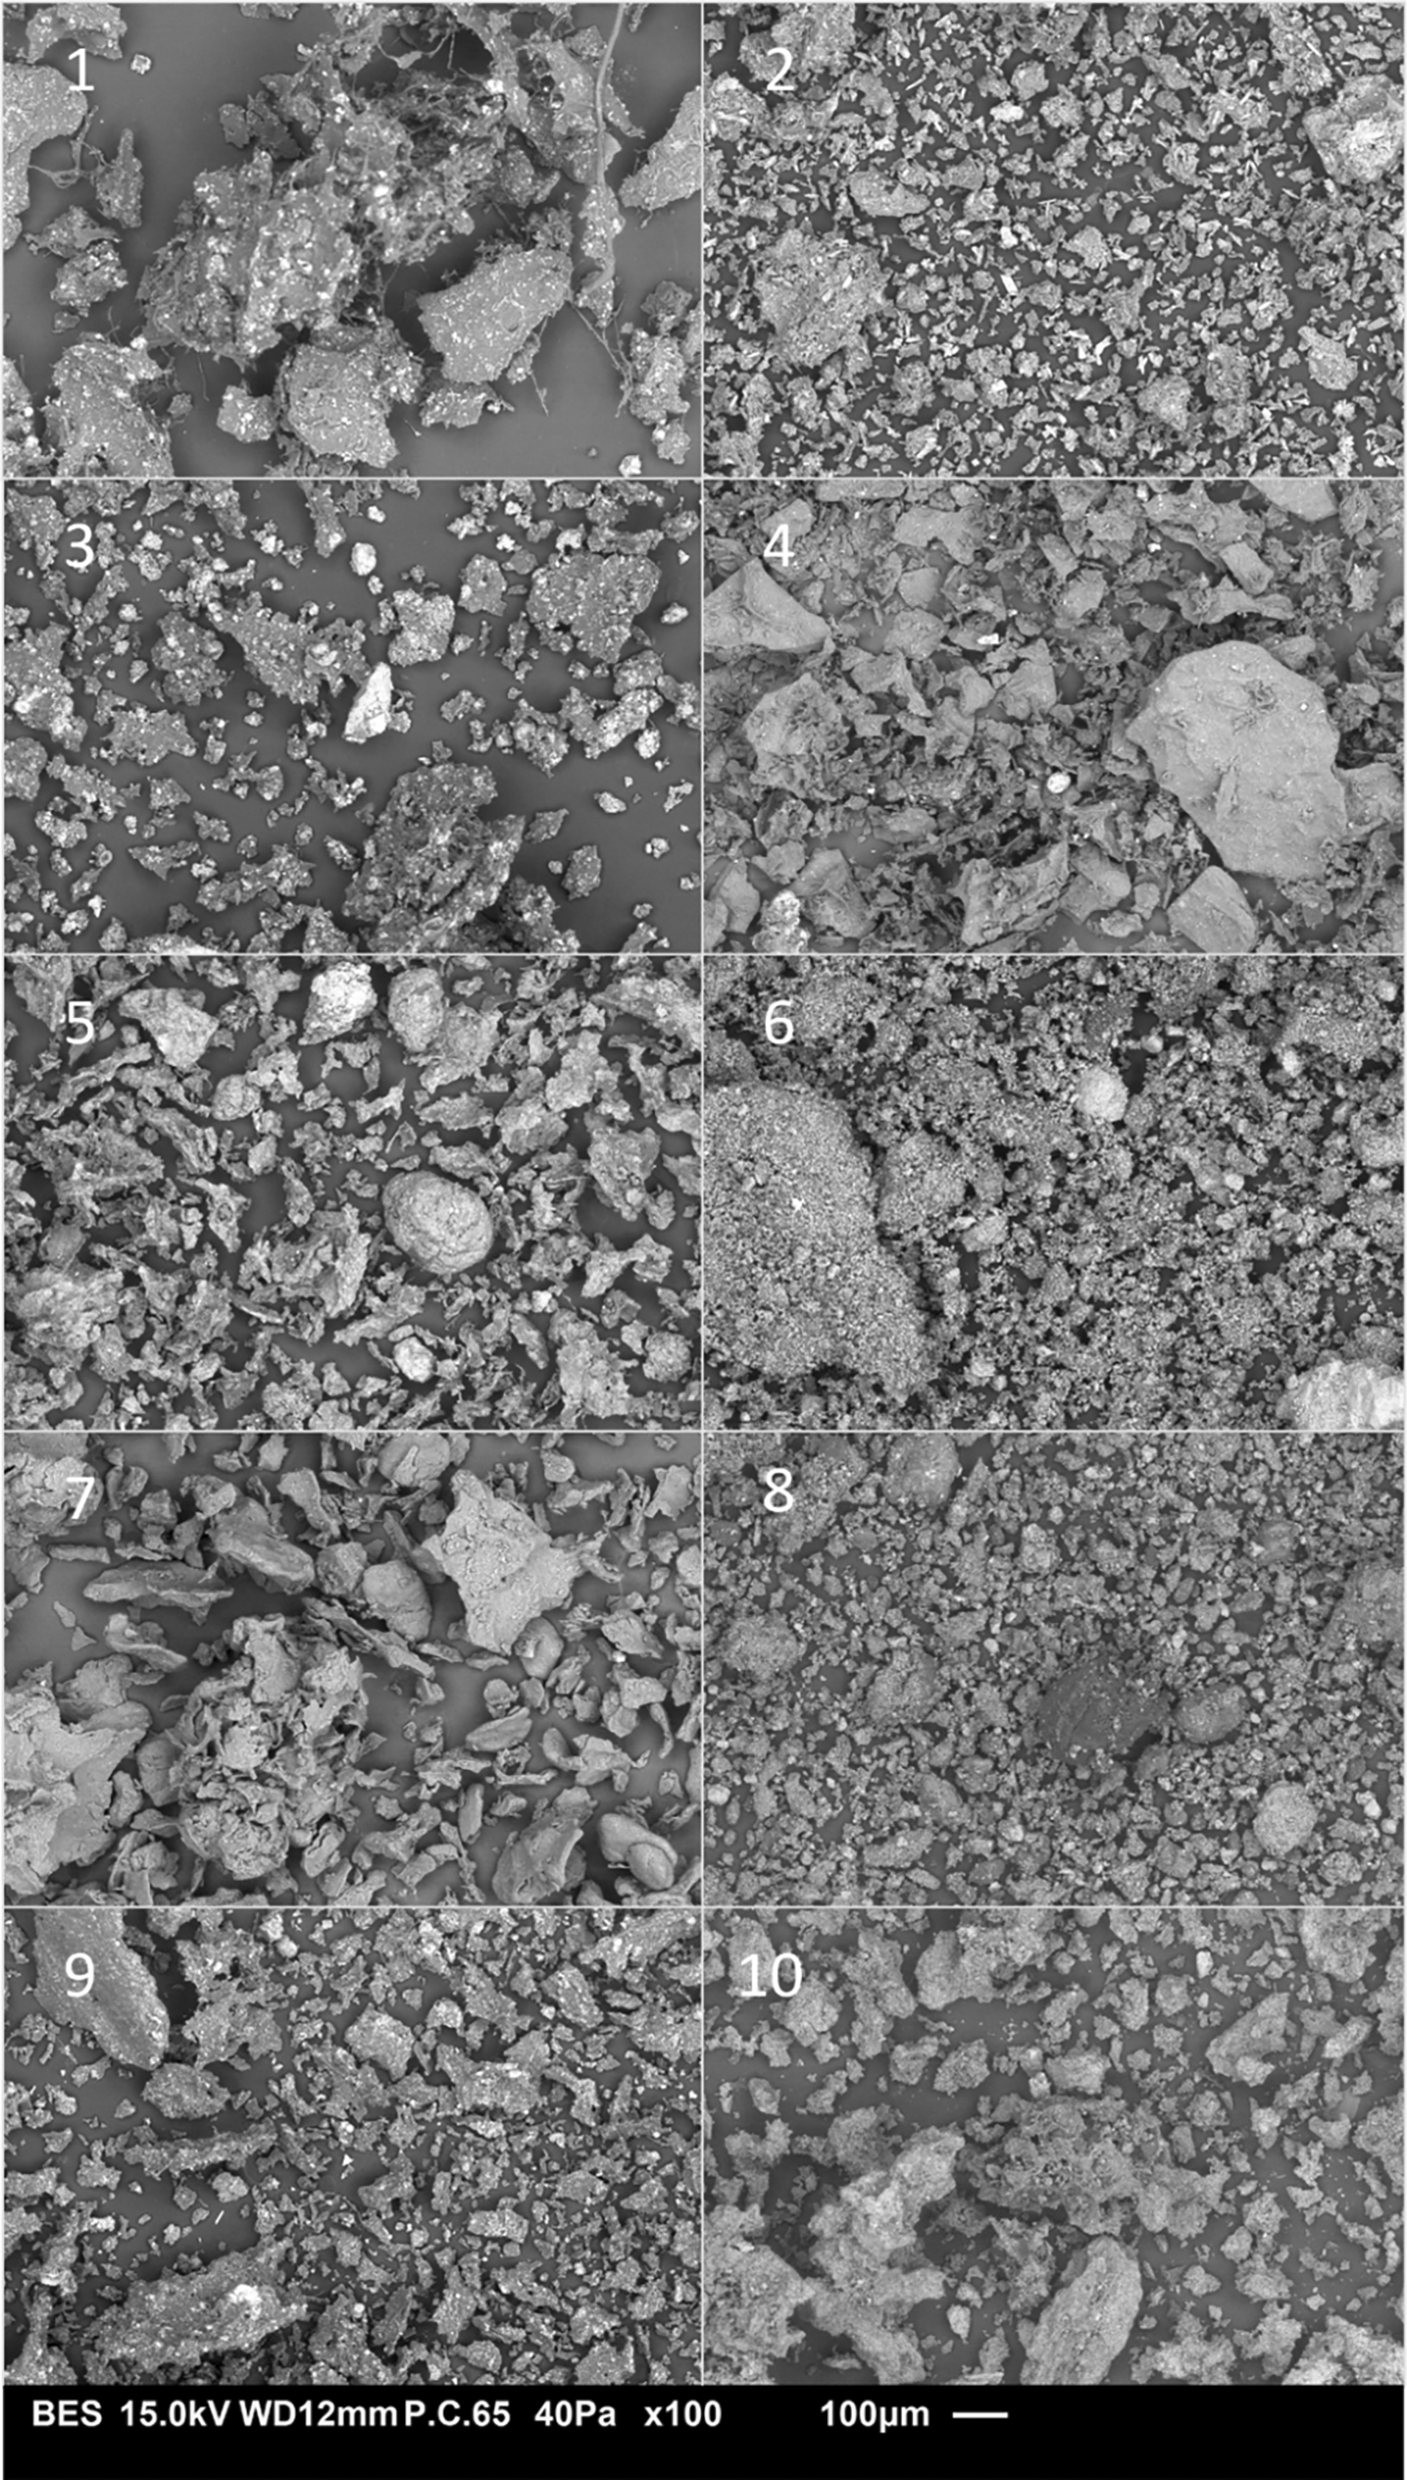
Figure 2. Images of DPW taken with SEM microscope at x100 magnification.
Numbers 1–10 indicate the DPW plants. Adapted from Velasco-Sánchez, 2024.
We also observed wide differences in the size of the particles or aggregates. The DPW from plants 1, 4, 5 and 7 showed to be bulky, exhibiting large particles or aggregates greater than 50 μm, the DPW from plants 2, 3 and 8 showed very small particles and the size of the particles of plants 6, 9 and 10 showed to be composed by a mixture of larger and smaller particles. We also observed in these images denser or brighter particles, which may contain mineral residues, similar to those found in the sludge from plants 1, 2, 3, and 9.
Similarly, DPW samples showed that most of the particles had a size between 50 and 250 μm (
Figure 3). Plant 1 showed the largest, on average, particle size with the percentage of particles between 250 and 450 μm. Plant 6 showed the smallest average particle size, being 40.52% of its particle in the range of 0 to 50 μm. We could not associate any of the treatments or end final product type with the particle size or shape of the studied DPW samples.
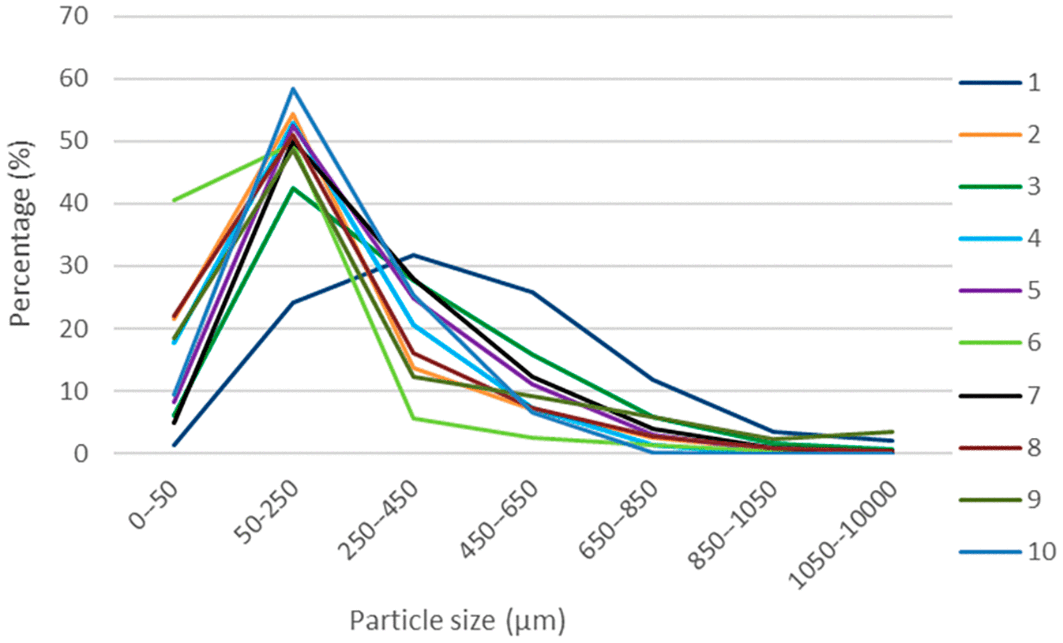
Figure 3. Particle size distribution of the studied DPW samples.
Numbers 1–10 indicate the DPW plants.
The thermal degradation measurements of the DPW samples showed an average total mass loss of 66.55 ± 11% with values ranging from 48.54% for plant 2 to 86.85% for plant 4 over 25 to 900 °C temperature range (
Table 6). The temperature at which 50% of the mass is lost during thermogravimetric analysis (T50) ranged from 161.1 °C for Plant 10 to 898.8 °C for Plant 2. Both Plants 2 and 6, which were stabilized through lime addition, showed the highest T50 values (
Table 6).
Table 6. Thermogravimetric analysis parameters of the collected sludge.
| Plant | Total loss, % (25–900 °C) | Final residues, % (900 °C) | T50 (°C) | Number of exothermic peaks |
|---|
| 1 | 71,25 | 28,75 | 494,5 | 3 |
| 2 | 48,54 | 51,46 | 898,8 | 4 |
| 3 | 57,03 | 42,97 | 534,7 | 3 |
| 4 | 86,85 | 13,15 | 373,6 | 4 |
| 5 | 62,78 | 37,22 | 418,7 | 4 |
| 6 | 55,84 | 44,16 | 751,2 | 4 |
| 7 | 83,15 | 16,85 | 350,6 | 3 |
| 8 | 66,42 | 33,58 | 496 | 4 |
| 9 | 70,12 | 29,88 | 470,2 | 4 |
| 10 | 63,52 | 36,48 | 161,1 | 3 |
| Mean | 66,6 | 33,5 | 494,9 | -- |
| St. dev. | 11,9 | 11,9 | 206,5 | -- |
| Median | 64.97 | 35.03 | 482.35 | -- |
Based on the DTG curves (
Figure 4), between 3 and 4 peaks were observed, ranging from 237 °C for the first exothermic peak to 728 °C for the last. The broad shape of the first thermal zone DTG peak generally reflects the presence of water bound within the ground sample. Thermal zone II (237.7 °C to 288.5 °C) corresponds probably to the combustion of simple and labile organic compounds, with an average decomposition rate of – 3.12 ± 0.77% min−1. The onset temperature for degradation of aliphatic compound varied among samples, occurring as early as 119.3 °C for DPW 9 and 144.2 °C for DPW 4, and as late as 286 °C for DPW 7, highlighting a difference in organic matter composition across the ten sludge samples. The combustion zone between 405.5 °C and 557.8 °C (Zone III) corresponds probably to the thermal degradation of recalcitrant organic matter. The final decomposition stage (zone IV) involves the transformation of complex mineral phases, such as calcium phosphates. Beyond 700 °C, the remaining residue corresponds to the inorganic fraction, which varies between 13.15% and 51.46% of the initial mass, depending on the sludge characteristics.
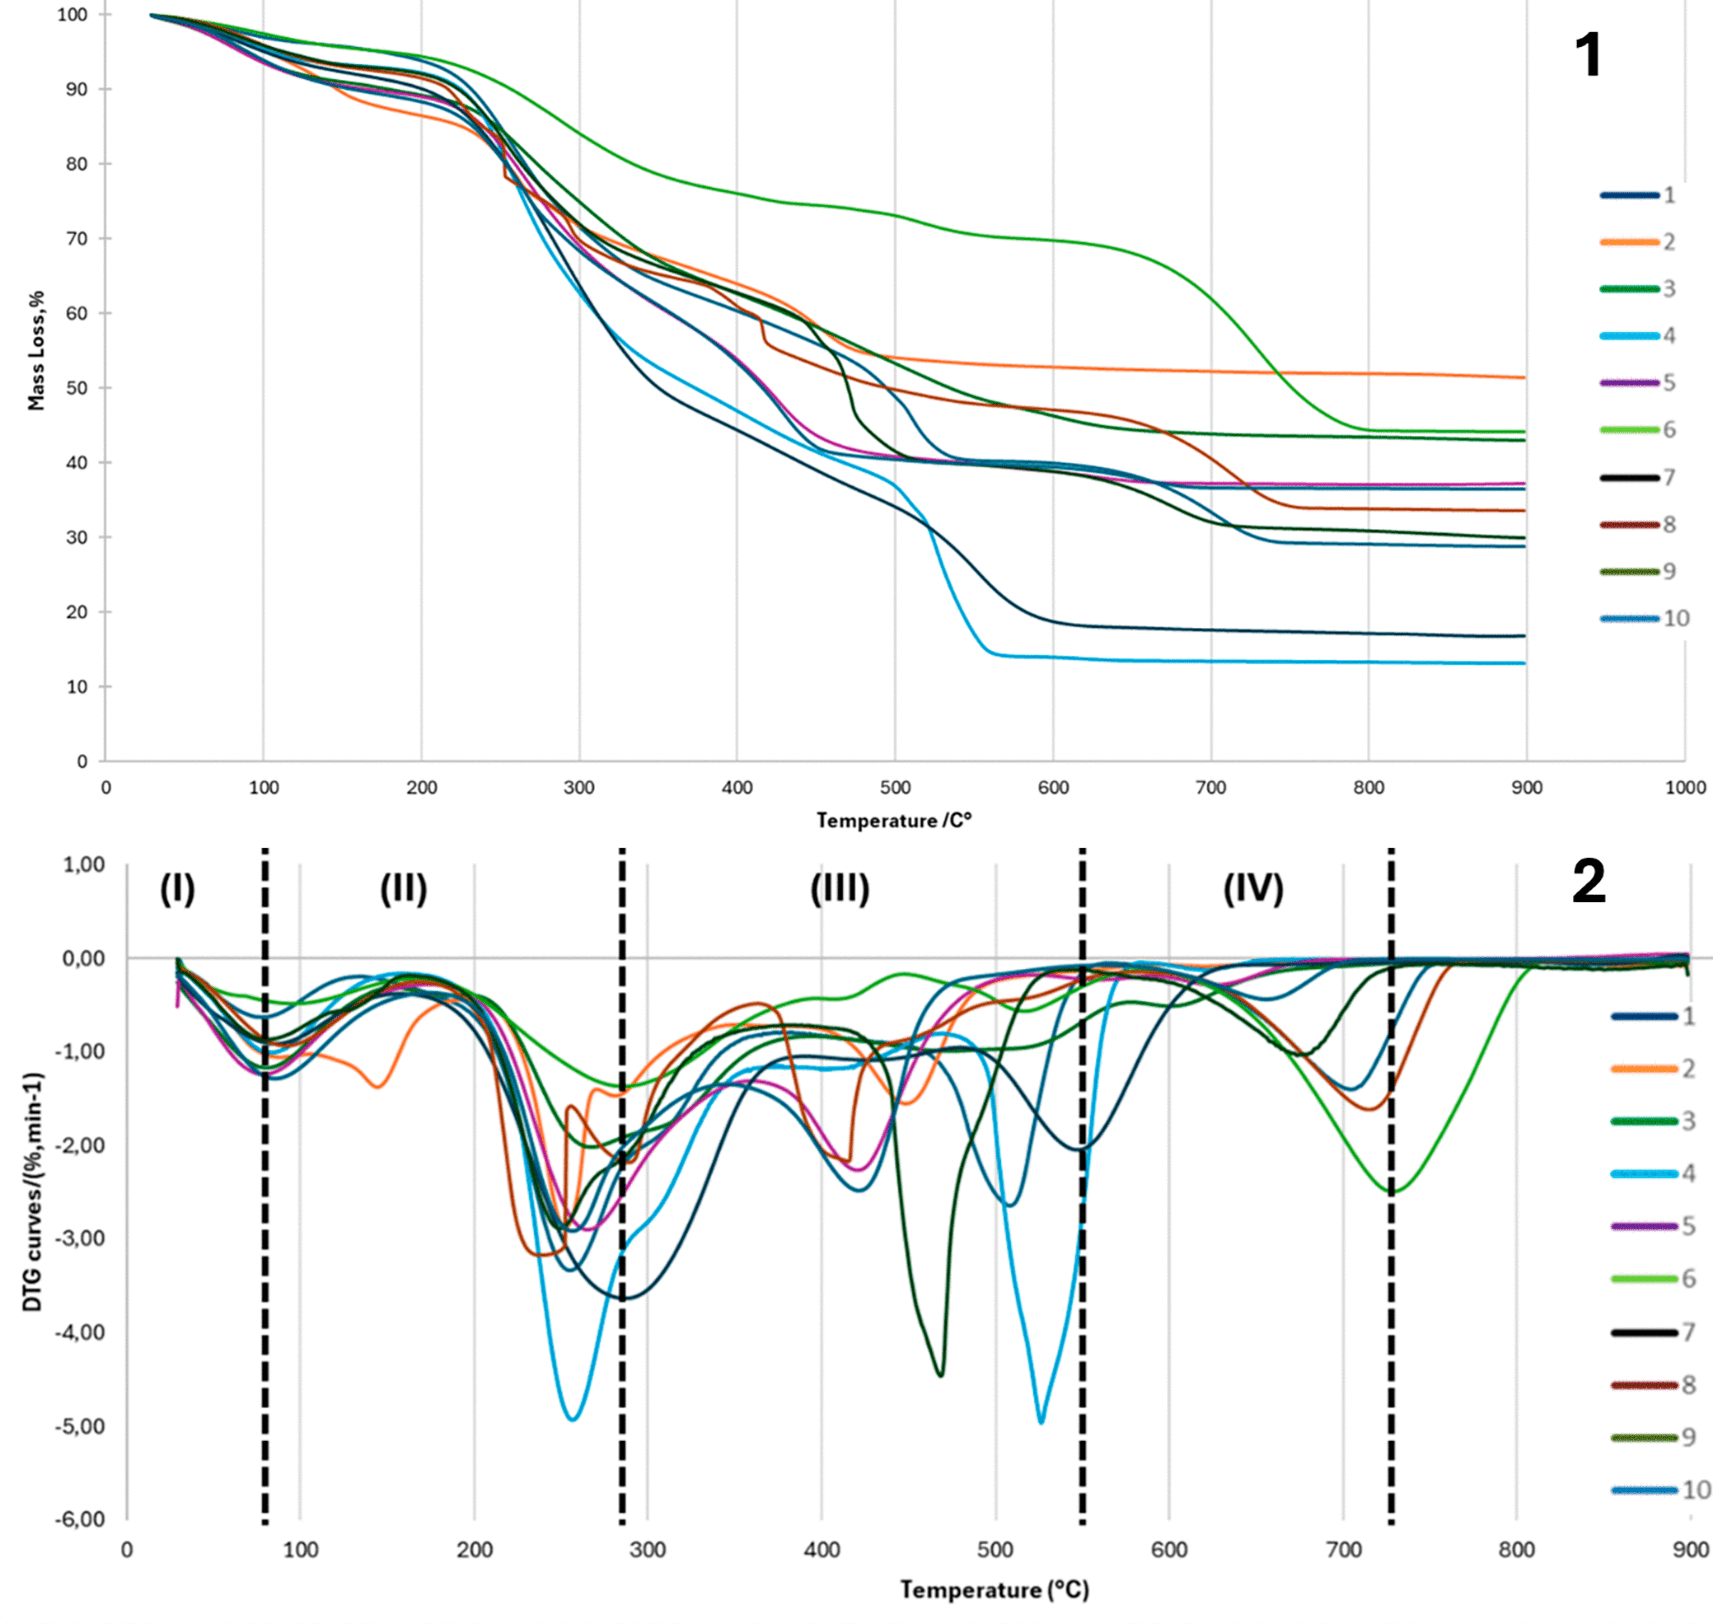
Figure 4. Thermogravimetric curves (1) and first derivative of the thermogravimetric analysis (2) of the ten dairy sludges samples.
Four distinct zones (I–IV), corresponding to specific stages of organic matter degradation were identified during the TGA analysis.
3.4 Contaminants in DPW
The levels in chemical pollutants and pathogens (E. coli and Salmonella spp.) were assessed in the ten DPW samples (
Table 7). Cd content in DPW was only measurable in plants 2 and 10, with values above the EU 2019/1009 regulation. Ni concentration surpassed the European regulation threshold in only plant 10. The content in Pb was highly variable across plants, while plants 4, 6 and 7 had no detectable Pb levels, plants 2, 5 and 10 had values that exceed the EU regulation limits. Zn and Cr concentrations remained below the EU limit for the 10 plants. With regards to pathogens, we observed that Faecal coliforms (E. coli) levels were above the threshold in only plant 10. The presence of Salmonella spp. was detected in plants 2, 3, 5 and 7 (40% percent of the samples). We did not find any relationships between the treatment methods of DPW or the final product with the levels of contaminants.
Table 7. Contaminants in dairy processing sludge.
Results expressed in mg kg−1. Faecal coliforms (E. coli) are expressed in CFU g−1. For Salmonella spp. “no” indicates absence of pathogen while “yes” indicates Salmonella was observed. EU limit according to the EU 2019/1009 regulation PFC 1 A. The values above the EU limit are indicated in bold. * = Legislation does not include thresholds for total Cr content, but samples with total Cr concentrations >200 mg kg−1 should report their concentrations and origin of the Cr pollution.
| Plant | Cd | Cr | Ni | Pb | Zn |
E. coli
|
Salmonella spp.
|
|---|
| 1 | 0.00 | 7.80 | 7.80 | 3.90 | 89.74 | 240 | no |
| 2 | 7.21
| 36.06 | 21.64 | 418.30
| 115.39 | 150 | yes
|
| 3 | 0.00 | 27.09 | 13.55 | 13.55 | 121.93 | 170 | yes
|
| 4 | 0.00 | 7.43 | 7.43 | 0.00 | 141.12 | 450 | no |
| 5 | 0.00 | 18.17 | 18.17 | 299.75
| 245.25 | 150 | yes
|
| 6 | 0.00 | 9.52 | 9.52 | 0.00 | 185.61 | 0 | no |
| 7 | 0.00 | 3.85 | 7.70 | 0.00 | 84.69 | 150 | yes
|
| 8 | 0.00 | 12.86 | 8.57 | 60.01 | 407.23 | 0 | no |
| 9 | 0.00 | 12.10 | 6.05 | 108.86 | 199.58 | 300 | no |
| 10 | 7.97
| 47.79 | 55.76
| 517.77
| 167.28 | 150000
| no |
| Mean | 1.52 | 18.27 | 15.62 | 142.21 | 175.78 | 15161 | -- |
| St. dev. | 3.21 | 14.32 | 15.01 | 196.16 | 95.79 | 47378 | -- |
| Median | 0.00 | 12.48 | 9.05 | 36.78 | 154.20 | 160 | -- |
| EU limit | 1.5 | 200 * | 50 | 120 | 800 | 1000 | no |
4. Discussion
4.1 Dairy processing waste as solid organic fertilizers
Fertilizer legislation in the EU requires that products under the category PFC 1 A (Organic fertilizer) must contain a minimum of N of 25 g kg−1, 20 g kg−1 of phosphorus pentoxide (P2O5) (equivalent to 8.72 g kg−1 of total P) and 20 g kg−1 of potassium oxide (K2O) (equivalent to 16.6 g kg−1 of total K) when a single nutrient is declared as primary nutrient (
European Commission, 2019). When more than one nutrient is declared, the minimum levels of nutrients are reduced to 10 g N kg−1, 4.36 g P kg−1 and 8.3 g K kg−1, the sum of the nutrients should be at least 40 g kg−1. Additionally, the C content must be higher than 150 g C kg−1. Under this frame, all analysed DPW samples could be qualified as N organic fertilizers, 9 out 10 as P organic fertilizers and none as K organic fertilizers (
Table 3). The measured values are in line with the characterization of Irish DPW performed by Ashekuzzaman et al. (2019), which remains the most complete study to date characterization of DPW. In their work, they also highlighted that nutrient content of DPW was higher than the one of cattle slurry. In our study, P concentration in DPW reached up to 77.91 g kg−1 (7.8%), which is of particular interest in the production of fertilizers, as P is currently labelled as a critical raw material by the EU (Bertrand et al., 2016). In addition, to macronutrients, DPW samples also contained large quantities of agronomically relevant micronutrients (
Table 4).
The treatment of dairy industry effluents can however impact their fertilizer value. For example, the addition of lime (plants 6 and 8) seems to increase the pH of DPW as those plants had values above 12, much higher than all other plants (
Table 5). The application in the soil of such materials could result in an increase of soil pH, which is associated with the reduction of bioavailability of macronutrients, such as P (Penn and Camberato, 2019). Moreover, the addition of Fe chlorides and Al chlorides increased significantly Fe and Al content (
Table 4). While Fe and Al are micronutrients and could be of agronomic relevance, the phytotoxic effects of Fe and Al accumulation in the soil are also well known (Barceló et al., 1995; Bartakova et al., 2001). Therefore, the pre-treatments of DPW should be considered before its utilization as fertilizers.
In addition, surveyed samples exhibited a low amount of potentially plant available P (< 5%, in the best of cases,
Table 3) which may further limit the fertilizer value of DPW. The P content in DPW was likely strongly fixed by the Ca, Al and Fe ions present in DPW, which in some cases greatly exceed the total amount of P in DPW (
Table 3 and 4). P can bind to these elements forming molecules like hydroxyapatite or iron phosphate (III) which are very recalcitrant once applied in the soil (Velasco-Sánchez et al., 2024). The high amount of Ca in the DPW samples (110 g Ca kg−1 on average) suggests that P could form poorly soluble apatite forms. The lower availability of P from DPW for plants compared to mineral P fertilizers has been already reported in previous studies (Shi et al., 2022b; Khomenko et al., 2023).
The size of the particles in DPW has important implications in its use as fertilizer. It plays a critical role in accessibility of nutrients for plants and soil microorganisms and in the reactivity of the DPW after their application in soils. For instance, it has been noted that finer particle sizes in organic materials like slurry are associated with higher N mineralization once applied to soil (Fangueiro et al., 2008). Other studies have shown that C is normally allocated in larger particles of slurry, whereas P and N are allocated in the finer ones (Peters et al., 2011; Turrión et al., 2018). The samples of DPW with a finer particle size distribution, like samples 6 and 9 (
Figure 3), are potentially more accessible to microorganisms and plants, thus potentially resulting in a higher fertilizer value.
TGA confirmed the high organic content of DPW, supporting its potential as an organic fertilizer. The main mass loss occurred between 237 °C and 288 °C, indicating the combustion of readily degradable compounds from milk processing, including sugars, proteins, and fats (Otero et al., 2002). Samples 2 and 6 retained more mineral residue, likely due to stabilization with calcium-based additives. Recalcitrant organics decomposed between 400 °C and 560 °C, reflecting thermal stability consistent with studies on sewage sludge (Magdziarz & Werle, 2014). A DTG peak near 500 °C likely represents calcium carbonate decarbonation, a well-established process in thermal analysis. Residues beyond 700 °C corresponded to inorganic matter, with considerable variability across samples. To gain deeper insight into the nature of these organic and mineral fractions, complementary FTIR analysis is recommended, as demonstrated by Júnior et al. (2025), who identified functional groups and persistent metal oxides in dairy sludges, suggesting stable phosphorus and aluminum bonds at high temperatures.
4.2 Contaminants in DPW
One of the most striking findings of our survey was the levels of contaminants found in DPW. Only half of the surveyed plants presented contaminants level below the thresholds of the current European legislation (EU Regulation 2019/1009) (
European Commission, 2019) (
Table 7). The presence of Salmonella spp. in 4 out 10 plants was particularly concerning, which could lead to food safety threats if DPW is spread over crops (Othman et al., 2021). The measured levels of contaminants prevents the commercialization, labelling and utilization of DPW as a PFC 1 A. Legislation on sludge disposal has proven to be successful in the reduction of soil contamination and the restoration of soil microbial activities and efforts to reduce contamination should be maintained (Kirchmann et al., 2017). The negative effects of DPW application on metal accumulation in the soil and the suppression of soil microbial diversity has been constated in previous research (López-Mosquera et al., 2000; Gryta et al., 2014). The levels of contamination in our DPW samples are also in the range of other DPW characterization studies in other geographical areas (Ashekuzzaman et al., 2019; Shi et al., 2022a).
The contamination levels could also restrict the utilization of DPW as a raw material for the production of other recycled fertilizers. Techniques to produce ashes, biochars or hydrochars and P chemical precipitates tend to increase the concentration of nutrients but also the concentration of heavy metals and other inorganic pollutants (Delgado Sancho et al., 2019). The origin of heavy metals in DPW is still contested, as several sources are accounted for depending on the specific conditions of farming, as well as milk collection and processing. On one hand, the presence of heavy metals in DPW can be accounted to an original presence in milk, which is the direct results of exposing cows to these toxic elements through their food chain (Monteverde et al., 2022). Another possible source of heavy metals in DPW is the wearing and abrasion of industrial equipment used in milk collection, processing and treatment. Lastly, studies have reported increasing heavy metal concentrations in dairy processing waste streams, which increases the health risks on the cows and humans eventually. The non-biodegradable nature of most heavy metals provide them with high persistency in human tissues and organs, thus causing toxicity and cell destruction (Monteverde et al., 2022). Transformation of DPW sludge into biochar or hydrochar can result in the formation of organic pollutants such as dioxins and furans, which could further prevent their safe utilization in agriculture (Sobol et al., 2023). In general, thermochemical treatment techniques tend to immobilize heavy metals, as well as nutrients, which results in increased concentrations of undesirable metals in solid products with fertilizer potential such as hydrochar and biochar (Khalaf et al., 2023).
The introduction of pollutants should be avoided at the early stages of the wastewater treatment process. As mentioned previously, the introduction of heavy metals can be associated with a polluted feedstock, surrounding of the livestock, packaging materials and the different chemicals used in the wastewater treatment process (Delgado Sancho et al., 2019; Yan et al., 2022). Lack of separation in the sanitation system in the dairy production facilities could also be a potential source of contamination for DPW. Therefore, reducing the concentration of heavy metals in DPW must begin from the input steps of milk production.
4.3 Outlook
The lack of uniformity makes the valorisation of DPW as a fertilizer very complex. The introduction of different chelants, polymers or other chemicals further prevents DPW, according to the EU 2019/1009, to be categorized as an organic fertilizer, as legislation requires that the material is of solely organic origin (
European Commission, 2019). Normative is very strict on the allowed thresholds of pollutants and nutrient concentration that can be discharged from wastewater treatment plants but is generally lacking in universal guidelines in the wastewater treatment process itself. The normative is also very different in each country (Román-Sánchez et al., 2015). The lack of consistent guidelines could also explain the heterogeneous characteristics in DPW (Ashekuzzaman et al., 2019).
The variety in DPW composition presents a huge challenge both for scientists and legislators in an attempt to standardize techniques and guidelines for DPW treatment. To have achieve a standardized DPW it is then necessary to progress towards a universal wastewater treatment process in the dairy industry. However, universalizing treatment processes in such a huge industry may prove to be infeasible, as different plants will possess different targets, thus requiring different techniques. Therefore, a more reasonable approach can be implemented by substituting traditional treatment techniques with greener substitutes. For instance, the addition of chemicals should be avoided as they may be limiting factors in the valorisation of DPW as fertilizer due to saturation and nutrient immobilization. Instead, a potential alternative to precipitate P could be the use of P-accumulating microorganisms, also called enhanced biological phosphorus recovery (EBPR) (Cydzik-Kwiatkowska and Zielińska, 2016; Izadi et al., 2020). The use of EBPR could prevent the utilization of chemical chelates in the wastewater treatment process. Such technologies could allow the commercialization of DPW as an organic fertilizer, as labelled by the EU 2019/1009. In addition, techniques to remove heavy metals and pathogens such as electrokinetic processes, supercritical fluid extractions or aerobic mesophilic stabilization and liming can also be employed to meet regulatory thresholds (Plachá et al., 2008; Geng et al., 2020). Such techniques, based on our dataset, should be considered if DPW is intended to be used as a fertilizer, with the need to balance between environmental improvement and economic feasibility.
5. Conclusions
In this work, we investigated the heterogeneity of DPW from the North of France and evaluated its potential as a fertilizer according to the most recent fertilizer regulation in the European Union. We observed the richness in agronomic relevant nutrients such as N and P. The amounts of these nutrients would allow DPW to be labelled and commercialized as a PFC 1.
However, the utilization of chemicals throughout the wastewater treatment process and the levels of contamination, which exceeded the legal thresholds in half the studied DPW samples, may prevent their use as fertilizers. Particularly, the levels of heavy metals and Salmonella spp. were particularly worrisome in the samples studied.
Before DPW is used as a fertilizer, we recommend that it should undergo a critical evaluation of its contaminants, as DPW can represent an important source of pollutants. The contamination levels of DPW could be lowered by a more effective pollutant reduction across the dairy production chain and by the use of technologies which make use of cleaner chemicals and/or employ pollutant removal technologies from the resulting DPW sludge.
Ethics and consent
Ethical approval and consent were not required. Operational information regarding treatment processes and chemicals used at each plant was provided by the site managers solely for the technical characterization of the facilities and sampling conditions. No personal data were collected, and the identities and locations of the dairy plants were anonymized and kept confidential. Consent was obtained from the site managers for the use of the operational information and for the publication of the anonymized data presented in this study.
Acknowledgments
We would like to acknowledge the following people: Marianne Rosa, Jean-Baptiste Besnier, Anne Cauchois, Maëva Leplet, Maya Diakité and Désiré Ndahirwa for their assistance in the lab analysis. The responsible people at each of the 10 plants that helped and allowed us to take our DPW samples.
References
- Ashekuzzaman SM, Forrestal P, Richards K, et al.:
Dairy industry derived wastewater treatment sludge: Generation, type and characterization of nutrients and metals for agricultural reuse.
J. Clean. Prod.
2019; 230: 1266–1275. Publisher Full Text
- Ashekuzzaman SM, Forrestal P, Richards KG, et al.:
Grassland Phosphorus and Nitrogen Fertiliser Replacement value of Dairy Processing Dewatered Sludge.
Sustainable Prod. Consumption.
2021; 25: 363–373. Publisher Full Text
- Barceló J, Poschenrieder C, Vázquez MD, et al.:
Aluminium phytotoxicity: A challenge for plant scientists.
Fertilizer research.
1995; 43: 217–223. Publisher Full Text
- Bartakova I, Kummerova M, Mandl M, et al.:
Phytotoxicity of iron in relation to its solubility conditions and the effect of ionic strength.
Plant Soil.
2001; 235: 45–51. Publisher Full Text
- Behjat M, Svanström M, Peters G:
A meta-analysis of LCAs for environmental assessment of a conceptual system: Phosphorus recovery from dairy wastewater.
J. Clean. Prod.
2022; 369: 133307. Publisher Full Text
- Bertrand G, Cassard D, Arvanitidis N, et al.:
Map of Critical Raw Material Deposits in Europe.
Energy Procedia.
2016; 97: 44–50. Publisher Full Text
- Collivignarelli MC, Abbà A, Frattarola A, et al.:
Legislation for the Reuse of Biosolids on Agricultural Land in Europe: Overview.
Sustainability.
2019; 11: 6015. Publisher Full Text
- Cydzik-Kwiatkowska A, Zielińska M:
Bacterial communities in full-scale wastewater treatment systems.
World J. Microbiol. Biotechnol.
2016; 32: 66–68. PubMed Abstract
| Publisher Full Text
| Free Full Text
- Delgado Sancho L, Eder P, Saveyn H, et al.:
Technical proposals for selected new fertilising materials under the Fertilising Products Regulation (Regulation (EU) 2019/1009) : process and quality criteria, and assessment of environmental and market impacts for precipitated phosphate salts & derivate.
Publications Office;
2019. Publisher Full Text
- European Commission:
Regulation (EC) No 765/2008 of the European Parliament and of the Council (4) lays down rules on thethe making available on the market of EU fertilising products and amending Regulations (EC) No 1069/2009 and (EC) No 1107/2009 and repealing Regulation (EC) No 2003/2003.2019.
- Fangueiro D, Chadwick D, Bol R:
Assessment of the potential N mineralization of different particle-size fractions in two dairy cattle slurries.
J. Plant Nutr. Soil Sci.
2008; 171: 313–315. Publisher Full Text
- Frąc M, Jezierska-Tys S:
Agricultural utilisation of dairy sewage sludge: its effect on enzymatic activity and microorganisms of the soil environment.
Afr. J. Microbiol. Res.
2011; 5: 1755–1762. Publisher Full Text
- Geng H, Xu Y, Zheng L, et al.:
An overview of removing heavy metals from sewage sludge: Achievements and perspectives.
Environ. Pollut.
2020; 266: 115375. Publisher Full Text
- Ghani A, Dexter M, Perrott KW:
Hot-water extractable carbon in soils: a sensitive measurement for determining impacts of fertilisation, grazing and cultivation.
Soil Biol. Biochem.
2003; 35: 1231–1243. Publisher Full Text
- Ghanim BM, Kwapinski W, Leahy JJ:
Speciation of Nutrients in Hydrochar Produced from Hydrothermal Carbonization of Poultry Litter under Different Treatment Conditions.
ACS Sustain. Chem. Eng.
2018; 6: 11265–11272. Publisher Full Text
- Gryta A, Frąc M, Oszust K:
The Application of the Biolog EcoPlate Approach in Ecotoxicological Evaluation of Dairy Sewage Sludge.
Appl. Biochem. Biotechnol.
2014; 174: 1434–1443. PubMed Abstract
| Publisher Full Text
| Free Full Text
- Hu Y, Khomenko O, Shi W, et al.:
Systematic Review of Dairy Processing Sludge and Secondary STRUBIAS Products Used in Agriculture.
Front Sustain Food Syst.
2021; 5. Publisher Full Text
- Hu Y, Thomsen TP, Fenton O, et al.:
Effects of dairy processing sludge and derived biochar on greenhouse gas emissions from Danish and Irish soils.
Environ. Res.
2023; 216: 114543. PubMed Abstract
| Publisher Full Text
- Izadi P, Izadi P, Eldyasti A:
Design, operation and technology configurations for enhanced biological phosphorus removal (EBPR) process: a review.
Rev. Environ. Sci. Biotechnol.
2020; 19: 561–593. Publisher Full Text
- Júnior PWPM, de Souza Miranda F , Prado ESAP, et al.:
Dairy sludge characteristics and its degradation during thermal treatment and thermal plasma treatment.
Environ. Technol.
2025; 46(12): 2181–2197. Publisher Full Text
- Kellis M, Kalavrouziotis IK, Gikas P:
Review of wastewater reuse in the mediterranean countries, focusing on regulations and policies for municipal and industrial applications.
Global NEST J.
2013; 15: 333–350. Publisher Full Text
- Khalaf N, Leahy JJ, Kwapinski W:
Phosphorus recovery from hydrothermal carbonization of organic waste: a review.
J. Chem. Technol. Biotechnol.
2023; 98: 2365–2377. Publisher Full Text
- Khalaf N, Shi W, Fenton O, et al.:
Hydrothermal carbonization (HTC) of dairy waste: effect of temperature and initial acidity on the composition and quality of solid and liquid products.
Open Research Europe.
2022; 2: 83. Publisher Full Text
- Khomenko O, Fenton O, Leahy JJ, et al.:
A comparative study of thermally and chemically treated dairy waste: Impacts on soil phosphorus turnover and availability using 33P isotope dilution.
J. Environ. Manag.
2023; 326: 116702. PubMed Abstract
| Publisher Full Text
| Free Full Text
- Kirchmann H, Börjesson G, Kätterer T, et al.:
From agricultural use of sewage sludge to nutrient extraction: A soil science outlook.
Ambio.
2017; 46: 143–154. PubMed Abstract
| Publisher Full Text
| Free Full Text
- López-Mosquera ME, Moirón C, Carral E:
Use of dairy-industry sludge as fertiliser for grasslands in northwest Spain: heavy metal levels in the soil and plants.
Resour. Conserv. Recycl.
2000; 30: 95–109. Publisher Full Text
- Magdziarz A, Werle S:
Analysis of the combustion and pyrolysis of dried sewage sludge by TGA and MS.
Waste Manag.
2014; 34(1): 174–179. Publisher Full Text
- Monteverde V, Camilleri G, Arfuso F, et al.:
Heavy Metal Levels in Milk and Serum of Dairy Cows from Different Farms Located near an Industrial Area.
Animals.
2022; 12: 2574. PubMed Abstract
| Publisher Full Text
| Free Full Text
- Moscovici Joubran A, Pierce KM, Garvey N, et al.:
Invited review: A 2020 perspective on pasture-based dairy systems and products.
J. Dairy Sci.
2021; 104: 7364–7382. PubMed Abstract
| Publisher Full Text
- Numviyimana C, Warchoł J, Izydorczyk G, et al.:
Struvite production from dairy processing wastewater: Optimizing reaction conditions and effects of foreign ions through multi-response experimental models.
J. Taiwan Inst. Chem. Eng.
2020; 117: 182–189. Publisher Full Text
- Otero M, Calvo LF, Estrada B, et al.:
Thermogravimetry as a technique for establishing the stabilization progress of sludge from wastewater treatment plants.
Thermochim. Acta.
2002; 389(1–2): 121–132. Publisher Full Text
, 132
- Othman YA, Al-Assaf A, Tadros MJ, et al.:
Heavy Metals and Microbes Accumulation in Soil and Food Crops Irrigated with Wastewater and the Potential Human Health Risk: A Metadata Analysis.
Water.
2021; 13: 3405. Publisher Full Text
- Penn CJ, Camberato JJ:
A Critical Review on Soil Chemical Processes that Control How Soil pH Affects Phosphorus Availability to Plants.
Agriculture.
2019; 9: 120. Publisher Full Text
- Peters K, Hjorth M, Jensen LS, et al.:
Carbon, Nitrogen, and Phosphorus Distribution in Particle Size–Fractionated Separated Pig and Cattle Slurry.
J. Environ. Qual.
2011; 40: 224–232. Publisher Full Text
- Plachá I, Venglovský J, Maková Z, et al.:
The elimination of Salmonella typhimurium in sewage sludge by aerobic mesophilic stabilization and lime hydrated stabilization.
Bioresour. Technol.
2008; 99: 4269–4274. PubMed Abstract
| Publisher Full Text
- Román-Sánchez IM, Aznar-Sánchez JA, Belmonte-Ureña LJ:
Heterogeneity of the environmental regulation of industrial wastewater: European wineries.
Water Sci. Technol.
2015; 72: 1667–1673. PubMed Abstract
| Publisher Full Text
- Sobol Ł, Dyjakon A, Soukup K:
Dioxins and furans in biochars, hydrochars and torreficates produced by thermochemical conversion of biomass: a review.
Environ. Chem. Lett.
2023; 21: 2225–2249. Publisher Full Text
- Shi W, Fenton O, Ashekuzzaman SM, et al.:
An examination of maximum legal application rates of dairy processing and associated STRUBIAS fertilising products in agriculture.
J. Environ. Manag.
2022a; 301: 113880. PubMed Abstract
| Publisher Full Text
- Shi W, Healy MG, Ashekuzzaman SM, et al.:
Mineral fertiliser equivalent value of dairy processing sludge and derived biochar using ryegrass (Lolium perenne L.) and spring wheat (Triticum aestivum).
J. Environ. Manag.
2022b; 321: 116012. PubMed Abstract
| Publisher Full Text
- Shi W, Healy MG, Ashekuzzaman SM, et al.:
Dairy processing sludge and co-products: A review of present and future re-use pathways in agriculture.
J. Clean. Prod.
2021; 314: 128035. Publisher Full Text
- Turrión MB, Bueis T, Lafuente F, et al.:
Effects on soil phosphorus dynamics of municipal solid waste compost addition to a burnt and unburnt forest soil.
Sci. Total Environ.
2018; 642: 374–382. PubMed Abstract
| Publisher Full Text
- Velasco-Sánchez Á:
The role of soil microorganisms in enhancing phosphorus availability.
Wageningen University & Research, Wageningen University & Research Repository;
2024. Doctoral dissertation. Publisher Full Text
- Velasco-Sánchez Á, Bennegadi-Laurent N, Trinsoutrot-Gattin I, et al.:
Soil microorganisms increase Olsen phosphorus from poorly soluble organic phosphate: A soil incubation study.
Soil Use Manag.
2024; 40. Publisher Full Text
- Velasco-Sánchez Á, Hu Y, Sommers SG, et al.:
Phosphorus fertilization of grasses with dairy processing waste materials and contributions of soil microorganisms towards phosphorus uptake.
Geoderma.
2025; 460: 117406. Publisher Full Text
- Velasco-Sánchez Á, Moinet GYK, van Groenigen JW , et al.:
Characterization of dairy processing waste in the north of France.2023. Publisher Full Text
- Yan M, Niu C, Li X, et al.:
Heavy metal levels in milk and dairy products and health risk assessment: A systematic review of studies in China.
Sci. Total Environ.
2022; 851: 158161. PubMed Abstract
| Publisher Full Text









