1. Introduction
Offshore wind turbines are nowadays one of the most popular and effective solutions to reduce the amount of greenhouse gas emissions and at the same time meet the electricity demand. The installation of offshore wind turbines is a complex and challenging process because of the size and weight of the components (tower sections, nacelles, blades), as well as the harsh conditions typical of offshore environments. These components require specialized vehicles, ships, cranes, and equipment for transportation, handling, and storage. All installation operations should be carefully designed considering the interaction of these components with environmental actions, such as wind, waves, and earthquakes.
Towers of offshore wind turbines are steel cylinders, made of thin-walled shell segments, and have an aspect ratio (height to diameter) ranging from 4 to 20. Towers are manufactured in multiple segments, which are assembled and erected at the harbor quayside to shorten offshore operations. Their installation can follow either a full-tower or split-tower strategy. In the full-tower strategy, the entire tower is assembled at the harbor quayside prior to transportation to the offshore wind farm. By contrast, in the split-tower strategy, towers are transported in two halves. This may be the scenario in case of infrastructure constraints, such as the limited clearance below bridges. There are three different key stages during which towers may stand either alone or in groups: a) at the harbor quayside during the so-called pre-assembly activities (e.g.,1); b) on the installation vessel during sea transit (Figure 1); c) during the offshore installation when the vessel is jacked-up.
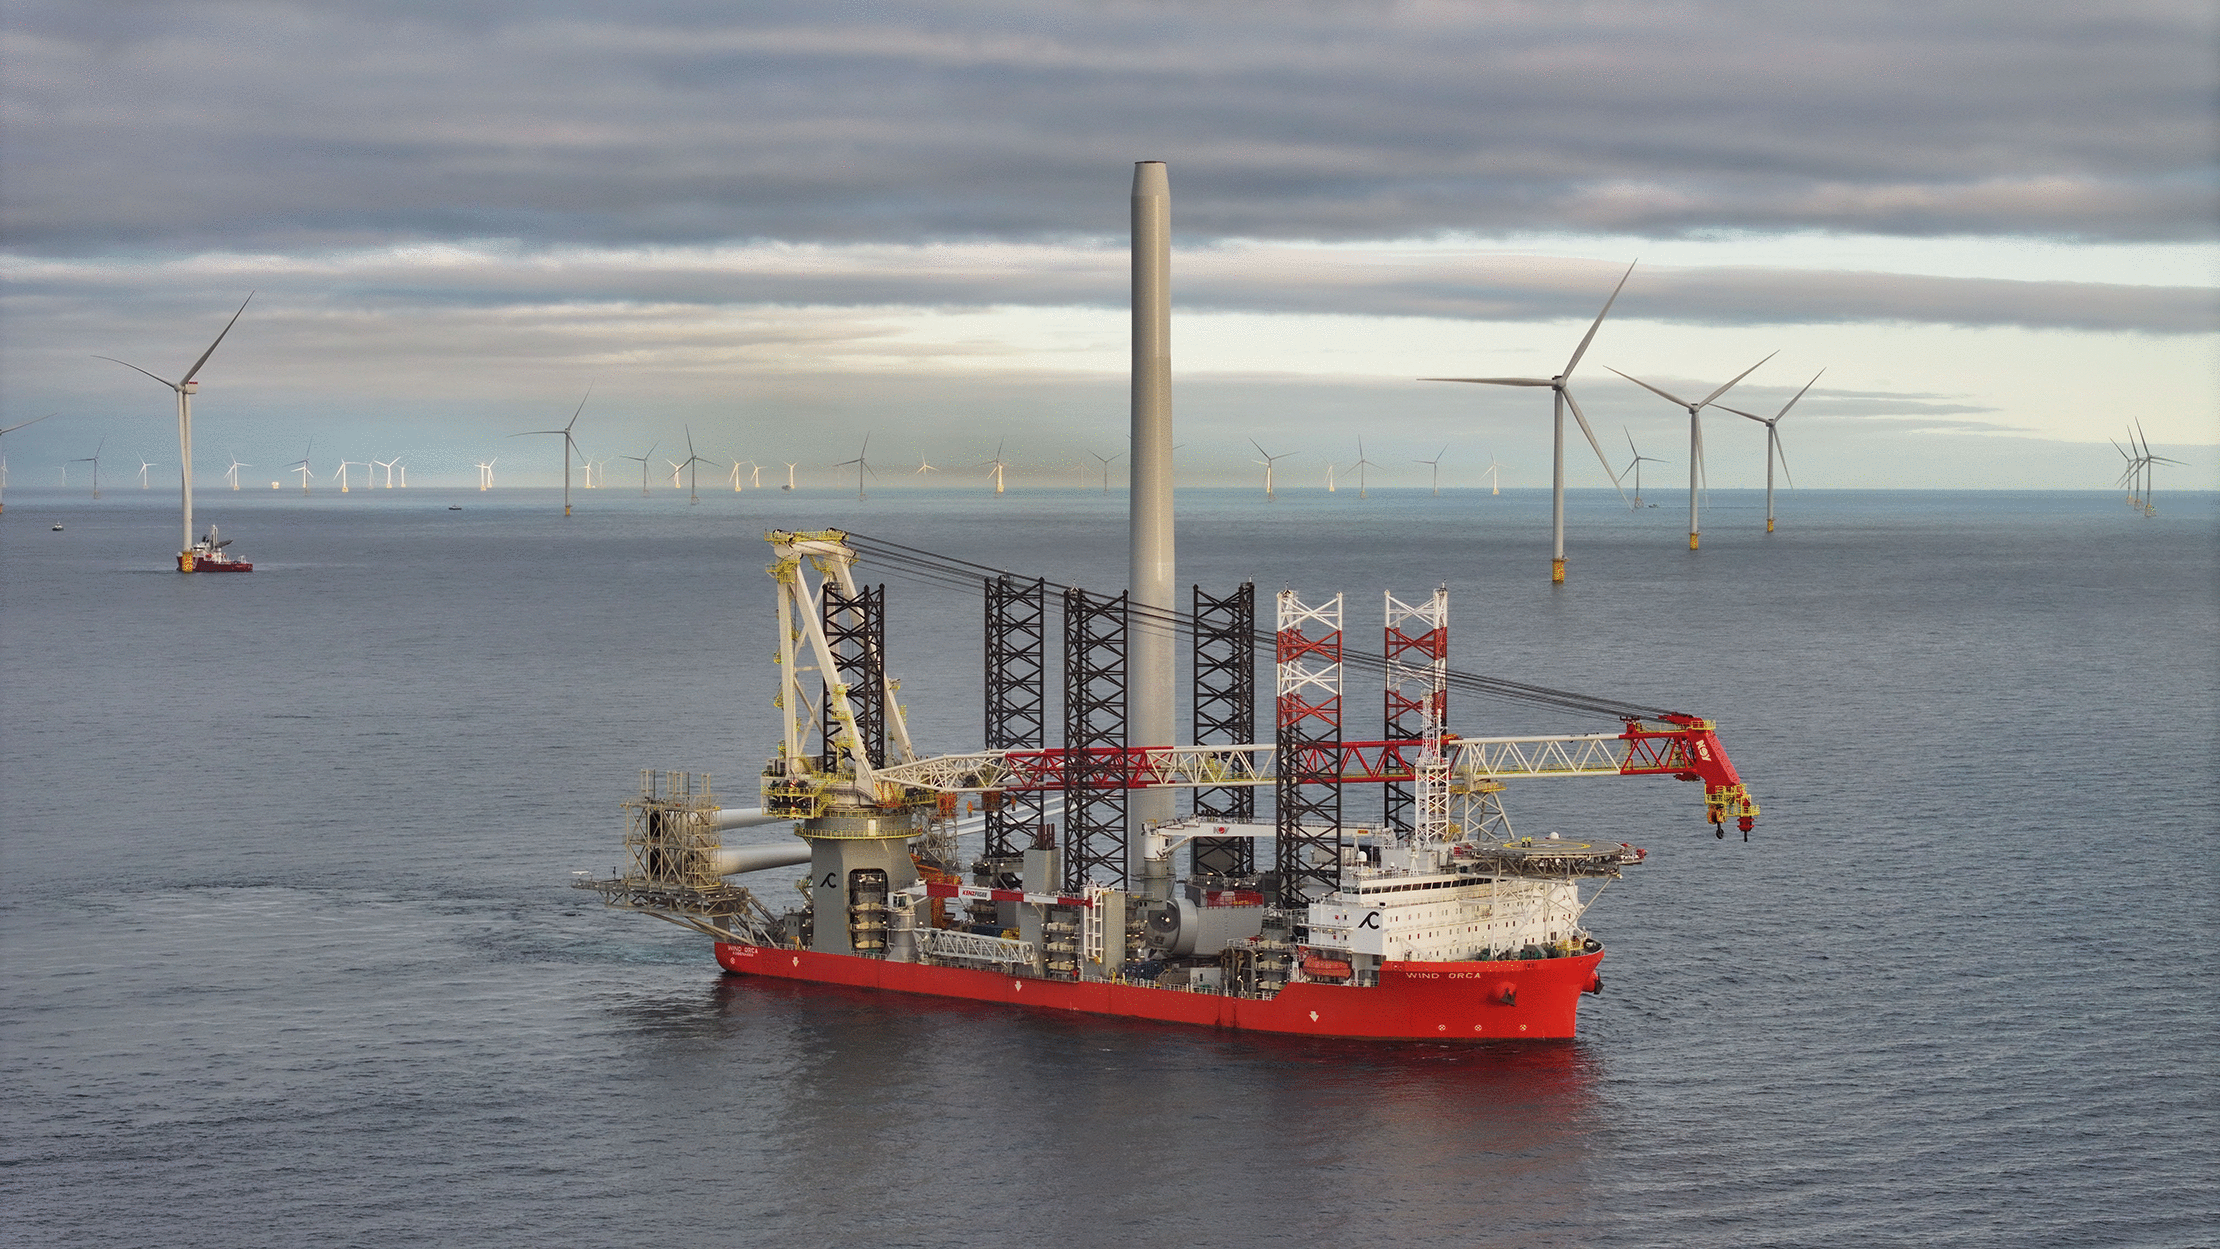
Figure 1. Wind turbine tower aboard the installation vessel during sea transit (© Cadeler).
Activities at the harbor quayside and on the jacked-up vessel involve a fixed or near-fixed support for towers. Regarding these activities, the aerodynamic response of clusters of towers at short center-to-center distance was studied for typical group configurations used in the wind energy industry,2 including also the possible presence of helical vortex strakes3 to mitigate vortex-induced vibrations. In addition, the gust buffeting response of a single tower in mild and severe wind conditions was studied based on full-scale measurements from Østerild Test Center (Denmark).4 Similarly, vortex shedding at transcritical Reynolds numbers was studied5 along with vortex-induced vibrations.6 By contrast, towers during sea transit are subjected to the movements induced by waves and navigation, in addition to the wind action. This aspect is largely unexplored and has inspired the ERIES–VORSEA project, namely “Experimental investigation of the VORtex shedding of offshore wind turbine towers during SEA transit”. The project aims to investigate the effect of vessel roll on the aerodynamics and vortex shedding of wind turbine towers during sea transit.
Although the wind-structure interaction of wind turbine towers has been the subject of relatively few studies, the aerodynamics and aeroelasticity of finite-length cylinders have been extensively studied over the past decades. Table 1 presents a selected list of studies based on full-scale measurements, aimed at investigating structural vibrations, especially those induced by vortex shedding. Full-scale measurements offer a unique opportunity to reach transcritical Reynolds numbers and serve as valuable benchmarks for the validation and calibration of more comprehensive computational and experimental studies.
Table 1. Selected full-scale experiments on chimneys/towers.
is the height of the chimney/tower,
the base diameter, and
the top diameter.
| No. | References | Location |
[m] |
[m] |
[m] |
[−] | Material
a |
|---|
| C01 | Müller and Nieser8 | Karlsruhe (DE) | 180 | 9.86 | 4.75 | 37.89 | RC |
| C02 | Hirsch and Ruscheweyh9 | - (DE) | 145 | - | 6 | 24.17 | steel |
| C03
b | Shears,10 Basu and Vickery11 | Emley Moor (UK) | 56 | 3.66 | 1.52 | 36.84 | steel (lattice) |
| C04 | Christensen and Askegaard,12 Hansen13 | Stigsnaes (DK) | 130 | 17.4 | 5.8 | 22.41 | RC |
| C05 | Melbourne et al.14 | Mount Isa (AU) | 265 | 21.85 | 12.27 | 21.60 | RC |
| C06 | Galemann and Ruscheweyh15 | Aachen (DE) | 28 | 0.914 | 0.914 | 30.63 | steel |
| C07 | Sanada et al.16 | Hirono (JP) | 200 | 27 | 14.8 | 13.51 | RC |
| C08 | Waldeck17 | Witbank (ZA) | 300 | - | - | - | RC |
| C09 | Ellingsen et al.,18 Manal and Hémon19 | Bouin (FR) | 35.5 | 1 | 2 | 17.75 | steel |
| C10 | Kurniawati et al.,5,6 Giusti et al.4 | Østerild (DK) | 116.46 | 6.5 | 4.15 | 28.06 | steel |
| C11 | Kurniawati et al.5,6 | Østerild (DK) | 154.89 | - | 6.40
c | 24.20 | steel |
Table 2 presents a selected list of experiments on circular cylinder, illustrating how the present work fits into the body of existing literature. These studies describe flow patterns typical of finite-length cylinders, such as counter rotating vortex pairs at the top of the cylinder and the downwash flow in the wake, as well as the upstream horseshoe vortex driven by the boundary condition at the bottom.7 Excluding two-dimensional studies, Reynolds numbers do not exceed 7.7·105, and they are typically below 105.
Table 2. Selected wind tunnel experiments on circular cylinders.
is the height of the cylinder,
its diameter,
the Reynolds number, and
the longitudinal turbulence intensity.
| No. | References |
[mm] |
[−] |
[−] |
[%] | Blockage [%] |
|---|
| S01
a | Achenbach20 | 150 |
| 6·104–5·106 | 0.7 | 16.7 |
| S02
b | Okamoto and Yagita21 | 20 | 1, 2, 3, 4, 5, 6, 7, 9, 12.5,
| 1.33·104 | 0.25, 0.45 | 5 (max) |
| S03 | Farivar22 | 50.8 | 2.78, 5, 7.5, 10, 12.5,
| 7.0·104 | 0.9 | - |
| S04
c | Slaouti and Gerrard23 | 10.0, 12.7 | <30 | 60–200 | - | 1.61 (max) |
| S05 | Ayoub and Karamcheti24 | 152.4 | ca. 12 | 8.5·104–7.7·105 | 0.5, 1.1 | 4.27 |
| S06
d | Zdravkovich et al.25 | 50, 68, 89, 127 | 2, 4, 5, 6, 8, 10 | 6·104–2.6·105 | 0.3 | <5 (max) |
| S07
e | Kareem et al.26 | 76.2 | 10, 13.3 | 2.54·104–2.75·104 | 7, 20 | 1.25, 1.67 |
| S08 | Okamoto and Sunabashiri27 | 20, 30, 40, 70 | 0.5, 1, 2, 4, 7, 23.75 | 2.5·104–4.7·104 | 0.4 | 3.8 (max) |
| S09
a | Shih et al.28 | 316 |
| 3·105–8·106 | 0.04–0.08 | 11 |
| S10 | Fox et al.29 | 31.7 | 30 | 4.4·104 | 0.2 | 3.4 |
| S11 | Park and Lee30 | 30 | 6, 10, 13,
| 2·104 | <0.08 | 4.2 (max) |
| S12 | Sumner et al.31 | 31.5 | 3, 5, 7, 9 | 6·104 | <0.6 | 0.87 (max) |
| S13
f | Iungo et al.32 | 60 | 3 | 6·104–1.1·105 | 0.9 | - |
| S14
a | Ellingsen et al.33 | 500 |
| 8.0·105–2.17·106 | 1.5 | 8.3 |
| S15 | present work
| 355 | 9 | 9.47·104–1.66·106 | 1.5 | <6 |
In light of this background, the ERIES–VORSEA project studies the aerodynamics of finite-length circular cylinders at high Reynolds numbers, up to 1.66·106, through pressure and acceleration measurements. Configurations with either a single cylinder or two cylinders are tested, along with the effect of the rolling base. The resulting dataset can contribute to the optimization of the tower design by accounting for more realistic wind loading scenarios. Moreover, it can also be suitable as a benchmark for future experiments conducted at different scales, as well as for computational fluid dynamics studies. The following sections describe the test setup, the experimental campaign, and the dataset.
2. Test setup
The test setup (Figure 2) enables the investigation of cylinders with either a fixed or a rolling base and is designed to achieve Reynolds numbers around 1.7·106 while maintaining a relatively low blockage ratio of approximately 6%. It comprises three main parts (e.g.,34,35): a) cylinder; b) base connection; c) tilting apparatus. The cylinder is an aluminum tube, open at the top, and manufactured in two versions. The first is equipped with 200 pressure taps, distributed over 8 rings along the upper two-thirds of the model, and a three-axis accelerometer at the top. The pressure taps are connected by plastic tubes to the scanners, housed inside the cylinder. The second version is, instead, without pressure taps and is designed for aeroelastic tests. Indeed, the presence of the plastic tubes and pressure scanners alters the mass and the damping of the system. Additionally, a third dummy cylinder is available for studying two cylinders either scattered or in tandem. Each cylinder is approximately 3.2 m tall and 355 mm in diameter (see Section 2.2), with a mass (excluding instrumentation) of 55.6 kg.36 The test cylinders have a geometric scale of 1:18 and represent half-towers in the scenario of split-tower installation. The cylinders are connected to the tilting apparatus via a main rod, which is joined to the cylinder and the tilting apparatus through a cylindrical joint reinforced with triangular gussets. The rod’s length and diameter can be adjusted to tune the natural frequency of the cylinder (pivot model). The whole connection is hereafter referred to as the base connection. The tilting apparatus is a welded steel structure with a main body fixed to the wind tunnel floor and a rolling base connected to the main body via two hinges. The rotational motion is driven by an eccentric rod actuated by an electrical motor, mounted on the main body. The motor is connected to the rod through a gear wheel, chain, and shaft assembly. The rolling base can accommodate two cylinders at a center-to-center distance of approximately 552 mm. A three-axis accelerometer is also mounted on the rolling base. Its distance from the roll axis is equal to that of the geometric center of the base connection.
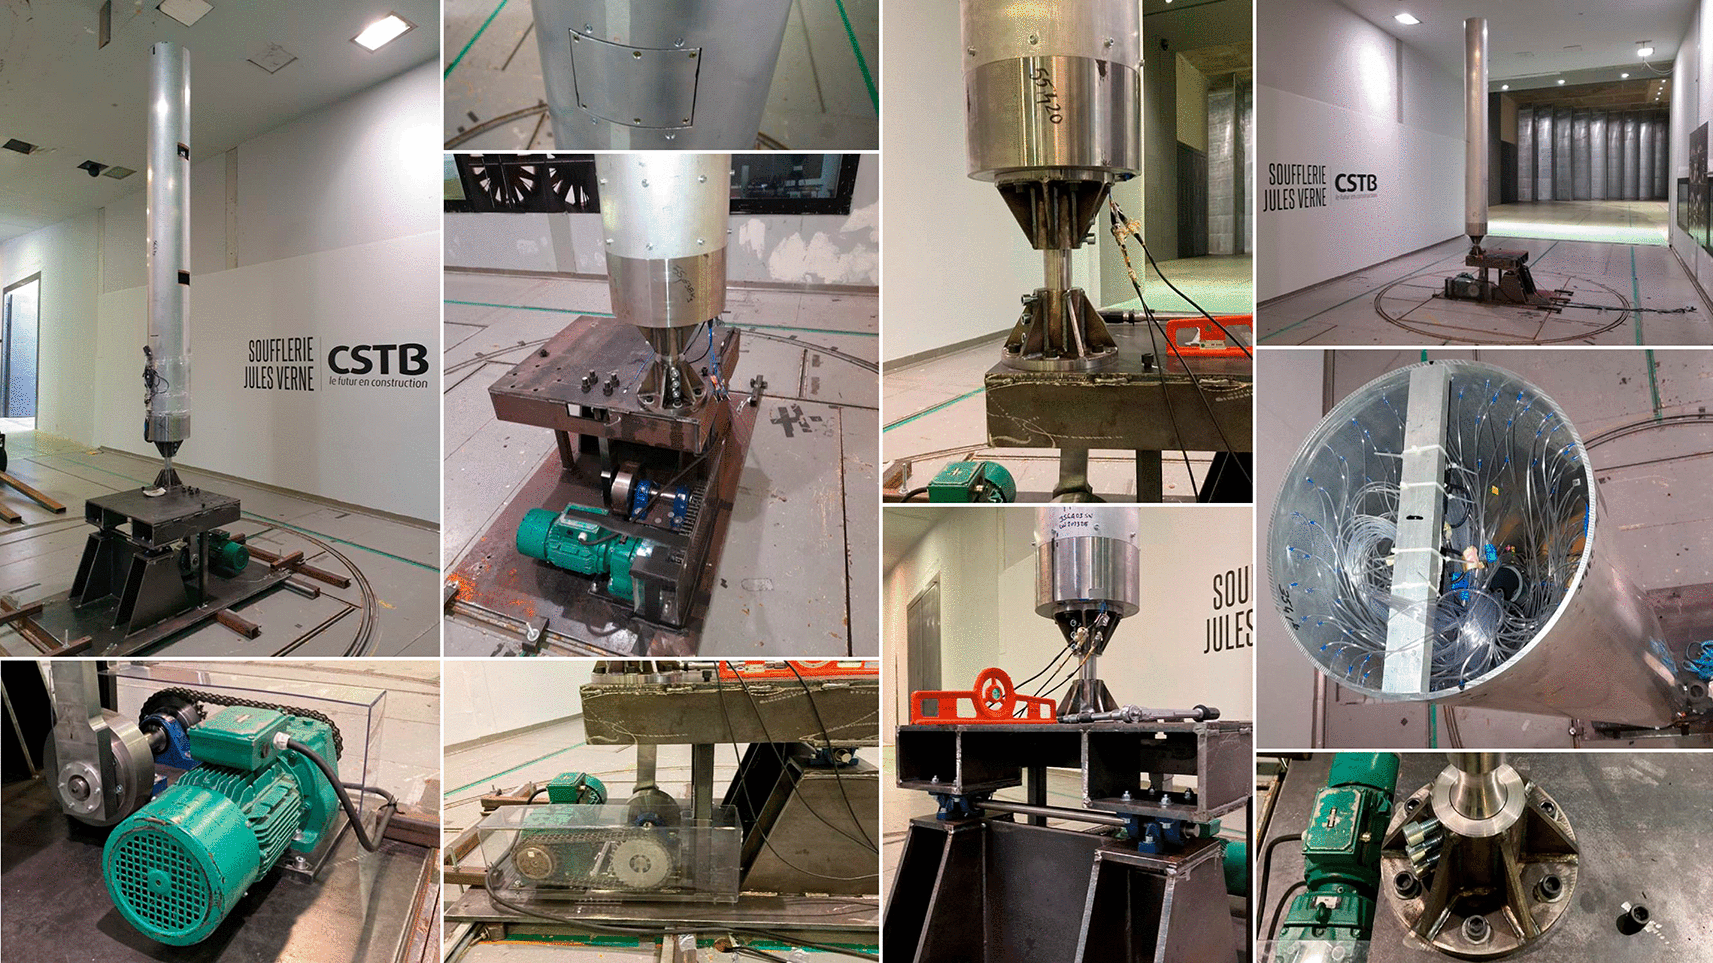
Figure 2. Single-cylinder test setup.
The close-ups show different details of the model, including the tilting apparatus, the electrical motor with the eccentric rod, the base connection of the pivot model, and the pressure tap tubes.
2.1 Motion of the tilting apparatus
The tilting apparatus is designed to reproduce a sinusoidal-like motion induced by the rotating eccentric rod. The kinematics of the system is described by the following equations:
(1)
where all quantities are defined in
Figure 3(a). The heave displacement
of the cylinder is approximately given by:
(2)
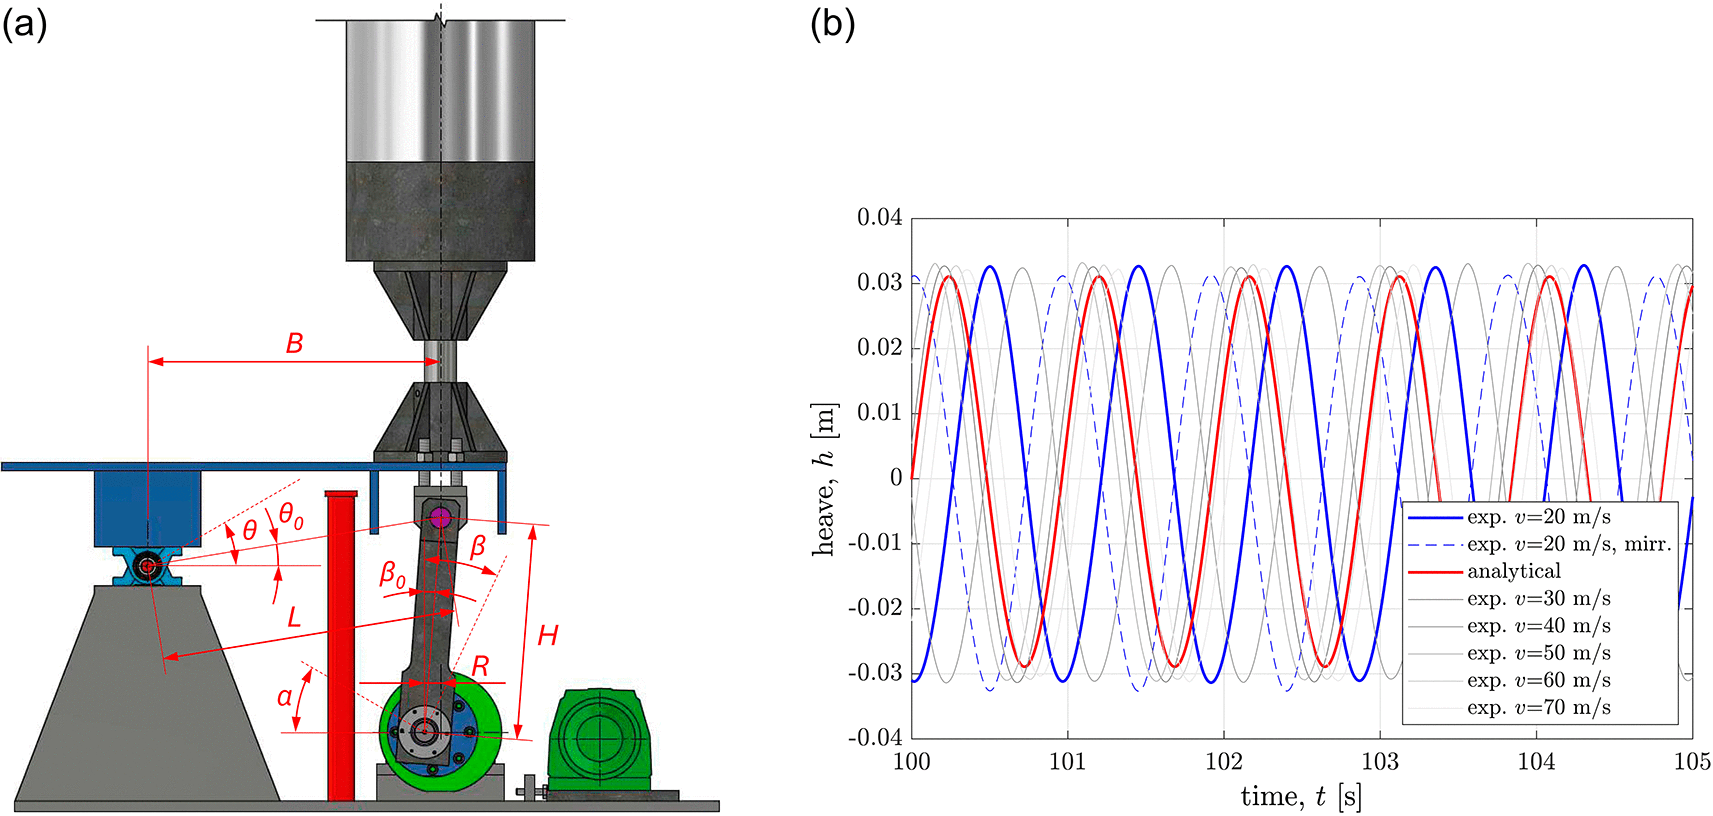
Figure 3. Geometry of the tilting apparatus and heave displacement of the tower.
(a) geometry (b) heave displacement.
It is worth noting that a more accurate estimation would require considering the distance between the fulcrum and the base of the cylinder, along with a correction to the angle
to account for the different initial orientation of the line connecting the fulcrum and the base.
The geometry of the tilting apparatus is optimized to minimize the distortion of the sinusoidal motion. While the lengths of the positive and negative half-periods are equal, their amplitudes differ (Figure 3(b)). This is confirmed by the base displacements obtained through double integration of the base acceleration time series using the Fast Fourier Transform (FFT) and its inverse (IFFT), namely:
(3)
(4)
(5)
where
is the record of the vertical acceleration,
is the imaginary unit,
is the time, and
is the frequency. Prior to applying the IFFT, all values of
corresponding to frequencies smaller than 1.0 Hz are set to zero (as a perfect high-pass filtering). Moreover, it is assumed that the recorded acceleration approximates the absolute acceleration, even though the accelerometer is attached to the moving body, and therefore operating in a non-inertial reference frame.
2.2 Circularity of the cylinder
The circularity of the cylinder equipped with pressure taps was verified using caliper measurements at the level of each of the eight rings. Measurements were repeated at multiple positions around the circumference, as detailed in Table 3. The cross-section of the cylinder is approximately circular, with maximum deviations of 1.0 mm from the average. Moreover, deviations (and therefore deformations) increase towards the top of the cylinder. In addition, the average diameter closely matches the value obtained using a circometer (Figure 4), which is 354.5 mm for each ring.
Table 3. Measurements of the cylinder diameter at each ring level.
Diameters measured using a caliper with a 500 mm measuring range and a 300 mm jaw length. The angle indicates where one of the jaws is pointing.
| Angle [
] | Diameter [mm] |
|---|
| Ring 1 | Ring 2 | Ring 3 | Ring 4 | Ring 5 | Ring 6 | Ring 7 |
Ring 8 |
|---|
| 0.0 | 354.5 | 354.4 | 354.4 | 354.3 | 354.3 | 354.3 | 354.3 | 354.2 |
| 28.8 | 354.9 | 354.9 | 354.9 | 354.9 | 354.8 | 354.4 | 354.3 | 354.2 |
| 57.6 | 355.4 | 355.3 | 355.1 | 355.0 | 354.7 | 354.5 | 354.4 | 354.5 |
| 86.4 | 354.5 | 354.5 | 354.4 | 354.3 | 354.2 | 354.5 | 354.3 | 354.5 |
| 115.2 | 353.4 | 353.4 | 353.6 | 353.8 | 353.9 | 354.1 | 354.3 | 354.3 |
| 144.0 | 353.5 | 353.6 | 353.7 | 353.9 | 354.0 | 354.1 | 354.4 | 354.3 |
| 172.8 | 354.5 | 354.5 | 354.4 | 354.4 | 354.4 | 354.4 | 354.4 | 354.3 |
| average | 354.4 | 354.4 | 354.4 | 354.4 | 354.3 | 354.3 | 354.3 | 354.3 |
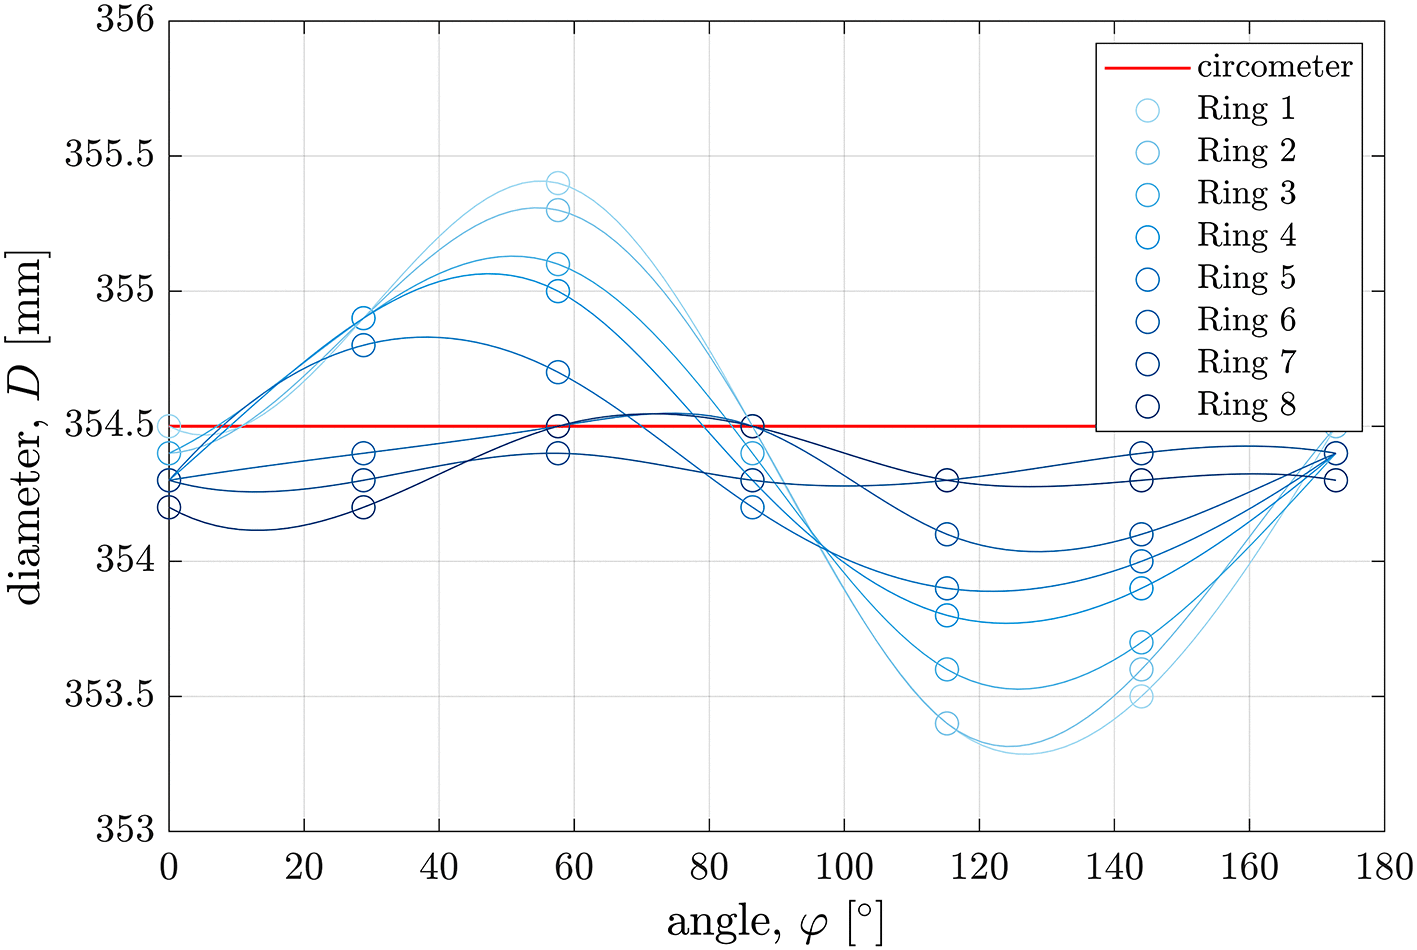
Figure 4. Diameter of the cylinder measured at each ring level and different positions around the circumference.
Experimental points interpolated with a spline curve. The angle indicates where one of the jaws of the caliper is pointing.
2.3 Wind tunnel
The experiments were carried out in the Jules Verne climatic wind tunnel, at the Centre Scientifique et Technique du Bâtiment (CSTB) in Nantes (France). The facility features a working cross-section measuring 6 m in width and 5 m in height. The maximum mean flow velocity is 75 m/s, with a resolution of approximately 0.1 m/s. The turbulence intensity is approximately 1.5% in the longitudinal direction and 1.0% in the lateral direction.37 At lower wind velocities, the turbulence intensity is slightly higher, although it quickly stabilizes to nearly constant values.37 The floor is made of reinforced concrete, except the portion where the turning table is located, which is made of steel plates. The working section is equipped with a Pitot tube for the real-time monitoring of flow velocity, which is regulated by adjusting the blade pitch of 6 fans (about 500 kW each). The wind tunnel has recently been renovated with upgrades to the dynamic circuit.38
3. Experimental campaign
Wind tunnel tests are organized into five main phases (Table 4). These may differ in terms of flow velocity range (Figure 5), pressure taps connected to the scanners (Table 5), base movement, angle of attack (Figure 6), and number of cylinders. All tests are conducted in uniform flow conditions. In Phase 1, all 8 rings of pressure taps are active. In Phase 2 only two rings are used due to the limited availability of high-range pressure scanners, which are necessary to prevent saturation of standard scanners (
Pa) at high flow velocities. In Phase 3, the number of active rings is further optimized by suppressing 4 pressure taps per ring to remain within the 64 channels of available high-range pressure scanners, while maintaining adequate azimuthal resolution. The azimuthal locations of the 21 active pressure taps per ring were determined using an optimization algorithm. In Phase 5, all 8 rings of pressure taps are connected to the scanners; however, only half of the pressure taps in Ring 8 provided reliable measurements, covering one half of the cylinder circumference. The positions of the active rings along the cylinder height are detailed in Table 5, while the natural frequencies of the model in the along- and across-flow directions are reported in Table 6. The campaign is organized as follows:
• Phase 1 focuses on investigating the pressure distribution on a single cylinder mounted on the tilting apparatus, for Reynolds numbers in the range from 4.73·105 to 8.99·105. Different angles of attack are tested in the absence of rolling motion of the base, in order to verify the symmetry of the setup and assess whether deviations in circularity affect the results. Moreover, at an inflow velocity of approximately 38 m/s, various roll frequencies in the range from 0.7 Hz to 1.5 Hz are tested in combination with different angles of attack. This phase is affected by an issue in the acquisition of the reference static pressure. As a result, the entire pressure dataset is biased, potentially leading to an inaccurate estimation of the wind-tunnel flow velocity. A possible correction is presented in Section 3.3.
• Phase 2 aims to achieve a broader range of Reynolds numbers, from 1.18·105 to 1.66·106, enabled by the use of high-range pressure scanners (limited to Rings 6 and 7). A single cylinder is mounted directly on the wind tunnel floor,36 with the base connection screwed into the steel portion of the floor.
• Phase 3 extends the previous phase, maintaining a broad range of Reynolds numbers from 2.37·105 to 1.66·106. A single cylinder mounted on the tilting apparatus is tested with three rings of pressure taps active. The base is either fixed or rolling at frequencies of 1.04 Hz and 1.40 Hz, with zero angle of attack. Furthermore, configurations with two cylinders in tandem and scattered (
angle of attack) are investigated. In these cases, the dummy cylinder is placed windward. The base is either fixed or rolling at the frequency of 0.80 Hz, reduced compared to the previous tests due to technical limitation of the electric motor related to the heavier setup.
• Phase 4 is an exploratory aeroelastic test conducted on a single cylinder at low Reynolds numbers, aimed at promoting synchronization between vortex shedding and the natural frequency of the vibrating body (lock-in). Tests are performed on the cylinder without pressure taps, and two different diameters of the base connection rod, namely 60 mm and 40 mm, are tested. The corresponding natural frequencies of the model are 8.90 Hz and 6.48 Hz, respectively. The rotating base of the tilting apparatus is mounted directly on the wind tunnel floor to have a stiffer support. Only the accelerations at the top of the cylinder are measured.
• Phase 5 repeats the tests performed in Phase 1.A over a broader range of Reynolds numbers, from 9.47·104 to 9.94·105, to address the aforementioned data-acquisition issues and to investigate the potential influence of the tilting apparatus on the pressure distribution around the lower portion of the cylinder. The cylinder is mounted directly on the wind-tunnel floor, as in Phase 2.
Table 4. Tests performed in the different phases of the wind tunnel campaign.
The notation
:
:
provides the lower bound
and the upper bound
of the interval, and the step
.
| Phase | No. of cylinders | Roll frequency
a | Angle of attack | Flow velocity | Pressure | Acceleration |
|---|
| [−] | [−] | [Hz] | [
] | [m/s] | [−] | [−] |
|---|
| 1.A
b,
c | 1 | 0.00 | 0.0 | 20:≈1:38 | yes | yes |
| 1.B
b | 1 | 0.00 | 7.2 | 22:1:38 | yes | yes |
| 1.C
b,
c | 1 | 0.00 | 43.2 | 21:≈1:37 | yes | yes |
| 1.D
b,
c | 1 | 0.00 | 86.4 | 22:≈1:38 | yes | yes |
| 1.E
b | 1 | 1.74 | 0.0 | 22:1:38 | yes | yes |
| 1.F
b | 1 | 0.7:0.1:1.5 | 0.0 | 38 | yes | yes |
| 1.G
b | 1 | 0.7:0.1:1.5 | −10.0 | 38 | yes | yes |
| 1.H
b | 1 | 0.7:0.1:1.5 | −43.2 | 38 | yes | yes |
| 1.I
b | 1 | 0.7:0.1:1.2 | −90.0 | 38 | yes | yes |
| 2.A
d | 1 | 0.00 | 0.0 | 5:≈5:70 | yes | no |
| 3.A | 1 | 0.00 | 0.0 | 10:2:70 | yes | yes |
| 3.B | 1 | 1.04 | 0.0 | 10:2:70 | yes | yes |
| 3.C | 1 | 1.40 | 0.0 | 40:2:70 | yes | yes |
| 3.D | 2 | 0.00 | 0.0 | 40:2:70 | yes | yes |
| 3.E | 2 | 0.00 | 7.2 | 40:4:68 | yes | yes |
| 3.F | 2 | 0.80 | 0.0 | 40:4:68 | yes | yes |
| 3.G | 2 | 0.80 | 7.2 | 40:4:68 | yes | yes |
| 4.A
e | 1 | 0.00 | 0.0 | 12:0.2:20 | no | yes |
| 4.B
e | 1 | 0.00 | 0.0 | 10:0.2:16 | no | yes |
| 5.A | 1 | 0.00 | 0.0 | 4:2:42 | yes | no |
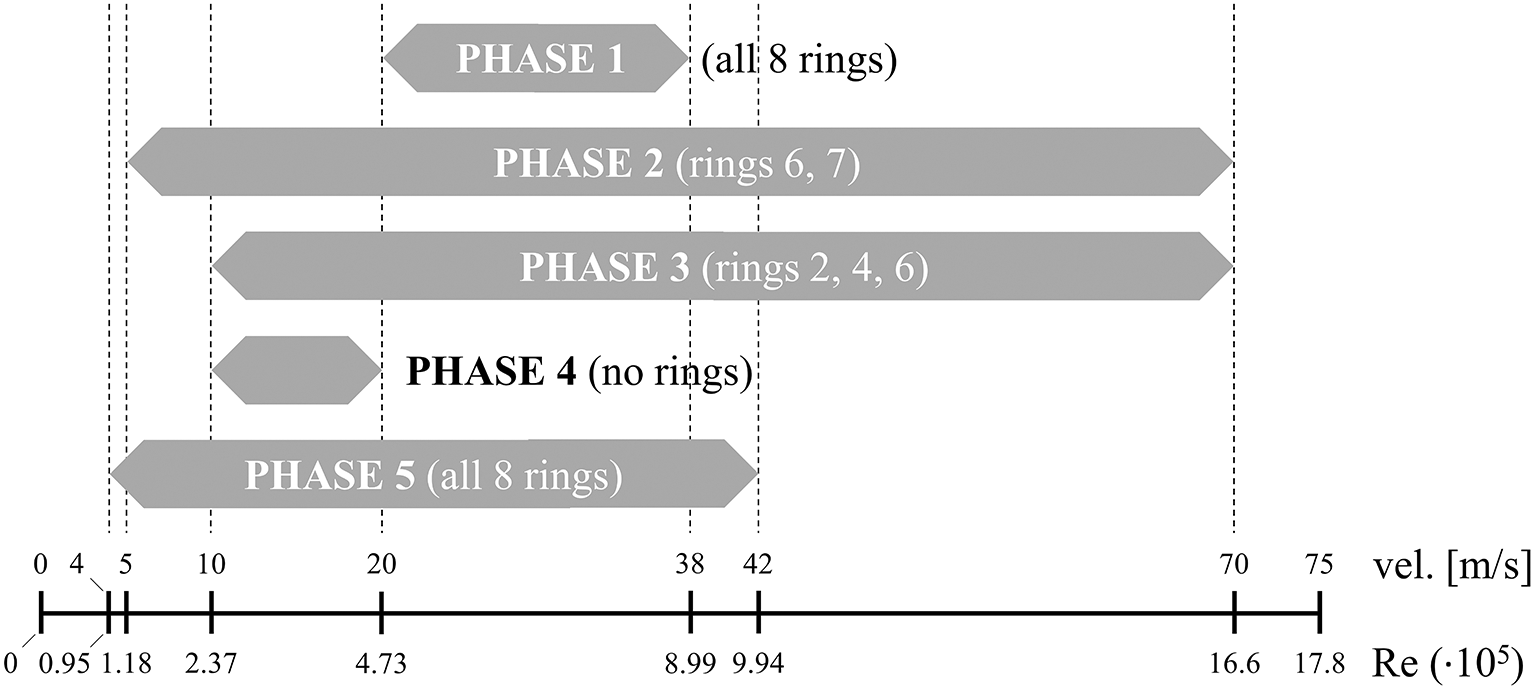
Figure 5. Reynolds number range explored in the different phases of the experimental campaign.
Table 5. Details on the pressure measurements in the different phases of the wind tunnel campaign.
is the distance of the
-th ring from the top, normalized by the cylinder diameter.
| Ring |
| No. of active pressure taps |
|---|
| Phase 1 | Phase 2 | Phase 3 |
Phase 5 |
|---|
| 1 | 0.085 | 25 | 0 | 0 | 25 |
| 2 | 0.169 | 25 | 0 | 21 | 25 |
| 3 | 0.338 | 25 | 0 | 0 | 25 |
| 4 | 0.676 | 25 | 0 | 21 | 25 |
| 5 | 0.986 | 25 | 0 | 0 | 25 |
| 6 | 1.972 | 25 | 25 | 21 | 25 |
| 7 | 2.958 | 25 | 25 | 0 | 25 |
| 8 | 5.916 | 25 | 0 | 0 | 13 |
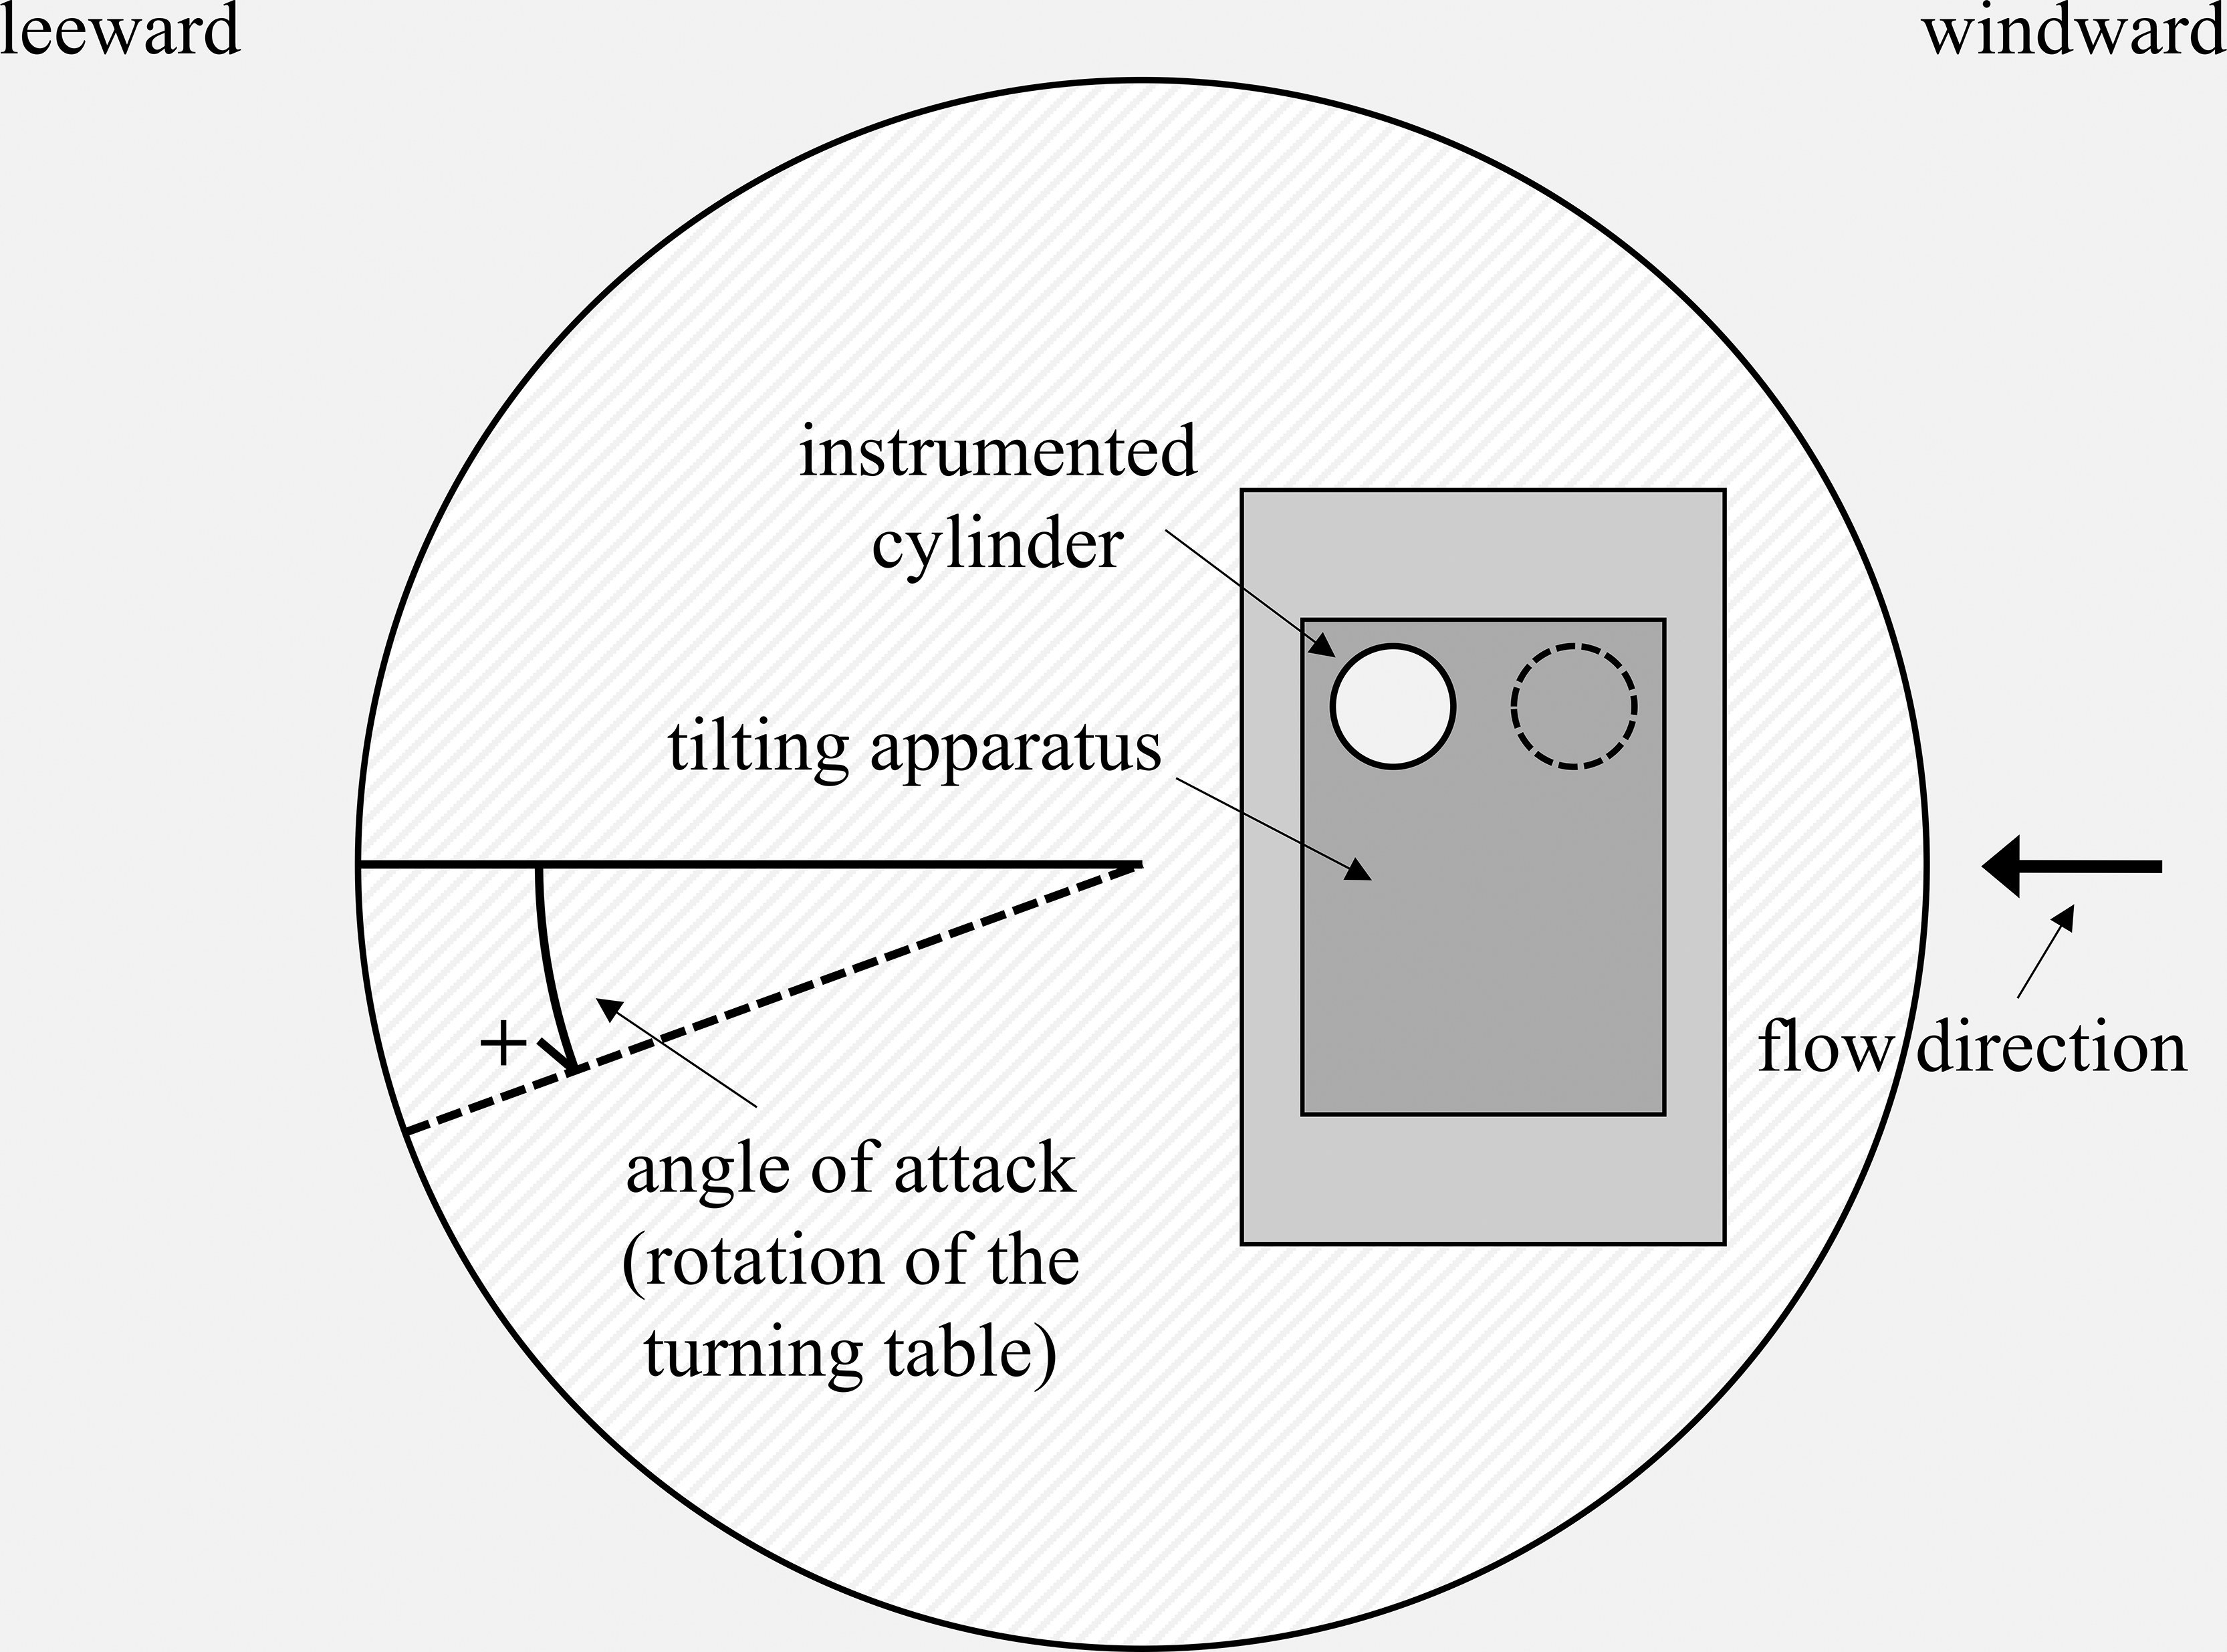
Figure 6. Schematic of the test setup corresponding to an angle of attack of 0
.
Table 6.
Natural frequencies of the cylinder in the along- and across-flow directions, estimated through operational modal analysis of the acceleration records.
In Phase 5, a free-decay test was performed for modal identification.
| Phase | Natural frequency [Hz] |
|---|
| Along-flow
|
Across-flow
|
|---|
| 1.A–1.D | 6.30 | 5.79 |
| 3.A | 6.80 | 6.28 |
| 3.D, 3.E
a | 6.03 | 6.01 |
| 4.A | 8.46 | 8.90 |
| 4.B | 6.33 | 6.48 |
| 5.A | 5.86 | 6.96 |
A preliminary processing of the data showed that the mean pressure distribution and aerodynamic coefficients are influenced by the free end of the cylinder,34 as expected. In addition, the power spectral density of the lift coefficient is only slightly affected by the base rolling motion at high Reynolds numbers.35 Moreover, a multi-cell vortex shedding associated with two different reduced frequencies (approximately 0.05 Hz at the top and 0.2 Hz at the mid-span of the cylinder) was identified, suggesting spatial variations in vortex shedding patterns along the cylinder height.39 It is also worth noting that the natural frequencies of the model (Table 6) may be close to the vortex shedding frequency (e.g.,39) and therefore fall within the lock-in range of vortex-induced vibration. Consequently, the test setup has the potential to enable aeroelastic testing in the subcritical Reynolds number regime, whereas, the test setup, resulting in the model frequencies reported in Table 6, was not designed to investigate aeroelastic responses induced by mid-span vortex shedding in the supercritical Reynolds number regime.
3.1 Instrumentation
The test setup is equipped with pressure scanners and accelerometers, whose specifications and availability vary depending on the test phase, as detailed in Table 7.
Table 7. Instrumentation used in the experimental campaign.
| Phase | Instrument | No. | Sensor description |
|---|
| 1 | Pressure scanner | 6 | Pressure System Incorporated, model 32RG-010300000. Pressure range of
Pa and sampling rate of 200 Hz. Channels: Ring 1 from 1 to 25; Ring 2 from 26 to 31; Ring 3 from 64 to 75; Ring 4 from 76 to 100; Ring 5 from 101 to 125; Ring 6 from 126 to 150; Ring 7 from 151 to 175; Ring 8 from 176 to 200. |
| 1 | Pressure scanner | 1 | Pressure System Incorporated, model ESP-32HD. Pressure range of
Pa and sampling rate of 200 Hz. Channels: Ring 2 from 32 to 50; Ring 3 from 51 to 63. |
| 2 | Pressure scanner | 2 | Pressure System Incorporated, model ESP-32HD. Pressure range of
Pa and sampling rate of 200 Hz. Channels: Ring 6 from 1 to 25; Ring 7 from 26 to 50. |
| 3 | Pressure scanner | 2 | Pressure System Incorporated, model ESP-32HD. Pressure range of
Pa and sampling rate of 200 Hz. Channels: Ring 2 from 1 to 21; Ring 4 from 22 to 42; Ring 6 from 43 to 63. |
| 5 | Pressure scanner | 6 | Pressure System Incorporated, model 32RG-010300000. Pressure range of
Pa and sampling rate of 200 Hz. Channels: Ring 1 from 1 to 25; Ring 2 from 26 to 31; Ring 3 from 64 to 75; Ring 4 from 76 to 100; Ring 5 from 101 to 125; Ring 6 from 126 to 150; Ring 7 from 151 to 175; Ring 8 from 176 to 188. |
| 1 | Accelerometer | 2 | PCB Piezotronics, model 356A03. Sampling rate of 300 Hz. Position: one accelerometer mounted on the inner surface at the top of the cylinder, and another one on the top surface of the rolling base. The latter is positioned at the same distance from the rolling axis as the geometric center of the cylinder. |
| 3 | Accelerometer | 2 | PCB Piezotronics, model 356A03. Sampling rate of 200 Hz. Position: one accelerometer mounted on the inner surface at the top of the cylinder, and another one on the top surface of the rolling base. The latter is positioned at the same distance from the rolling axis as the geometric center of the cylinder. |
| 4 | Accelerometer | 1 | PCB Piezotronics, model 356A03. Sampling rate of 300 Hz. Position: accelerometer mounted on the inner surface at the top of the cylinder. |
3.2 Dataset
The dataset is openly accessible in the Zenodo repository.36 The data are organized according to the phase structure, and each file is assigned a code that unequivocally identifies the experiment and its key parameters, namely:
| PH1 | _ | 1C | _ | P | _ | f0p00 | _ | a00p0 | _ | u23p1 | .txt |
|---|
| phase no. | | no. of cylinders | | Quantity
(P = pressure, A = acceleration) | | Frequency
(p = point)
[Hz] | | angle of attack
(p = point)
[∘] | | flow velocity
(p = point)
[m/s] | extension |
• Phases 1.B, 1.E–1.I, 2.A, 3.A–3.G, 5.A
| PH3 | _ | 1C | _ | P | _ | f0p00 | _ | a00p0 | _ | u40 | .txt |
|---|
phase no.
(PH1, PH2, PH3, PH5) | | no. of cylinders
(1C, 2C) | | quantity
(P = pressure, A = acceleration) | | frequency
(p = point)
[Hz] | | angle of attack
(p = point)
[∘] | | flow velocity
[m/s] | extension |
| PH4 | _ | 1C | _ |
A | _ |
f0p00 | _ | a00p0 | _ |
u12p8 | _ |
d60 | .txt |
|---|
| phase no. | | no. of cylinders | | quantity
(A = acceleration) | | frequency
(p = point)
[Hz] | | angle of attack
(p = point)
[∘] | | flow velocity
(p = point)
[m/s] | | rod diameter
(d40, d60)
[mm] | extension |
The data are provided in text files, and the meaning of each column is explained in the first line. A comprehensive list of the available files is also provided in the documentation. In the same repository, a collection of pictures, sketches, and videos is available to help users visualize the experiments.
3.3 Correction of Phase 1 dataset
Phase 1 pressure measurements are affected by erroneous values of the static pressure in the wind tunnel. Table 8 summarizes the procedure adopted to estimate
, i.e., the deficit in mean static pressure to be added to all pressure measurements associated with the same test. The procedure is based on a Bayesian estimate of the mean flow velocity, derived by combining the prior knowledge of the blade pitch of the wind tunnel fans with pressure measurements acquired during Phase 1 and repeated in Phase 2 and Phase 3. Mean wind speed and turbulence intensity are not derived from the Pitot-tube measurements but instead from the pressure measurements at the stagnation points of Rings 5 and 6, averaged over the two locations. This choice is motivated by concerns that the Pitot tube may not sample undisturbed flow because of its location near the cylinder free end, where a three-dimensional flow pattern is expected. In contrast, the pressure measurements from Rings 5 and 6, located at normalized distances of approximately
and
from the tip, respectively, are expected to be less affected by free-end effects or boundary-related disturbances. Therefore, the dynamic reference pressure used in the calculation of
is preferentially estimated from the pressure measurements at the stagnation point of rings located sufficiently far from the tip, where free-end effects are expected to be negligible.
Table 8. Procedure for the correction of Phase 1 dataset.
| Step | Definition |
u.m. | Comment |
|---|
| 1 |
| Pa | Estimate of the deficit in mean static pressure. |
| 2 |
and
| Pa | Mean pressure at the stagnation point of
a and
(pressure at the measurement tap minus the biased static reference pressure). |
| 3 |
| kg/m3 | Mean air density measured in the wind tunnel. |
| 4 |
| m/s | Estimate of the mean flow velocity based on the blade pitch
(in percentage) of the wind-tunnel fans;
and
are empirically determined parameters. |
| 5 |
| m/s | Bayesian correction to the mean flow velocity, obtained by combining the prior knowledge of
with the pressure measurements at
,
,
(Phase 3), and
(Phase 2). |
| Optimum estimate of
|
| 6.a |
| m/s | Trial value of
. |
| 6.b |
| - | Mean pressure coefficient associated with the pressure tap at azimuth
on Ring
for the trial velocity
. |
| 6.c |
| - | Mean squared error quantifying the deviation between the mean pressure coefficients of
,
and
associated with Phase 1 (I) and Phase 3 (III). |
|
| - | Mean squared error quantifying the deviation between the mean pressure coefficients of
associated with Phase 1 (I) and Phase 2 (II). |
| 6.d |
| - | Weights applied to pressure-coefficient deviations in the calculation of the MSE; greater importance is assigned to the base-pressure region, whereas lower importance is assigned to suction peaks in regions affected by flow instabilities. The weights are mirrored for
. |
| 6.e |
,
,
,
| m/s | Trial values of
that minimize
,
,
, and
, respectively. |
| 6.f |
| m/s | Optimum value of
, obtained as the weighted sum of the ring-specific estimates, being
. |
| 6.g |
| - | Weight assigned to
; larger values of
yield larger weights, so that the optimum value of
remains reasonably close to
and excessively large mismatches are avoided. |
The procedure is applied to correct the data from Phases 1.A, 1.C, and 1.D (Table 4), whereas it cannot be used for Phase 1.B. The root cause is the
angular offset between the pressure-tap positions in Phase 1.B with respect to the pattern of Phases 2.A and 3.A, which leads to two main consequences. First, Phase 1.B lacks pressure taps along the vertical stagnation line of the test model, preventing a reliable assessment of the dynamic reference pressure. Second, the offset precludes a direct comparison between the pressure distributions of Phase 1.B and those of Phases 2 and 3. The latter issue could be circumvented through linear interpolation; however, this would introduce approximations and additional uncertainty, potentially compromising the reliability and accuracy of the correction procedure.
Moreover, no correction is provided for the phases involving an active tilting apparatus, i.e, Phases 1.F, 1.G, 1.H, and 1.I, because the corresponding Phase 3 measurements were performed under different flow velocities, angles of attack, or roll frequencies.
4. Conclusions
This paper presents a wind tunnel campaign conducted on finite-length circular cylinders with an aspect ratio of 9, modeling half-towers of offshore wind turbines standing on the deck of installation vessels. Experiments are carried out under uniform flow conditions at variable Reynolds numbers, up to 1.66·106, with either a fixed or a rolling base to simulate vessel movement during sea transit. The test setup, consisting of either a single or a pair of cylinders equipped with pressure taps and accelerometers, is described in detail. An insight on the sinusoidal motion impressed by the tilting apparatus and the non-perfect circularity of the cylinders is also provided. The complete dataset is openly accessible via Zenodo repository. The detailed post-processing of the data will be available in forthcoming publications edited by the authors.
Ethics and consent
Ethical approval and consent were not required.
References
- 1.
Torrielli A, Giusti A:
Seismic response of towers of offshore wind turbines on sliding foundations at the port quayside.
Renew. Energy.
2026; 256: 123887. Publisher Full Text
- 2.
Mannini C, Massai T, Giachetti A, et al.:
Aerodynamic loads on groups of offshore wind turbine towers stored on quaysides during the pre-assembly phase.
J. Wind Eng. Ind. Aerodyn.
2023; 242: 105569. Publisher Full Text
- 3.
Mannini C, Massai T, Giachetti A, et al.:
Aerodynamic loads on wind turbine towers arranged in groups with and without helical strakes.
Proceedings of the XVII Conference of the Italian Association for Wind Engineering – IN-VENTO 2022.
2024; 260–269. Publisher Full Text
- 4.
Giusti A, Ballantini T, Torrielli A, et al.:
Gust buffeting response of a wind turbine tower in mild and severe wind conditions at Østerild Test Center.
Wind Struct.
2026; 42(2): 167–195. Publisher Full Text
- 5.
Kurniawati I, Lupi F, Seidel M, et al.:
Vortex shedding load on a full-scale wind turbine tower at transcritical Reynolds numbers.
J. Wind Eng. Ind. Aerodyn.
2024; 252: 105821. Publisher Full Text
- 6.
Kurniawati I, Lupi F, Seidel M, et al.:
Vortex-induced vibrations and post-lock-in cross-wind oscillations of wind turbine tower based on field measurements.
J. Wind Eng. Ind. Aerodyn.
2025; 258: 106010. Publisher Full Text
- 7.
Sumner D:
Flow above the free end of a surface-mounted finite-height circular cylinder: A review.
Journal of Fluids and Structures.
2013; 43: 41–63. Publisher Full Text
- 8.
Müller FP, Nieser H:
Measurements of wind-induced vibrations on a concrete chimney.
J. Wind Eng. Ind. Aerodyn.
1975; 1: 239–248. Publisher Full Text
- 9.
Hirsch G, Ruscheweyh H:
Full-scale measurements on steel chimney stacks.
J. Wind Eng. Ind. Aerodyn.
1975; 1: 341–347. Publisher Full Text
- 10.
Shears M:
Report on wind and vibration measurements taken at the Emley Moor television tower.
J. Wind Eng. Ind. Aerodyn.
1975; 1: 113–124. Publisher Full Text
- 11.
Basu RI, Vickery BJ:
Across-wind vibrations of structure of circular cross-section. Part II. Development of a mathematical model for full-scale application.
J. Wind Eng. Ind. Aerodyn.
1983; 12(1): 75–97. Publisher Full Text
- 12.
Christensen O, Askegaard V:
Wind forces on and excitation of a 130-m concrete chimney.
J. Wind Eng. Ind. Aerodyn.
1978; 3(1): 61–77. Publisher Full Text
- 13.
Hansen SO:
Cross-wind vibrations of a 130-m tapered concrete chimney.
J. Wind Eng. Ind. Aerodyn.
1981; 8(1–2): 145–155. Publisher Full Text
- 14.
Melbourne WH, Cheung JCK, Goddard CR:
Response to wind action of 265-m Mount Isa stack.
J. Struct. Eng.
1983; 109(11): 2561–2577. Publisher Full Text
- 15.
Galemann T, Ruscheweyh H:
Measurements of wind induced vibrations of a full-scale steel chimney.
J. Wind Eng. Ind. Aerodyn.
1992; 41(1–3): 241–252. Publisher Full Text
- 16.
Sanada S, Suzuki M, Matsumoto H:
Full scale measurements of wind force acting on a 200m concrete chimney, and the chimney’s response.
J. Wind Eng. Ind. Aerodyn.
1992; 43(1–3): 2165–2176. Publisher Full Text
- 17.
Waldeck JL:
The measured and predicted response of a 300 m concrete chimney.
J. Wind Eng. Ind. Aerodyn.
1992; 41(1–3): 229–240. Publisher Full Text
- 18.
Ellingsen ØM, Flamand O, Amandolese X, et al.:
Field tests on a full-scale steel chimney subjected to vortex-induced vibrations.
Struct. Eng. Int.
2022; 32(1): 55–61. Publisher Full Text
- 19.
Manal Y, Hémon P:
Unsteady loads on circular cylinder in cross-flow: An observation in natural wind and comparison with wind tunnel experiments.
Journal of Fluids and Structures.
2024; 124: 104019. Publisher Full Text
- 20.
Achenbach E:
Distribution of local pressure and skin friction around a circular cylinder in cross-flow up to Re = 5 × 10⁶.
J. Fluid Mech.
1968; 34(4): 625–639. Publisher Full Text
- 21.
Okamoto T, Yagita M:
The experimental investigation on the flow past a circular cylinder of finite length placed normal to the plane surface in a uniform stream.
Bulletin of JSME.
1973; 16(95): 805–814. Publisher Full Text
- 22.
Farivar D:
Turbulent uniform flow around cylinders of finite length.
AIAA J.
1981; 19(3): 275–281. Publisher Full Text
- 23.
Slaouti A, Gerrard JH:
An experimental investigation of the end effects on the wake of a circular cylinder towed through water at low Reynolds numbers.
J. Fluid Mech.
1981; 112: 297–314. Publisher Full Text
- 24.
Ayoub A, Karamcheti K:
An experiment on the flow past a finite circular cylinder at high subcritical and supercritical Reynolds numbers.
J. Fluid Mech.
1982; 118: 1–26. Publisher Full Text
- 25.
Zdravkovich MM, Brand VP, Mathew G, et al.:
Flow past short circular cylinders with two free ends.
J. Fluid Mech.
1989; 203: 557–575. Publisher Full Text
- 26.
Kareem A, Cheng C-M, Lu PC:
Pressure and force fluctuations on isolated circular cylinders of finite height in boundary layer flows.
Journal of Fluids and Structures.
1989; 3(5): 481–508. Publisher Full Text
- 27.
Okamoto S, Sunabashiri Y:
Vortex shedding from a circular cylinder of finite length placed on a ground plane.
J. Fluids Eng.
1992; 114(4): 512–521. Publisher Full Text
- 28.
Shih WCL, Wang C, Coles D, et al.:
Experiments on flow past rough circular cylinders at large Reynolds numbers.
J. Wind Eng. Ind. Aerodyn.
1993; 49(1–3): 351–368. Publisher Full Text
- 29.
Fox TA, Apelt CJ, West GS:
The aerodynamic disturbance caused by the free-ends of a circular cylinder immersed in a uniform flow.
J. Wind Eng. Ind. Aerodyn.
1993; 49(1–3): 389–399. Publisher Full Text
- 30.
Park C-W, Lee S-J:
Free end effects on the near wake flow structure behind a finite circular cylinder.
J. Wind Eng. Ind. Aerodyn.
2000; 88(2–3): 231–246. International Conference on wind Engineering. Publisher Full Text
- 31.
Sumner D, Heseltine JL, Dansereau OJP:
Wake structure of a finite circular cylinder of small aspect ratio.
Exp. Fluids.
2004; 37: 720–730. Publisher Full Text
- 32.
Iungo GV, Pii LM, Buresti G:
Experimental investigation on the aerodynamic loads and wake flow features of a low aspect-ratio circular cylinder.
Journal of Fluids and Structures.
2012; 28: 279–291. Publisher Full Text
- 33.
Ellingsen ØM, Amandolese X, Flamand O, et al.:
Twin Strouhal numbers in pressure loading of circular cylinder at high Reynolds numbers.
Journal of Fluids and Structures.
2022; 115: 103782. Publisher Full Text
- 34.
Giusti A, Xhelaj A, Orlando A, et al.:
Wind tunnel investigation of aerodynamic loads of circular cylinders from subcritical to supercritical Reynolds number regime.
Proceedings of the 9th European African Conference on Wind Engineering (EACWE 2025).
Trondheim, Norway:
2025.
- 35.
Torrielli A, Orlando A, Xhelaj A, et al.:
Vortex shedding of circular cylinders mounted on a rolling support at different Reynolds number regimes.
Proceedings of the 9th European African Conference on Wind Engineering (EACWE 2025).
Trondheim, Norway:
2025.
- 36.
Giusti A, Torrielli A, Orlando A, et al.:
ERIES-VORSEA dataset: Experimental investigation of the VORtex shedding of offshore wind turbine towers during SEA transit.
Zenodo.
2025. Publisher Full Text
- 37.
Ellingsen ØM:
Vortex-induced vibrations on industrial chimneys.
Institut Polytechnique de Paris;
2021. Publisher Full Text
- 38.
Palier P, Couzinet A, Bouchet J-P, et al.:
Jules verne 2.0, renewal of a large wind tunnel facility.
Proceedings of the 7th European African Conference on Wind Engineering (EACWE 2017).
Liège, Belgium:
2017.
- 39.
Flamand O, Xhelaj A, Orlando A, et al.:
The VORSEA wind tunnel experiments, in: Engineering Research Infrastructures for European Synergies.
Proceedings of ERIES-IW2025.
2025; 95–104. Publisher Full Text







