Introduction
Environmental performance of the SOCRATCES scheme1 was assessed and compared to a state-of-the-art storage technology involving the application of molten salts. This was accomplished through the performance of a life cycle analysis (LCA). While fossil-fuel driven energy technologies are characterized by convenience and ease, they have unquestionable deleterious impacts on the environment, emphasizing the need to resort to alternatives. Solar technologies are some of the most attractive solutions among environmentally friendly sources of electricity. However, solar power being available periodically only necessitates the technology's integration with storage systems. Myriad forms of storage technologies have been explored and continue to be explored, one of them being the thermochemical approach adopted in SOCRATCES. The storage allows production and/or release of energy during either peak hours or nighttime.
LCA methodology is a widely used technique to analyze the environmental impact of a process during the course of its lifetime5. It is performed to ensure that a product or a process does not affect the natural ecosystem and the environment through interference and burdening them beyond their perceived or estimated capacity. LCA of the calcium-looping technology has been performed by researchers such as Zakuciová et al.3 and Copola and Scala6, but in the context of CO2 capture from combustion power plants. Thus, the work presented here is unique in the sense that it analyses the environmental performance of a calcium-looping process designed to store solar energy.
Fundamentals of the life cycle approach
The LCA was carried out according to the international standards ISO 14040:2006 and 14044:2006 that break the LCA down into four different phases7,8 as shown in Figure 1:
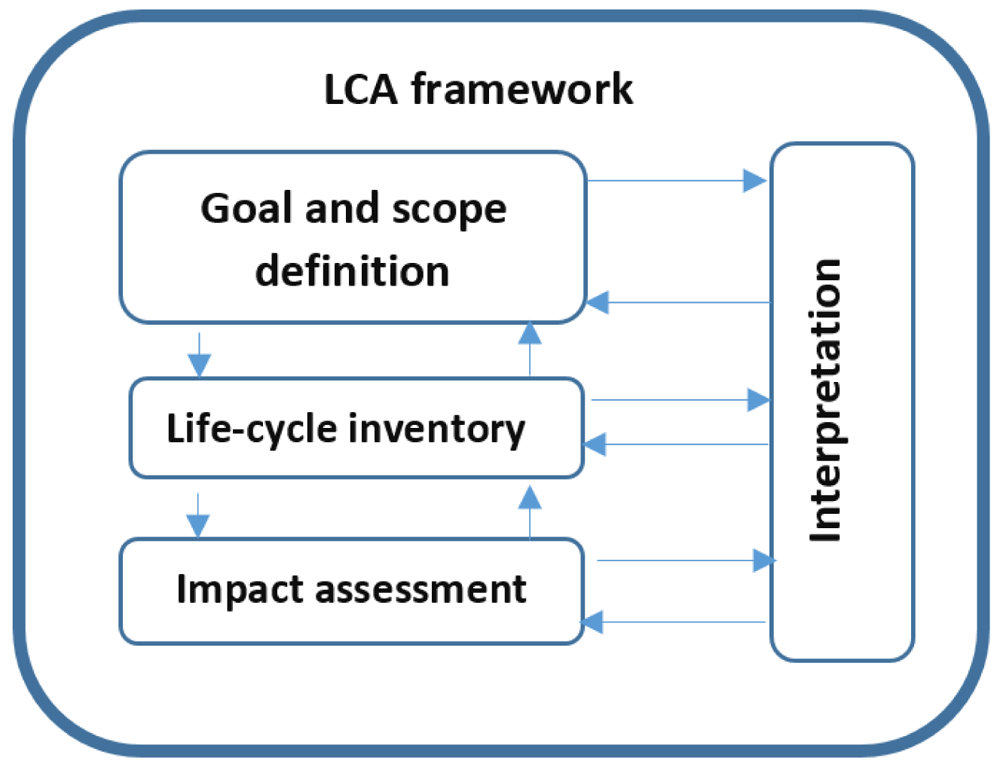
Figure 1. Different phases of the LCA according to ISO 14040:20068.
1. Goal and scope definition
2. Life cycle inventory (LCI)1
3. Life cycle impact assessment (LCIA)
4. Interpretation of results
The pertinent question in terms of objective was determining whether SOCRATCES has a comparatively lower greenhouse gas balance in contrast with comparable state-of-the-art processes or not. The collaborating teams in the consortium had come to an agreement that the functional unit to be used was 1 kWh electrical energy produced in the power block, in evaluating the environmental impacts in LCA. With the definition of the functional unit, the reference flows were determined accordingly. All input and output streams were specified on the basis of the set functional unit.
After thus defining the goal and scope to demarcate the boundary and limits, the LCA proceeds with examining the Life Cycle Inventory (LCI). This stage includes collecting and evaluating input and output streams for the examined system, assortment and aggregation of available information. Figure 2 shows a step-by-step methodology to perform the LCI. It starts with the accumulation of information, which chiefly is quantitative data of the operation of the plant.
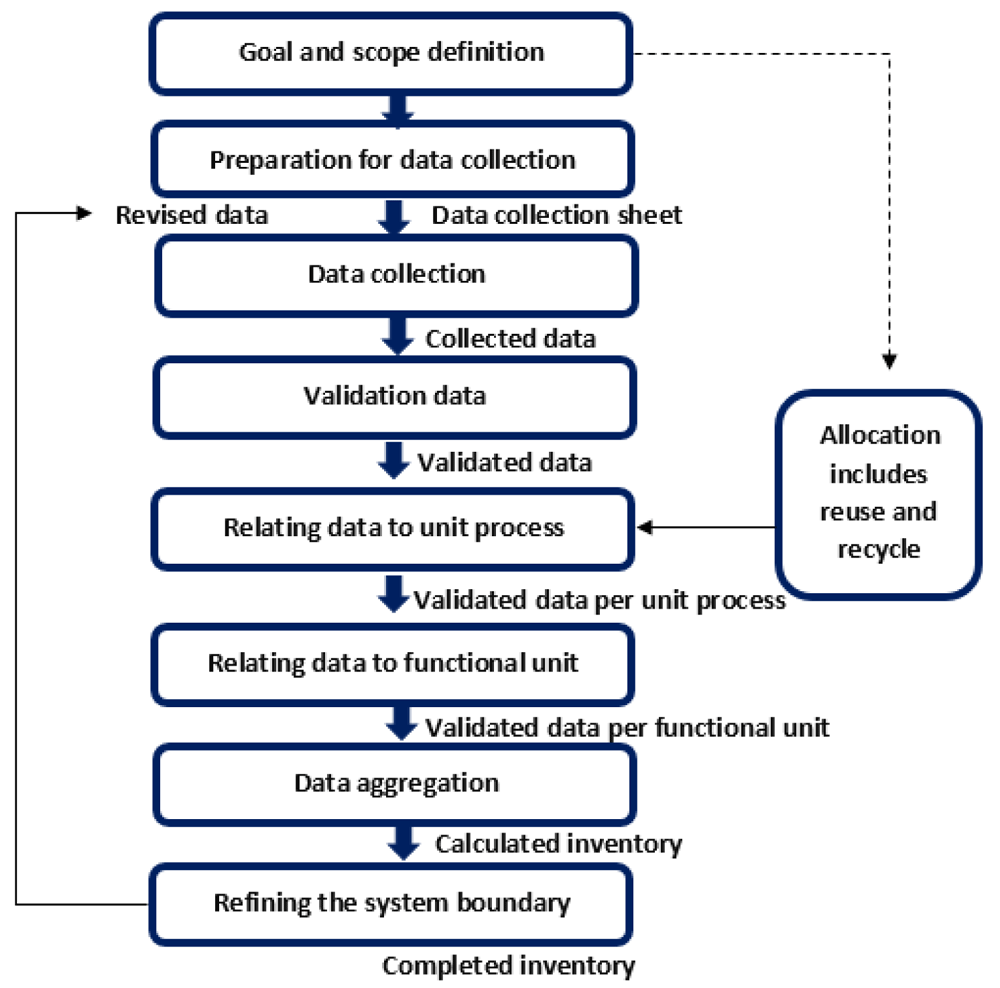
Figure 2. Life cycle inventory.
Process of data collection according to ISO 14040:20068.
A close examination of the steps outlined in Figure 2 reveals that the preliminary steps were already executed and documented in the first report on LCA, along with system boundaries for the LCA and the LCC. For the second report on LCA, while the data is revised and updated, the computation and the overall approach remains the same.
In the next phase of LCA is the life cycle impact assessment (LCIA). LCIA interprets the information gathered in the LCI, translates them into ecologically pertinent indicators such as material depletion, greenhouse potential, ozone consumption potential, acidification potential, photochemical ozone creation, water discharges, solid waste outflow, toxic potential, hazard potential and land use. Contingent upon the technique chosen and utilized in Umberto®, an assortment of these indicators is picked, suited to SOCRATCES. For this analysis, the methods ReCiPe 2008 Midpoint (H) w/o LT and IPCC 20013 were employed. The method IPCC is used to summarize the current issues contributing to the climate change, stated by the Intergovernmental Panel on Climate Change (IPCC). ReCiPe is a method used for the impact assessment that translates emissions and resource consumption into limited environmental impact categories. The applied categories can be explained as followed:
Cumulative energy demand implies the cumulative life cycle energy consumed during product production, use and disposal. Under the category of energy consumption, no further conversion into specific impact categories is carried out.
Depletion potential or amount of resource materials consumed, is currently calculated in terms of kg material per kg of the target product. Resources are defined as fundamental building blocks, needed to produce a product (e.g. coal (raw material for electricity manufacturing), oil, gas, sulfur, iron, phosphorus, sand, copper, etc.). One should keep in mind, that the weighting of the individual raw material consumption values is based on available resources and demand for the specific materials. The lower the reserves of a raw material and the higher the worldwide rate of consumption, the scarcer that resource. The following resource depletions can be referred to this impact category:
Fossil depletion (FD), reported as kg oil- equivalent
Metal depletion (MD), reported as kg Fe- equivalent
Water depletion (WD) (m3)
Emission values are initially calculated separately as water, air and soil emissions. Furthermore, they can be divided in different equivalents.
Water emissions include both, the total amount of emissions in water and the ecological impact of the chemical being emitted. The following emissions refer to this impact category:
Marine ecotoxicity (Meco), reported as kg 1,4 -DCB- equivalent
Marine eutrophication (ME), reported as kg N- equivalent
Freshwater ecotoxicity (FWeco), reported as kg 1,4 -DCB- equivalent
Freshwater eutrophication (FEW), reported as kg P- equivalent
Air emissions refer to the following impact categories:
Global warming potential (GWP), reported as kg CO2- equivalent
Photochemical oxidant formation (POCP) -kg NMVOC, reported as ethylene equivalent
Ozone depletion potential (ODP), reported as kg chlorofluorocarbon -11- equivalent
Particulate matter formation (PMF) with an aerodynamic diameter smaller than 10 mm
Solid (waste) emissions account for all materials disposed of in a landfill. Recycled or reused materials are not considered as solid waste. The following impacts can be related to this impact category:
Terrestrial acidification (TA), reported as kg SO2- equivalent
Terrestrial ecotoxicity (TE), reported as kg 1,4 - dichlorobenzene- equivalent
Land Use is an assessment of the environmental impacts on biodiversity through land use and land transformation. The following impacts are related to this impact category:
Agricultural land occupation (m2a)
Natural land transformation (m2)
Urban land occupation (m2a)
Toxicity potential refer to the following impact categories:
Human toxicity (HT), reported as kg 1,4- dichlorobenzene- equivalent
Ionising radiation (IR), reported as kg U235- equivalent
Risk potential reflects the danger of accidents in the manufacture, use and recycling of the product. The values used for the individual products are not absolute but only comparative. The following assessment quantities used are the statistical data from the employers´ accident insurance associations on workplace accidents, transportation accidents, abuse risks, plant safety, fire behavior, etc.8,10–12.
For the impact assessment, so-called midpoint category indicators are first estimated, considering problem-oriented effects on the environment and divided into different categories, e.g. acidification, climate change, and eutrophication. The impact resulting from environmental pollution can then be quantified using damage-oriented endpoint methods that are assigned to different classes. According to the ILCD handbook (International Reference Life Cycle Data System), these are human health, the natural environment and natural resources7. The environmental impacts were determined on the basis of six main aspects: the consumption of energy, depletion potential, the consumption of raw materials, resulting emissions, the toxicity potential and, the abuse and risk potential. The emission category includes water emissions, waste and air emissions. The air emission category consist of global warming (GWP), ozone depletion (ODP), acidification (AP) and photochemical ozone creation (POCP). Data acquisition and calculation were conducted according to the ISO 14044 emission categories: cumulative energy demand, depletion potential (fossil depletion or FD) in kg oil-equivalent, metal depletion (MD), in kg Fe-equivalent, water depletion (WD) in m3. Land use is an assessment of the environmental impacts on biodiversity through land use and land transformation. The toxicity potential refers to human toxicity and ionizing radiation. The last impact category is the risk potential, which reflects the danger of accidents in manufacturing, using and recycling the product7,8,12,13.
Data compilation
Due to the presence of intertwined relationships between process factors and the environment, the assessment of all impacts requires the development of a very complex model. The analysis extends from extraction of raw materials, through production, utilization, finally to disposal and recycling (“cradle to the grave”) in order to record all the relevant impacts. With these individual phases of the life cycle, other material flows are connected, which are at least partially included in the life cycle of the primary product. For a complete assessment, all substructures would have to be included in the investigation, for example, the proportionally used traffic areas, the power generation and distribution system, the computers used in the office of the administrative employees, including the associated chip production as well as the software industry etc. In order to be able to carry out an LCA at all, boundary criteria are necessary to determine a balance. Those boundaries define the process that needs to be analyzed with regard to flows, emissions, materials and work.
Figure 3 shows the system boundary for the SOCRATCES technology. Three stages of life were considered in the calculation with the Umberto® software. For the construction phase, the raw materials and the energy consumption for the components were taken from literature. The data relevant to required materials for plant operation and associated parameters were gathered from the information provided by the consortium partners in project SOCRATCES. For the use phase, a time horizon of 25 years is considered. The data for the end-of-life phase is gathered from different literature resources and the database ecoinvent.
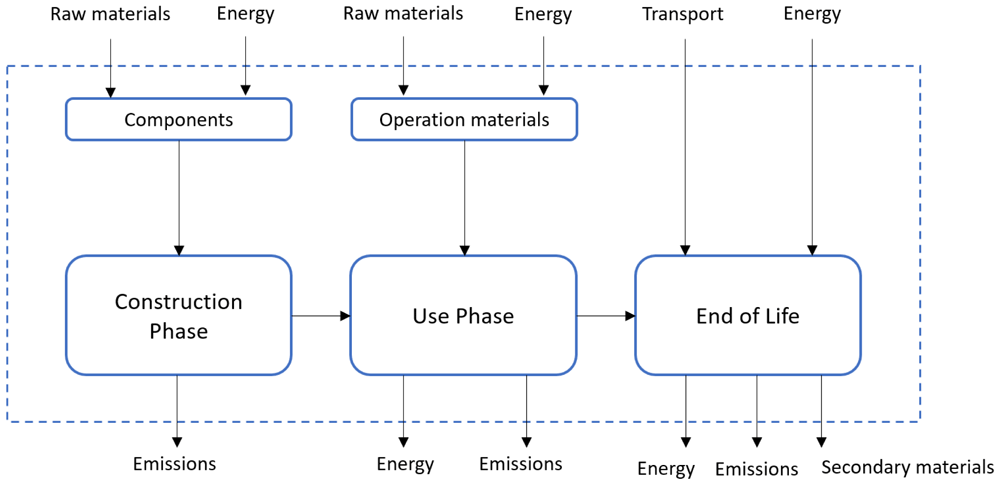
Figure 3. System boundary of the SOCRATCES technology.
On the basis of those boundaries, a differentiation was made between direct and indirect emissions. All emissions emitted into the environment directly at the power plant site during the operation phase were considered to be direct emissions. All other emissions that are not directly related to the operation of the plant were referred to as indirect emissions.
The disposal phase included the dismantling, disposal and recycling of usable materials. In general, a distinction is made between materials that have reached the end of their life cycle and are disposed of and materials that can continue to be recycled. The processes of direct recycling and processes of direct disposal are considered distinct as well. Direct recycling includes the costs of the demolition at the site as well as the sorting of individual recyclable materials in construction waste containers for further use in a subsequent recycling process (cut-off criterion). Further material recycling concerns are focused on the metallic and glass components of the system. For the solar receiver, data for construction and end of life for the solar side (heliostats and tower) is taken according to state of the art in 2016.
The SOCRATCES plant consists of two types of equipment and materials. The first is off-the-shelf products such as heat exchangers, turbines, compressors, pumps, etc. The second type comprises highly specialized custom-made equipment. Within this second category fall the calciner and carbonator reactors. It is difficult to conceive that the materials used in the construction of the two reactors will not be available for procurement from exclusively European sources, there being an amply developed high-tech industry. It is relevant to mention that this has been the case for the pilot-scale reactors erected in Seville, Spain. The reactor bodies may require the service of fabricating firms with well-equipped machine workshops, but the required capabilities are evaluated as accessible to metal workshops worldwide. The materials and instrumentation required for the rest of the plant, as mentioned already, are primarily available from European manufacturers. For the power block module of the pilot-scale plant, for example, the recuperator heat exchanger and the Stirling engine were procured from Dutch sources, while the piping and other materials were obtained from local sources in Germany where the construction took place. However, it is worth mentioning that the Stirling engine, while it was originally by a Dutch company, was in fact produced in a Chinese facility and had to be shipped from China to Germany. This may well be the case for other equipment as well since the manufacturing of innumerable European industrial producers takes place outside Europe. The list of components considered for the LCA calculation is shown in Table 1, as well as the sources for the data used for the modelling in the Umberto software.
Table 1. List of components considered in the LCA calculation14.
| Location | Component | Further Information and data recourse |
|---|
| Solar side | Heliostats | Built and assembled in Spain15 /and consortium |
| Central tower |
| Concentrator |
| Calciner | Calciner | Built in Europe/consortium |
| Heat exchanger | Manufactured in Europe/9 |
| Compressor |
| Electric motor |
| Storage | 3x Storage (CO2, CaO, CaCO3) | Manufactured in Spain/consortium |
| Carbonator | Carbonator | Manufactured in Greece/consortium |
| Heat exchanger | Manufactured in Europe/9 |
| Turbine |
| Compressor |
| Electric generator |
| Power Block | Turbine | Manufactured in China/consortium |
| Compressor |
| Regenerator |
| Cooler |
| Electric generator |
| Additional | Concrete fundament | 15 |
| Piping and wires | 15 |
| Transportation of components | Within Europe (0–3000 km) |
The material and substance flows were recorded during the construction, operation and demolition phases of the plant, as shown in Figure 3. The material flows of climate-relevant emissions were balanced for the entire life cycle. Bauxite, copper, iron and limestone were recorded as mineral resources and hard coal, lignite, crude oil, natural gas and uranium are recorded as energetic resources. The following substances relevant to the construction and operation of solar thermal systems were identified: steel-reinforced concrete, glass, stainless steel, steel, cast iron, electrical sheet, aluminum, copper, zinc, ceramics, paint, plastics and natural gas. Percentages of recycled material are also taken into account. The data were taken from different literature recourses.
For the solar side of the SOCRATCES plant, the construction for the tower and the field of heliostats includes transportation of the baseplate, the supporting structure, the control cabinet, the tower, the concentrator and the heliostat modules themselves. For the tower and the heliostats, transportation as assembled units was considered. For a complete assessment of the solar side, raw material transports should also be taken into account. However, these are subject to a wide range of fluctuations, depending on the local delivery share. The following simplifying assumptions are made to keep the analysis simple:
Only truck transports within the country of installation are considered.
Transports outside the country for imported components (e.g. by ship) are only taken into account to a limited extent within Europe.
The assumed transport distance for building materials such as concrete and structural steel is 50 km. For transporting, different lorries are used (Lorry 16–32 metric ton-km, EURo6).
The foundation consists of concrete and reinforced steel. To convert the concrete mass into the corresponding volume, a density of 2.1 t/m3 was assumed. In addition, period of operation of construction machinery was also included in the analysis. A hydraulic excavator with 50 to 100 kW output was assumed with the data taken from the ecoinvent database9.
The concentrators consist of a reflecting surface and the necessary bracket. For the SOCRATCES project, mean values were extracted from the literature and the ecoinvent database9. For corrosion resistance, the steel parts of all heliostats are galvanized. The reflective part consists of thin glass mirrors that are glued to the metal membrane16. All heliostats have a control cabinet in which control-electronics, transformers, cables and other small parts are housed. The raw material composition of components and electronics could only be roughly estimated. It was assumed that they consist of steel, plastic, aluminum and copper. The data are also taken from the database ecoinvent 39.
When accounting for the operation of the solar side (utilization phase), only maintenance and repair were considered. This includes the expenses for replacement of mirrors and their cleaning. The replacement over the course of 25 years due to breakage or corrosion was taken into account. Statistical mean values that have been taken from literature were used17. The cleaning of the mirrors was scheduled at an interval of a maximum of 6 months. This value can vary greatly depending on the weather conditions. The calculations are based on empirical values and assumed the requirement of 1 L water, 0.002 L of cleaning agent and the use of a small truck-mounted crane to clean one square meter of mirror surface18.
The calciner and carbonator are engineered and built, not to be purchased as off-the-shelf products. Since actual data available is only for the pilot-scale plant, reference values were estimated for the assessment of the two reactors. Both components were assembled in Europe, and the materials include steel, stainless steel, ceramics, PVC and copper. For operating the pilot plant, there is also an external electrical heating system with 10 kW that ensures the performance of the plant. However, this is not required for the system in large-scale operations and is therefore not included in the calculation.
Data were taken from the database for the components heat exchanger, compressor, turbine, and electric motors as prefabricated parts. Data for raw materials for cables, switch cabinets and connectors were taken from the database as well9. The same applies to the storage tanks for CaO, CaCO3 and CO2 (scaling parameters are given in the Annex).
Since most CSP plants are still in use and not completely disposed of yet, it is not possible to provide reliable data on the demolition and recycling of the complete system. For these reasons, the estimated disposal is limited to the demolition work and the transport of the components to the nearest landfill or recycling facility. It is also assumed that the solar tower plant will continue to be used after the 25-year operating period has expired. The tower, the buildings and the foundations of the heliostats and the heliostats themselves will not be dismantled. The demolition work includes the same work that was required for the construction of the SOCRATCES plant. It is expected that 50% of the construction machinery will be used, as less precise work is required. The assumed transport distance to recycling facilities is between 5–50 km. The parts to be scrapped are transported with a 40-t truck.
LCA at pilot plant scale
Figure 4 shows the pilot plant of the SOCRATCES technology with indirect CSP-CaL integration and a Stirling cycle. This scale is the first system under investigation. This configuration is based on the indirect CSP-CaL integration of a Stirling cycle operating with CO2.
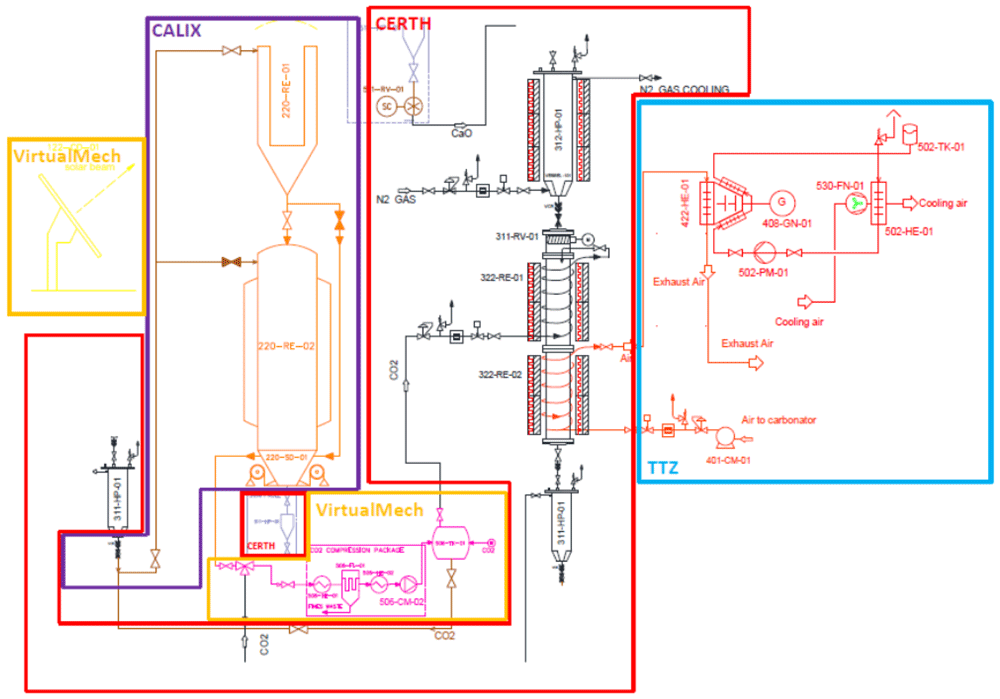
Figure 4. Pilot plant flowsheet diagram of the SOCRATCES technology14.
The data needed for sizing the components for the LCA were presented in deliverable D8.14, Report on LCC.
LCA at Industrial scale
For the industrial scale, a 10 MWth/2 MWel industrial plant with an indirect CSP-CaL integration and a Brayton cycle and a 100 MWth/60 MWe industrial plant with direct CSP-CaL integration was considered. Figure 5 shows the Industrial scale of the SOCRATCES technology19.
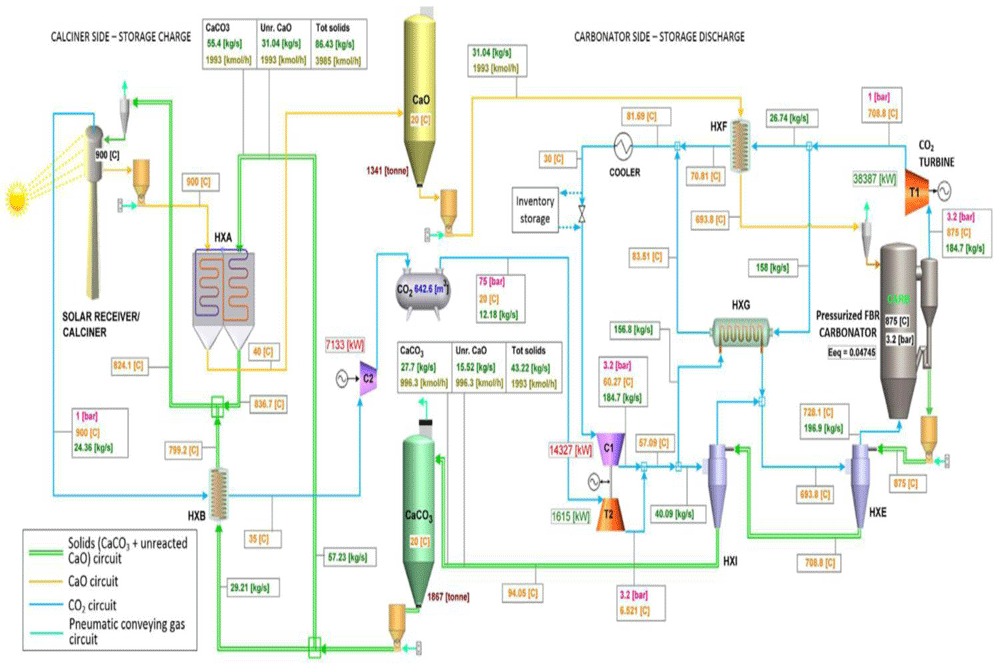
Figure 5. Industrial-scale of the SOCRATCES technology2.
2 MWe industrial plant. The industrial-scale configuration is based on the indirect CSP-CaL integration of a Brayton cycle, operating with supercritical CO2. The size of 2 MWe is referred to the net electrical output of the power block, approximately 10 MWth. Since the industrial scale flow diagram is rather complex, a simplified layout is taken into account for the modelling of the technology in the Umberto® software. Figure 6 shows the simplified layout20.
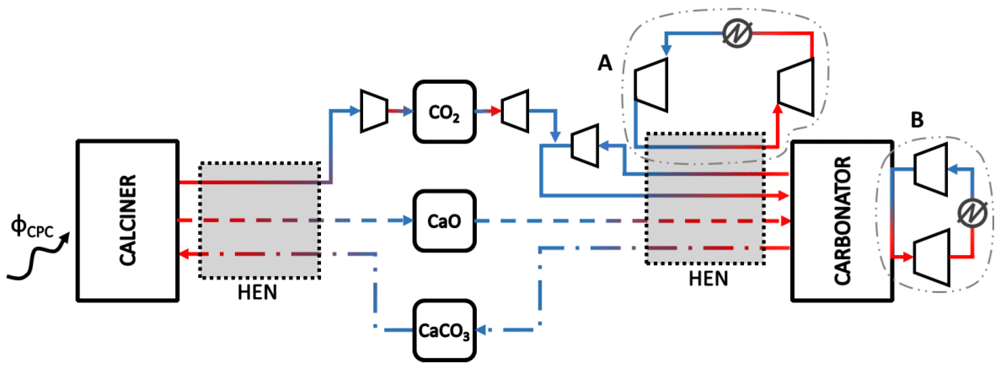
Figure 6. Simplified layout of the 2 MWe industrial plant3.
The data for the modelling of the industrial 2 MWe is taken from 21 (see Appendix).
100 MWth industrial plant. The data used for the input calculation of the 100 MWth industrial-scale plant is given in the Annex. The configuration is based on the direct CSP-CaL integration (as can be seen in Figure 5). The power of 100 MW is referred to as the net thermal flux absorbed in the solar calciner.
Comparable technologies
To get sufficient comparable data, literature research was carried out to establish an overview of the current state of LCA regarding CSP tower plants. Table 2 provides an overview of some key parameters from different studies. In Lorenz22, about 120 reports on environmental impact were assessed and compiled and values of greenhouse gas emissions between 22 and 23 gCO2 eq./kWhel were reported. This data is considered in the calculation for the comparative Umberto® modelling.
Table 2. Overview of LCA studies for CSP tower plants with key parameters.
| Reference | Telsing23 | Lorenz22 | Mazzaferro17 | Lorenz22 | Lechon24 | Weinrebe25 |
|---|
| Year | 2015 | 2013 | 2017 | 2013 | 2006 | 2000 |
| Location | South Africa | Spain | Spain | Israel | Spain | Mediterranean Sea |
| Power [MWel] | 20 | 20 | 100 | 130 | 17 | 30 |
| Heat transfer fluid | MS: NaNO3,
KNO3 | MS:
unspecified | MS: TES | MS: Ca(NO3)2,
KNO3 | MS: Ca(NO3)2,
NaNO3, KNO3 | Air |
| Storage [h] | - | 15 | 7.5 | 4 | 16 | - |
| Life-time [a] | 30 | 25 | 25 | 25 | 25 | 25 |
| Functional unit | 1 kWhel | 1 kWhel | 1 kWhel | 1 kWhel | 1 kWhel | 1 kWhel |
| GWP [gCO2-eq./kWh] | 19.3 | 14.2 | 22.7 | 48.03 | 202 | 18–26 |
Results of the LCA Modelling
Table 3 shows the list of environmental impact categories generated by Umberto® calculated with the methods ReCiPe 2008 Midpoint (H) w/o LT and IPCC 201318. The data is calculated for the pilot plant (10 kW) and the two industrial SOCRATCES plants (10 MW and 100 MW).
Table 3. List of environmental impact categories provided by UMBERTO LCA+, calculated with the methods ReCiPe 2008 Midpoint (H) w/o LT and IPCC 201326.
| Impact category | Impact | SOCRATCES
10 kW | SOCRATCES
10 MW | SOCRATCES
100 MW | Units |
|---|
Cumulative
energy demand | Energy consumption | 10 | 0 | 0 | kWh |
Depletion
potential | Fossil depletion | 0.04 | 0.00525 | 0.01 | kg-oil – eq. |
| Metal depletion | 0.08 | 0.01 | 0.03 | kg Fe – eq. |
| Water depletion | 0.000456 | 0.0000582 | 0.000116 | m3 |
| Emissions | Marine ecotoxicity | 0.000333 | 4.73E-05 | 9.46E-05 | kg 1,4 - DCB – eq. |
| Marine eutrophication | 0.0000228 | 1.02E-05 | 2.03E-05 | kg N – eq. |
Fresh water
ecotoxicity | 0.000119 | 1.85E-05 | 3.69E-05 | kg 1,4 - DCB – eq. |
Fresh water
eutrophication | 0.0000194 | 3.06E-06 | 6.11E-06 | kg P – eq. |
| Climate Change | 0.17 | 0.02 | 0.029 | kg CO2 eq. |
Global warming
potential | 0.17 | 0.02 | 0.003 | kg CO2 eq. |
Photochemical
oxidant formation | 0.00603 | 1.11E-04 | 2.02E-01 | kg NMVOC |
Ozone depletion
potential | 9.34E-09 | 1.48E-09 | 2.95E-09 | kg GFC |
Particulate matter
formation | 0.000505 | 9.30E-05 | 1.86E-04 | kg PM10 |
| Terrestrial acidification | 0.000901 | 2.18E-04 | 4.36E-04 | kg SO2 – eq. |
| Terrestrial ecotoxicity | 0.0000183 | 4.98E-06 | 9.96E-06 | kg 1,4 - DCB – eq. |
| Land Use | Agricultural land
occupation | 0.0000752 | 0.000912 | 0.00182 | m2a |
Natural land
transformation | 0.0000228 | 3.17E-06 | 6.33E-06 | m2 |
Urban land
occupation | 0.00424 | 6.10E-03 | 1.00E-02 | m2a |
Toxicity
potential | Human toxicity | 0.04 | 0.0055 | 0.01 | kg 1,4 - DCB – eq. |
| Ionising radiation | 0.00527 | 0.000559 | 0.00112 | kg U235 – eq. |
Table 4. Comparable results of the LCIA.
| Impact | SOCRATCES
10 kW | SOCRATCES
10 MW | SOCRATCES
100 MW |
|---|
Energy
consumption
[kWh] | 10 | 0 | 0 |
Fossil depletion
[kg oil-Eq.] | 0.04 | 0.00525 | 0.01 |
Human toxicity [kg
1.4 - DCB – eq.] | 0.0000752 | 0.000912 | 0.00182 |
Water depletion
[m3] | 0.000456 | 0.0000582 | 0.000116 |
Global warming
potential [kg CO2-
Eq.] | 0.17 | 0.02 | 0.029 |
The environmental impact differs for the three systems, but it is not wildly dissimilar. In terms of the global warming potential, the pilot plant has significantly higher values than the industrial-scale plants because it is reflecting the effects of irregularities such as an augmentative electrical heater which are not present at larger scale.
The LCIA results show that the high environmental impact of the pilot plant can be found in every impact category. Figure 7 compares the global warming potential and the fossil depletion. Table 4 gives the calculation for Figure 7. The impacts on human toxicity and water depletion are displayed in Figure 8. Both figures give an overview of relevant indicative metrics of the SOCRATCES technology with regards to the LCIA. The values of these metrics – fossil depletion, global warming potential, human toxicity and water depletion – indicated by the 10 kW pilot plant, should not be considered for comparison since the design and operation were not undertaken with a practical application in mind. The pilot plant design is oriented to generate knowledge about processes and components and not to produce power, and its operation is largely an experimental effort. As for the comparison between the 10 MW and the 100 MW plants, carried out using data largely acquired from literature. The metric approximately doubles for the design of 100 MW when compared to 10 MW. Thus, indicating a nonlinear relationship, best approximated by a power-relation of the y = axb form. This holds for all four of the metrics considered here.
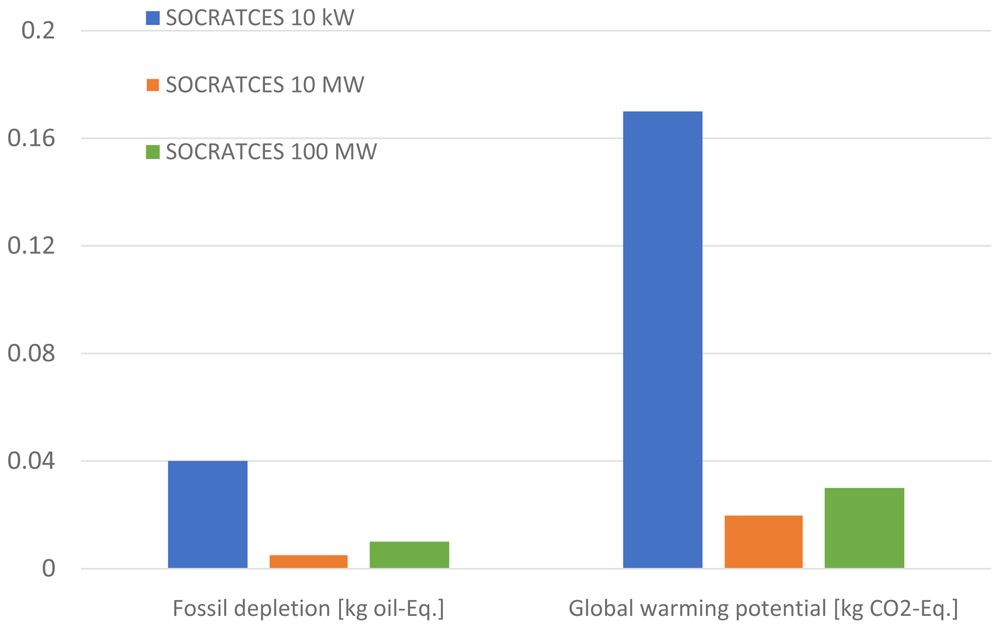
Figure 7. Comparable LCIA results for the three different SOCRATCES sizes for the impacts of global warming potential and fossil depletion.
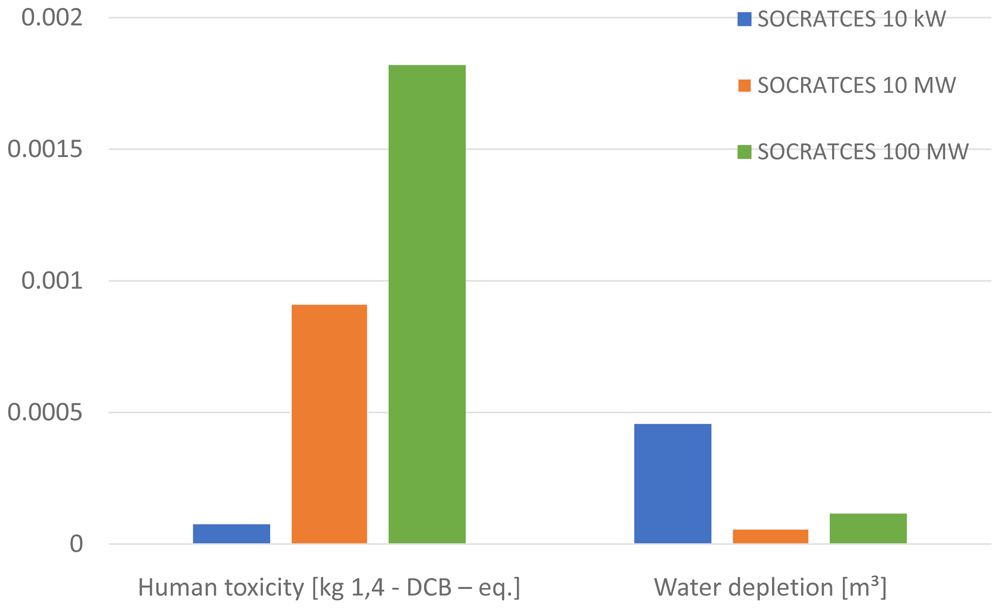
Figure 8. Comparable LCIA results for the three different SOCRATCES sizes for the impacts of human toxicity and water depletion.
Table 5 shows the global warming impact for the different life cycle phases.
Figure 9 shows that for the industrial scale, the main impact of global warming comes from the construction of the plant. The pilot plant has an almost equal GHG impact in the construction and operation phases, mainly from the additional heating installed and its experimental nature.
Table 5. Global warming potential impact for the different phases.
Impact global warming
potential [kg CO2-Eq.] | SOCRATCES
10 kW | SOCRATCES
10 MW | SOCRATCES
100 MW |
|---|
| Construction | 44% | 87% | 92% |
| Use Phase | 54% | 9% | 5% |
| Recycling | 2% | 5% | 3% |
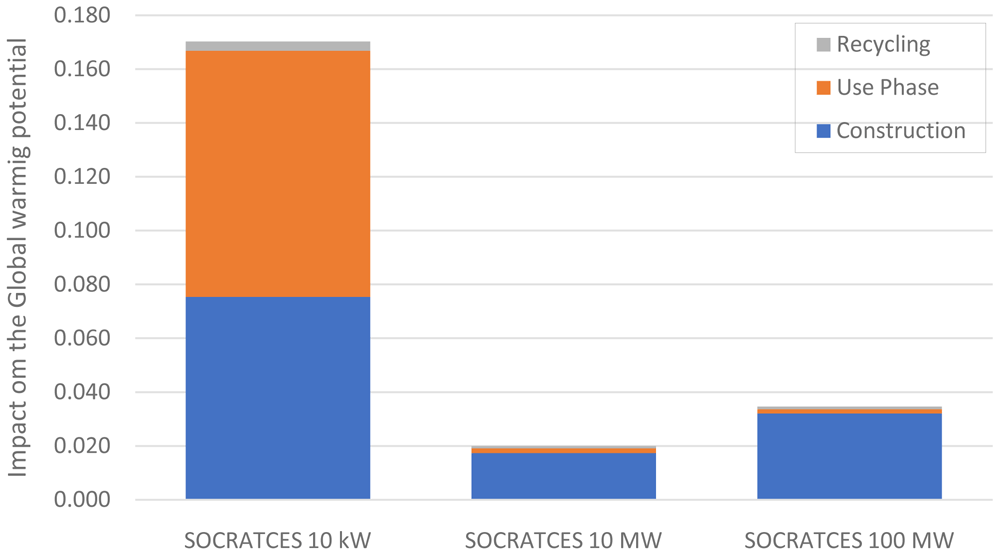
Figure 9. Comparable global warming potential for the different life cycle phases.
To enhance the comprehension of the generated results in terms of comparison, the following approaches are often adopted:
1. Normalization: where the magnitude of category indicator results, are calculated in relation to the reference information;
2. Grouping: sorting and possibly ranking of the impact categories;
3. Weighting: converting and possibly aggregating indicator results across impact categories using numerical factors based on value-choices.
In this study, LCIA data was normalized to a reference. This helps understand the relative magnitude of each indicator of the system under study. The least favorable impact is assigned the value of 1, and the other figures are scaled with reference to it. The risk potential was assumed to be equal for all systems. As the least favorable impacts were generated by the pilot plant, it was assigned the value 1, and the two industrial systems were calculated with respect to this reference, as shown in Table 6.
Table 6. Normalization of the LCIA data, referring to the pilot plant awarded with the value 1.
| SOCRATCES
10 kW | SOCRATCES
10 MW | SOCRATCES
100 MW |
|---|
| Energy consumption | 1.00 | 0.00 | 0.00 |
| Depletion potential | 1.00 | 0.13 | 0.33 |
| Emission | 1.00 | 0.12 | 0.84 |
| Land Use | 0.21 | 1.00 | 1.00 |
| Toxicity Potential | 1.00 | 0.13 | 0.25 |
| Risk potential | 1.00 | 1.00 | 1.00 |
Weighting is the process of converting indicator results of different impact categories by using numerical factors based on chosen values. It may include aggregation of the weighted indicator results. In this work, the weighting factors were assumed to have an equal share and importance.
Following the normalization, the summarized values of the environmental categories were plotted in a spider diagram, shown in Figure 10. This spider diagram illustrates a graphical depiction of the ecological pros and cons of the SOCRATCES plant at different industrial sizes.
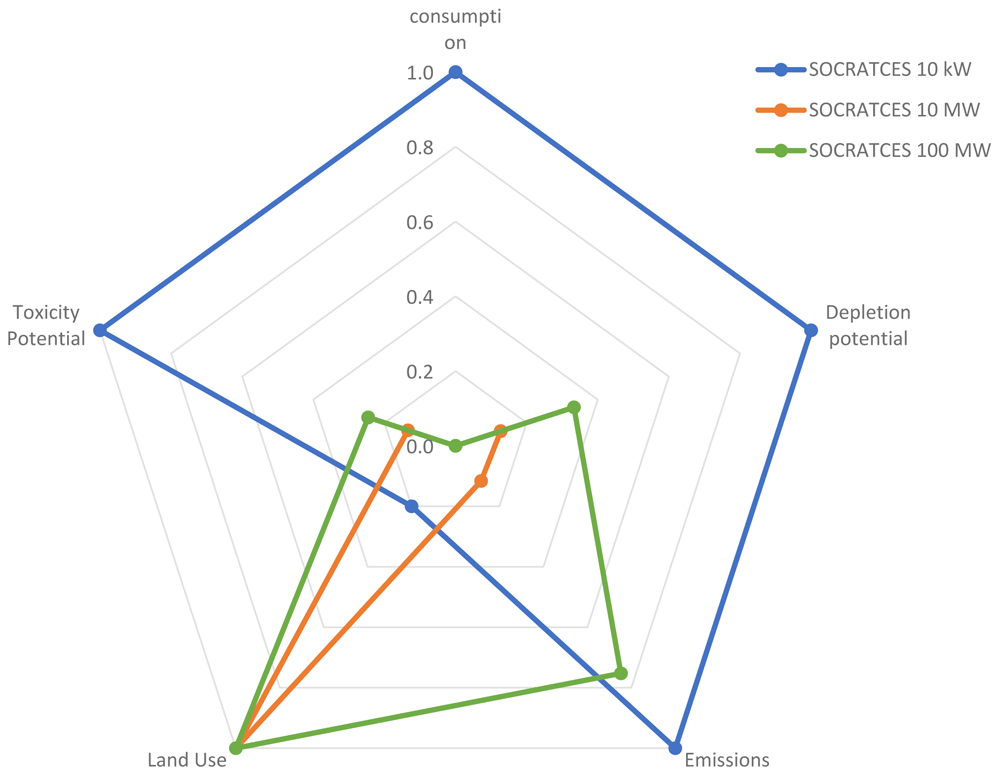
Figure 10. Spider diagram of the environmental categories comparing different sizes of the SOCRATCES technology.
It is possible to identify the location in terms of the environmental impact categories. The blue line describes the pilot plant system with 10 kW. It was used as the reference since the values of the Umberto® calculation were the highest. The diagram clearly demonstrates that the industrial scale of the SOCRATCES technology has better values than the pilot plant. In the spider diagram, the land use for the industrial scale is normalized to 1 since, for the pilot plant, the size of the solar side components was simulated on a very small scale. Nevertheless, it needs to be stated that both industrial scales are in normalization to the pilot plant and not to each other. The values for the 100 MW industrial scale are overall slightly higher than those of the 10 MW plant. When comparing the industrial scale to comparable technologies stated in literature (see Table 2), the SOCRATCES technology is clearly competitive. Figure 11 shows the comparison with some data from literature.
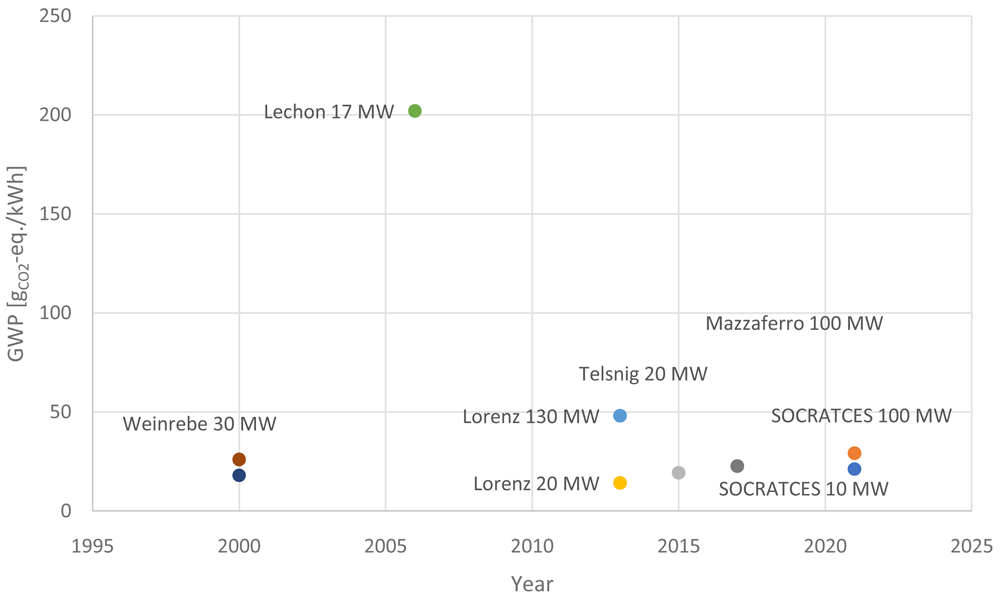
Figure 11. Comparable data for Global Warming Potential.
Figure 11 shows the comparison of the industrial SOCRATCES technology in the size of 10 MW and 100 MW to data that was extracted from literature. Especially when comparing the 100 MW SOCRATCES scale with the plants referred to in Mazzaferro with 100 MW and 7.5 h storage time and in Lorenz with a size of 130 MW and four hours of storage time, the technology of SOCRATCES seems beneficial. SOCRATCES technology can compete with most comparable systems regarding the Life-Cycle-Assessment within the system boundaries. It is very important to always refer to the boundaries of the system and note that the generated results are not absolute but comparative.
Eco-efficiency approach
The purpose of an eco-efficiency analysis is to harmonize economy and ecology. This involves carrying out an overall study of an alternative solution to include a total cost determination and the calculation of ecological impact over the entire life cycle. The eco- and cost-analyses results show the comparison of the overall ecological footprint with the total costs of different processes. The overall ecological footprint can be calculated by the LCIA results. All impacts together were used in the eco-efficiency analysis.
Figure 12 is used as an example. System 2 shows a certain low ecological impact and low specific costs compared to all other systems. It would be an ideal situation to show the efficiency of the system compared to other processes. Thus, visualizing the most eco-/cost-efficient process for the targeted application directly. The calculation of total costs and the estimation of environmental footprint are independent calculations of the economic and ecological aspects of a system. The assumption is that ecology and economics have the same importance in a sustainability assessment. A technology less economical can compensate for this disadvantage with a better ecological assessment and vice versa. With the eco-efficiency approach, different alternative processes or technologies are comparable. Costs were calculated against environmental categories and plotted together in a diagram.
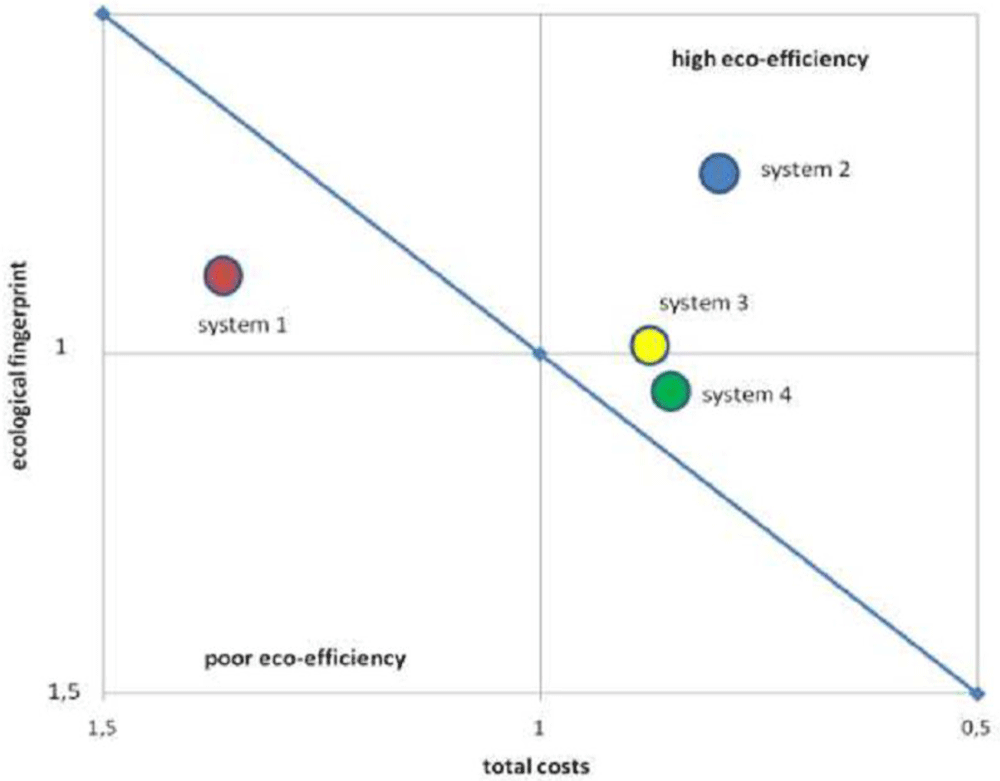
Figure 12. Visualization of the Eco- and Cost-Efficiency [BASF-Method].
The calculation of total costs and the calculation of the environmental footprint are independent calculations of the economic and ecological aspects of the SOCRATCES technology. The weighing factors were set equal on the assumption that ecology and economics have the same importance in a sustainability assessment. In all calculations, no absolute values are considered, only comparative values are. Costs are calculated and compared to environmental positions and plotted together in a diagram. For the LCA data in the literature, the costing was assessed with the IRENA renewable cost databank27. In order to illustrate the concept of eco-efficiency, the eco-efficiency portfolio was applied.
The costs are shown on the horizontal axis, and the environmental impacts are shown on the vertical axis. The graph reveals the eco-efficiency of the SOCRATCES technology 100 MW scale with various systems from literature. Such results allow a look into the future since Eco-efficiency analysis is utilized in making strategic decisions, and it helps to detect and exploit potential ecological and economic improvements. This approach demonstrates that the most favorable technology is located bottom left and the least favorable one on the top right. The distance of the individual processes to the portfolio diagonal is a measure of the respective eco-efficiency. Figure 13 shows that the SOCRATCES technology in the industrial scale of 100 MW and storage duration of 8+ hours is the most favorable one when compared to the other two systems. The Lorenz 130 MW plant has a storage capacity of 4 hours, which increases the costs per kWh drastically. The same applies to the plant referred to in Mazzaferro with 100 MW and a storage capacity of 7.5 hours. Even though the ecological impact is stated insignificantly lower than the SOCRATCES technology, it is important to mention that the system boundaries could vary significantly and are not known in detail for the reference system.
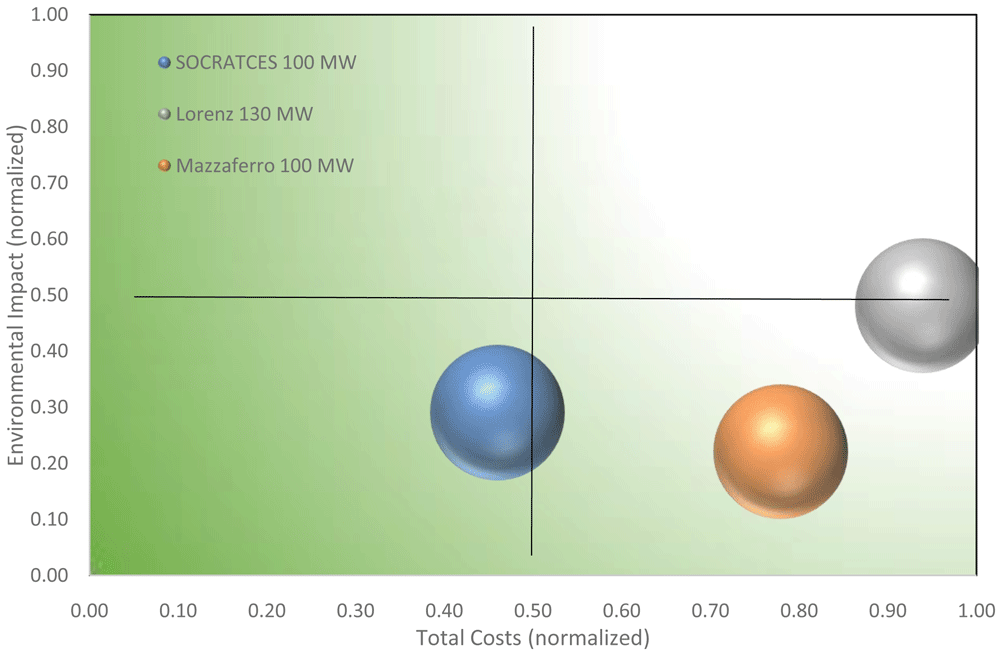
Figure 13. Eco-efficiency portfolio of the SOCRATCES technology in comparison with literature data.
Discussion and conclusion
The environmental performance of the SOCRATCES technology was evaluated using a state-of-the-art life cycle approach. The principal goal was to evaluate the potential impacts of the SOCRATCES technology on an industrial scale and interpret the results to establish this innovative technology. It was performed based on the data gathered from the project consortium, database and literature. The process map was built in the Umberto LCA+® software, and the impact categories were calculated. Compressed LCIA data were graphically demonstrated on a spider diagram for five environmental impact categories: the consumption of energy, depletion potential, consumption of raw materials, resulting emissions, and the toxicity potential along with the risk potential.
The SOCRATCES technology proposes a novel and entirely green energy storage technique. It captures solar energy using a conventional array of heliostats. Solar energy is used in real-time to perform an endothermic reaction in a novel reactor with no fuel or external electric consumption. The products of this reaction are stored so that they can be brought together in a vigorously exothermic reaction to power an electricity generation cycle whenever required. The nature of the system that is non-dependent on fossil fuels makes the technology profoundly green. Its environmental compatibility is conspicuously reflected in the results of LCA presented in this report. With this technology, the system of thermo-chemical energy storage has the potential to contribute to climate protection and reduce the GHG-emission.
In comparison with molten salts storage systems, the SOCRATCES system has a significantly superior eco-efficiency. For example, the global warming potential for the industrial scale of 100 MWth has a value of 39 gCO2-Eq per kWh produced electricity for the SOCRATCES technology, whereas the state-of-the-art molten salts storage system contributes with values between 20–200 gCO2-Eq /kWh. The calculation clearly demonstrates that the technology developed in the project can compete with alternative methods in terms of ecological aspects, especially in terms of toxicity. When compared to the CSP 100 MW plant in Mazzaferno7, all values for freshwater aquatic ecotoxicity, human toxicity, marine aquatic ecotoxicity, and terrestrial ecotoxicity are significantly higher than the impact values for the SOCRATCES technology. The comparison of the SOCRATCES technology on an industrial scale and the pilot plant are not fully comparable since a pilot plant is an experimental facility non oriented for economic exploitation and optimized ecological impact. Additionally, the external heating installed in the pilot plant affects the result. Nevertheless, the results for the pilot plant are shown as well.
The values used for the analysis of the individual processes and the derived results are not absolute, but only comparative. By adjusting parameters, the overall calculation can give a different result. The LCIA methods used in the software Umberto LCA+ namely: ReCiPe 2008 Midpoint (H) w/o LT and IPCC 2013; could be changed, and a different set of results would be generated, but the general trends would remain the same. According to the goal and scope of this study, the chosen methods collects the critical environmental impacts adequately.
For a better understanding, different approaches for interpretation of the results were applied. The normalization of the indicator results can be a factor for interpretation. It may be desirable to use several reference systems to show the consequence on the outcome of mandatory elements in the LCIA phase. For the interpretation of LCA results, it is always important to know the meaning of the applied approaches. Ranking and weighing is usually based on value-choices, but is left out in this comparison. This is because the goal was identified and compared to the environmental impact of the SOCRATCES technology. Different individuals, organizations and societies may have different preferences; therefore, it is possible that other parties will reach different ranking results based on the same indicator or normalized indicator results. Still, an average CO2 equivalent can be given. The process map with all its inputs and outputs were calculated by Umberto LCA+. The databanks ecoinvent v2.2 and v3 were used. The results show that the SOCRATCES technology has a positive environmental impact. Thus, there is the interest for further advances in the development of this technology.
Data availability
Underlying data
All data underlying the results are available as part of the article and no additional source data are required.
Annex
Table 7. Data assumptions for the LCA calculations of the 2MWe industrial scale.
| Parameter | Component/stream | Value |
|---|
| Operating temperature | Calciner | 950 °C |
| Cut-in power | Calciner | 20% of calciner
design power |
| Operation time | Carbonator side | 24 h |
| CaO conversion | CaO | 0.5 |
| Thermal losses | Carbonator | 1% of reaction
heat |
| Isentropic efficiency | Storage turbine | 0.8 |
| Blower/Compressors | 0.8 |
| Electrical efficiency | Electric generator/motor | 0.98 |
| Storage temperature | Storage vessels | 20 °C |
| CO2 storage pressure | CO2 vessel | 75 bar |
Solid conveying
electrical consumption | CaO, CaCO3 | 10 kJ/(kg-100m) |
| Minimum ∆T | Gas-gas HEXs | 15 °C |
| Gas-solid HEXs |
| HTF-solid HEXs |
| Isentropic efficiency | Turbine CO2 Cycle | 0.92 |
| Compressor CO2 Cycle | 0.88 |
| Electrical efficiency | Electric generator CO2 Cycle | 0.98 |
| Ambient temperature | Air CO2 Cycle | 20 °C |
| Minimum ∆T | Heater CO2 Cycle | 20 °C |
| Cooler CO2 Cycle | 15 °C |
| Compressor inlet pressure | Compressor Power Block | 75 – 95 bar |
| Turbine inlet pressure | Turbine Power Block | 180–250 bar |
| Turbine inlet temperature | Turbine Power Block | 500 – 700°C |
Outlet Temperature (cold
side) | Turbine Power Block | 100 – 450 °C |
Table 8. Data assumptions for the LCA calculations of the 100 MWth industrial scale.
| Parameter | Component/stream | Value |
|---|
| Operating temperature | Calciner | 900°C |
| Operating pressure | Calciner | 1 bar |
| Operation time | Calciner side | 8 h |
| Operation time | Carbonator side | 24 h |
| CaO conversion | CaO | 0.5 |
| Thermal losses | Carbonator | 10% of reaction heat |
| Operating temperature | Carbonator | 920°C |
| Operating pressure | Carbonator | 9 bars |
| Outlet pressure | Power cycle turbine | 1 bar |
| Isentropic efficiency | Turbines and compressors | 0.89 |
| Electrical efficiency | Electric generator/motor | 0.98 |
| Storage temperature | Storage vessels | 20°C |
| CO2 storage pressure | CO2 vessel | 75 bar |
| Solid conveying electrical consumption | CaO, CaCO3 | 10 kJ/(kg-100m) |
| Minimum ∆T | Air cooler | 15°C |
| Gas-solid HEXs |
| Solid-solid HEXs | 20°C |
Table 9. Scaling parameters for the calculation in Umberto® for the industrial scale of 100 MW.
| Equipment | Scaling parameter |
|---|
| Solar tower | 100 MW |
| Heliostat field | 350 877 m 2 |
| Solar Receiver | 200 MW |
| Calciner | 54 m3/s (entrained flow) |
| Carbonator | 116,5 m3/s |
| CO2 vessel | 571,2 m3 |
| CaO storage tank | 3350 m 3 |
| HXA,B,E,F,I | Solid-Fluid (48 MWth, 23 MWth,
15 MWth, 2x10 MWth) |
| HXG | Fluid-Fluid (30 MWth) |
| Cooler | 3 MWth |
Faculty Opinions recommendedReferences
- 1.
SOCRATCES. 2021; [Zugriff am 12 12 2021]. Reference Source
- 2.
Dieter H, Bidwe AR, Scheffknecht G:
9 - Pilot plant experience with calcium looping.
Calcium and Chemical Looping Technology for Power Generation and Carbon Dioxide (CO2) Capture.
2015; 171–194. Publisher Full Text
- 3.
Zakuciová K, Kočí V, Ciahotný K, et al.:
Life Cycle Assessment of calcium carbonate loop CO2 capture technology for brown coal power plant unit of the Czech Republic.
Computer Aided Chemical Engineering.
Bd. 2018; 43: 253–258. Publisher Full Text
- 4.
Schneider A, Grippa M:
LCA, LCC Scope and system boundaries. 2018. Reference Source
- 5.
Brusseau ML:
Chapter 32 - Sustainable Development and Other Solutions to Pollution and Global Change. In.
Environmental and Pollution Science (Third Edition).
2019; 585–603. Publisher Full Text
- 6.
Copola A, Scala F:
A Preliminary Techno-Economic Analysis on the Calcium Looping Process with Simultaneous Capture of CO2 and SO2 from a Coal-Based Combustion Power Plant.
Energies.
2020; 13(9): 2176. Publisher Full Text
- 7.
E. European Comission: ILCD Handbook, General Guide for Life Cycle Assessment. 2010. Reference Source
- 8.
Baumann H, Tillman AM:
The Hitch-Hiker's Guide to LCA. Lund: Studentlitteratur, 2004. Reference Source
- 9.
Ecoinvent: Database Ecoinvent v2.2, v3. 2021.
- 10.
DIN ISO 14044:2006: Umweltmanagement Ökobilanz. Beuth Verlag, Berlin, 2006.
- 11.
DIN ISO 14040:2006: Environmental management. Beuth Verlag, Berlin, 2006. Reference Source
- 12.
Huijbregts MAJ, Steinmann ZJN, Elshout PMF, et al.:
ReCiPe2016: a harmonised life cycle impact assessment method at midpoint and endpoint level.
Int J Life Cycle Assess.
2017; 22: 138–147. Publisher Full Text
- 13.
European Commission: LCIA Handbook - Frameworks and requirements for LCA models and indicators.
Luxembourg.
2010. Reference Source
- 14.
Guelpa E, Tesio U, Verda V:
Power cycles: schemes, models, analysis. 2019.
- 15.
Whitaker MB, Heath GA, Burkhardt JJ, et al.:
Life cycle assessment of a power Tower concentrating solar plant and the impacts of key design alternatives.
Environ Sci Technol.
2013; 47(11): 5896–903. PubMed Abstract
| Publisher Full Text
- 16.
Heath G, Burkhardt J, Turchi C:
Life Cycle Environmental resulting from the manufacture of the heliostat field for a reference power tower designed in the united states. 2012. Reference Source
- 17.
Mazzaferro CA:
Life Cycle Assessment of Electricity Production from Concentration Solar Tower Power Plants. 2016.
- 18.
Fernández-García A, Álvarez-Rodrigo L, Martínez-Arcos L, et al.:
Study of Different Cleaning Methods for Solar Reflectors Used in CSP Plan.
Energy Procedia.
2012; 49.
- 19.
GA Part B. 2017.
- 20.
Tesio U, Guelpa E, Ortiz C, et al.:
Optimized synthesis/design of the carbonator side for direct integration of thermochemical energy storage in small size Concentrated Solar Power.
Energy Convers Manag: X.
2019; 4: 100025. Publisher Full Text
- 21.
Tesio U, Guelpa E, Verda V:
Integration of ThermoChemical Energy Storage in Concentrated Solar Power.
Energy Convers Manag: X.
2019.
- 22.
Lorenz M, Ko N, Knüpffer E, et al.:
Life cycle assessment of solar thermal power plants. 2017. Publisher Full Text
- 23.
Telsnig T:
Standortabhängige Analys und Bewertung solarthermischer Kraftwerke am Beispiel Südafrikas. Stuttgart. 2015. Reference Source
- 24.
Lechon Y, De la Rúa C, Sáez R:
Life Cycle Environmental Impacts of Electricity Production by Solarthermal Power Plants in Spain.
Journal of Solar Energy Engineering.
2008; 130(2). Publisher Full Text
- 25.
Weinrebe G:
Technische, ökologische und ökonomische Analyse von solarthermischen Turmkraftwerken. Stuttgart. 2000. Reference Source
- 26.
ifu Hamburg: Umberto LCA+. Hamburg. 2019.
- 27.
IRENA: Renewable Power Generation Costs in 2019. 2020. Reference Source