Plain language summary
Amyotrophic lateral sclerosis (ALS) is a rare neurological disease that affects nerve cells extending from the brain to the spinal cord, and leads to the loss of muscle movement. While some ALS patients live 10 or more years after disease onset, most patients die due to respiratory failure in three to five years. Patients may have a genetic background, but the vast majority of cases are sporadic, meaning that people without familial history or genetic risk factors can also develop ALS. The exact cause of the disease is not known, and currently there is no treatment. Immunoglobulins (Igs), proteins produced by a type of white blood cells, were suggested to be involved in ALS, but their mechanism of action is not entirely understood. Purifying Igs, especially their most abundant subset in serum, IgG, from ALS patients, holds a great importance for studies focusing on their role in ALS. However, currently there is no defined protocol for IgG isolation with protein chromatography. For this purpose, we developed and validated a fast protein liquid chromatography method (FPLC) for IgG purification from human serum and evaluated the protocol performance. Our results revealed that FPLC is a suitable approach for IgG isolation if pure IgGs without other serum proteins are required. However, the success of the implementation of this protocol should be further evaluated with a greater number of healthy people and ALS patients. Moreover, the results should be verified by other laboratories around the world using the same instrument.
Introduction
Amyotrophic lateral sclerosis (ALS), a disease characterized by the degeneration in upper and lower motor neurons1, is widely recognized as a heterogenous neurodegenerative disease in terms of its genetic, neuropathologic and clinical aspects2. Presenting with excess weakness and muscle atrophy, ALS generally occurs in late middle life; however, the age and site of onset and disease progression rate vary highly among patients. Death occurs within two to four years after disease onset1. ALS is the most common motor neuron disease (MND) in adults with an incidence of two per 100,000 and prevalence of 5.4 per 100,000 individuals3. Patients who have at least one relative diagnosed with the disease are defined as having familial ALS (fALS), accounting for 10% of total cases4. Disease is autosomal dominantly inherited in nearly all cases. Advances in sequencing technologies have revealed that approximately 40 to 55% of fALS patients carry gene variants linked with the disease progression5. Currently, more than 50 potential genes linked with ALS have been identified; SOD1 (superoxide dismutase 1), C9ORF72 (chromosome 9 open reading frame 72), FUS (RNA-binding protein FUS/TLS), and TARDBP (TAR DNA binding protein) genes are among the most commonly observed while others are relatively rare6. A majority (90–95%) of ALS patients do not have family history, and are thus identified as sporadic ALS (sALS)7. Genetic factors contributing to sALS remain largely elusive.
Many studies including in vivo and in vitro models, as well as ex vivo studies have confirmed the role of the immune system in ALS: some of the findings implicating autoimmune responses include circulating immune complexes, increased frequency of certain MHC molecules, and association with other autoimmune diseases8. Sheean et al.,9 (2018) revealed an inverse correlation between the ALS progression rate and the number of T-regulatory cells (T-regs), and reported that an increase in T-regs alleviates the disease symptoms and prolongs survival. Since IgA levels are known to be regulated by T-regs, various studies have aimed to reveal a link between the serum IgA levels and the disease progression; however, no significant correlation was observed10,11. Recently, the contribution of IgGs to ALS onset and progression has been shown by many in vitro and in vivo studies12. Accounting for 20% of all plasma proteins, IgG is one of the most common serum proteins, and it is divided into four subclasses; IgG1, IgG2, IgG3, and IgG413. IgG subclasses share more than 90% similarity; however, each has different properties as well as reactions against different types of antigens. Both in vivo and in vitro studies evaluating the effects of ALS IgGs would require isolation of patient antibodies; however, up to now, there has been no validated fast protein liquid chromatography (FPLC) protocols for the isolation of human derived IgGs.
Chromatographic methods have been reported to yield products with high purity in antibody isolation process14. Relying on the reversible interaction between a protein and a ligand-immobilized matrix, affinity chromatography is a common method in Ig isolation. Coupled with a matrix, the ligand protein G binds to the Fc region of the IgG, and is routinely used for the isolation of monoclonal IgGs, as well as immune complexes involving IgG14. FPLC, a form of high-performance liquid chromatography (HPLC), is a research-scale protein purification system with various advantages over HPLC, such as reduced costs and compatibility with a wide range of aqueous buffers, while covering all modes of HPLC including affinity chromatography15. In this study, we aimed to establish and validate a protocol for IgG isolation from human sera samples, with a focus on ALS patients.
Results
The study was conducted according to the guidelines published by the International Conference on Harmonization of Technical Requirements for Registration of Pharmaceuticals for Human Use (ICH)16, which has also been adopted by the European Medicines Agency (EMA) and The U.S. Food and Drug Administration (FDA)17. Parameters for specificity, accuracy and precision were evaluated, and limit of detection (LOD), limit of quantification (LOQ) and correlation coefficient were calculated from the calibration curves.
Specificity
Due to the high specificity of the ligand (protein G) of this chromatography column to total IgG18, a single peak on the chromatogram during elution was expected as shown in Figure 1. Both serum (blue) and spiked (pink) samples overlapped when the chromatograms were overlaid, and a single peak on the elution step was observed, indicating the absence of non-specific elution products. Retention times are shown in Table 2. Increased retention times observed in spiked samples are related to the effect of NaCl solution in which IgG was reconstituted. Yet, unpaired t-test revealed no significant difference between the serum samples and the spiked samples in terms of their retention times (p=0.589). Thus, specificity was 100% since no difference was observed between the spiked and serum samples, in addition to the absence of additional peaks through the elution phase except for IgG (Figure 1)19.
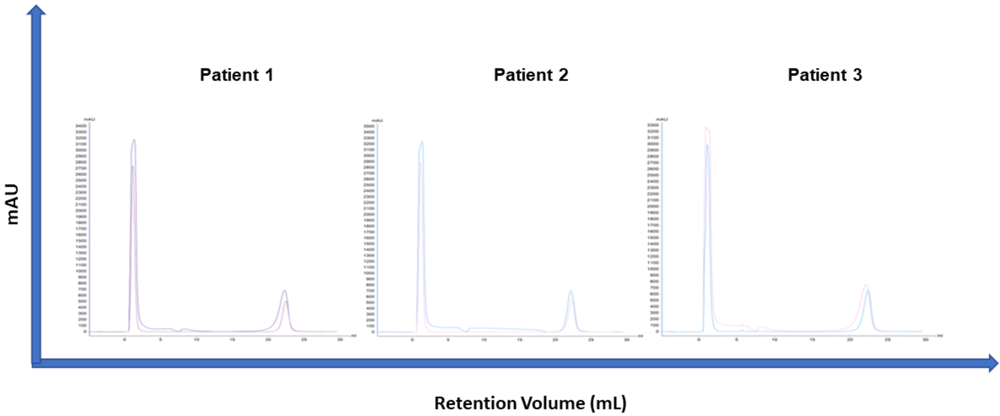
Figure 1. Overlaid chromatograms of healthy individuals’ sera and spiked samples.
For spiking, 0.4 mg IgG reconstituted in 150 mM NaCl solution was added to 300 µL serum sample. A single peak was observed on every chromatogram and merging spiked with serum chromatograms indicate the peaks are specific to IgG. Numeric data regarding spiked and serum samples are presented in Table 2.
Accuracy
To determine accuracy, we measured the IgG protein amount in standard samples with spectrophotometry, and then measured the IgG protein amount in standards eluted with our chromatography protocol (BioTek Epoch, USA), and the accuracy and percentage relative standard deviation (%RSD) were calculated20. Results are presented in Table 3. The accuracy of the chromatography method for the IgG concentrations of 0.2, 0.5, 0.75 and 1 mg were 115.30%, 115.65%, 97.56% and 100.86%, respectively. On the other hand, %RSD values were 11.26%, 1.06%, 6.20% and 1.21% for 0.2, 0.5, 0.75 and 1 mg IgG, respectively.
Precision
Precision was defined as the agreement between the test results when the same sample was evaluated with the same analytical method multiple times at two levels: repeatability and intermediate precision.
Repeatability. Repeatability was assessed by serially diluting the highest IgG sample (1 mg/mL) with the equilibration buffer at 0.75, 0.5 and 0.20 mg, and running each sample two times. Overlaid chromatograms are presented in Figure 2.a. Absorbance values are presented in Table 4. We evaluated linearity according to the repeatability evaluations, which indicates the correlation between the measured value and the actual concentration of the analyte in quantitative analytical methods21. Repeatability of the protocol was assessed with regression analysis where the equation was calculated as y = 189.7*x + 1.305, and the r2 value was 0.9992 (Figure 2.b). Performance data are presented in Table 6.
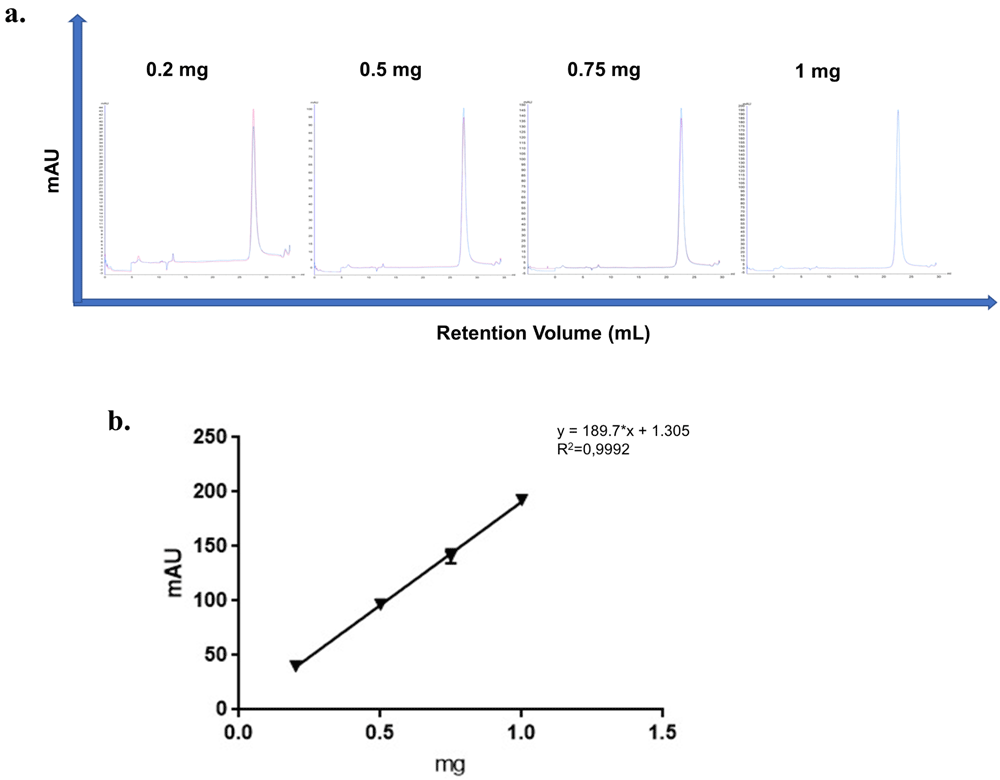
Figure 2.
a) Overlaid chromatograms of standards’ each measurement. b) Straight-line regression model graphic. The coefficient of determination (r2) was 0.9992.
Intermediate precision. Intermediate precision was evaluated using unpaired two-tailed T test, and chromatograms are presented in Figure 3. No significant difference was observed among mAU values between time points (p=0.460). In addition, retention times were similar (p=0.213) (Table 5) .
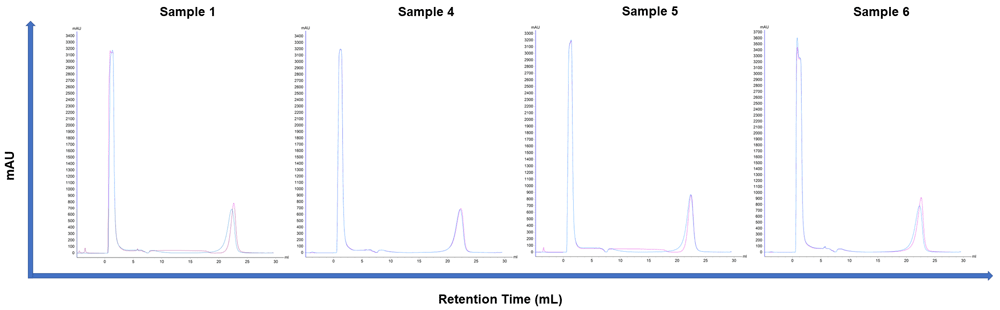
Figure 3. Overlaid chromatogram of four patients’ each measurement evaluated for intermediate precision.
Limit of detection (LOD)
LOD indicates the lowest amount of analyte in a sample which can be detected but not necessarily quantitated as an exact value. LOD is calculated according to the formula LOD=(3,3×σ)/S where σ denotes standard deviation of y-intercepts and S denotes the slope of the analyte curve. In our study, LOD was 0.045 mg.
Limit of quantification (LOQ)
LOQ defines the lowest amount of analyte in a sample which can be quantitatively determined with suitable precision and accuracy. The quantitation limit is especially used for determining degradation products and impurities. LOQ is calculated according to the formula LOQ=(10×σ)/S, where σ denotes standard deviation of y-intercepts and S denotes the slope of the analyte curve. In our study, LOQ was calculated to be 0.13 mg.
Evaluation of the presence of autoantibodies in patient sera
Samples were evaluated using the “Neurology Mosaic – 1” kit (EuroImmun, Germany), which is recommended for diagnosing paraneoplastic neurological syndromes (PNS), and diseases of the central and peripheral nervous system that occur in response to tumor development. This kit visualizes autoantibodies (IgG, IgA and IgM) present in the serum against Yo, Hu, Ri, CV2, Ma and amphiphysin proteins on medullated and non-medullated nerves. ALS and MNDs are not entirely considered as established paraneoplastic syndromes, but paraneoplastic syndrome is one of the possible conditions that may lead to motor neuron degeneration22.
All patients were positive for anti-neuronal nuclear antibody (Hu) and anti-MAG as determined by the nuclear staining of the nerve tissue and anti-glutamic acid decarboxylase (GAD) according to the staining pattern observed in cerebellum tissues (Figure 4). This was subject to confirmation with other methods such as line blot or immunoassays with transfected cells. No staining of the cerebellum tissue was observed in two ALS patients at 1:100 dilutions, whereas the fluorescent signal was weaker compared to the 1:10 dilution in the third patient. Similarly, staining of the nerve tissue was quite prominent in the second and third patients at 1:10 dilution, but was lower in the first patient. A comparison with positive controls underlined the absence of anti-Yo antigens in all patients (which was observed as the staining of Purkinje fibers found in cerebellar tissue slices).
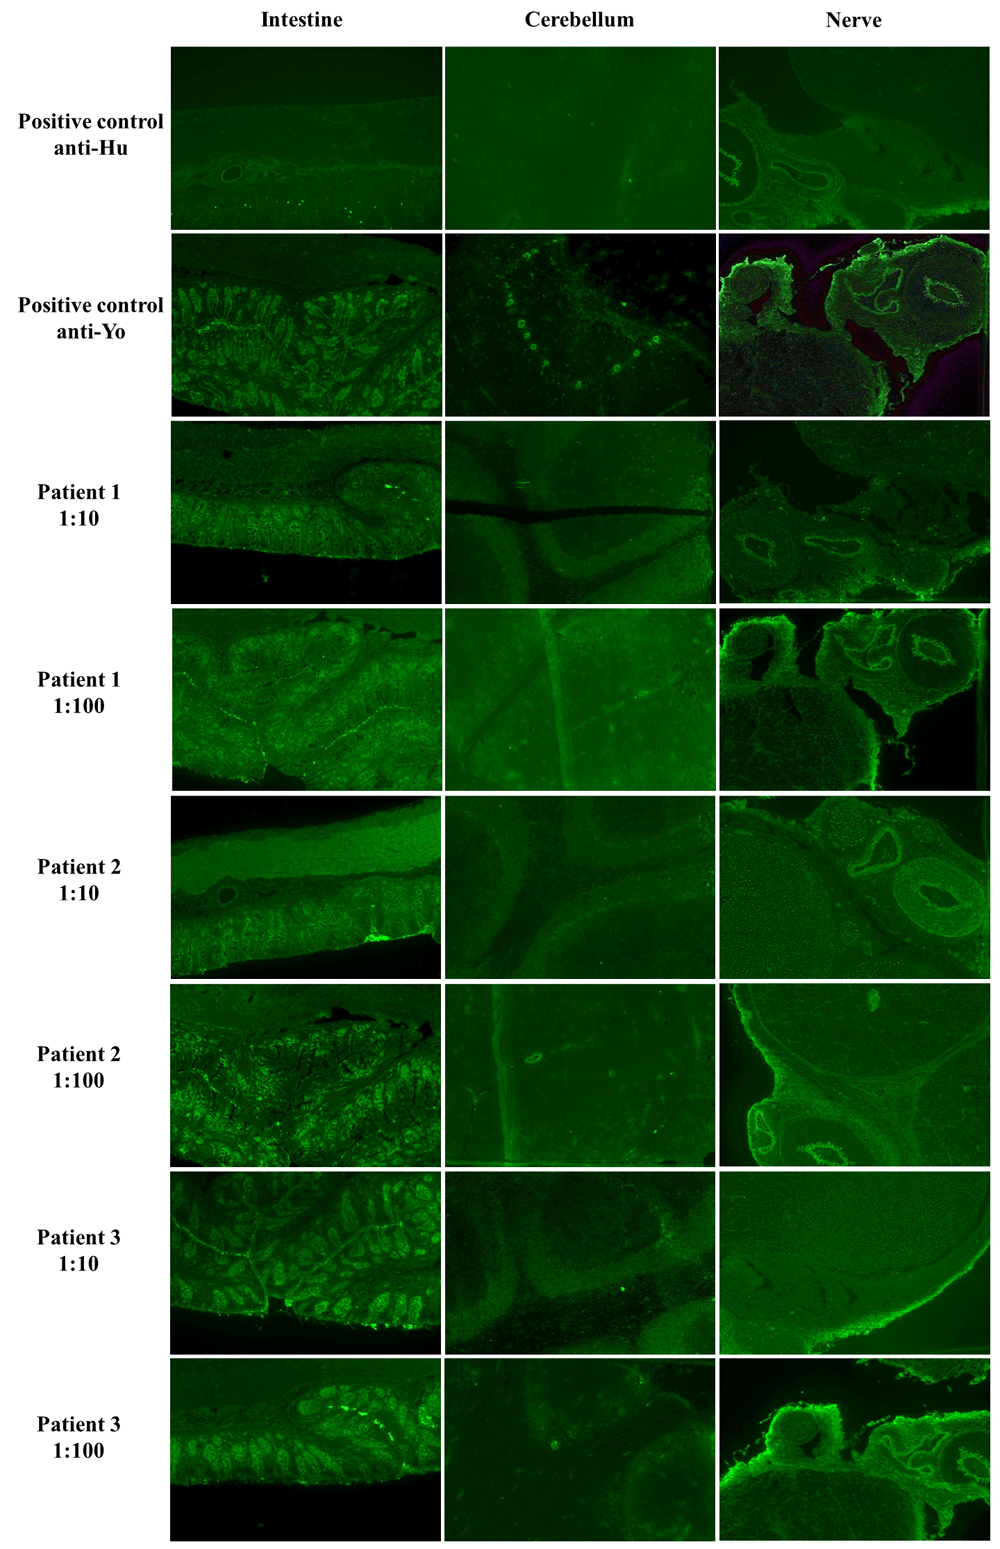
Figure 4. IIFT results of three ALS patients’ sera samples.
All samples were analyzed in two dilutions, 1:10 and 1:100 with the EuroImmun Neurology Mosaic I Kit.
Discussion
Affecting 5% of the population of Western countries, autoimmune diseases consist of more than 70 different disorders and show a wide variety in terms of their target tissues, age of onset and response to treatments23. Both humoral and cellular immunity play a role in the autoimmunity mediated tissue damage, and autoimmune diseases are believed to be a result of the interaction between environmental and genetic factors23. Autoantibodies against various cellular compartments including nucleic acids, receptor or other functional cellular components are detected in serum samples of patients, and provide important data regarding the diagnosis and disease classification. In addition, patients may have autoantibodies before the manifestation of disease-related symptoms, and thus autoantibody screening may have apredictive value prior to diagnosis23. High levels of IgM and IgG autoantibodies are known to be associated with many autoimmune diseases24; well-known examples of this phenomenon are rheumatoid factors: serum IgM and IgG have been observed in more than 70% patients with rheumatoid arthritis25, and autoantibodies are known to target chromatin structure in systemic lupus erythematosus26. Previously, ALS patient-derived IgGs were shown to induce stress in microglial cells27, promote glutamate release at neurons28 and alter calcium homeostasis in astrocytes29 in vitro.
Anti-neuronal antibodies are conventionally identified by indirect immunofluorescence (IIF) screening followed by line blots and cell-based assays, and are classified into two groups: group I defines intracellular targets, whereas group II identifies the proteins present on the cell membrane30. Autoantibodies against intracellular proteins such as Yo, Hu, GAD and amphiphysin are regarded as the result of T cell activation against tumors expressing neuronal antigens. However, due to the intracellular localization of their target proteins, they are likely to exert no pathogenic activity in vivo, except anti-Hu that have been shown to activate neurons31. Cell surface antigens, which are generally non-paraneoplastic, include aquaporin-4, N-methyl-D-aspartate receptor (NMDAR), leucine-rich, glioma inactivated 1 (LGI1), Contactin-associated protein-like 2 (CASPR2), α-amino-3-hydroxy-5-methyl-4-isoxazolepropionic acid receptor 1/2 (AMPAR1/2), and are mainly found after inflammatory brain damage31. There have been few cases reporting onconeural antibodies including Hu, Ri, Yo or CV2/CRMP5 antibodies in patients with MND: Anti-Hu have been reported in five patients with MND; four cases had typical ALS and one had ‘flail arm syndrome’. All patients were male, and their median age was 60, although onewas 30 years old. Presence of anti-Yo was reported in a 67-year-old female ALS patient with ovarian cancer whose neurological symptoms did not alleviate after the tumor resection22. Here, we investigated the presence of autoantibodies against anti-neuronal antibodies in sera samples of ALS patients by IIF, and we observed that all three ALS patients had autoantibodies directed against neuronal antigens; however this finding requires further evaluation with line blots and transfected cells as well as ahigher number of samples.
In a study on immune system alterations between healthy subjects and sALS patients, Zhang et al., (2005) revealed that disease severity is correlated with lower serum IgG levels, while significantly higher IgM levels were observed in both healthy subjects and individuals with severe disease32. When considering involvement of IgG subclasses in ALS, Ostermeyer-Shoaib and Pattern (1993) were the first to evaluate IgG subclasses in 25 ALS patients, and reported IgGl or IgG3 deficiency in 16 patients, while IgG2 and IgG4 levels were normal in all patients33. Similarly, Westarp et al., (1994) evaluated immunoglobulins and IgG subclasses’ levels in ALS patients’ sera, and found that while mean serum concentrations of total IgG along with IgA and IgM remained within reference values, the minimum values for IgG subclasses IgG1, IgG2 and IgG3 were below normal values and maxima only for IgG2, and IgG3 exceeded reference values34. Being reduced in 80.9% of the patients, IgG3 was reported to be the most altered isotype, followed by IgG1, which was reduced in 33.3% of the patients. When considered together with studies reporting ALS-derived IgGs induced certain alterations in neuronal and glial cells, these data underline the alterations in IgG levels in ALS progression, which should be evaluated further by both in vitro and in vivo studies. For this purpose, pure IgGs of ALS patients as well as their healthy counterparts, instead of whole sera samples, may be required as other proteins found in the serum may interfere with the results.
Herein, we aimed to develop and validate an IgG isolation protocol with FPLC, a fast and easy method for protein purification. IgG purification can also be performed with laboratory-prepared columns where the product is eluted with gravity, but automated chromatography increases the reproducibility of the experiment35. Our results revealed that the detection and quantitation limits were 0.045 mg and 0.13 mg, respectively, suggesting FPLC can be implemented to IgG isolation from sera samples, both from healthy individuals and patients with certain neurodegenerative diseases including ALS. However, it should be noted that due to the preliminary nature of this study, the precision between laboratories (reproducibility) was not evaluated, which should be considered in future studies as other laboratories equipped with the same instruments (ÄKTA Avant Chromatography System coupled with with HiTrap Protein G HP column, in our case) should validate this protocol. Similarly, this protocol should be validated with a certain number of individuals as well as their healthy controls, while comparisons between different laboratory methods such as nephelometry, enzyme-linked immunosorbent assays (ELISA) or flow cytometric bead arrays for comparing IgG concentrations can be employed. With sufficient sample sizes, differences between characteristics regarding both groups’ chromatograms can be detected, and FPLC can be utilized not just for IgG purification, but also diagnosis. However, this should be confirmed with further studies. Moreover, ALS is a rare disease and most patients are already receiving treatments, which may alter their IgG levels as well as their subtypes. For accurate results, newly diagnosed patients of both genders should be compared with their age and gender-matching healthy controls. Power analysis may be employed for calculating ideal sample sizes, especially if detecting alterations in the IgG compositions in serum samples via chromatography is the aim. This is a seriously challenging task during the COVID-19 pandemic as patients are generally in their late middle life, and very vulnerable to the SARS-CoV-2 virus1,36–39.
In conclusion, protein samples purified by FPLC can be used in biological evaluations, or respective IgG subtypes can further be analyzed with other chromatographic methods once the total IgGs are purified. It should be noted that these results reflect our preliminary findings; and further investigations regarding implementing FPLC-based IgG isolation in ALS is required.
Methods
Sample storage
This study was conducted with healthy individuals (subjects who were not diagnosed with an autoimmune disease and did not have an infection during the time the blood sample was collected) and ALS patients in accordance with the Helsinki Declaration; this study was approved by the local ethical committee of the Yeditepe University Hospitals, Yeditepe University (Approval number K-1616-999). Signed informed consent forms were obtained from all patients by the clinicians, which were also approved by the ethical committee. All samples were either immediately analyzed or stored at -80°C in portions until analysis.
Preparation of standards
Standard IgG samples were prepared by reconstituting total IgG (Sigma Aldrich, Catalogue number: I4506-10MG) with sterile 150 mM NaCl solution to obtain a 1 mg/mL solution and stored as 0.1 mg portions at -80°C. Frozen samples were thawed on ice, then brought to room temperature before analysis. Freeze-thaw cycles were avoided.
Chromatography protocol
This protocol was validated according to the International Council for Harmonization of Technical Requirements for Pharmaceuticals for Human Use (ICH)16. All chromatographic studies were conducted with ÄKTA Avant Chromatography System, equipped with HiTrap Protein G HP (1 mL) (both by GE Healthcare Life Sciences). Flow rate was set to 1 mL/min. The chromatography protocol consisted of equilibration (five column volumes) and elution (fifteen column volumes linear gradient, six-column volumes step gradient) steps. The composition of buffers used in this study are given in Table 1. Elution was performed at 4°C. 50 µL neutralization buffer was added to the wells of the elution plate prior the experiment. Analyses were conducted using the Unicorn software (Version 6.3). GraphPad Prism Version 8 was used for statistical analysis.
Table 1. Buffer compositions.
| Equilibration buffer | 25 mM phosphate buffer + 150 mM NaCl pH:7.4 |
| Wash buffer | 50 mM acetate buffer, pH:6 |
| Elution buffer | 75 mM acetate buffer, pH:3 |
| Protein neutralization buffer | 1 M tris, pH:9 |
Table 2 Retention times between patients’ samples and spiked samples.
| | Retention time (mL) |
|---|
|
|
Age
|
Serum sample
|
Spiked sample
|
|---|
|
Sample 1
| 32 | 22.27 | 22.46 |
| |
RT start: 15.3 |
RT end: 26.97 |
RT start: 18.94 |
RT end: 27.63 |
|
Sample 2
| 26 | 22.16 | 22.36 |
| |
RT start: 19.8 |
RT end: 26.69 |
RT start: 18.39 |
RT end: 27.61 |
|
Sample 3
| 64 | 22.11 | 22.38 |
| |
RT start: 13.7 |
RT end: 27.05 |
RT start: 17.89 |
RT end: 27.61 |
Table 3. Comparisons between the IgG amounts, eluted by chromatography and measured by spectrophotometer; and directly measured by spectrophotometer.
| Amount (mg) | Spectrophotometer
(mg) | Elute (mg) | Mean | RSD (%) | Accuracy (%) |
|---|
| 0.2 | 0.24 | 0.25 | 0.26 | 0.305 | 0.2825 | 11.26 | 115.30 |
| 0.5 | 0.61 | 0.54 | 0.66 | 0.67 | 0.665 | 1.06 | 115.65 |
| 0.75 | 0.79 | 0.73 | 0.774 | 0.709 | 0.7415 | 6.19 | 97.56 |
| 1 | 1.15 | 1.17 | 1.16 | 1.18 | 1.17 | 1.20 | 100.86 |
Table 4. Absorbance values for four different concentration of standard IgG samples reconstituted in NaCl solution, and further diluted in equilibration buffer.
Each measurement was replicated.
Concentration
(mg) | Height (mAU) | Mean
height | Standard
deviation |
|---|
|
1
|
2
| | |
|
0.2
| 42.65 | 37.04 | 39.85 | 3.97 |
|
0.5
| 93.71 | 99.32 | 96.51 | 3.97 |
|
0.75
| 136.35 | 145.48 | 140.92 | 6.46 |
|
1
| 191.59 | 193.78 | 192.69 | 1.55 |
Table 5. Absorbance values and retention times of four different individuals’ samples analysed on two different time points for intermediate precision.
| Age | Gender | Height
(mAU) | | Retention
time (CV) | |
|---|
| | | 1 | 2 | Mean | 1 | 2 | Mean |
|---|
| Sample 1 | 32 | F | 780 | 682 | 731 | 22.63 | 22.27 | 22.45 |
| Sample 4 | 29 | F | 677 | 691 | 684 | 22.17 | 22.31 | 22.24 |
| Sample 5 - ALS | 59 | M | 921 | 778 | 849.5 | 22.60 | 22.29 | 22.44 |
| Sample 6 -ALS | 67 | M | 856 | 868 | 862 | 22.45 | 22.38 | 22.41 |
Table 6. Performance data of the protocol.
| y-intercept | 1.305 |
| x-intercept | -0.006878 |
| Standard deviation of the slope | 3.847 |
| R2 | 0.9992 |
| p-value | 0.0004 |
| Limit of quantification (LOQ) (mg) | 0.13 |
| Limit of detection (LOD) (mg) | 0.045 |
Criteria evaluated
In our study, specificity (the ability of the protocol to determine the analyte in the presence of components which may be present in samples), accuracy (comparisons between the value obtained from chromatography with data of another analytical method) and precision (the ability of the protocol to measure the same value on different timepoints and by different laboratories and/or different operators) of the protocol were evaluated. For specificity, we analyzed two healthy and one ALS individuals’ serum samples and then spiked the same samples with standard IgG samples. We compared the retention times at the beginning and the end of retention. For accuracy, we measured the IgG protein amount in standard samples with spectrophotometry, and then measured the IgG protein amount in standards eluted with our chromatography protocol.
Precision was considered at two levels in this study: repeatability (precision under the same operating conditions over a short time interval) and intermediate precision (precision under different days). For repeatability, standards at four different concentrations were analyzed on the same day. Each standard was serially diluted from the stock IgG (1 mg/mL) with the equilibration buffer. Limit of detection (LOD) and limit of quantification (LOQ) were calculated according to the calibration curve drawn by the data obtained from standard IgG samples. Linearity was evaluated up to 1 mg with standard IgG sample measurements and performed two times. Intermediate precision was tested by analyzing four serum samples (two healthy, and two patients diagnosed with ALS) 30 days apart. On the same day, 2 mL whole blood was collected into serum collection tubes with clot activator and centrifuged. Tubes were centrifuged on the same day, and serum samples were separated into 2 mL syringes (0.5 mL per syringe). For each sample, one was immediately used while the other was frozen at -80°C. No preservatives were added to the frozen sample to protect protein stability. Reproducibility (precision between laboratories) was not evaluated within the context of this study.
Evaluating the autoantibodies’ presence in the sera samples
For immunofluorescence tests, serum samples of ALS patients (diluted in PBS-Tween-20 at final concentrations of 1:10 and 1:100, as recommended by the EuroImmun Neurology Mosaic I Kit) were incubated with the tissue slices (each well contains fixed primate tissues: cerebellum, nerve, and intestine) for 30 minutes at room temperature, followed by washing and labelling with FITC conjugated goat anti-human IgAGM. The kit included two positive controls for interpretation, both ready to use. All images were obtained on a JuLi Br&FL station (NanoEnTek, South Korea) with a green fluorescence filter at 4X zoom.