Introduction
The risk of neoplasm appearance after total body irradiation (TBI) in moderate doses has been demonstrated in numerous experimental investigations1,2 as well as in the clinical studies of Japanese atomic bomb survivors and of the consequences of the Chernobyl accident3. Tumors have also been reported in patients undergoing radiation treatment and diagnostics4,5. The appearance of tumors after irradiation is often related to the fact that the radiation can lead to life-threatening multiple organ failure, dysfunction syndrome, and inflammation6,7. After TBI, a variety of diseases frequently develop, such as extrahepatic bile obstruction, intrahepatic cholestasis, infiltrative liver disease, which is accompanied by increased serum alkaline phosphatase (ALP)8, as well as pancreatitis with an elevated level of amylase9. The most classically recognized symptom of acute radiation sickness is a hematopoietic syndrome resulting in a reduced count of platelets, leukocytes, and erythrocytes. Even low levels of exposure can lead to bone marrow failure, potentially lethal hemorrhage, or infections10. Decreased partial arterial oxygen pressure and an increased level of carboxyl groups are well-known signs of the pathological states in acute radiation syndrome and tumorigenesis11–13.
Tumor hypoxia leads to therapeutic resistance11,12 and promotes aggressive tumor behavior and metastases. Tumor clones dramatically alter their metabolic activity to meet the metabolic demands of relentless cell division. The highly conserved metabolic pathway of fermentative glycolysis is exploited by rapidly growing tissues and tumors14. Lactate generation is a cellular process necessary for maintaining glycolytic flux and facilitating the removal of pyruvate from the cell. The interconversion of pyruvate to lactate is mediated by lactate dehydrogenase (LDH) and results in the oxidation of NADH to NAD+. The role of lactate in cancer was described by Otto Warburg in 1927, prominently produced by glycolytic cells within tumors and a major fuel for oxidative cancer cells, and therefore a diagnostic agent15–18. Lactate exchanges across membranes are gated by monocarboxylate transporters (MCTs) which are upregulated in tumors. Thus, elevated lactate levels15–17, up-regulation of LDH18, and the expression of MCTs19 are prognostic markers of tumor progression. A highly glycolytic tumor metabolism is also associated with resistance to conventional therapies20. The parameters of glycolytic tumor metabolism are important predictors of tumor progression and patient survival.
In the present study, we aimed to investigate the main hematological and biochemical homeostasis parameters and peculiarities of tumorigenesis in rats after total body irradiation in sub-lethal doses.
Methods
Animal model
Two weeks before the start of the study (approved by the IEPOR Committee on Bioethics, protocol number 4 dated 16 April 2015 for experiments with rats in Nanomed project, 32 white, random-bred, female Wistar rats weighing ≅140g from IEPOR animal house, were taken for an adaptation period and had ad libitum access to standard food and water, in accordance with the provisions of the European Convention for the Protection of Vertebrate Animals Used for Experimental and Other Scientific Purposes (Strasbourg, 1986). All efforts were made to ameliorate any suffering of animals: rats had ad libitum access to standard food and water during the experiment and they were sacrificed under total anesthesia. At the beginning of the experiment all animals were randomly allocated into groups: 1— irradiated rats (n = 25); 2— healthy rats (n = 7), weighed and examined every month for visual tumor appearance. On month 12±1 most irradiated animals had visually detectable tumors. This period was selected as optimal for animal sacrifice because of the risk of development of tumor necrosis, which is unfavorable for histological study. After the dissection of all 32 animals, tumors were found in 19 rats after irradiation; this group was named Ir&Tum (n=19); the group of irradiated animals without tumors was named Ir (n=6), and healthy rats, where the control (n=7).
Irradiation
Ionizing radiation was delivered to eight-week-old rats weighing 194 g ± 18 (prior to irradiation), using an X-ray RUM-17 irradiator with a working current of 10 mA, 0.5 mm Cu filter, 30 cm-target distance in a rotating box with four separate sections (24 × 15 cm) for four rats; exposure time was 11 min. Control group animals underwent the same procedure, excluding irradiation. The absorbed sublethal dosage per rat was 6 Gy (54.5 cGy/min during 11 min), which was applied in the morning between 10–11 a.m.
Blood collection for blood cell count, biochemical parameters, lactate, pO2, pCO2, pH
Terminal citrate blood samples and heparin blood samples (for lactate, pO2, pCO2, pH) were obtained via puncture of the abdominal vein.
Blood cell count
Blood cell counts were performed using a light microscope.
Lactate, pO2, pCO2, pH level in blood
Lactate, pO2, pCO2, pH levels were measured using an ABL800-Flex gas analyzer (Radiometer, Copenhagen, Denmark).
Blood biochemical parameters
All biochemical parameters of serum were measured using reagent kits from Beckman Coulter and an autoanalyzer (Beckman Coulter AU-480, USA). The manufacturer's instructions were followed.
The alkaline phosphatase (ALP) level was determined by measuring the rate of conversion of p-nitro-phenylphosphate (pNPP) in the presence of 2-amino-2-methyl-1-propanol (AMP) at pH 10.4.21; alanine aminotransferase (ALT) transfers the amino group from alanine to α-oxoglutarate to form pyruvate and glutamate. The pyruvate enters a LDH catalyzed reaction with NADH (nicotinamide adenine dinucleotide, reduced) to produce lactate and NAD+ (nicotinamide adenine dinucleotide oxidized). The decrease in absorbance due to the consumption of NADH was measured at 340nm and is proportional to the ALT activity in sample22, aspartate aminotransferase (AST) catalyzes the transamination of aspartate and α-oxoglutarate, forming L-glutamate and oxalacetate. The oxalacetate is then reduced to L-malate by malate dehydrogenase, while NADH is simultaneously converted to NAD+. The decrease in absorbance due to the consumption of NADH was measured at 340nm and is proportional to the AST activity in sample22; amylase was measured using 2-chloro-4-nitrophenyl maltotrioside as substrate23, LDH: lactate and NAD (nicotinamide adenine dinucleotide) are converted to pyruvate and NADH catalyzed by LDH. NADH strongly absorbs light at 340nm, whereas NAD does not. The rate of change of absorbance at 340nm is directly proportional to the LDH activity in sample24; Ca2+ is based on calcium ions (Ca2+) reacting with Arsenazo III (2,2’-[1,8-Dihydroxy-3,6-disulphonaphthylene-2,7-bisazo]-bisbenzenear-sonic acid) to form an intense purple-colored complex25; creatinine reacts with picric acid at alkaline pH to form a yellow-orange complex. The rate of change in absorbance at 520/800nm is proportional to the creatinine concentration in sample26; glucose27 is phosphorylated by hexokinase (HK) in the presence of adenosine triphosphate (ATP) and magnesium ions to produce glucose-6-phosphate (G6P) and adenosine diphosphate (ADP). Glucose-6-phosphate dehydrogenase (G6PD) specifically oxidizes G6P to 6-phosphogluconate with the concurrent reduction of (NAD) to NADH. The change in absorbance at 340/380nm is proportional to the amount of glucose present in the sample.; phosphorus measurement was based on a modification of method28. The absorbance at 340/380nm is directly proportional to the inorganic phosphorus level in sample28; urea is hydrolyzed enzymatically by urease to yield ammonia and carbon dioxide. The ammonia and α-oxoglutarate are converted to glutamate in a reaction catalyzed by L-glutamate dehydrogenase (GLDH). Simultaneously, a molar equivalent of NADH is oxidized. Two molecules of NADH are oxidized for each molecule of urea hydrolyzed. The rate of change in absorbance at 340nm, due to the disappearance of NADH, is directly proportional to the urea concentration in sample29; uric acid is determined by measurement of hydrogen peroxide produced by, the uricase reaction30. Total protein was measured by the biuret method: cupric ions in an alkaline solution react with proteins and polypeptides containing at least two peptide bonds to produce a violet-colored complex. The absorbance of the complex at 540/660nm is directly proportional to the concentration of protein in the sample.
Histology of tumor tissues
Tumor tissues were carefully isolated for histological examination, weighed, measured, and fixed in 4% neutral buffered formalin. Fixed tissues were dehydrated and embedded in paraffin and then cut into serial 4µm-thick sections. The histopathological characteristics were obtained on tumor tissue sections after hematoxylin & eosin staining in 19 rats with tumors.
Statistical analysis
Mean values and standard deviations were calculated. Normal distribution of data was calculated with Shapiro- Wilk test. Differences between groups with normal distribution data were evaluated statistically with Fisher’s test followed by a Student’s t-test for independent samples. Group differences were considered significant when p < 0.05. For groups with abnormal data distribution statistical analysis of the results was carried out using Mann-Whitney U nonparametric comparison. Statistical significance was set at p < 0.05.
Results
Twelve months after irradiation in 76 % of females (19 from 25, group- Ir&tum) tumors were detected visually in the lower part of the animal's body associated with mammalian glands. Histological analysis indicates that all the tumors found were fibroadenomas of the breast (Figure 1–Figure 3). Fibroadenoma is a benign neoplasm, in which the lobular structure of the gland is preserved. But the proliferation of both glandular and stromal elements is clearly manifested, atypia is not observed in any of the components. Glandular and stromal components of the gland are clearly visible on histological preparations of tumors. The glandular parenchyma is represented by secretory (tubulo-alveolar) units and their clusters with the layers formed by fibrous connective tissue. No tumor was found in any control.
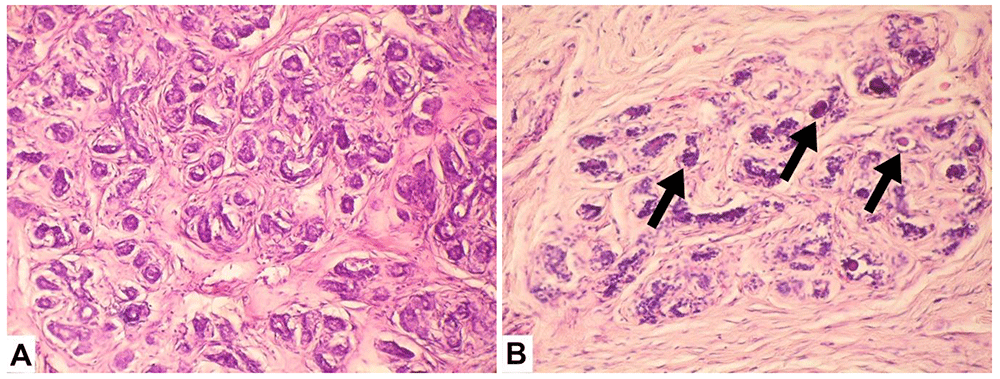
Figure 1. Representative photos of neoplasms of rats from the K1 conditional grouping with low values of the ratio of tumor weight to blood lactate or LDH levels (C1≤ 0.5) [X20]).
A. Proliferation of acinar structures consisting of epithelium and myoepithelium surrounded by the basement membrane. Acinuses were round and oval, with interlobular fibrous connective tissue, and dilation of the ducts. There were no signs of malignancy. B. In the lumens of the glands noticeable basophilic homogeneous content (black arrows).
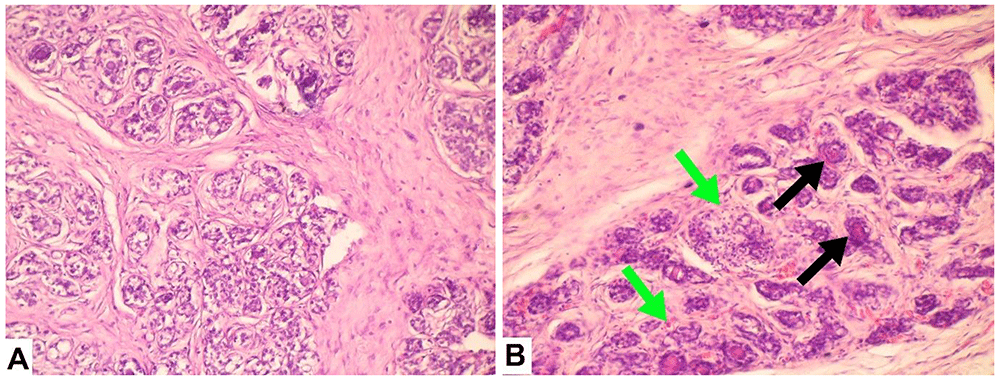
Figure 2. Representative photos of neoplasms of rats from the K2 conditional grouping with ratios of tumor weight to lactate level (0.5 < C1 < 1.5) (X20).
А. Lobular hyperplasia. Round or oval acini, between which there were well-developed layers of connective tissue. Stromal fibrosis. В. The proliferation of both glandular and stromal elements. Basophilic homogeneous content is visible in the lumens of the glands (black arrows). The inflammatory infiltrate is visible in the stroma and glands (green arrows).
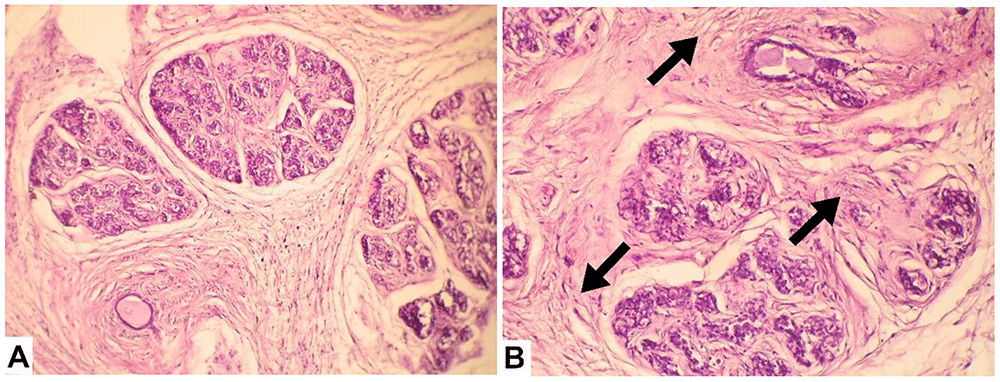
Figure 3. Representative photos of neoplasms in rats from the K3 conditional grouping with relatively high values of ratios of tumor weight to blood lactate level (C1 ≥1.5) [X20]).
А. Вreast fibroadenomas with connective tissue fibrosis. Collagen and bland spindle-shaped stromal cells with ovoid or elongated nuclei. Vessels without pathological changes, lined with a single layer of endothelium. В. Lobular hyperplasia. Densely located small alveoli formed by two-layer epithelium. Well-developed connective tissue stroma around the glands (black arrows show stromal collagen fibers).
Statistical analysis (Mann-Whitney U test) of biochemical parameters showed no difference between irradiated and irradiated tumor groups (Schema). Therefore, a comparison was made between all exposed to irradiation animals and healthy controls.
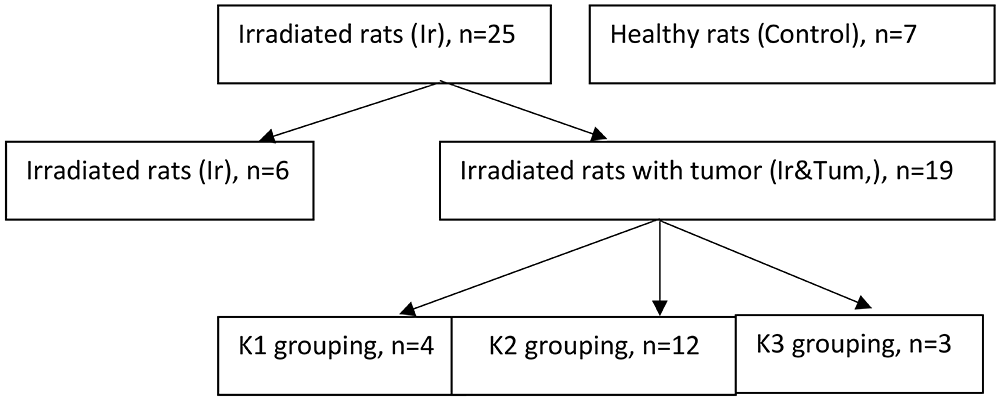
Schema of rat’s distribution into group and conditional groupings K (formed accordingly C1 or C2 values, Table 4) during the experiment.
The statistical increase of alkaline phosphatase was observed in irradiated animals in comparison with the control group. Amylase activity in the plasma of rats in irradiated groups was statistically higher one year after irradiation than in the control. Inorganic phosphorus levels in blood plasma decreased after irradiation. (Table 1).
Table 1. Alkaline phosphatase (ALP), alanine aminotransferase (ALT), amylase, aspartate aminotransferase (AST), lactate dehydrogenase (LDH), Ca2+, creatinine, glucose, phosphorus, urea, total protein, and uric acid levels in the blood plasma of rat groups: healthy animals (control), irradiated animals.
| Rat group | ALP, U/L | ALT, U/L | Amylase, U/L | AST, U/L | LDH, U/L | Ca 2+ mmol/L | Creatinine, µmol/L | Glucose, mmol/L | Phosphorus, mmol/L | Total protein ,g/L | Urea, mmol/L | Uric Acid, µmol/L |
|---|
Control
n=7 | 111±33 | 54±17 | 1701±251 | 183±20 | 935±317 | 2.2±0.1 | 41±8.6 | 3.9±0.9 | 2.3±0.7 | 63±8 | 6.6±1.1 | 72±9 |
Irradiated
n=25 | 175.2±82* | 60±26 | 2283±647* | 173±75 | 728±303 | 2.1±0.4 | 32.2±5.0 | 5.3±0.4 | 1.3±0.4* | 57±9.9 | 5.6±1 | 74±41 |
Hematological parameters in major cases demonstrated a worsening in both irradiated groups. White blood cells and platelet levels were found to be significantly lower in the blood of irradiated animals with a tumor in comparison with healthy control as well as irradiated animals without tumors (Table 2)
Table 2. Hematological parameters of rats (control: healthy animals, irradiated: Ir, with visually detected tumor after irradiation: Ir&Tum): hemoglobin (Hb), white blood cells (WBC), red blood cells (RBC), stab and segmented neutrophils, lymphocytes, monocytes, and platelets.
| Rat group | Hb, g/L | WBC, 109 /L | RBC,1012 / L | Eosinophils,
109 /L | Neutrophiles, stab.,
109/L | Neutrophiles,segmented,
109 /L | Lymphocytes,
109 /L | Monocytes, 109 /L | Platelets, 109 /L |
|---|
| Control, n=7 | 131±12.4 | 10±1.1 | 5±0.9 | 0.04±0.04 | 0.08±0.03 | 2±0.5 | 7±1.6 | 0.5±0.2 | 267±29 |
| Ir, n=6 | 132±1.2 | 9±1.6 | 5±0.2 | 0.04±0.04 | 0.0±0.0 | 2±0.2 | 7±1.5 | 0.2±0.1 | 304±11 |
| Ir&Tum, n=17 | 125±13 | 5.9±1.7*# | 4.5±0.5 | 0.02±0.04 | 0.1±0.03 | 1.2±0.5 | 4.3±1.1 | 0.2±0.2 | 204±57*# |
The lactate level was significantly elevated in the tumor group compared to the control. In both irradiated groups pO2 was significantly reduced, and in the irradiated group without tumor pCO2 increased, as opposed to the control group (Table 3).
Table 3. Lactate, pO2, pCO2, and pH in the blood by rat group: healthy animals (control), irradiated (Ir), with tumor appearance one year after total body irradiation (Ir&Tum).
| Rat’s group | Lactate,
mmol/L | pO2,
mm Hg | pCO2,
mm Hg | pH |
|---|
| Control, (n=7) | 5.3±0.8 | 60.7±2.3 | 33.8±8.9 | 7.3±0.05 |
| Ir, (n=6) | 6.3±1.2 | 45.6±3.7* | 42.6±1.7* | 7.3±0.05 |
| Ir&Tum, (n=19) | 6.6±1.9* | 41.1±6.2* | 38.3±5.9 | 7.3±0.1 |
The first tumor was visually detected five months post-irradiation (Table 4) but the majority of tumors appeared later, in the tenth (n=9) and thirteenth (n=5) month after irradiation (Table 4)
Table 4. Weight and volume of tumors in the Ir& Tum rat group (n=19) and month of visual detection after total body irradiation; blood lactate dehydrogenase (LDH) and lactate levels; C1: coefficient = Tumor weight/ Lactate level; C2:coefficient = Tumor weight/ LDH *1000, K 1-3: groupings of animals, where: K1 is the grouping of rats with C1 ≤ 0.5; K2: with 0.5< C1 <1.5; K3: with C1≤1.5.
Rat
number | Month of tumor
detection after
irradiation | Tumor
volume, cm3 | Tumor
weight, g | LDH,
U/L | Lactate
level,
mmol/L | C1 | C2 | K
groupings |
|---|
| 1 | 13 | 0.88 | 2.28 | 1307 | 5.7 | 0.4 | 1.7 | K1 |
| 2 | 10 | 1.05 | 1.8 | 668 | 4.2 | 0.4 | 2.7 | K1 |
| 3 | 11 | 3.3 | 4.24 | 1338 | 8.7 | 0.5 | 3.2 | K1 |
| 4 | 10 | 4.25 | 4.61 | 1370 | 9.4 | 0.5 | 3.4 | K1 |
| 5 | 5 | 2.68 | 2.76 | 1401 | 4.5 | 0.6 | 2.0 | K2 |
| 6 | 10 | 4.5 | 6.66 | 546 | 8.1 | 0.8 | 12.2 | K2 |
| 7 | 13 | 8.77 | 7.7 | 720 | 8.9 | 0.9 | 10.7 | K2 |
| 8 | 9 | 6.21 | 7.82 | 621 | 8.5 | 0.9 | 12.6 | K2 |
| 9 | 10 | 1.98 | 3.41 | 480 | 3.7 | 0.9 | 7.1 | K2 |
| 10 | 10 | 6.63 | 5.62 | 484 | 5.9 | 1.0 | 11.6 | K2 |
| 11 | 13 | 1.98 | 4.76 | 735 | 4.8 | 1.0 | 6.5 | K2 |
| 12 | 10 | 4.35 | 8.32 | 590 | 8.1 | 1.0 | 14.1 | K2 |
| 13 | 10 | 2.77 | 4.75 | 536 | 4.5 | 1.1 | 8.9 | K2 |
| 14 | 13 | 10.58 | 6.85 | 597 | 5.3 | 1.3 | 11.5 | K2 |
| 15 | 13 | 6.84 | 8.2 | 826 | 6.1 | 1.3 | 9.9 | K2 |
| 16 | 10 | 7.6 | 8.71 | 991 | 6.3 | 1.4 | 8.8 | K2 |
| 17 | 8 | 1.79 | 6.63 | 453 | 4.3 | 1.5 | 14.6 | K3 |
| 18 | 10 | 26.8 | 19.46 | 659 | 9.6 | 2.0 | 29.5 | K3 |
| 19 | 8 | 25.3 | 36.8 | 279 | 8 | 4.6 | 131.9 | K3 |
The certain correlation of tumor weight (but not tumor volume, measured manually) with lactate and LDH values in the blood of irradiated animals is shown in Table 4. All animals with tumor were distributed in three groupings named K1-K3-see Schema, according to the coefficient C1 reflecting the ratio of tumor weight to blood lactate level. In the majority of animals (63.2%, n=12, grouping K2) tumor weight was direct related to blood lactate and LDH levels and the C1 coefficient was approximately equal to 1 (0.5<C1<1.5). In the remaining 36,8% of animals, the lactate and LDH levels were not directly related to tumor weight. In the K1 (n=4) grouping, C1 had a value ≤ 0.5, and in the K3 grouping, C1 ≥ 1.5 (n=3, 15.8% of animals). The C1 coefficient correlated (except for rat number 5, with a C1 value of 0.6 on the border of K2 and K1 values) with the C2 coefficient (ratio of tumor weight to LDH level), which confirms the correct distribution of animals in these conditional K groupings and the possibility to use blood lactate or LDH levels for classification.
We investigated the histological specificities of neoplasms in 19 rats from the Ir&Tum group, classified and grouped conditionally in the groupings K1, K2, and K3, according to the values of the C1 coefficient.
Neoplasms in the K1 grouping (n=4) with a relatively low tumor weight ratio to lactate level in the blood (C1 ≤ 0.5) produced tumors comprised of fibrous and glandular tissues with a predominant epithelial component of a clear lobular structure breast (Figure 1A, B). Glandular structures were formed by a two-layer epithelium without signs of atypia. The inner glandular layer consisted of cuboidal cells with normochromic nuclei. Benign processes were recognized by the presence of myofibroblasts. Basophilic content was noticeable in the lumen of many glands and ducts and the cystic extension of the ducts could be observed (Figure 1B). The stroma was homogeneous, hypo-vascular, with signs of fibrosis. The fusiform fibroblasts with elongated nuclei were seen between collagen fibers. No signs of inflammation and hemorrhages in the tumor were observed in the connective tissue stroma.
Histological examination of tumors in rats in conditional grouping K2 (n=12) with a tumor weight to blood lactate level ratio 0.5 < C1 <1.5 demonstrated signs of biphasic hyperplasia of the glandular lobes and connective tissue stroma (Figure 2А, В). Neoplasms were represented by hyperplastic breast tissue with a clear lobular structure. Acini were lined with epithelial cells with vacuolated cytoplasm, indicating active synthesis as well as secretion31,32. Epitheliocytes formed a multilayered epithelium, not typical to the glands but without signs of atypia. Nuclei were of typical size with eu- and hetero-chromatin. Mitotic figures were not found. In most animals in this group, small cystic cavities filled with basophilic homogeneous mass (Figure 2В) were observed. The stroma was represented by well-developed collagen fibers, with clearly visible nuclei of the fibroblasts between them. The blood vessels in the tumor were dilated and filled with blood cells. Outside vessels, erythrocytes were visible in a stroma as well as in parenchyma (Figure 2В).
The parenchyma of tumors in rats from the K3 conditional grouping (n=3) with relatively high values of the ratio of the tumor weight to blood lactate level (C1 ≥ 1.5) was shown by a complex, branched tubular-alveolar system, separated from each other by stromal connective tissue. Moreover, the stromal fibrous component predominated in the slides (Figure 3А, B), with clearly visible, well-developed fibers and elongated fibroblasts.
In the K1, K2, and K3 conditional groupings of Ir&Tum rats, the histological features of neoplasms were generally similar, but had some specific differences. In all groups, the tumors were identified as benign (non-cancerous) breast fibroadenomas with signs of proliferation of epithelial and stromal elements.
In the K3 grouping, with maximal values of ratio of tumor weight to lactate (C1 ≥ 1.5) the stroma connective tissue was associated with increased proliferation. In the K1 grouping with minimal C1 (≤ 0.5), tumor tissue dominated well-developed ductal epithelium with lobular hyperplasia, indicating high secretory activity. In K1 as well as in most K2 rats, a homogeneous basophilic content in the lobule was found. This indicates the high secretory activity of epithelial cells31,33. Signs of inflammation were found only in some animals in the K2 and K3 groupings. In several K2 rats, histological signs of extensive vascular blood supply in tumors were discovered.
Discussion
The metabolic and hematological unbalances in irradiated animals that arise after irradiation, violate homeostasis34 and can conduct to tumorigenesis. In all irradiated rats (n=25), a significant increase in serum alkaline phosphatase (ALP) indicates a metabolic disorder35, which disrupts homeostasis (Table 1). Markedly elevated ALP is seen predominantly with a number of specific pathologies, such as malignant biliary obstruction, primary biliary cirrhosis, primary sclerosing cholangitis, hepatic lymphoma, and sarcoidosis36. Amylase activity is depicted in Table 1. A significant increase in the activity of serum amylase (although only 1.5-1.3-fold) is evident in all irradiated animals one year after irradiation. Increased activity of amylase and lipase is usually a diagnostic sign of pancreatitis9; these enzymes are released from the pancreas into circulation early in the inflammation process. The detected 1.8 times decrease of plasma phosphorus in rats one year after irradiation in comparison with control (Table 1), indicates a severe metabolic disorder. Phosphorus, as an essential component in the ATP molecule, plays a central role in energy production. Hypophosphatemia can lead to ATP depletion, a shift from oxidative phosphorylation toward glycolysis, and subsequently, organ dysfunction37. Hypophosphatemia is known to play an essential role in impaired chemotaxis, phagocytosis, and bactericidal activity of macrophages38. Whole-body irradiation of mice produces significant dose-dependent depression of phosphorus at 4 days post-irradiation39. Hypophosphatemia is detected in patients hospitalized with medical illnesses such as cancer40, pneumonia41, etc. The statistically significant drop of pO2 is found in all irradiated animals (Table 3), which indicates the presence of pathological processes11,12. The unbalance of homeostasis after irradiation conducted to the appearance of benign tumors-fibroadenomas, associated with mammalian glands (Figure 1–Figure 3) in 76% of female rats within five to 13 months after TBI (Table 4). The peak of the tumor appearance occurs 10–13 months after irradiation. No tumor was detected visually in the controls. We only detected and histologically confirmed benign tumors in our experiment, while Bespalov and colleagues1 reported about 40% of malignant tumors from a total number of radiation-induced tumors (80% of animals) 16 months after total body gamma-ray irradiation in doses of 4 Gy (1.34 Gy per min). Perhaps this is due to the different doses and sources of rat irradiation. Blood leukocytes and platelets count (Table 2) is statistically lower in the Ir&Tum group, indicating and confirming an inhibitory effect of the tumor on hematopoiesis42. In blood samples lactate levels in the group of animals with tumors (Ir&Tum) are statistically higher than in healthy animals (Table 3). However, the LDH level in the same group of animals is not statistically different possibly due to high values of the standard deviation. Benign as well as malignant tumors progress, and this process is associated with high energetic demands. Lactate and LDH, the main actors of fermentative glycolysis, meet the energy demands of tumors. Elevated lactate and LDH levels in the presence of tumor is described in numerous studies15–18,43,44. Furthermore, increased blood LDH and lactate values are observed in both malignant45 and benign43,44 growths. Elevated lactate levels in the blood of animals (Table3) with irradiation-induced tumors (Ir&Tum group), are a sign of the metabolic adaption of tumor cells but also of a pathway utilized by a variety of inflammatory immune cells15. The release of lactate from tumor cells is accompanied by acidification in the tumor microenvironment favoring tumor promotion, angiogenesis, metastasis, and tumor resistance17. The microenvironment of a tumor consists of a dynamic and complex network of cytokines, growth factors, and metabolic products. This contributes to significant alterations in cell growth, tissue architecture, immune cell phenotype, and function46. LDH, one of the main actors of lactate metabolism, is released from cells in response to their damage, causing its baseline level to rise in the extracellular space and the bloodstream as well as other body fluids. As elevated LDH levels are found to be an unfavorable indicator for survival in cancer patients, it was suggested that LDH can be used as a marker of tumor aggressiveness45.
We tried to find a correlation between the ratio of the mass of tumors to lactate/LDH levels in the blood and the histological peculiarities of tumor tissue. For this, the 19 animals with irradiation-induced tumors were divided into three conditional groupings (K1-K3) according to the value of tumor weight ratio to lactate level (C1) (Table 4). We considered it important that the C2 coefficient, which reflects the ratio of tumor weight to blood LDH levels (one of the main actors of lactate metabolism17), correlated with the C1 coefficient, i.e., the ratio of tumor weight to lactate level. This means that the same animals could be divided into the three conditional K1-K3 groupings depending on the values of tumor weight ratio to either lactate or blood LDH levels.
In the majority of animals with a tumor in the conditional K2 grouping (63.20%, n=12), with a value of tumor weight ratio to blood lactate level (0.5 < C1 <1.5), histological examination revealed signs of biphasic hyperplasia of the glandular lobes and connective tissue stroma (Figure 2 А, В). This indicates secretory and proliferative activities of tumor tissues31,32. Neoplasms in the K3 grouping (Table 4) with relatively high values of tumor weight ratio to lactate level (C1≥ 1.5, n=3) are represented by fibrous and glandular tissues with some predominance of the connective tissue stromal component (Figure 3A,-B). This shows certain prevalence of proliferative activity of tumor cells32,47. In the K1 grouping with a relatively low (C1≤ 0.5) value of the tumor weight ratio to blood lactate or LDH levels (Figure 1), the epithelial structure with homogeneous basophilic content predominated the glandular lumens. This is associated with some predominance of high secretory activity of tumors31,33. Thus, the values of the ratio of tumor weight to blood lactate or LDH levels (C1 and C2 coefficients) point out a plausible correlation with the histological specificity of tumor tissues. This makes it possible to indirectly and preliminary predict the specificities of the tumor state, indicating some prevalence of proliferative activity, as in the K3 grouping, or secretory one, as in the K1 grouping, or a balance between proliferative and secretory activities of tumor cells (K2 grouping).
The preliminary results obtained in this experiment allow us to hypothesize that the ratio of tumor mass or tumor volume, detected by modern methods in the clinic, to the values of blood lactate or LDH level, may be informative for the preliminary characterization of the tumor process, indicating the certain prevalence of proliferative or secretory activity, or a balance between proliferative and secretory activities of tumor cells.
Conclusions
Total body irradiation in sub-lethal doses promoted the alterations of hematological and biochemical parameters of homeostasis in rats and provoked the appearance of benign tumors one year after. The ratio value of tumor mass to blood lactate or lactate dehydrogenase levels seems to reflect the histological peculiarities of tumors, indicating in this way some prevalance of proliferative or secretory activity, or a balance between proliferative and secretory activities of the tumor process.