Technology operation model of individual households
We developed an hourly technology operation model for individual households to model the response of households’ energy consumption to variable electricity prices. The model calculates the operation of technologies throughout a whole year (8760 hours) in two modes: 1) benchmark mode, in which the energy demand of the building is met to keep a certain comfort level, and 2) optimization mode, in which a SEMS minimizes the operation cost of the household while keeping the same comfort level.
Figure 1 presents the model’s general set up - input and output. Further details can be found in 191.
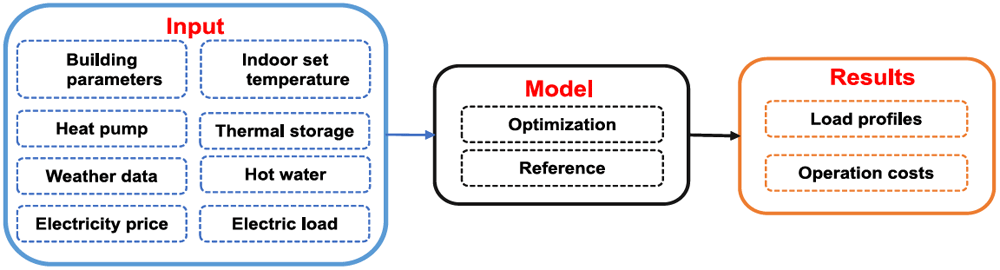
Figure 1. Overall structure of the model.
The relevant parts of the model for this paper are introduced as follows.
The necessary heating demand is calculated with a simplified five resistance one capacity (5R1C shown in Figure 2) approach following the DIN ISO 13790. This norm is outdated and has been replaced by the DIN ISO 52016. But the computational effort to implement the DIN ISO 52016 into the optimization framework is much higher. Both modeling approaches have been compared in 21. And the 5R1C approach has been tested against results from Energy Plus, Invert/EELab and the VDI 600722–24. They show that the heating demand calculated by the 5R1C model is reasonably accurate, whereas cooling demand is strongly overestimated.
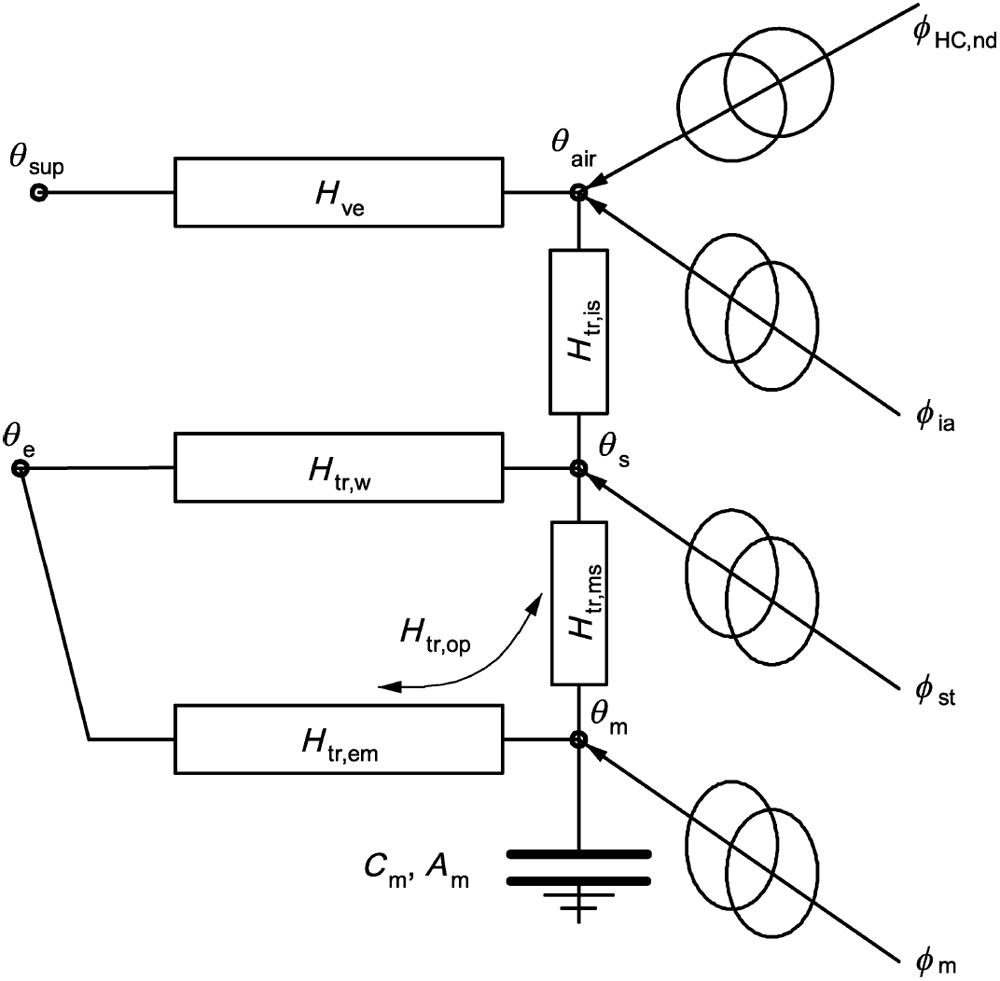
Figure 2. 5R1C circuit representation.
Figure 2 shows the circuit representation of the 5R1C model described in the DIN ISO 13790. The relation between outside temperature (θoutside), indoor temperature (θair) and heating demand (ϕHC) is provided by the following equations. A detailed description of the calculation methodology can be found in the DIN ISO 13790. In the following equations, ϕ represents any kind of heat flow in W and θ is used to describe temperatures in °C. Equation 1 describes the relation between the indoor temperature ( ) and the provided heating energy ( ).
θsup describes the air temperature from the ventilation system. If no ventilation system with heat exchangers is adopted θsup is set to θoutside. In this study ventilation systems are neglected.
ϕint describe the internal heat gains in W/m2. For simplification the internal gains (ϕint) are kept constant with 3.4W/m2, although in reality they can change every hour.
The node temperature θs is calculated through following equation:
The average temperature of the thermal mass ( ) in each timestep is calculated as follows:
and represent the temperature of the thermal mass in the current and in the previous timestep and have to be calculated for each timestep individually:
with
with ϕsol describing the solar gains.
Every parameter described with an H represents a transmission heat transfer coefficient and is given in W/K. All building specific parameters are described in the following equations:
with Hve being the ventilation transfer coefficient.
with his being the heat transfer coefficient between the air node θair and the surface node θs which equals to 3.45W/m2K. Atot denotes the total surface area of the building in m2.
where Af is the effectively used floor area in m2 and Λat represents the dimensionless ratio between the surface area of all surfaces that face into the space and the effective area. Λat is set to 4.5.
Hms is provided in W/K:
hms denotes the heat transfer coefficient between the nodes m and s and is fixed with 9.1W/m2K.
Am is the effective mass-related area in m2 and is calculated with following formula:
Aj represents the surface area of the building element j in m2 and kj represents the specific thermal capacity of a building element j in J/m2K. Cm is provided in J/K and denotes the total thermal capacity of the building mass:
HD, Hg, HU and HA represent the transmission heat transfer coefficients for direct heat transmission to the external environment (HD), for the steady-state heat transmission to the ground (Hg), through unconditioned rooms (HU) and to adjacent buildings (HA). The calculation of these four parameters is described in the DIN ISO 13789. In the following equation HX stands for either HD,Hg,HU,HA:
with Ui being the heat transfer coefficient in W/m2K for the respective building element i.
ψ... linear heat transfer coefficient for a thermal bridge
l... length of a thermal bridge
χ... heat transfer coefficient for a punctual thermal bridge
btr,x... adjustment factor if the temperature if the temperature on the other side of the component is not equal to the temperature of the external environment
The total ventilation heat transfer coefficient (Hve) is calculated as follows:
ρa × ca... volume-related heat storage capacity of the air in J/m3K
qve... the time-averaged air volume flow
bve... the temperature adjustment factor for airflow element k. If the supply air temperature is not equal to the temperature of the external environment, bve ≠ 1.
Parameters for each building are shown in Table 1. Complete data on the buildings including window areas are provided in 25 in the ”Variable_Price_Paper.sqlite” file under the table name ”OperationScenario_Component_Building”.
Table 1. Building IDs with 5R1C parameters11.
| ID | Name | Generation
of renovation | Age class | Af (m2) | Hve | Hop | Htr,w | Cm (mio. J/K) |
|---|
| 1 | SFH A mon | - | 1890–1918 | 129 | 36 | 229 | 101 | 53 |
| 2 | 1 | 242 | 87 |
| 3 | 2 | 250 | 78 |
| 4 | 3 | 198 | 76 |
| 5 | SFH A | - | 1890–1918 | 129 | 36 | 227 | 101 | 53 |
| 6 | 1 | 241 | 87 |
| 7 | 2 | 250 | 78 |
| 8 | 3 | 164 | 67 |
| 9 | SFH B mon | - | 1919–1944 | 136 | 38 | 290 | 116 | 46 |
| 10 | 1 | 306 | 100 |
| 11 | 2 | 316 | 89 |
| 12 | 3 | 206 | 78 |
| 13 | SFH B | - | 1919–1944 | 136 | 38 | 288 | 117 | 46 |
| 14 | 1 | 305 | 100 |
| 15 | 2 | 316 | 89 |
| 16 | 3 | 189 | 74 |
| 17 | SFH C | - | 1945–1960 | 144 | 41 | 278 | 116 | 31 |
| 18 | 1 | 295 | 99 |
| 19 | 2 | 304 | 89 |
| 20 | 3 | 183 | 70 |
| 21 | SFH D | - | 1961–1970 | 154 | 44 | 193 | 95 | 33 |
| 22 | 1 | 206 | 82 |
| 23 | 2 | 212 | 77 |
| 24 | 3 | 150 | 68 |
| 25 | SFH E | - | 1971–1980 | 163 | 46 | 204 | 101 | 35 |
| 26 | 1 | 214 | 90 |
| 27 | 2 | 226 | 79 |
| 28 | 3 | 159 | 71 |
| 29 | SFH F | - | 1981–1990 | 166 | 46 | 141 | 79 | 35 |
| 30 | 1 | 149 | 71 |
| 31 | 2 | 142 | 69 |
| 32 | SFH G | - | 1991–2000 | 170 | 48 | 120 | 71 | 31 |
| 33 | 1 | 122 | 68 |
| 34 | SFH H | - | 2001–2008 | 170 | 48 | 90 | 59 | 19 |
| 35 | SFH I | - | 2009–2012 | 170 | 48 | 87 | 62 | 19 |
| 36 | SFH dh | - | 2012–2019 | 170 | 48 | 59 | 47 | 19 |
Space heating and hot water demand are met by an HP where the coefficient of performance (COP) is dependent on the supply and the source temperature:
η represents a constant efficiency factor and is set to 0.35 for air source HP and 0.4 for ground source HP2. For space heating, an average supply temperature (Tsupply) of 35°C is assumed, and for domestic hot water, the supply temperature is 55 °C. If the HP charges a thermal storage, the supply temperature rises by 10 °C. Indoor temperature is set to be within 20°C and 23°C. For the air source HP the source temperature (Tsource) is the outside temperature and assumed to be a constant 10°C for the ground source. The maximal electric capacity of the HP is determined by calculating the necessary thermal power of the building and COP at design conditions. In Austria, design outside temperature is around -12°C26.
Austria’s outside temperature and radiation profile is generated by weighting the profiles for every NUTS3 region in Austria by their respective residential floor area and taking the average. The data is downloaded from PV GIS27 for 2019.
To determine the influence of thermal storage devices on a building to shift electric loads, we simulate a SFH once without any thermal storage device and once with a buffer storage for heating and a tank for domestic hot water (DHW). The size of the DHW storage was chosen to be 400 l, and the buffer storage for heating has a volume of 750 l. Following assumptions were made regarding the hot water storage to keep the model linear:
The temperature inside the tank is homogenous.
The temperature surrounding (Ttanksurrounding) the tank is constant at 20°C.
Thermodynamic properties of the water (volume, heat capacity (cwater in J/kgK) and pressure) are constant.
The following equations represent the physical limitations of the hot water tanks:
denotes the energy stored in a tank (J) at a particular hour with mwater (kg) being the mass of the water and the current temperature inside the tank. is the minimum temperature inside the tank and was chosen to be 28°C. is the temperature inside the tank at the start of the simulation. The maximum temperature of the buffer heating storage is 45°C and 65°C for the DHW storage. Both storages have the same insulation with a heat transfer coefficient (Λ) of 0.2 W/m2. The buffer storage and the DHW tank have an Area (Atank) of 4.6 m2 and 3 m2, respectively. describes the thermal losses of the storage.
In the further course, we simulate multiple representative buildings from the Austrian SFH building stock and aggregate the results to the national level.
An optimization was developed in Pyomo28 and solved by Gurobi3 to minimize the household energy cost. The objective function of the model is to minimize the operation costs over one year on an hourly basis:
With Pt being the electricity price and Et the amount of electricity bought from the grid at a certain hour. The electricity consumption is composed of fixed and variable components. Fixed components of the electricity consumption are internal loads from appliances and lighting as well as the electricity demand of the HP for hot water generation in case there is no DHW storage. The electricity consumption profile is a synthetic load profile for a single household4. The hot water demand consumption rate is assumed to be 90 l per day29 with an initial temperature of 10°C and a supply temperature of 55°C. The hourly demand profile is taken from the Hotmaps project30.
The variable electric load consists of the electricity demand from the HP. The SEMS can increase the heating demand in a specific timeframe by pre-heating the building and reduce it in the following hours. Additionally, if the building is equipped with thermal storages, they can be charged and discharged at any time. Thus, the SEMS can shift electricity demand for heating even more effectively.
Similar to 4 shifted energy (Eshifted) in this study was defined as the difference between the electric power consumption profiles with and without DR:
denotes the electric load from the grid in the benchmark case and the load with a SEMS installed. If is higher than the building is being pre-heated or storages are charged. Likewise the energy is shifted whenever is higher than . Naturally the shifted energy is is lower than the energy used to charge storages and building mass due to thermal losses.
The benchmark model cannot shift any loads. Heating demand is calculated based on the same 5R1C approach with the assumption that the air temperature inside the building should not drop below 20°C. The HP then provides the needed heating power with the corresponding COP. As there is no non-smart logic on when to fill and discharge a thermal storage based on the variable price, the benchmark model does not adapt thermal storages.
To capture the possible impact of price incentivized load shifting of the Austrian SFH building stock, we coupled our model to the INVERT/EELab building stock model11. In this database, the SFH building stock in Austria is represented by 36 building categories. Each category represents a typical SFH built in a certain time period and its overall thermal insulation properties. The different representative buildings and the installed number of HP in each category are presented in Figure 3. More information about the buildings is provided in Table 1. The appendix ”mon” indicates that the buildings are under protection. Gen2, gen3, and gen4 indicate that these buildings have undergone a certain renovation, with higher numbers representing more recent renovations. We can see that most HPs have been installed in modern buildings. Overall Austria has around 1.55 million SFHs out of which 180 000 have a HP installed5.
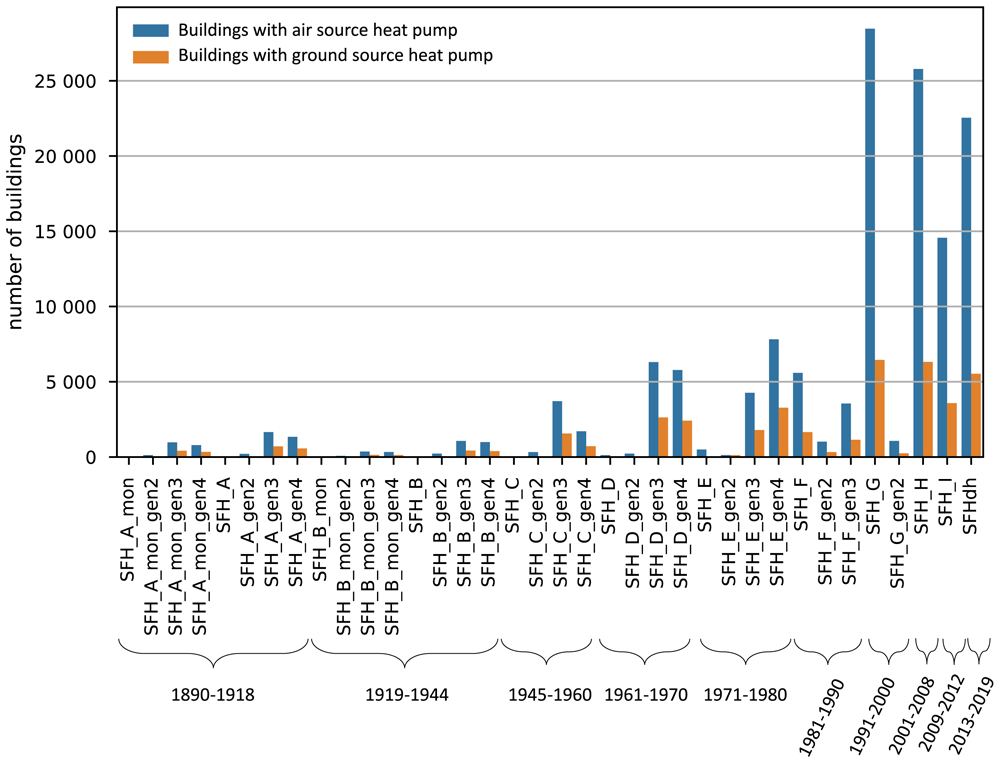
Figure 3. Number of buildings with HPs ins the Austrian SFH building stock11.
Electricity price scenarios
The electricity price is the driving factor of the energy cost minimization problem. Four different electricity profiles are investigated in this study to establish a relation between the volatility of the electricity price and the shifted load by the building. The first profile is Austria’s actual day-ahead electricity spot price 2021 from ENTSO-E6. A hypothetical fixed grid fee plus taxes of 20 cents/kWh are added in order to derive the related electricity retail price.
In future decarbonized electricity systems, a higher price variance on electricity spot markets is expected for systems with very high shares of renewable generation3. This is because of more hours with spot prices close to zero due to very high shares of renewable generation with low variable generation costs. In times of low renewable generation and high load on the other side, flexibility options at higher costs like dispatchable generation units, storage discharge, or import set the marginal price, which results in relatively high spot prices. The Austrian electricity system for 2030 is modeled with the bottom-up energy system model Balmorel9,10 to reflect such a decarbonized power system with higher price variance. The aim is to reflect various electricity market settings where different price patterns occur. We model three price scenarios to analyze sensitivities differing in the assumed CO2 price. The CO2 price influences the high-price hours when gas-fired units in this system define marginal costs. However, this could be any other flexibility option at a high price level in a different market setting. The hypothetical fixed grid fee plus taxes of 20cents/kWh are also added in order to derive the retail electricity price.
In Balmorel we model the Austrian electricity and district heat system as well as the neighboring countries Czech Republic, Germany, Hungary, Italy, and Slovenia to capture export and import dynamics. Installed generation capacities, national electricity demand, and net transfer capacities are based on the Ten-Year Network Development Plan (TYNDP) 2020 National Trends scenario7. For Austria, the assumptions are based on the national energy and climate plan WAM scenario8 and are refined to reflect the 100% renewable target (nationwide in annual balance terms) until 2030. That means that Austria meets its goals defined in the renewable expansion act31 and becomes a net exporter of electricity. The installed capacities in Austria for these simulations are depicted in Table 3 in the Annex. All electricity generated by natural gas is exported (on annual balance). The model with input parameters has been tested and validated in 32,33.
The resulting mean plus standard deviation for all price profiles are provided in Table 2. With an increasing CO2 price, the price profile’s mean value and volatility increase. All prices are depicted in Figure 4.
Table 2. Mean and standard deviation of the price scenarios and CO2 price as well as the number of local maxima in the profile.
Price
scenarios | mean
(cent/kWh) | CO2-price
(€/tCO2) | Number of
local maxima |
|---|
| Price 1 | 30.69 ± 7.76 | - | 1225 |
| Price 2 | 26.05 ± 2.27 | 53 | 621 |
| Price 3 | 28.87 ± 3.52 | 106 | 646 |
| Price 4 | 34.11 ± 6.35 | 212 | 618 |
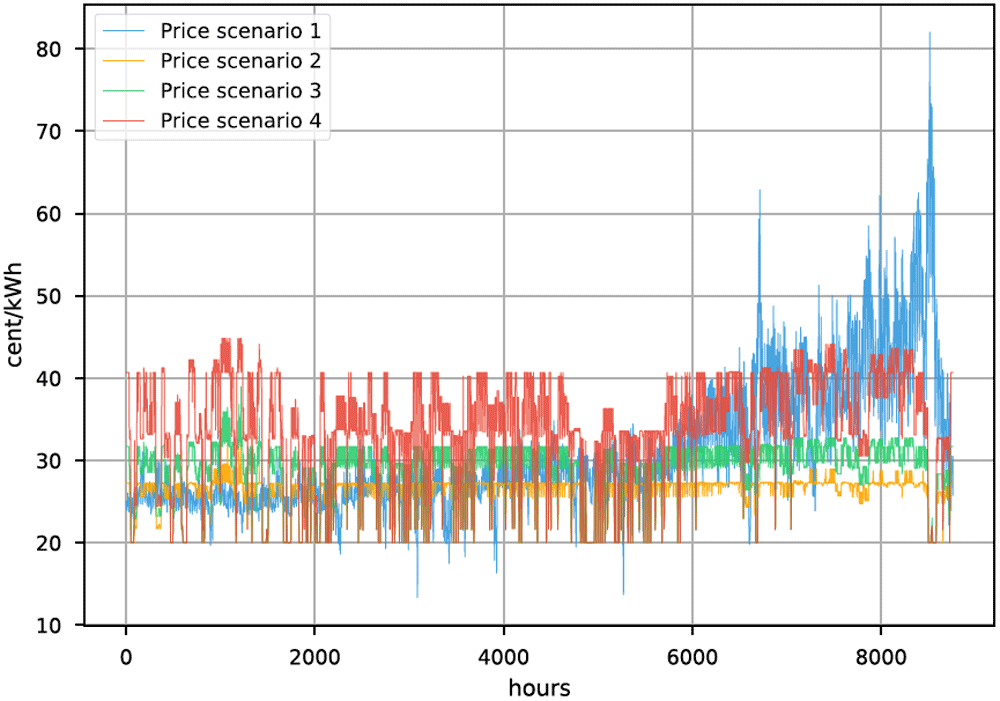
Figure 4. Electricity prices.
In Figure 5 the daily peak-to-peak amplitude difference of all four prices is visualized. The peak-to-peak difference in the day ahead price from 2021 increases drastically throughout the year. In the modelled prices for 2030 incisive events, like energy shortages, are not considered, thus the prices are not fluctuating that much throughout the year.
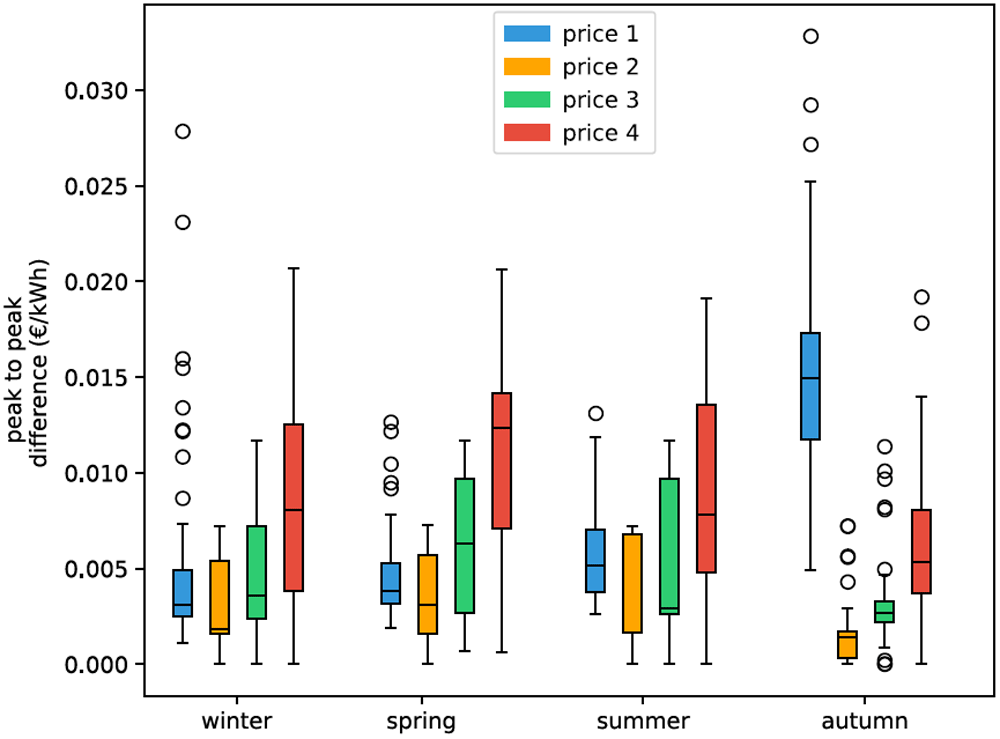
Figure 5. Box plots of seasonal effect in electricity price based on daily peak-to-peak amplitude difference.
Box plots show the median (horizontal line) and the interquartile range (IQR) (box outline). The whiskers extend from the hinge to the highest and lowest values within 1.5 × IQR of the hinge, and the points represent the outliers.
Another significant difference between the 2021 real time price and the simulated prices is the frequency of change. It is visible in Figure 4 that price 1 is changing more frequently than the others. Table 2 shows the number of local maxima in the respective price profiles. The price from 2021 has about twice as many peaks as the prices from 2030 (price 2, 3 and 4). In this work, we focus on volatility in terms of price spread. Structural price volatility in the form of higher frequency can also significantly impact the potential of load shifting. Studies showed that HPs could participate in the intra-day and even the frequency regulation market34,35. But in order to participate in the regulation market they need to be pooled in order to reach the necessary capacity36. In this study we do not consider participation of residential HPs other than the day ahead market. Thus price frequencies are limited to hourly changes. Although the thermal inertia of a building is slow, high frequency of price change generally results in higher cost savings for HPs if they react to the price signal.