Introduction
Polyurethane (PU) foams are one of the most broadly used materials for building insulation applications1,2. Their high mechanical strength and easy processing make rigid PU foams very suitable for different industrial applications, such as sandwich panels, where PU foams dominate the market3. Thanks to their low thermal conductivity and high durability, they may save more than 100 times the energy needed for its production during its 50 years lifetime, or more, in buildings4.
They can be easily made from a mixture of two liquids composed of polyols and isocyanates, in the presence of a gas-generating agent. Polyols and isocyanates react readily, in an exothermic way, to produce a polymeric solid with good mechanical and chemical resistance against aging and degradation due to atmospheric agents such as oxygen or humidity. The heat released by the exothermic reaction promotes gas evolution (evaporation of gas-generating agent) at the same time as polymer generation. This process is named physical foam generation and relies on the presence of a liquid of low boiling temperature, previously mixed with the polyol resin5,6. It results in the production of a multitude of very small bubbles (<0.5 mm) that remain trapped in the solid polymer, yielding a very lightweight foam structure: apparent density can reach values lower than 50 kg/m3. An alternative way of producing PU foams is so-called chemical foam generation; in this case, it is the presence of small amounts of water in the polyol mixture the cause of gas (carbon dioxide) evolution, since water is able to react with isocyanates to produce polyurea and carbon dioxide6.
Different conformations of foam can be generated according to the structure of the bubble network. In case of all (or most) foams in which bubbles are not connected with neighbouring ones, there is a closed cell structure: the foam is rigid (resistant to compression)4. However, in the case of interconnected bubbles (open cells), air can flow through the foam7, and the material becomes soft and easily compressible8.
PU foam structures have very low values of thermal conductivity, so they are performant materials as thermal insulators. Thermal conductivity used to be lower in the close cell (rigid) foams, making them the preferred option for thermal insulation4. On the other hand, open cell (soft) foams are superior as acoustic insulators8. PU foams are used extensively, therefore leading to huge amounts of waste generation. In Europe, PU foam plate consumption was more than 1.2 million tons in 2018 to fulfil market needs9 and the global demand of PU products is expected to rise to 22 million tons in 202010.
Usually, the foams applied in buildings are produced from fresh polyols and isocyanates, rendering a “pristine” foam, where no recycled materials are involved.
PU foam waste contributes to white pollution, affecting the living environment enormously. Moreover, because PU foam density is small, about 25–100 kg/m3, storage will take up a large area.
Construction and demolition waste (CDW) comprises the largest waste stream in the EU, with relatively stable amounts produced over time and high recovery rates, and many EU countries have already succeeded in establishing markets such as backfilling and low-grade recovery applications11. These materials may show different structures and could be used in different applications such as a possible acoustic absorber or as filler in polymeric matrices12.
Retrofitting or demolition of buildings generates important amounts of PU foam waste, which constitute a material that needs to be managed, taking into account the rapidly rising amounts of such wastes and the increasingly tight legislation on its final treatment or disposal13,14. Among the usual fates for these wastes, landfill accounts for a huge fraction, but due to environmental requirements, other ways for the end-of-life destination of PU foams will have to be implemented. Nowadays, procedures such as re-use and mechanical recycling, energy recovery, chemical and thermochemical recycling are being envisaged15,16. Physical recycling methods include regrinding, rebinding, adhesive pressing, injection moulding, and compression moulding, while the most common chemical methods are hydrolysis, aminolysis, and glycolysis17,18.
The goal of this work is to explore the possibilities of incorporating those PU foam wastes as recycled material in pristine PU foam formulations. The approach is to convert the PU foam wastes into a powder that can be added as a filler to the new PU foam formulations in percentages as high as possible, without hindering the foam generation process and keeping (or improving) the mechanical and insulating properties of the pristine foam. The first advantage of the new formulations would be the revalorization of PU foam from CDW, in such a way that the volumes of these wastes will be reduced. On the other hand, substituting a part of the pristine raw materials in the foam formulation for these recycled fractions could improve the economic balance of the foam production process and eventually boost the performance of the foams.
Two different types of PU foams were selected as base materials to study the addition of recycled PU foam powder: one rigid foam intended for thermal insulation, and one soft foam, suited for acoustic insulation. Different percentages of recycled PU foam (from demolition wastes that were milled into powder) were added to the formulations, and the effect on mechanical and thermal conductivity properties were measured and compared.
Methods
Materials and foam preparation
Pristine rigid PU foam was produced by the two components reaction (A+B) of commercial resin “Espuma de Poliuretano de Colada de Baja Densidad, 35 kg/m3” (casting low density polyurethene foam) from Resinas Castro, S.L (Porriño, Spain). Component A was a mixture of polyols with catalysts, fireproof agents and foaming agents (liquids of low boiling point, not harmful for the stratospheric ozone layer depletion, which vaporize due to the heat released in the exothermic reaction of PU synthesis). Component B was diphenyl methane di-isocyanate (MDI) with a molecular weight of 250 g/mol.
Pristine soft PU foam was produced by the two components reaction (A+B) of commercial resin “Phono Spray I-905”, from Synthesia Technology (Spain). Component A for soft PUs was a mixture of polyols with catalysts, fireproof agents and foaming agents and component B was diphenyl methane di-isocyanate.
The mixture of the two components A/B, at a weight ratio of 100/115 for rigid foam and 100/110 for soft foam, resulted in the generation of foams based on gas bubbles trapped within the PU matrix. The two components of the foams (polyols and isocyanate) were quickly mixed with a mechanical stirrer, at 1000 rpm for 10 seconds, and immediately poured into a closed mould, where the foam built-up, to produce foam plates at the desired shape and size. Rigid foams contained over 90% closed cells and soft foams contained less than 10%, according to the producer information.
Recycled PU rigid foams from CDW of roof panels supplied by NR-GIA Budownictwo sp z o o (Lublin, Poland) were used as reinforcing materials (Figure 1) after being milled into a powder of 50–300 micron particles (Figure 2). A Universal Cutting Mill, operating at 3000 rpm (Pulverisette 19, FRITSCH) able to mill PU foam blocks into sub-millimeter powder was used for this purpose.
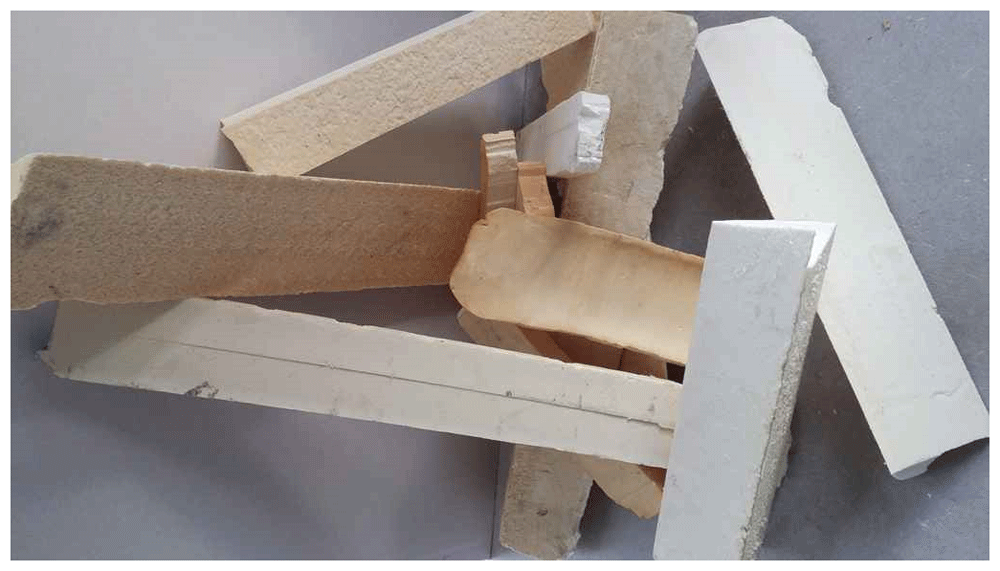
Figure 1. Blocks of rigid polyurethane foams from construction and demolition waste.
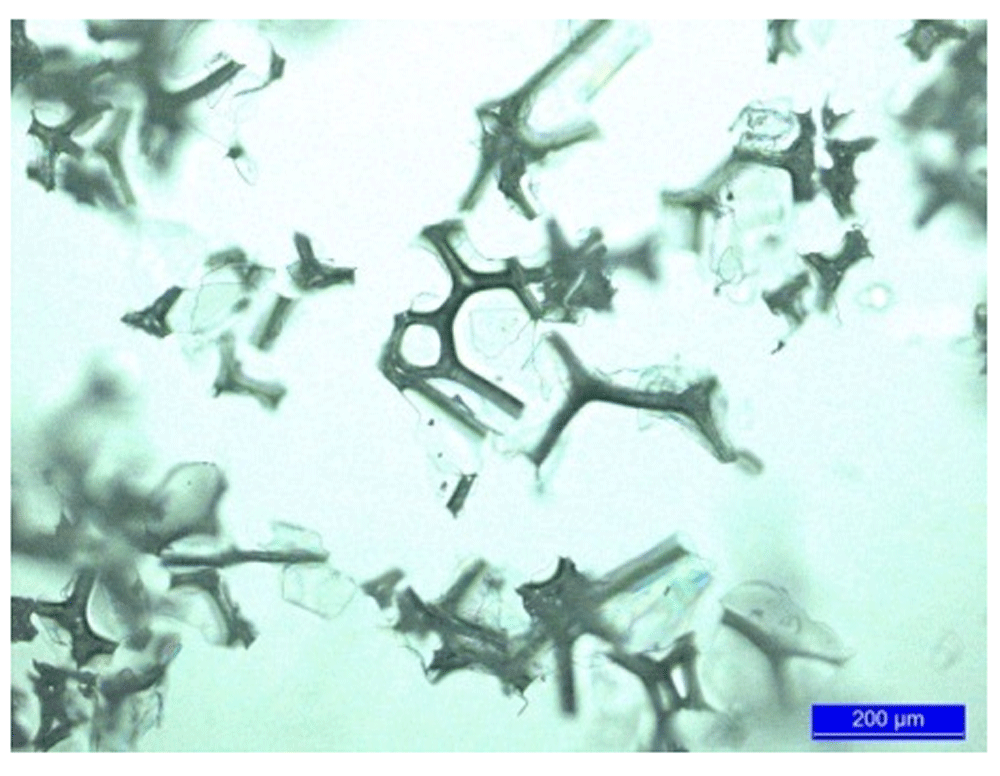
Figure 2. Micrograph of polyurethane foam powder from construction and demolition waste.
Foam plates of 300 mm x 300 mm x 30 mm were produced in a closed aluminium mould, using the amount of foaming mixture needed to fill the mould. The amount of foaming mixture was previously calculated to achieve the characteristic density of each foam formulation in the given volume. Foams were allowed to cure for 12 hours at room temperature before opening the mould.
In the case of formulations modified with PU foam powder from CDW, different amounts of this filler were homogeneously mixed with component A of the resin before adding component B. The filler content varied from low levels (1.5 wt%, aimed to minimize the interference with foam evolution) until the maximum filler content acceptable for a good foam evolution.
Microscopy
Microscopy images were obtained with an Optical Microscope LEICA DM4000M, and registered with a digital camera LEICA DFC 420C, 5 M pixel resolution.
Fourier transform infrared analysis
Fourier transform infrared (FTIR) spectra of powdered waste PU and PU foams were collected using a JASCO FT/IR-4100 (Easton, MD, USA) spectrometer in the range of 4000–400 cm−1 and 32 scans at a spectral resolution of 1 cm−1. In this device, the solids to be analysed are directly applied onto the scanning window, and no pre-treatments were required.
Density measurements
Mean density of foams were determined by the weight/volume ratio of each foam plate. Different foams samples were weighted in a calibrated precision balance (KERN, Model PCB 2500–2), and the mean volume was calculated for the length, width and height of the prismatic samples, measured with a calibrated calliper.
Viscosity measurements
Viscosity measurement of component A of the resins (mixture of polyols), both in their original form, and added with different percentages of PU foam powder from CDW, were performed with a TA Instruments AR200ex rheometer.
Mechanical characterization
Compression strength of foams was determined using a universal testing machine model 3365 (Instron, Norwood, MA, USA) equipped with a 1 KN loading cell and controlled by Bluehill Lite software developed by Instron. Compression properties of foams were determined according to the UNE-EN ISO 604 standard19, with square prism samples of 25 mm x 25 mm x 30 mm, and a crosshead speed of 2 mm/min. Accordingly with that standard, and taking into account the current samples’ geometry, the values of the compression test are meaningful only within the 0–27% range of deformation. Compression strength values at 10% and 25% deformation were recorded. The number of tested specimens for the mechanical properties was five for the average calculations.
Thermal conductivity measurements
Thermal conductivity (Lambda, λ) was measured with a Fox 200 thermal conductivity meter (TA Instruments, New Castle, Delaware, USA). The steady-state heat flux through the 204 x 204 x 51 mm plate specimens (specifically made in the dimension required for this test), was measured for a temperature gradient of 10°C between the upper and the lower face of the sample. Before measurement, the samples were left for 12 h at 80°C, and after, placed in a dry chamber for cooling for 30 min. Three measurements for each specimen were obtained for evaluation of the thermal conductivity.
Results and discussion
Formulation of novel foams based on recycled PU foam powder (from CDW)
Rigid PU foam. Pristine rigid PU foam was successfully obtained in the mould, following the recipe established by the resin supplier. For mechanical characterization purposes, PU plates of 300 mm x 300 mm x 30 mm in size were obtained, with an apparent density of 51.6 kg/m3.
When PU foam powder from CDW, even at percentages below 2 wt%, was added to the reacting mixture as a filler, a significant increase in the viscosity of the foam forming mixture was observed. The rise of viscosity induced by the presence of the filler interfered with the activity of the foaming agents in the resin, so that the evolving foam was not able to fill the whole mould cavity. In order to boost the foaming power of the mixture, a part of water, along with the equivalent amount of extra isocyanate was added. This idea is based on the ability to produce carbon dioxide gas as a product after the reaction between water and isocyanate groups (NCO), following [1] and [2]:
R-NCO + H2O → R-NH2 + CO2 [1]
R-NH2 + R-NCO → R-NH-CO-NH-R [2]
Each mole of water promoted the reaction of two moles of isocyanate groups, generating one mole of carbon dioxide (gas).
The isocyanate groups in this reaction were from methylene diphenyl diisocyanate (MDI). Each mole of MDI has two moles of isocyanate (–NCO) functional groups. According to the resin supplier, the commercial product is 31% free isocyanate, which implies a purity of 92.3%. Each gram of water, which corresponds to 0.0555 moles, reacts with 4.666 g of isocyanate groups. This corresponds to 15.052 g of commercial product (31% isocyanate).
In order to determine the ideal amount of water that should be added to boost the foam evolution and to completely fill the mould cavity, different amounts of water were added. Three plates of rigid PU foam were produced, with 0.2 wt%, 0.5 wt% and 0.8 wt% of water, respectively. These amounts of added water were increased stepwise, from a low value (0.2 wt%), until the minimum value to properly boost the foam evolution in the mould (0.8 wt%), was reached. For each case the required additional amount of isocyanate was added to the formulation. Moreover, 1.5 wt% of PU foam powder was added to all these formulations.
This set of experiments showed that 0.8 wt% of water was needed to achieve enough foaming power and to fill the mould cavity, as was observed after the mould was opened. The resulting foam had an apparent density of 42.2 kg/m3.
After the formulation with optimal foaming power was determined, PU foam powder from CDW in the range from 1.5 wt% to 10 wt% was added to the pristine foam (Table 1). It was found that 6 wt% was the highest filler content that allowed good foam evolution. Figure 3a shows a plate of rigid foam perfectly formed, with 3% of the recycled foams coming from CDW. Foam plates with higher filler content than 6 wt% resulted in incomplete and unsuitable PU foam plates (Figure 3b). Apparent density of foams with 1.5–6 wt% CDW PU foam powder ranged between 42.2 – 44.4 kg/m3 (Table 1).
Table 1. Composition (%) of rigid polyurethane foam formulations and apparent density of the resulting foam.
| RPUF 0 | RPUF 1.5 | RPUF 3.0 | RPUF 4.5 | RPUF 6.0 | RPUF 10 |
|---|
| Component A | 46.52 | 39.90 | 39.30 | 38.70 | 38.09 | 36.48 |
| Component B | 53.48 | 57.80 | 56.92 | 56.03 | 55.15 | 52.79 |
| Water | 0 | 0.80 | 0.78 | 0.77 | 0.76 | 0.73 |
| CDW PU foam powder | 0 | 1.50 | 3.00 | 4.50 | 6.00 | 10.00 |
| Apparent density of foam (kg/m3) | 51.6 | 42.2 | 44.4 | 43.6 | 43.5 | (*) |
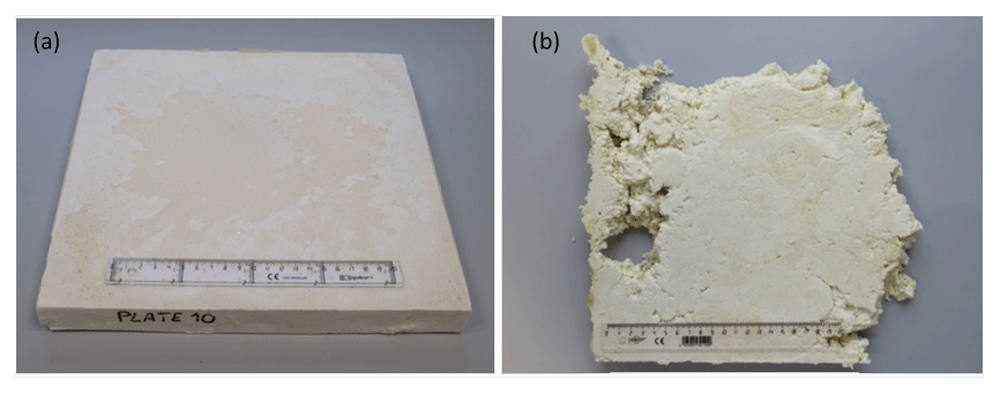
Figure 3.
(a) Plates of rigid polyurethane foams with 3 wt% and (b) 10 wt% of recycled polyurethane foam powder.
Soft PU foam. Pristine soft PU foams were successfully obtained in the mould, following the recipe stablished by the resin supplier. A plate of 300 mm x 300 mm x 30 mm in size was obtained with an apparent density of 23.1 kg/m3.
Addition of low percentages of PU foam powder from CDW in soft foam forming mixtures did not interfere with the foam evolution process. Therefore, for the manufacturing of soft PU foams, no extra water was needed to maintain the foaming power. Different amounts of PU foam powder from CDW (between 1.5 wt% and 6 wt%) were added to find the upper limit (Table 2).
Table 2. Composition (%) of soft polyurethane foam formulations and apparent density of the resulting foam.
| SPUF 0 | SPUF 1.5 | SPUF 3.0 | SPUF 4.5 | SPUF 6.0 |
|---|
| Component A | 47.62 | 46.91 | 46.21 | 45.48 | 44.77 |
| Component B | 52.38 | 51.59 | 50.79 | 50.02 | 49.23 |
CDW PU foam
powder | 0 | 1.50 | 3.00 | 4.50 | 6.00 |
| Apparent density of foam (kg/m3) | 23.1 | 24.7 | 26.9 | 26.6 | (*) |
The upper limit was found to be at 4.5% (see Figure 4). With a higher percentage of recycled PU, the mixture was too viscous for the foam to completely fill the mould cavity (Figure 4). Apparent density of soft foams (Table 2) with 1.5 - 4.5 wt% of PU foam powder from CDW ranged between 24.6 – 26.9 kg/m3.
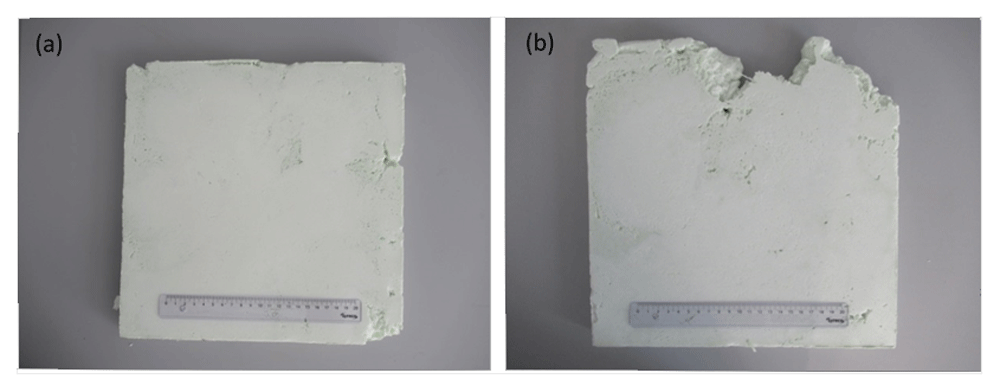
Figure 4.
(a) Plates of soft polyurethane foam reinforced with 4.5 wt% and (b) 6 wt% of polyurethane foam powder from construction and demolition waste.
FTIR characterization of waste powdered PU and PU foams
In Figure 5 the FTIR spectra of the pristine rigid (upper) and soft (middle) foams, and the ground PU foam from CDW (bottom) are depicted. The curves show the characteristic NH, CH, CO, CN and COC bands of a PU foam, demonstrating the chemical nature of the recycled sample.
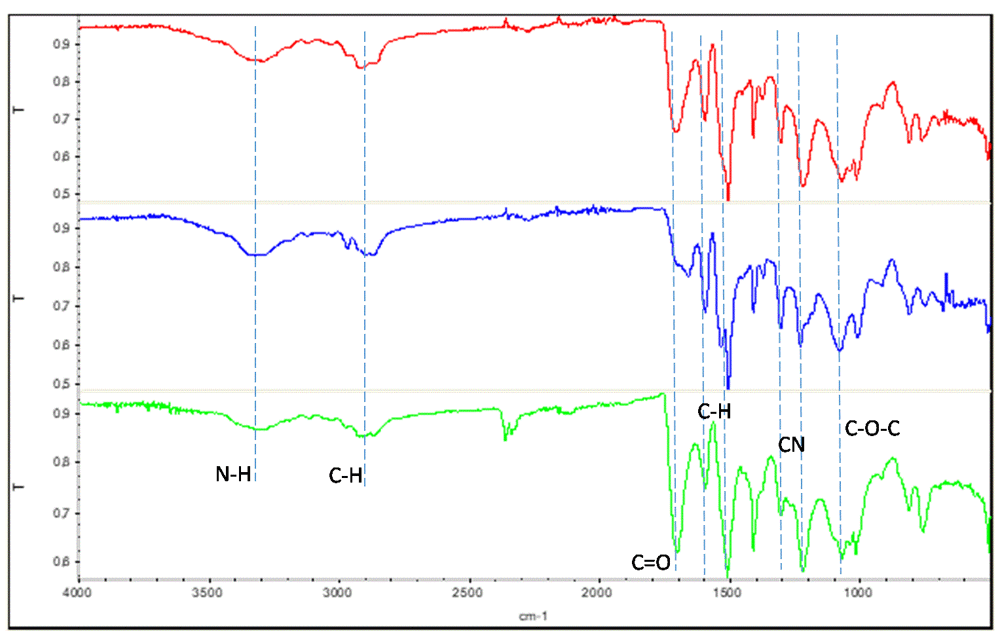
Figure 5. Fourier transform infrared spectroscopy of the rigid polyurethane foam (upper), soft polyurethane foam (middle) and polyurethane foam from construction and demolition waste (bottom).
Viscosity measurements
Viscosity measurement of component A of the resins (mixture of polyols), both in their original form, and added with different percentages of PU foam powder coming from CDW are summarized in the following Table 3 and Table 4. Data reveal a strong increase of viscosity as effect of increasing filler addition.
Table 3. Viscosity of component A for rigid foams (resin from Resinas CASTRO S.L.), added with different percentages of PU foam powder from CDW.
| % CDW PU foam powder | 0 | 1.50 | 3.00 | 4.50 | 6.00 |
|---|
| Viscosity (Pa·s) | 0.78 | 5.59 | 48.8 | 136 | 422 |
Table 4. Viscosity of component A for soft foams (resin “Phono Spray I-905”, from Synthesia Technology), added with different percentages of PU foam powder from CDW.
| % CDW PU foam powder | 0 | 1.50 | 3.00 | 4.50 | 6.00 |
|---|
| Viscosity (Pa·s) | 0.26 | 3.29 | 20.5 | 96.7 | 191 |
Mechanical characterization: compression strength
Rigid PU foams. A pristine rigid PU foam, and rigid PU foams modified with PU foam powder from CDW, added at different levels ranging from 0 wt% to 6 wt%, were subjected to the compression test. Values of strength at 10% and 25% of foam deformation were taken as a reference for comparison between different foam samples. Table 5 summarizes the results of compression strength (Em) tests for rigid PU foams.
Table 5. Compression strength (Em) of rigid PU foams with different amounts of PU foam powder from CDW.
| Sample | CDW PU foam powder
(wt %) | Em (KPa) at 10%
deformation | Em (KPa) at 25%
deformation |
|---|
| RPUF 0 | 0 | 123.7 | 213.5 |
| RPUF 1.5 | 1.5 | 88.4 | 176.0 |
| RPUF 3.0 | 3.0 | 79.3 | 173.0 |
| RPUF 4.5 | 4.5 | 67.6 | 130.3 |
| RPUF 6.0 | 6.0 | 62.5 | 149.7 |
Compression strength values taken at 10% deformation showed that addition of recycled PU foam powder led to a significant reduction in compression strength, resulting in a reduction of 29% to 49% when the added amount of milled PU foam varied from 1.5 to 6 wt%, respectively. Measurements taken at 25% deformation also resulted in reductions of compression strength, but in this case reductions ranged only from 18% to 39% when PU CDW varied from 1.5 to 6 wt%, respectively. In the formulation of these types of foams, the particles of PU powder can disturb to some extent the formation of the closed foam structure, which would result in a significant loss of compression resistance.
Soft PU foams. Soft PU foams were subjected to the compression test. The specimens were crushed between the plates of the testing device, the compression strength was continuously recorded against deformation, and values of strength at 10% and 25% of sample deformation were taken as reference for comparison between different PU foams. Table 6 summarizes the results of compression characterization for soft PU foams.
Table 6. Compression characterization of soft PU foams, with different amounts of PU foam powder from CDW.
| Sample | CDW PU foam powder
(wt %) | Em (KPa) at 10%
deformation | Em (KPa) at 25%
deformation |
|---|
| SPUF 0 | 0 | 12.2 | 17.4 |
| SPUF 1.5 | 1.5 | 14.8 | 24.5 |
| SPUF 3.0 | 3.0 | 11.3 | 20.1 |
| SPUF 4.5 | 4.5 | 13.2 | 23.0 |
Compression strength values taken at 10% deformation showed no significant variation related to the percentage of filler. However, Em values obtained at 25% deformation showed an increase of around 15%–40% in compression strength for the modified foams compared to the pristine foam. The presence of CDW PU foam acting as a reinforcing material could contribute to an increase in compressive resistance.
Thermal conductivity
Thermal conductivity is a crucial parameter for the characterization of a thermal insulating material, and for the design of parts made from it. Thermal conductivity should be as low as possible to get the best insulating performance.
Rigid PU foams. Plates of rigid PU foam with different percentages of PU foam powder (from CDW), ranging from 0% to 4.5%, were subjected to thermal conductivity measurement. Results are shown in Figure 6.
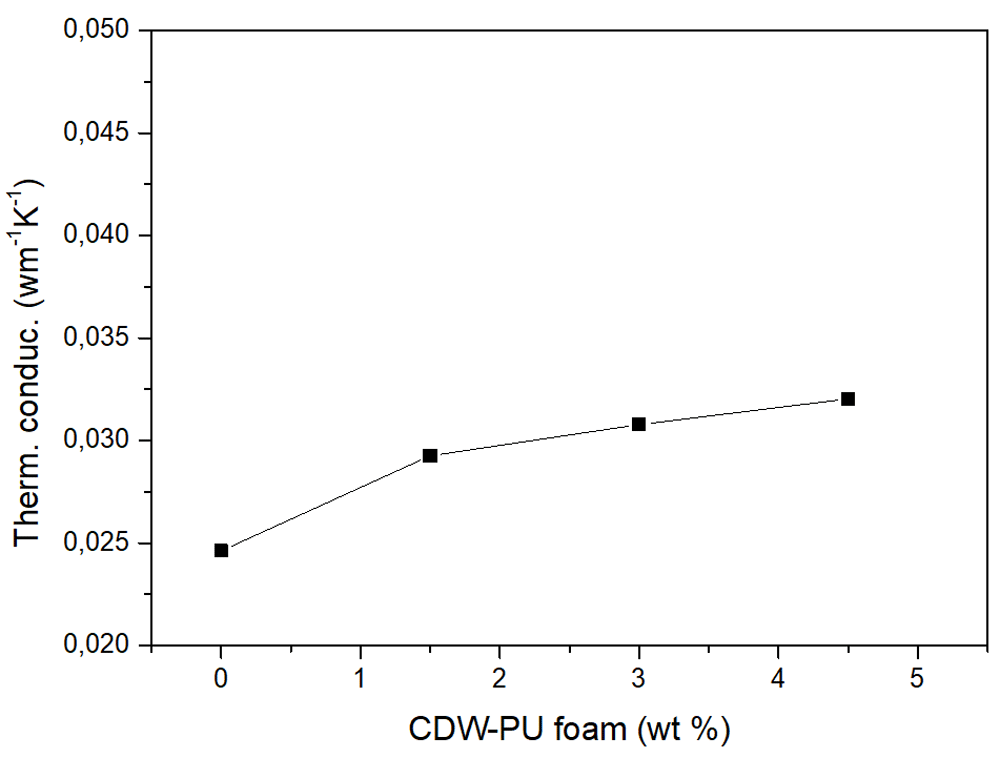
Figure 6. Thermal conductivity vs. construction demolition waste foam addition to rigid polyurethane foam.
The pristine foam has a thermal conductivity of 0.02462 W/mK. Addition of PU foam powder from CDW resulted in a considerable increase in the thermal conductivity, reaching a value of 0.029 W/mK with 1.5% addition and a value of 0.032 W/mK with 4.5% of addition. However, the slope of the curve was moderated as CDW-PU content was increased. As resultant, it is shown that recycled PU foam powder as a filler shows negative effects on the thermal insulating performance of rigid foams.
Soft PU foams. Plates of soft PU foam modified with different percentages of PU foam powder (from CDW), ranging from 0% to 4.5%, were subjected to thermal conductivity measurement. Results are shown in Figure 7.
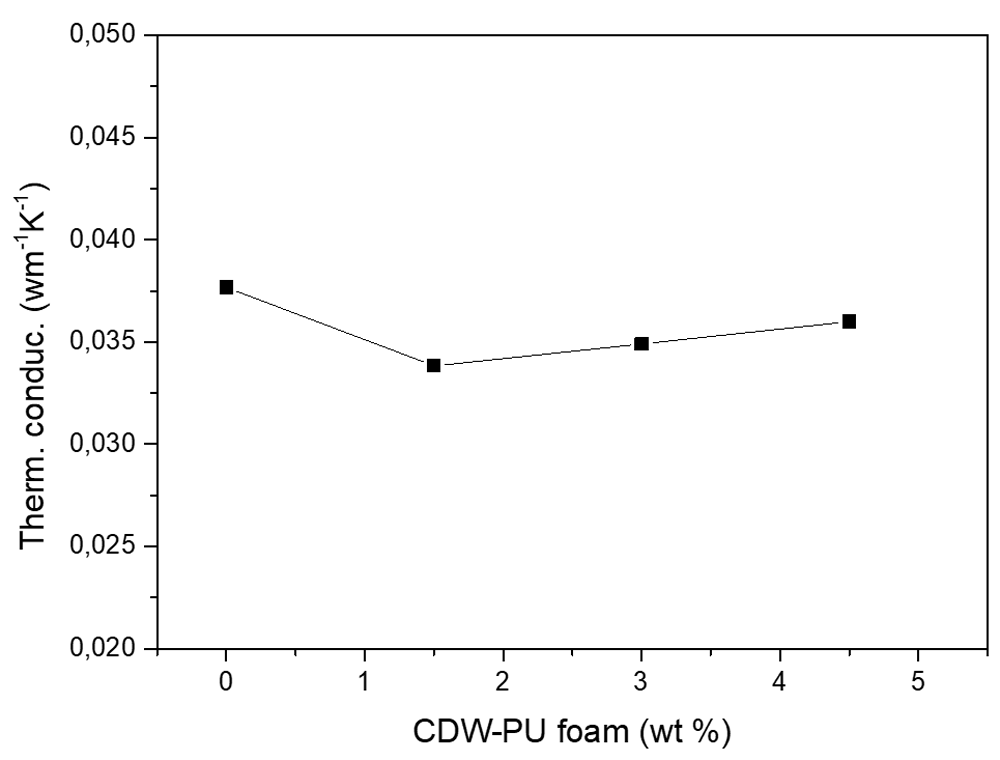
Figure 7. Thermal conductivity vs. construction demolition waste foam addition to soft polyurethane foam.
The pristine foam has a thermal conductivity of 0.03767 W/mK. Addition of 1.5% PU foam powder from CDW results in a 10% reduction in thermal conductivity; however, this reduction is less (7.3% and 4.4%) for higher percentages of filler (3% and 4.5%, respectively).
This reduction in thermal conductivity caused by the addition of recycled PU foam powder, reaching its maximum effect with addition of around 1.5% (weight), could have a potential application in insulation, when soft PU foam is used for acoustic insulation purposes. This kind of soft PU foam has relatively poor thermal insulation compared with the rigid foam counterparts, but the formula modification studied here could contribute to increasing its thermal insulation capacity to approach that of the rigid PU foams usually employed.
Conclusions
Rigid PU foams (extensively used as thermal insulating material for buildings), and soft PU foams (used as acoustic insulating materials) were modified with a powdery filler of PU foams from CDW. The aim of this work was to search for a way to reduce the volume of such wastes, using them as recycled materials, and to reduce at the same time the use of fresh resins for the production of insulating foams. These purposes should be achieved without losing the properties of pristine foams (mechanical resistance and low thermal conductivity), or even improving them.
PU foam characterization included compression strength and thermal conductivity.
Recycled PU foam powder was successfully added up to 6 wt% (in rigid foams) and 4.5 wt% (in soft foams); higher additions resulted in poor evolution of the foam, and hence, defective plates were obtained.
Regarding the effect of this filler on mechanical properties, measurements of compression strength (Em) taken at 25% deformation showed a loss of 18% to 39% in modified rigid PU foams, and an increase of 15% to 40 % in modified soft PU foams, compared to the pristine foams.
Concerning thermal conductivity, pristine rigid PU foam showed a value of 0.02462 Wm-1K-1, but even the addition of recycled PU foam at levels as low as 1.5 wt% resulted in an important increase in thermal conductivity (0.02925 Wm-1K-1), which is unacceptable from the point of view of foam thermal performance. On the other hand, in the case of modified soft PU foams, thermal conductivity reduced by 10% when 1.5 wt% recycled PU foam powder was added to the formula (however, increased addition led to a reduced improvement in that parameter). This procedure could contribute to reduce the thermal conductivity of pristine soft PU foam (0.03767 Wm-1K-1), which would be of interest for applications where thermal insulation matters.
Data availability
Underlying data
Zenodo: Sustainable insulating foams based on recycled polyurethanes from construction and demolition wastes. https://doi.org/10.5281/zenodo.571381920.
This project contains the following underlying data:
File of microscopy image of polyurethane foam powder from construction and demolition wastes:
Files of FTIR spectroscopy analysis for the rigid polyurethane foam, soft polyurethane foam and polyurethane foam from construction and demolition waste:
rigid PU foam_FTIR.txt
soft PU foam_FTIR.txt
PU foam CDW_FTIR.txt
Files of viscosity measurement for component A of resin for rigid foam, with different amount of filler:
Files of viscosity measurement for component A of resin for soft foam, with different amount of filler:
Files of compression test for rigid polyurethane foams:
RPUF00_compression_RawData (folder containing CSV files with results for specimens 1 – 11)
RPUF15_compression_RawData (folder containing CSV files with results for specimens 1 – 6)
RPUF30_compression_RawData (folder containing CSV files with results for specimens 1 – 6)
RPUF45_compression_RawData (folder containing CSV files with results for specimens 1 – 6)
RPUF60_compression_RawData (folder containing CSV files with results for specimens 1 – 6)
Files of compression test for soft polyurethane foams:
SPUF00_compression_RawData (folder containing CSV files with results for specimens 1 – 6)
SPUF15_compression_RawData (folder containing CSV files with results for specimens 1 – 6)
SPUF30_compression_RawData (folder containing CSV files with results for specimens 1 – 6)
SPUF45_compression_RawData (folder containing CSV files with results for specimens 1 – 6)
Files of thermal conductivity measurement for rigid polyurethane foams:
RPUF00_thermal conductivity.xlsx
RPUF15_thermal conductivity.xlsx
RPUF30_thermal conductivity.xlsx
RPUF45_thermal conductivity.xlsx
Files of thermal conductivity measurement for soft polyurethane foams:
SPUF00_thermal conductivity.xlsx
SPUF15_thermal conductivity.xlsx
SPUF30_thermal conductivity.xlsx
SPUF45_thermal conductivity.xlsx
Data are available under the terms of the Creative Commons Attribution 4.0 International license (CC-BY 4.0).