Plain language summary
Cancer cells spreading from their original location and attaching to the blood vessel lining is a crucial step in cancer progression and formation of new tumors in other parts of the body, the metastasis. Cancer cell attachment to the endothelial cells, lining the blood vessels, is called adhesion. Adhesion plays a critical role in cancer progression and the formation of metastases, however studying this process is difficult because it is hard to observe in living organisms.
To overcome these challenges, we have developed a new method to study how cancer cells adhere to endothelial cells under conditions that mimic blood flow, and to analyse the genes expressed in each cell involved in this process using a technique called single-cell RNA sequencing.
We used cancer cells derived directly from patients and human endothelial cells to create a model system that mimicked the flow of blood and used a high-powered microscope to observe the cells in real-time to observe the interactions between the cells. We also developed a method to retrieve the cells from the experiment, to analyze their genetic information to understand the process of adhesion.
This new method provides a tool to identify possible new targets for personalized treatments to prevent or treat breast cancer metastasis.
Introduction
Metastasis formation and progression involve a complex multi-step process, including tumour cell invasion of the surrounding tissue at the primary site, entry into the bloodstream, and adhesion to the endothelial cells lining the blood vessels1,2. Here, single or cluster circulating tumour cells (CTCs) may arrest and extravasate to colonise a secondary organ and form micro- to macro-metastasis3,4. The dynamic interaction of CTCs to endothelial cells take place under the shear-stress generated by hemodynamic forces of the blood flow, crucial for cell arrest, adhesion and extravasation5–7, as well for their selection and survival8. However, our knowledge of underlying mechanisms is limited, mainly due to the intrinsic difficulties to study these events in animal models or patients9,10.
Breast cancer is the most common cancer in women worldwide and possesses a high propensity to form metastasis, the leading cause of cancer-related deaths11,12. Breast cancer is characterised by a high grade of intra-tumour biological heterogeneity, that can be enhanced during the disease progression upon selective pressures dictated by different microenvironments inducing cell plasticity that promote, among others, transcriptional changes13–15. Circulating tumour cells (CTCs) in the blood circulation need to adapt, survive and eventually adhere to the endothelial cells to form metastasis. Both the molecular mechanisms and the transcriptional properties or changes of the cell involved in firm adhesion have not been not fully elucidated yet.
Current therapeutic strategies to treat the metastatic disease are unsatisfactory, and largely based on the targeting of mechanisms responsible for tumour growth or maintenance. Prevention of metastasis formation and spreading, as in the adjuvant clinical setting, represents an alternative strategy to reduce cancer mortality, by targeting the different steps associated with the metastatic cascade, including circulating tumour cells (CTCs)12,16.
A number of emerging technologies, including human in vitro models, microfluidics and single-cell –OMICs, may enable the deconvolution of the molecular and cellular steps of the CTC-endothelial cell interactions, offering the unique opportunity to identify specific targets of early steps of the disease progression.
Here, we describe a method to study firm adhesion of patient-derived xenografts (PDX) breast cancer cells to human primary endothelial cells under shear stress at single-cell transcriptomic level. We freshly isolated and purified cancer cells from a breast cancer-derived PDX tumour growth in NSG immune deficient mice to study shear resistant adhesion to endothelial cells using a microfluidic system coupled to high-content time lapse live-cell imaging, which allows behavioural visualisation and quantification of cells. Moreover, this system enables endothelial and firmly adhered cancer cells retrieval and enrichment for single-cell RNAseq analyses. We setup the workflow for cancer cell fresh isolation, adhesion, enrichment and single-cell RNAseq sample load in a time-frame of 6 to 8 hours, obtaining high quality single-cell transcriptomic data. Here we report three single-cell RNAseq samples obtained from one PDX-tumour. The method here described is flexible as it can be adapted to different tumour types and endothelial cells from different districts for studies aimed to study cell-cell interaction under shear stress of primary human cells at single-cell level. This method can be applied to identify therapeutic targets for clinical treatments to prevent cancer cell adhesion in the context of breast cancer metastasis. Furthermore, the possibility to use patient-derived cancer cells using the PDX17 can help identify specific biomarkers fundamental to develop personalised treatments for breast cancer metastasis formation.
Methods
Ethical considerations
Investigations have been conducted in accordance with the ethical standards and according to National and International guidelines. In vivo studies were performed in the authorised Cogentech animal facility, after approval notification of the experiments by the Ministry of Health (as required by the Italian Law) (IACUCs n° 679/2020-PR approved by the Italian Ministry of Health on the 10/07/2020). Human tissue biopsies were collected from patients whose informed consent was obtained in writing and deposited in the European Institute of Oncology (IEO) Biobank for Translational Medicine (B4MED) according to the policies of the Ethics Committee of the European Institute of Oncology (n. R663-IEO S706/312) and regulations of Italian Ministry of Health. The IEO informed consent (IC) specifically named the Participation Pact (PP), for its tissue bank called the IEO Biobank and Biomolecular Resource Infrastructure (IBBRI). The PP for research bio banking stipulates that the gathered specimen may be utilized for specific research, for general research purposes or in future research for which objectives are as yet unknown18. The studies were conducted in full compliance with the Declaration of Helsinki. All efforts were made to ameliorate harm to the animals. A comprehensive and ethically driven approach was taken to ensure the welfare of mice during the expansion of patient-derived xenografts (PDX), including thorough ethical evaluations, regulatory compliance, and expert oversight. The mice were provided with proper housing, enrichment, and measures to minimize pain and distress. Continuous monitoring and review processes were implemented to minimize harm, reflecting a commitment to upholding the highest standards of animal welfare.
PDX propagation
PDX MBC26 (Luminal B) is part of a collection of breast cancer PDXs previously generated at IEO19. Briefly, patients enrolled in the study were selected on the basis of highly aggressive breast metastatic disease diagnoses. Biopsy in Matrigel (Corning #356231) was directly orthotopically transplanted in the fourth mammary gland of female NOD/scid IL-2Rg(null) (NSG, in-house breeding) mice, the equivalent organ from which the cancer originated. The model was further propagated by directly re-transplanting MBC26 tumor cells, which were obtained from the digestion of engrafted masses, or by freezing the cells for future use19,20. For this work, a frozen vial of PDX MBC26 cells (Passage 3) was rapidly thawed and live cells counted using Trypan blue 0.4% (Gibco, 15250061). A total of 5×10⁵ viable PDX MBC26 cells were resuspended in a 1:1 mixture of phosphate buffered saline (PBS, Gibco, 14040133) and growth-factor-reduced Matrigel (Corning #356231) in 30µl final volume and kept at 4°C. To minimize pain, suffering and distress an 8 week-old female NSG mouse, acclimatised for 5 days, was anesthetized using 3% isoflurane gas anaesthesia. The PDX MBC26 cells, loaded in a Hamilton glass syringe, were then injected in the fourth mammary gland of the female NSG mouse to propagate the tumour.
In vivo study
The female NSG mouse was kept in an experimental unit of five animals in total. Mice were monitored weekly for i) sign of pain, suffering and distress ii) presence of ulcers in the injection area iii) weight loss, and PDX tumours were measured. No adverse or unexpected adverse events took place during the PDX propagation. Tumour volume was calculated with the formula: V = (L × l2)/2 (L length; l width), when a volume of 1.2 cm3 was reached, the tumour was excised after mouse sacrifice (standard CO2 inhalation), placing the mouse in a transparent induction chamber and exposing the animal to increasing and controlled concentration of CO2 (33% in one minute) for five minutes until it became unconscious and passed away, to provide a rapid, painless, stress-free death. Tumour (n=1) was placed and maintained in PBS at 4°C until processed for dissociation to a single-cell suspension (~ 30 minutes).
PDX tumour dissociation into a single-cell suspension
The freshly isolated PDX MBC26 tumour was processed with the tumour dissociation Kit human (Miltenyi Biotech 130-095-929) following the manufacturer protocol for tough tissue, in a BSL2 tissue culture hood. Briefly, the tumour was placed on a petri dish and dissociated with scalpel and scissors into small pieces (2–4 mm), transferred into gentleMACs C Tube with a mix of enzymes (200 μl H, 100 ul R, 25 μl A in 4.7mL of DMEM/sample) (Euroclone, ECM0103L), and placed in the gentleMACs Octo dissociator (Miltenyi Biotech) for 1 h (program 37C_h_TDK_3). The dissociated samples were filtrated (70 µm) washed with 20 ml of DMEM, counted and centrifuged at 300×g for 7 minutes. The pellet was suspended in PBS (Gibco, 14040133), pH 7.2 with 0.5% bovine serum albumin (BSA, Sigma, A9418).
Human PDX tumour cells purification
PDX tumour dissociated to a single-cell suspension in PBS and BSA was enriched for human cells using the Mouse Cell Depletion Kit (Miltenyi Biotech, 130-104-694). Cells were incubated with Mouse Cell Depletion Cocktail for 15 minutes at 4°C and enriched by magnetic separation (quadroMACS) with LS columns (Miltenyi, 130-122-729). The flow-through was further enriched for tumour cells with the Tumour Cell Isolation Kit, human (Miltenyi Biotech, 130-108-339). Cells were centrifuged at 300×g for 7 minutes and incubated with Non-Tumour Cell Depletion Cocktail A and B, human for 15 minutes at 4°C and enriched by magnetic separation (quadroMACS) via LS columns. The flow-through was counted twice with Trypan blue 0.4% (Gibco, 15250061) and used for downstream assay.
Human PDX-derived tumour cell labelling for live-imaging
Enriched human PDX-derived tumour cells were stained with 12.5 μM CellTracker Green CMFDA dye (Thermo Fisher Scientific, C7025) following the manufacturer’s instructions, for 30 minutes at 37°C, 5% CO2 in serum free DMEM medium (Euroclone, ECM0103L) 1ml/1×106 cells. Cells were centrifuged at 300×g for 5 minutes and resuspended in endothelial complete medium at 2 × 10⁶ cells/ml for the flow-based adhesion assay.
Cell culture
Pooled (five donors) primary Human Umbilical Vein Endothelial Cells (HUVECs, Lonza, C2519A) were cultured (1–3 passages) on supports coated with 10 µg/ml fibronectin (Calbiochem, MerckMillipore, 341635-5MG) in endothelial cell basal medium-2 (EBM2) medium (Lonza, CC-3156) and supplemented with the following components (Lonza, CC-4147): 0.025% (v/v) rhEGF, 0.025% (v/v) VEGF, 0.025% (v/v) IGF, 0.1% (v/v) rhFGF, 0.1% (v/v) gentamycin, 0.1% (v/v) ascorbic acid, 0.04% (v/v) hydrocortisone and 2.5% (v/v) fetal bovine serum (FBS), hereafter referred to as endothelial complete medium (Lonza, CC-3202). All cells were maintained and/or cultured at 37°C, 5% CO2.
Flow-based adhesion assay coupled to live-cell imaging
A flow-based cancer cell adhesion assay to primary endothelial cells with time-lapse live imaging was adapted to the flow-based assay21. In detail, HUVECs cells were grown to confluence in Ibidi® μ-Slides VI0.4 (80606, Ibidi® GmbH, Martinstreid, Germany) channels and washes with complete medium were performed before the flow adhesion assay. The μ-Slide was positioned on the stage of an inverted time-lapse Leica DMi8 microscope (10x/0.32 NA PH1 dry) with a Leica DFC9000 GTC camera both with an environmentally controlled chamber (37°C, 5% CO2). CMFDA-labelled human PDX-derived tumour cells (2 × 10⁶ cells/ml), were flowed in HUVEC endothelial complete medium (pulled via a 10 ml Hamilton glass syringe coupled to a high precision pump, Harvard) through the μ-Slide channel at 0.1 dyn/cm2 for 5 min (accumulation time). The flow was then increased to 1 dyn/cm2 (venular vessel wall shear stress) for 30 s (challenge time) to remove cells that were not firmly attached to the EC. Cell-EC interactions were recorded in bright field and FITC channels (excitation, 495 nm; emission, 521 nm) 4 frames/sec (Leica). The movies were manually analysed counting firmly adhered cells on fluorescence images using Image J software and results plotted with Prism v.8 (GraphPad Software) (an open-access alternative that can perform an equivalent function is R or SigmaPlot). Firm human PDX-derived tumour cell adhesion was quantified from images of 10 different fields of view (1331.20x1331.20 µm; area=1.77 mm2) along the μ-Slide channel at the end of the assay, per technical replicate.
Post flow-based adhesion assay cell harvesting, separation and enrichment
Ibidi® μ-Slides VI0.4 with CMFDA-labelled human PDX-derived tumour cells firmly adhered to HUVEC monolayers in the channels were washed and very gently disconnected by the close microfluidic system via the μ-Slides in and out-lets. Channels were washed twice with warm PBS without Ca2+ and Mg2+, 120 μl of trypsin-EDTA (Euroclone, ECB3052D) per channel were added and incubated for 5 minutes at 37°C, 5% CO2 to detach all the cells. Endothelial complete medium was used to retrieve the cells from the μ-Slides channels (technical replicates) and pooled, then centrifuged at 300×g for 5 minutes. Cells were resuspended in PBS with 0.5% BSA buffer and incubated with the CD31 MicroBeads human (130-091-758, Miltenyi Biotech) for 15 minutes at 4°C and enriched by magnetic separation (quadroMACS) with LS columns to separate HUVECs by firmly adhered human PDX-derived tumour cells. Tumour cells were collected in the flow-through, while the magnetically labelled HUVECS where flushed out the column with a plunger (130-122-729, Miltenyi Biotech).
Flow cytometry
Cells were washed once with FACS buffer (PBS without Ca2+ or Mg2+, 1% BSA, 2 mM EDTA, 0.1% (w/v) NaN3) and immediately analysed on a BD™ FACS CELESTA flow cytometer coupled to BD™ High Throughput Sampler (HTS) unit (BD Biosciences). Results were analysed and plotted using FlowJo software (Tree Star, version 10.8.1) by the IEO flow cytometry unit.
HUVECs and PDX-derived tumour cells preparation for single-cell RNAseq
All cells (I. enriched firmly adhered tumour cells II. magnetically isolated HUVECs (T1Adh), III. human PDX-derived tumour cells (Tum1), IV. HUVECs (HUV1)) were manually counted twice with Trypan blue 0.4% (Gibco, 15250061), centrifuged at 300×g for 5 minutes and resuspended in ice-cold PBS without Ca2+ and Mg2+ at 1000 cells/µL. Samples from the flow-based adhesion assay were prepared as a mixture of 50:50 of tumour: HUVECs (I. enriched firmly adhered tumour cells, II. magnetically isolated HUVECs), while the inputs (III. human PDX-derived tumour cells (Tum1), IV. HUVECs (HUV1)) were maintained separated. The samples at single cell suspension were mixed with reverse transcription mix following the manufacturer Chromium Single-cell 3’ reagent kit protocol V3.1 (10x Genomics, Euroclone, 1000268) and loaded, together with gel beads and partitioning oil in the Single-Cell 3’ Chips (10x Genomics, Euroclone, 1000120) to generate single-cell beads-in-emulsion (GEMs), cDNAs were obtained, amplified and then fragmented. The gel beads are coated with unique primers with 10× cell barcodes (BC), unique molecular identifiers (UMI) and poly(dT) sequences. Finally, libraries were generated by incorporating adapters and sample indices compatible with Illumina sequencing and quantified Qubit (ThermoFisher Scientific). The size profiles of the sequencing libraries were examined by Agilent Bioanalyzer 2100 using a High Sensitivity DNA chip (Agilent). Two indexed libraries were equimolarly pooled and sequenced on Illumina NOVAseq 6000 Sequencing System using the v1.5 Kit (Illumina, 20028319) with a customised paired end, dual indexing (28/10/10/90-bp) format generating clusters. Clusters are imaged using bidirectional scanning and two-channel sequencing chemistry. The camera uses sensors that detect red and green light to image each swath and simultaneously generate red and green images of the whole swath. After imaging, base calling is performed for clusters within each tile based on the ratio of red to green signal for each cluster, which is based on location determined by the patterned flow cell. This process is repeated for each cycle of sequencing. A coverage of ~50.000 reads per cell was adopted for each sequencing run.
Single-cell RNAseq analysis
Pre-processing – The raw Illumina BCL files obtained from sequencing of the three samples were demultiplexed and converted to FASTQ format using the Illumina bcl2fastq software (v2.20.0.422). FastQC (v0.11.9) was used to evaluate the quality of sequenced reads. They were then aligned to the GRCh38 human reference genome using 10X Genomics Cell Ranger count (v6.1.1), exploiting the GENCODE gene set GTF file (v32, version: 2020-A) for the annotation of the genes. The program, which only includes reads which are confidently mapped, non-PCR duplicates, containing valid barcodes and UMIs, finally quantifies the expression of transcripts in each cell and generate the gene expression matrix of number of UMI for every cell and gene, which is the final output of the pre-processing part. All the further steps of the analysis were performed in R (v4.1.1) using the Seurat package (v4.0.5)22, unless otherwise specified.
Quality control (QC) and filtering of genes and cells – Each 10x library, henceforth referred to as ‘sample’, was individually quality checked, and cells were filtered to ensure good gene coverage, a consistent range of read counts and low numbers of mitochondrial reads, applying common quality metrics. More in detail: cells expressing fewer than 2,500 genes and more than 9,000 were filtered out; applying these filters on number of genes per cells, automatically restricts the range of number of UMIs per cell, therefore, also after visual inspection of the scatter plot of number of genes per cell by number of UMIs per cell, no further filters on UMIs per cell were applied (final average range 5,900 (± 710 SE) – 100,560 (± 8,460 SE)) (numbers rounded to the first 10). Additionally, cells with a “cell complexity” < 0.7 (the ratio between the log10 of number of genes per cell by the log10 of the number of UMIs per cell) and mitochondrial genes percentage > 30% were also excluded. The scDblFinder() algorithm (21) was then used to identify and filter out putative cell doublets. In addition, we removed any genes that were represented by less the five cells. The resulting three filtered samples were used to create the final Seurat object, which counts 16,287 single-cell profiles (7,569 for Sample1/Huv1; 4,128 for Sample2/Tum1 and 4,590 from Sample3/T1adh).
Normalisation, scaling and features selection – We used the Seurat function sctransform()23 (using the glmGamPoi method24, from the glmGamPoi package (v1.4.0)) with default parameters, to normalise and scale the counts and to identify the most variable genes (n=3,000), then used in the downstream part of the analysis.
Linear dimensional reduction and dimensionality identification – As frequently done in scRNAseq analysis, as the first step to reduce the dimensionality of the data set we performed a principal component analysis (PCA), computing the first 50 principal components (PCs) from highly variable genes computed in the previous step, with the function RunPCA() of Seurat.
Then, before clustering, to determine the dimensionality of our dataset, namely identifying the minimal number of PCs which explains the most of the variance of our data, we considered both the results of the i) intrinsic dimension estimation (attained with the maxLikGlobalDimEst() function, from the package intrinsicDimension (v1.2.0)) and ii) the visual inspection of the Elbow plot, where PCs are ranked based on the percentage of variance explained, and we finally decided to use the first 16 PCs for the next steps.
Clustering – To define clusters, we applied the Seurat graph-based clustering approach, by employing in sequence the functions FindNeighbors() (with dims = 1:16) and FindClusters() (with resolution = 0.8), using the distance metric based on previously identified PCs.
Assigning cell type annotation – To perform an unbiased cell type annotation of our single-cell RNA sequencing data we used the SingleR() function of the homonymous package (v1.6.1)25 which, by leveraging one of the built-in human references transcriptomic datasets (the BlueprintEncodeData), allowed us to infer the cell type of origin of each single-cell in our dataset. The BlueprintEncodeData26,27, made available through the celldex (v1.2.0) package, contains 259 total samples which combine the bulk RNA sequencing effort of Blueprint Epigenomics and ENCODE projects, manually aggregated into 24 broad cell types, which include the ‘endothelial’ and ‘epithelial’ cells classes.
Identifying differential expressed genes across cell types – To determine the characteristic marker genes of the two identified endothelial and epithelial cell type sub-populations, we employed the FindMarkers() function with default parameters.
Visualisation – For visualisation and data exploration, we reduced the dimensionality of the SCT-normalised expression matrix applying the non-linear UMAP method, using the RunUMAP() Seurat function. In the UMAP graphical representation, cells with similar expression profiles tend to be placed together and form communities/clusters in low-dimensional space.
In the different UMAPs shown in the results, cells were differently coloured and/or split by different metadata information (i.e. by ‘samples’ or by ‘cell type’) to highlight similarities or differences between subpopulations of cells using the DimPlot() Seurat function, with the argument group_by and split_by, respectively.
To visualise the expression of specific genes in the UMAP plot, we instead used the FeaturePlot() function of Seurat. Conversely, a dot plot representation was used to illustrate how gene expression changes across different identity classes (samples and cell types), exploiting the function DotPlot() of Seurat package. In this kind of plots the size of the dots encodes the percentage of cells within a class, while the colour encodes the average expression level across all cells within a class (dark-red is high). Stacked bar plots were created with the ggplot2 package (v3.3.5).
Results
Development of a pipeline to study freshly isolated human tumour cells firmly adhered to endothelial cells by live imaging and single-cell RNAseq. We optimised a nine-steps workflow that allows, in a time efficient way, analyses of the adhesion between breast-PDX cancer cells and primary human endothelial cells by live-cell imaging in vitro and single-cell transcriptomic (Figure 1, steps 3–8). First, we propagated a metastatic breast cancer PDX model19, which involves growth of the tumour for 5 months upon tumour-cell injection (Figure 1, step 1) and thawing of P1 primary endothelial HUVECs 5 days prior to the PDXs tumour resection. HUVECs were grown until they reached 80–90% confluency and then were seeded in microfluidic Ibidi® μ-Slides VI0.4 channels for 2 days to form tight monolayers (Figure 1, step 2). The following steps (3 to 8; Figure 1) were performed in a short time frame of 6 hours. First, the PDX tumour was surgically resected, collected in ice and dissociated following the procedure of PDX tumour dissociation into a single cell suspension described in the Methods. To obtain a cell suspension of human tumour cells, the dissociated PDX cells were subjected to mouse cells depletion followed by human tumour cell isolation by magnetic separation (Figure 1, step 4). Freshly prepared patient-derived breast tumour cells were fluorescently labelled with cell-tracker green (Figure1, step 5) to be visualised during for the flow-based adhesion in vitro assay by time-lapse live-cell imaging (Figure 1, step 6). At the end of the flow-based adhesion assay, human endothelial and adhered human tumour cells were retrieved from the microfluidic Ibidi® μ-Slides VI0.4 channels, separated and enriched by magnetic separation (Figure 1, step 7) and counted for single-cell RNAseq (Figure 1, step 8). Finally, single-cell RNAseq data were analysed and quality control tests performed for the method workflow validation (Figure 1, step 9).
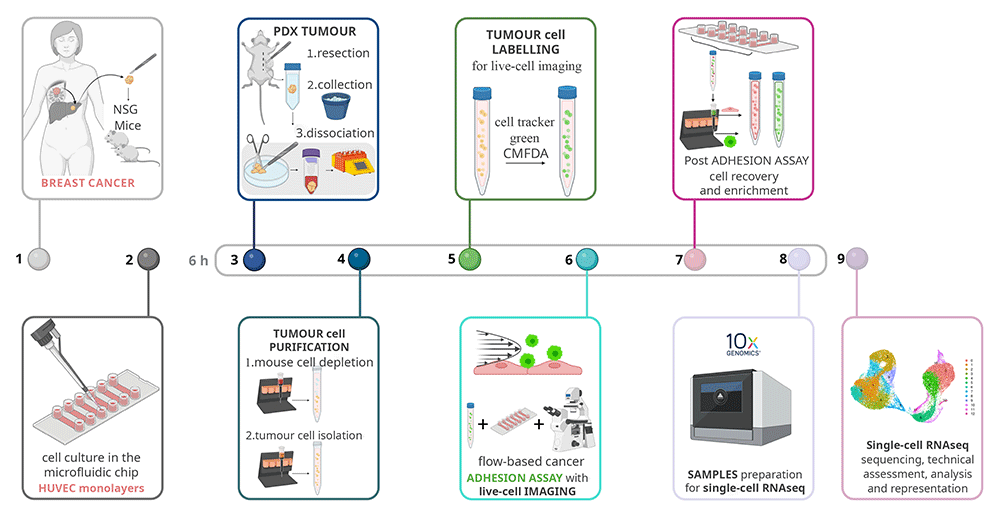
Figure 1. Overview of the single-cell analyses of cancer cells adhesion to endothelial cells workflow.
Schematic steps of the end-to-end optimised method to study by single-cell RNAseq the firm adhesion between the freshly isolated cancer cells from a tumour (1) of human breast cancer metastasis patient-derived xenograft (PDX) in NOD scid gamma mouse (NSG) mice, and (2) primary human umbilical vein endothelial cells HUVEC cultured in the channels of a microfluidic Ibidi® µ-Slide VI0.4. (3) The PDX tumour was resected and collected in ice to be dissociated to single cell suspension, (4) and purified in two steps by mouse cell depletion and human tumour cells isolation by magnetic isolation. (5) The tumour cells were fluorescently labelled with cell tracker green to be visualised during the (6) flow-based cancer adhesion to endothelial cells assay coupled with time-lapse live-cell imaging. (7) Firmly adhered cancer cells and endothelial cells were recovered from the channels of the microfluidic Ibidi® µ-Slide VI0.4 and separated by magnetic separation. (8) The separated endothelial cells (CD31+) and the firmly adhered cancer cells with the control inputs were counted and loaded into the 10x chromium Next GEM (Gel Beads-in-emulsion) single-cell 3` chip and controller followed by 10x Genomic workflow. (9) Single-cell RNAseq samples were sequenced and analysed. Steps (3) to (8), from tumour resection to samples loaded for single-cell RNAseq, were performed within 6 hours to use only fresh samples. Schematic realised with Biorender.com.
Freshly isolated human cancer cells firmly adhere to primary endothelial cells in the flow-based assay. We adapted a previously developed flow-based adhesion in vitro assay coupled to live-cell imaging19 to analyse adhesion of freshly isolated PDX-derived cancer cells adhesion to the primary endothelial cells HUVECs. Briefly, when the HUVECs monolayers were formed in the microfluidic Ibidi® µ-Slide VI0.4 channels (Figure 2A), the PDX tumour was resected and dissociated to single cell suspension, then purified to obtain a cell suspension with only human tumour cells by excluding mouse cells and human non-tumour cells. The freshly isolated patient-derived breast tumour cells were fluorescently labelled with cell-tracker CMFDA green for the flow-based adhesion assay and counted. We isolated 9.6 million cells that were prepared at 2 million cells/ml (Figure 2B). To study the interaction between the freshly isolated patient-derived breast tumour cells and the HUVECs under shear stress, that mimics the hemodynamic forces in vivo, we set up an in vitro flow-based adhesion assay. We created a closed system of tubing that connected the microfluidic Ibidi® µ-Slide VI0.4 with HUVEC monolayers outlet to a high precision syringe pump, and the inlet with the cancer cells suspension (Figure 2C). The microfluidic Ibidi® µ-Slide VI0.4 with HUVEC monolayers was placed in the Leica DMI8 (inverted) microscope and the green-labelled cancer cells were let flow and interact with HUVECs while the microscope acquired three images/second. At the end of the flow-based adhesion assay, we observed that the freshly isolated patient-derived breast tumour cells firmly adhered to the primary HUVECs (Figure 2D). We quantified the firmly adhered patient-derived breast cancer cells in different fields of view along the microfluidic Ibidi® µ-Slide VI0.4 channels (Figure 2E).
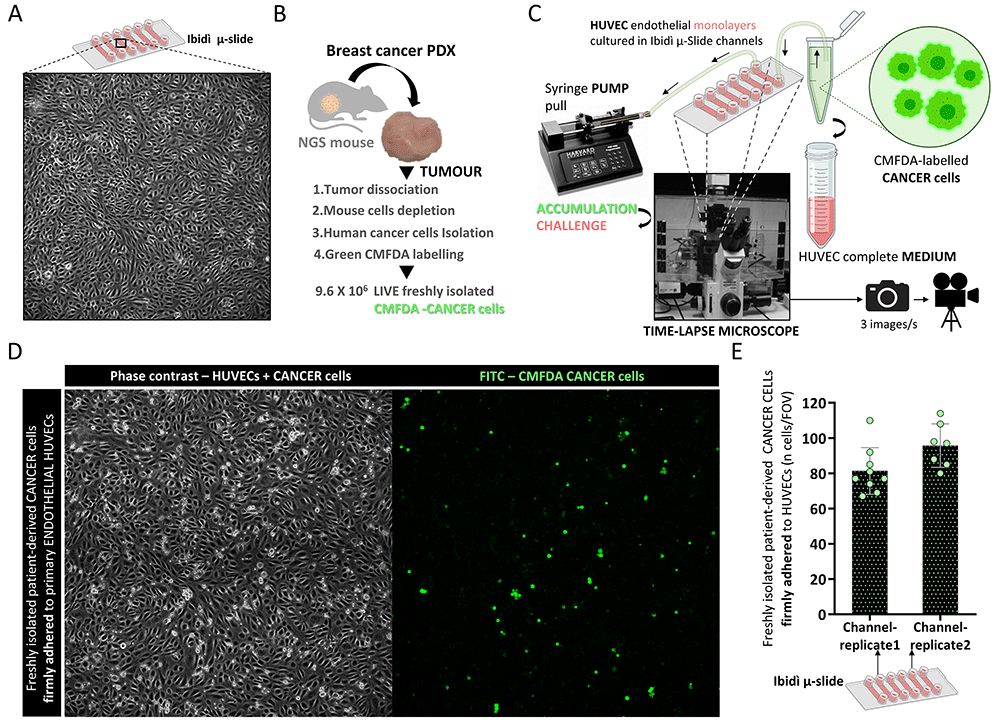
Figure 2. Freshly isolated patient-derived cancer cells firmly adhere to primary endothelial cells under shear stress.
(A) Bright field image of a single field of view (FOV: 1300x1300 µm) of the primary human umbilical vein endothelial cells (HUVEC) monolayer grown in the channels of a microfluidic Ibidi® µ-Slide VI0.4 acquired with Leica DMI8 (inverted) microscope at 10x magnification (NA 0.32 PH1 dry). (B) Patient-derived breast cancer cells preparation steps, including tumour isolation to obtain freshly isolated human breast cancer cells, fluorescently labelled with CMFDA cell tracker green for the flow-based adhesion assay. (C) Schematic representation of the flow-based adhesion assay where the microfluidic Ibidi® µ-Slide VI0.4 with HUVEC monolayers was placed in the Leica DMI8 (inverted) microscope. The µ-Slide was connected from the outlet with a close system of silicon tubing to a high precision syringe pump, and from the inlet into cancer cells or HUVEC complete medium. (D) Representative bright field phase contrast (left) and FITC (right) images of freshly isolated patient-derived breast cancer cells firmly adhered to primary endothelial HUVECs in one FOV at the end of the low-based adhesion assay described in the Methods. (E) Quantification of freshly isolated patient-derived breast cancer cells firmly adhered to primary endothelial HUVECs, expressed in number of cells/FOV (●) in two replicates (two separate runs in different channels) and mean with SD.
Successful retrieval, separation and enrichment of endothelial and cancer cells from the flow-based assay. To study both the adhered PDX-derived cancer cells to primary endothelial cells, and HUVECs by single-cell RNAseq, at the end of the flow-based adhesion assay, cells were retrieved from the microfluidic Ibidi® µ-Slide VI0.4 channels, dissociated with the proteolytic enzyme trypsin and pooled. Then, using the CD31+/PECAM1+ endothelial-cell marker, HUVECs (CD31+/PECAM1+) were separated from the adhered fluorescently labelled CMFDA-cancer cells (CD31-) by magnetic separation. Notably, pre-separation cell viability was maintained after magnetic separation (~80%) (Figure 3 A–C vs D, E). We successfully separated the CMFDA-cancer cells by HUVECs with magnetic separation for CD31 with ~99% of CMFDA+ and CMFDA-, respectively (Figure 3 D and E). CMFDA-cancer cells and HUVECs were then mixed in a 1:1 ratio for single-cell RNAseq analyses (1000 cells/µl) (Figure 3F). Finally, as controls, we also retrieved HUVECs that had been exposed to shear stress, but not to cancer cells, and freshly isolated PDX-derived cancer cells not used for the adhesion assay (1000 cells/µl) (Figure 3G).
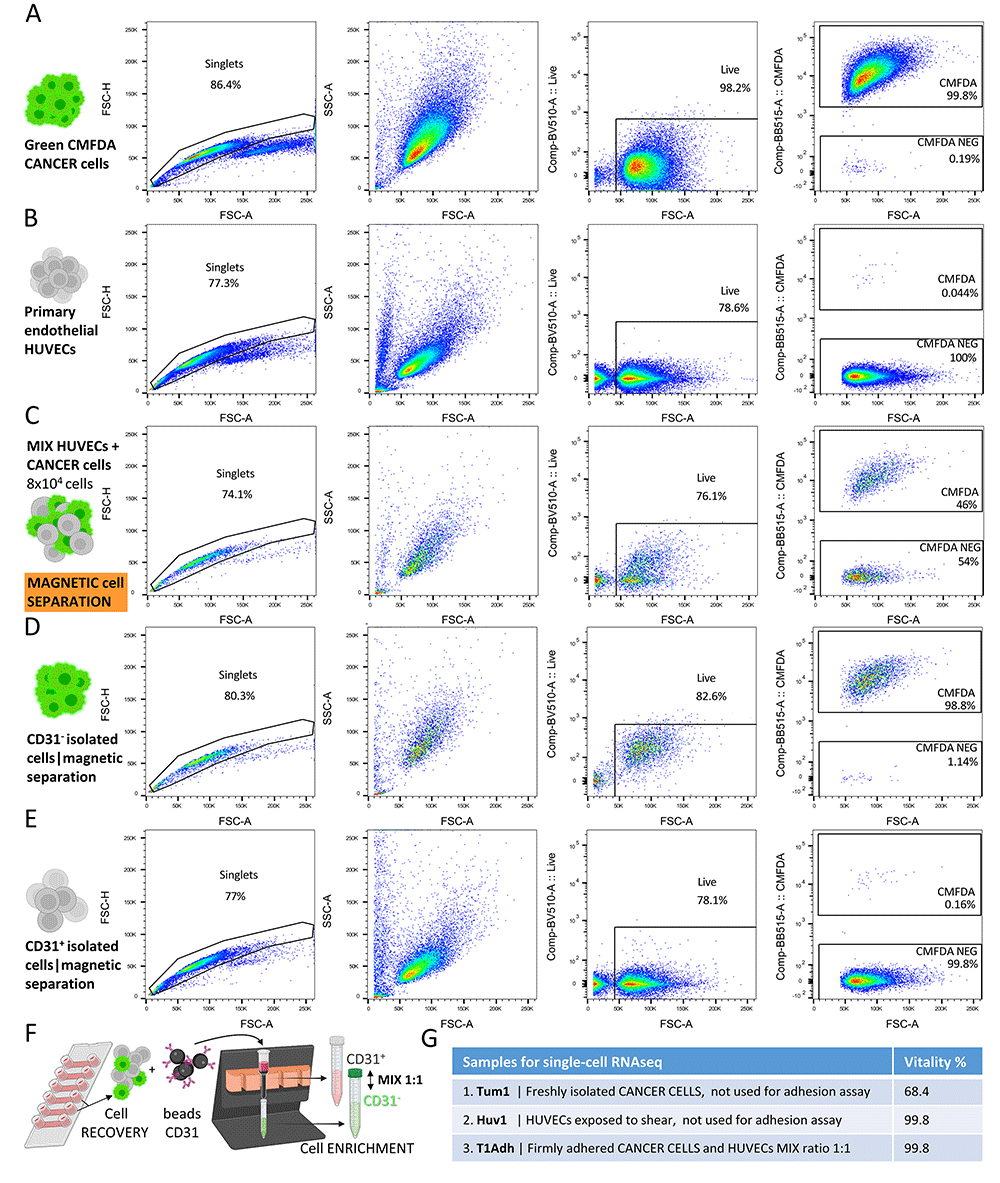
Figure 3. Firm adhesion samples retrieval, separation, and enrichment for single-cell RNAseq.
Primary human umbilical vein endothelial cells (HUVECs) and CMFDA-labelled cancer cells sample analysis by flow cytometry before and after magnetic separation for CD31/PECAM1. Dot blot of flow cytometry gating strategy, singlets, viability (%) and CMFDA+ (%) of (A) INPUT control CMFDA-labelled cancer cells (B) INPUT control HUVECs (C) mix of CMFDA-labelled cancer cells and HUVECs at 1:1 ratio (D) CD31- cells and (E) CD31+ cells after magnetic separation for CD31/PECAM1. (F) Schematic illustration of HUVECs and the firmly adhered cancer cells recovery from the microfluidic Ibidi® µ-Slide VI0.4 channels post flow-adhesion assay, and positive magnetic separation for CD31/PECAM1. (G) Table with the samples prepared for single-cells RNAseq and their viability (%), Sample1 Tum1, Sample2 HUV1, Sample3 T1Adh.
Single-cell RNAseq analyses of donor-derived tumour cells firmly adhered to endothelial cells. Analysis of the single-cell RNAseq data as performed with standard bioinformatics pipeline, mainly based on functions from the Seurat package described in the Methods where typical quality control and filtering were performed to exclude low-quality reads and cells from the final dataset. Analyses showed comparable UMI (Figure 4A) and gene numbers (Figure 4B) across the three samples (Sample1 Tum1, Sample2 HUV1, Sample3 T1Adh), the most important metrics used to evaluate single-cell RNAseq samples quality. Results revealed that all cells (16,287 cells) had a low and consistent percentage of mitochondrial genes (~10%) (Figure 4C), which correlates with low cell death in the total population analysed. Thus, all the cells retrieved from the adhesion assay (Figure 4D) have the potential to provide effective information from downstream analyses. The UMAPs (Uniform Manifold Approximation and Projection) of all the samples showed that the cell distribution of freshly isolated PDX-derived cancer cells (Tum1) was clearly separated by the endothelial cells (HUV1) into two different sub-populations, as expected. Of note, the two cell populations were evenly and uniformly distributed, consistent with the 1:1 ratio cell preparation (Figure 4E), confirming the quality of our sample enrichment and preparation approaches. The single-cell RNAseq cell-imputation analysis identified the cell types present in the samples based on their transcriptional features, and showed a clear distinction of endothelial and epithelial cell types, including in the T1Adh (Figure 4F) where the percentages were 45% and 55% of endothelial and epithelial cells, respectively (Figure 4G).
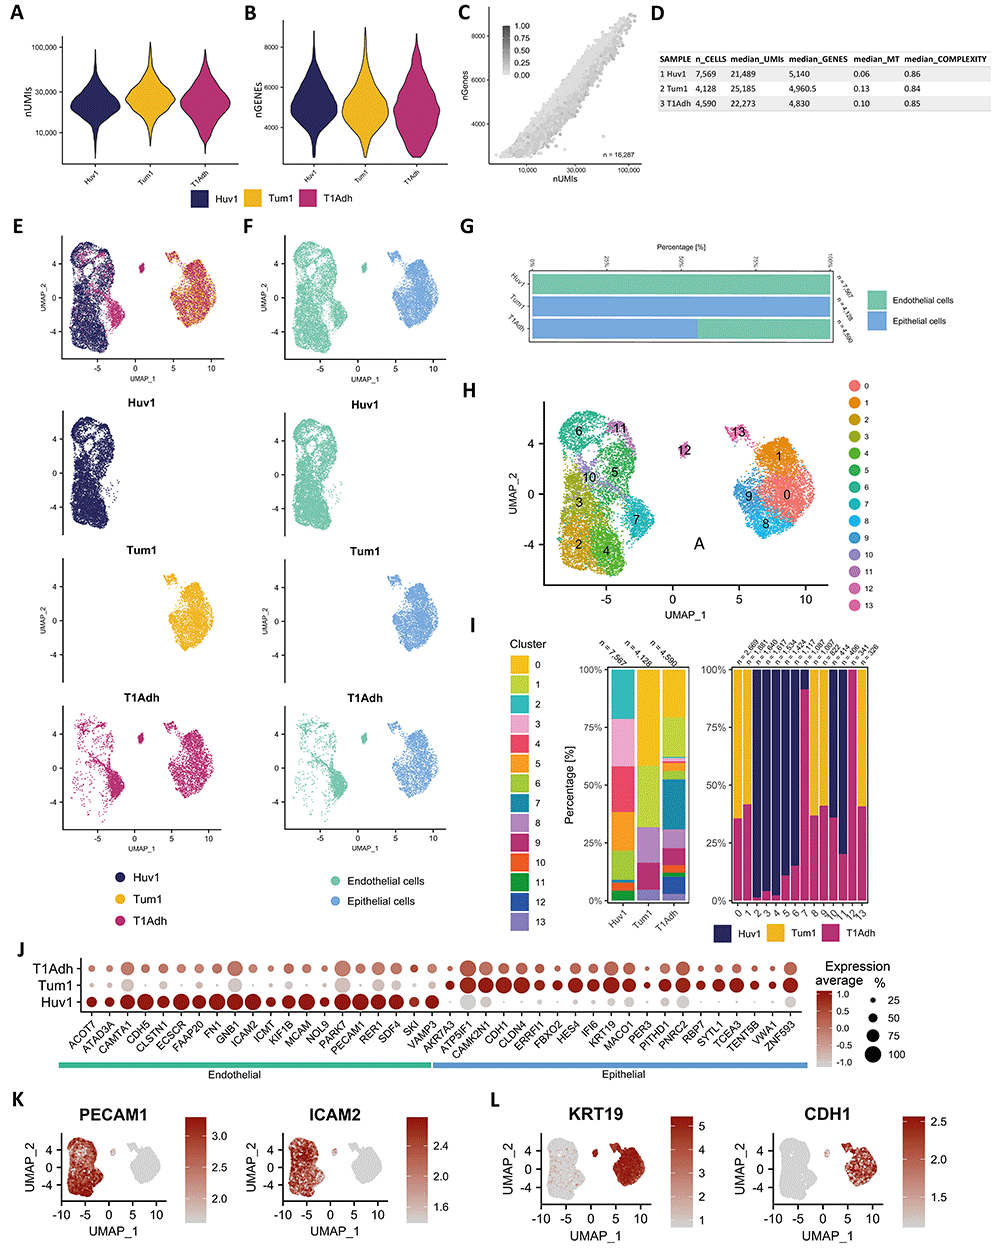
Figure 4. Single-cell RNAseq analyses demonstrate the suitability of the developed method samples for downstream transcriptional investigations.
Numerical outputs and data features of the three samples Tum1: input freshly isolated tumour from the patient-derived xenograft (PDX) cells never exposed to HUVECs, Huv1: input HUVECs exposed to shear stress, but not to cancer cells, T1Adh: 1:1 mix of cancer:endothelial firmly adhered cells. Violin plots of the distributions of (A) number of Unique Molecular Identifier (UMIs) per cell (nUMIs) and (B) number of genes per cell (nGenes). (C) Scatterplot of the three merged single-cell RNAseq samples (n=16,287) after quality control and filtering of cells, coloured by percentage of mitochondrial gene per cell. (D) Numerical summary of the quality control metrics after cell filtering in the three samples. SAMPLE: sample name, n_CELLs: final number of cells after quality control (QC) step and filtering, median_UMIs: median number of UMIs per cell, median_GENEs: median number of unique genes per cell, median_MT: median proportion on mitochondrial genes per cell, median_COMPLEXITY: median of cell complexity defined as the ratio of log10 of number of genes per cell by log10 of number of UMIs per cell. (E) UMAPs (Uniform Manifold Approximation and Projection) in two dimensions where each cell is coloured based on its origin samples of the three single-cell RNAseq samples (upper panel) merged, (lower panels) split, to highlight similarities and differences in transcriptional signature between samples. (F) UMAPs in two dimensions, coloured based on ‘cell type’ annotation (SingleR algorithm) of the three single-cell RNAseq samples (upper panel) merged, (lower panels) split to highlight similarities and differences between ‘cell types’ in each sample. ‘endothelial’ and ‘epithelial’ cell annotations account for the total, except two, cells of the entire single-cell RNAseq experiment. (G) Percentage stacked bar chart of endothelial and epithelial ‘cell type’ annotation across the three single-cell RNAseq samples, showing the proportional contribution of the individual cell type population (endothelial and epithelial) in comparison to the total. (H) UMAPs of the three merged single-cell RNAseq samples, coloured based on the 14 identified clusters. (I) Percentage stacked bar chart of the 14 clusters across samples (left panel), and stacked column chart of sample across clusters (right panel). (J) Dot plot of endothelial- and epithelial-specific cell marker genes arbitrarily chosen (20 for each) of the three single-cell RNAseq samples, to demonstrate the consistent transcriptional signature representation of the two functional cell lineages. Genes were plot in alphabetical order: (left) 20 ‘endothelial` and (right) `epithelial` markers genes. The size of the dot encodes the percentage of cells within the different single-cell RNAseq samples, while the colour encodes the average expression level across all cells within the different single-cell RNAseq samples (dark red is high). The FeaturePlots (example of the visualisation techniques of the Seurat package) of two canonical specific (K) endothelial, PECAM1 and ICAM2 and (L) classic epithelial, KRT1 and CDH1, genes to visualise their gene expression in low-dimensional space (UMAP). In both, darker colour indicates higher expression.
The cluster analysis, visualised in the UMAP coloured by clusters, revealed the presence of different cellular subsets of all the samples together (Figure 4H) and of each sample (Figure 4I). This analysis represents a proof of concept to further demonstrate that we obtained enough high-quality cells to represent the heterogeneity of the samples in all the subsets and clusters sharing similar expression profiles, representing homogeneous functional sub-populations, both crucial for high power and detailed downstream analyses. By unbiased marker gene analysis across cell-type groups, we identified well established cell type-specific genes in the three samples, that confirm their cellular composition (Figure 4J), and the robustness of our method. PECAM1 and ICAM2 were proven to be marker genes for endothelial cells (Figure 4K) and KRT19 with CDH1 for breast epithelial cells (Figure 4L). Taken together, the method we designed to study cancer-to-endothelial adhesion allowed to obtain high-quality samples, suitable for a meaningful single-cell RNAseq analysis.
Conclusions
Mapping the transcriptional signatures of cancer:endothelial cell adhesion at single-cell level is critical to understand underlying molecular mechanisms and to identify putative molecular targets for clinical intervention, including drug targets and specific biomarkers. To this end, we have developed a workflow to study the firm adhesion of patient-derived xenografts (PDX) breast cancer cells to human primary endothelial cells in vitro under shear stress at the single-cell resolution. This method is flexible, versatile and can be adapted to different cancer and endothelial cell types or other contexts to study cell-cell interaction under shear stress.
A critical aspect of our method is the use of freshly isolated cancer cells from PDX tumour. Here, we limited the study at one PDX, but it can be applied to many different PDX of different sources relevant to human cancer heterogeneity. The flow-based adhesion assay to primary endothelial cells enables analyses of a human, highly-heterogeneous and patient-relevant sample in a functional assay, an experimental context that would be difficult to be achieved or inadequate to perform when using thawed cancer-cells. Notably, our method was designed to obtain freshly isolated cells and flow-based adherent cells for single-cell RNAseq in the short time frame of six hours, to allow the best sample quality for both the functional assay and the single-cell RNAseq analyses.
We demonstrated the feasibility of a method that combines heterogeneous and complex steps including in vivo surgery, sample purification, high-content microscopy based-microfluidics and single-cell RNAseq. The use of a sophisticated in vitro assay for the adhesion between cancer cell and endothelial cells, combined with microfluidic technology, shear stress forces mimicking the hemodynamic forces in vivo, allowed the visualisation of a key event in the metastatic progression that is hard to study in vivo, thus replacing and reducing the animal-model usage with an all-human model. Finally, this method workflow successfully produces samples for a robust single-cell RNAseq analysis, with homogenous outputs of UMIs and genes numbers across samples, and expected proportions of endothelial and epithelial cell distribution. Single-cell RNAseq data showed a good numbers of cells per sample and cell-clusters with specific gene-signatures expression. In conclusion, this method allows the study of firmly adhered cancer cells to endothelial cells at the single-cell resolution, and can be efficiently used to investigate the molecular mechanisms underlying a specific step of the metastatic cascade.
Ethics and consent
Investigations have been conducted in accordance with the ethical standards and according to National and International guidelines. In vivo studies were performed in the authorised Cogentech animal facility, after approval notification of the experiments by the Ministry of Health (as required by the Italian Law) (IACUCs n° 679/2020-PR approved by the Italian Ministry of Health on the 10/07/2020). Human tissue biopsies were collected from patients whose informed consent was obtained in writing and deposited in the IEO Biobank for Translational Medicine (B4MED) according to the policies of the Ethics Committee of the European Institute of Oncology (n. R663-IEO S706/312) and regulations of Italian Ministry of Health. The informed consent of the patient for research bio banking stipulates that the gathered specimen may be utilized specific research, for general research purposes or in future research for which objectives are as yet unknown18. The studies were conducted in full compliance with the Declaration of Helsinki.