Abbreviations
WHO: World Health Organization
RTGCS: Robson's Ten-Group Classification System
CS: Cesarean section
MFM: Maternal fetal medicine
CPD: Cephalopelvic disproportion
EFHRM: Electronic fetal heart rate monitoring
Introduction
Cesarean section (CS) is a surgical procedure that can effectively prevent deaths and serious complications in mothers and babies when used for medically indicated reasons1. Worldwide, CS rates have increased from 12% in 2000 to about 21% in 20152. However, it is not clear whether this is associated with significant maternal or perinatal health benefits or problems3. In addition, as a surgical procedure, a CS is not without risks. CS is associated with more blood loss and subsequent pregnancy risks such as placenta accreta spectrum, placenta previa, uterine rupture, and stillbirth, and long-term childhood outcomes such as asthma and obesity, compared to those delivered vaginally3. In Thailand, CS rates significantly increased from 23.2% in 2009 to 32.5% in 2017. If this trend continues without any implementation of effective interventions, the CS rate for Thailand could reach 59.1% in 20304.
Globally, reported reasons for rising CS rates from healthcare providers include differences in practice patterns, fear of malpractice suits and obstetricians’ preferences5. Furthermore, private practices were reported to be one of the associated factors for high CS rate6. While increasing prevalence of maternal obesity, elderly pregnancies and multiple pregnancies, economic and sociocultural factors such as family responsibilities and fear of labor pain were the reasons for pregnant women1,7,8.
Sustained increases in CS rates are a major public health concern worldwide1. Recognizing the growing importance of non-clinical factors in the increase, the World Health Organization (WHO) published recommendation for non-clinical interventions to reduce unnecessary CS targeted at women, healthcare professionals and organizations9. For interventions targeted at healthcare professionals, implementation of evidence-based clinical practice guidelines (CPGs) combined with mandatory second opinion for CS indication as well as audit and feedback to physicians and nurses involving in the decision-making process for deliveries is recommended to reduce unnecessary CS1,9. Health educational interventions targeted at women or families using decision-analysis tools (DAT) present evidence of an increased number of women choosing a trial of labor when eligible for vaginal birth10–12. Among other non-clinical interventions targeted at healthcare organizations, implementation of continuous support during labor and birth by companions has been recommended by the WHO to improve labor outcomes, increase spontaneous vaginal births and women’s satisfaction with care services13,14. However, there are uncertainties regarding the feasibility and acceptability of these non-clinical interventions, and limited evidence relating to their effects in the context of implementation of complex, multi-faceted components, particularly in low- and middle-income countries.
The QUALI-DEC project
To respond to rising rates of CS, a consortium of researchers including WHO and research institutions from Europe and low- or middle-income countries (LMICs) designed and started in 2020 the QUALI-DEC study: “Appropriate use of cesarean section through QUALity Decision-making by women and providers”. QUALI-DEC aims to design and evaluate a multi-faceted strategy to implement non-clinical interventions targeted at health professionals, women and health organizations to reduce unnecessary CS in the four participating countries: Argentina, Burkina Faso, Thailand and Viet Nam15. The multi-faceted QUALI-DEC strategy is designed to combine four key components: 1) opinion leaders to implement evidence-based clinical guidelines; 2) cesarean audits and feedback to help providers identify potentially avoidable CS; 3) a Decision Analysis Tool (DAT) to help women make an informed decision on mode of birth; and 4) implementation of WHO recommendations on companionship during labor and childbirth.
In Thailand, a recent cross-sectional analysis from all 24 government hospitals in Khon Kaen Province showed an overall CS rate of 31.4%. About two-third of women giving birth were women at term with a singleton pregnancy in cephalic presentation without a previous CS entering labor spontaneously (Robson's Ten-Group Classification System (RTGCS) groups 1 and 3). Although these women can be considered low risk, they are large contributors to the overall CS rate in this province16. Given that a CS rate of 10% in RTGCS group 1 has been suggested by WHO as achievable17, the 20.5% rate found in RTGCS group 1 in Khon Kaen may be considered medically unjustified16. In RTGCS groups 2, 3 and 4, the relative contributions of overall CS rates were 21.1%, 8.4% and 7.1%, respectively.
In the context of the QUALI-DEC project, the objective of this manuscript is to present the results of the cesarean audit conducted to evaluate the appropriateness of CS indications in low-risk women (RTGCS groups 1-4) using the data extracted from medical records of Srinagarind Hospital, a university hospital in Khon Kaen Province, which is one of the participating hospitals in QUALI-DEC project in Thailand. This study provided insights on the magnitude and causes of potentially avoidable CS before the implementation of the QUALI-DEC project.
Methods
Patient population and inclusion criteria
This is a descriptive study conducted in pregnant women who delivered their babies at Srinagarind Hospital, a university hospital, Khon Kaen, Thailand. We collected data from medical records of all women who gave birth between 1st January 2020 and 31st December 2020. We used Robson's Ten-Group Classification System (RTGCS) to monitor CS rates. We focused only on women who underwent a CS in RTGCS groups 1-4 (Appendix I18). Women in these RTGCS groups 1-4 are low-risk groups for CS. Since there is no accepted international classification of CS indications, our Maternal and Fetal Medicine (MFM) unit developed the criteria for appropriateness of CS indications, which was adapted from WHO recommendations on intrapartum care for a positive childbirth experience19 (Appendix II20–23). Medical records of these women were assessed for appropriateness of CS indications using an audit report form and our appropriateness criteria.
Indications. The indications for CS were classified into three categories: fetal indications (e.g. non- reassuring fetal status, fetal macrosomia, major fetal anomaly, head deflexion, and etc.), cephalo-pelvic disproportion (CPD) and other maternal indications (e.g. placenta previa, elderly nulliparous, COVID-19 infection, failed operative vaginal delivery, infertility, failed induction, and etc.). We also categorized CS as pre-labor CS (RTGCS groups 2b and 4b), and intrapartum CS (RTGCS groups 1, 2a, 3, and 4a) because in our context, the decision-making processes for these two groups are different.
We categorized each CS as appropriate, borderline appropriate and inappropriate indications. When CS was deemed the only appropriate route of delivery, we classified it as appropriateness. On the contrary, inappropriateness is classified when CS was performed without enough justification. Borderline appropriateness referred to the conditions that did not meet the appropriateness criteria but not clearly inappropriate. Assessment for appropriateness was conducted independently by two authors (WW and RK). Disagreement was resolved by the third author (PL). Women with missing or incomplete data were excluded.
This study was approved by the Khon Kaen University Ethics Committee on Human Research as per the Helsinki Declaration and Good Clinical Practice Guidelines (HE 651067) and the QUALI-DEC project was approved by the Research Project Review Panel (RP2) of the UNDP/UNFPA/UNICEF/WHO/World Bank Special Programme of Research, Development and Research Training in Human Reproduction (HRP) at the Department of Sexual and Reproductive Health and Research of WHO and the WHO Research Ethics Review Committee (ERC), Geneva, Switzerland. Patient consent was waived by Khon Kaen University Ethics Committee.
Sample size calculation
Prior to the study, we piloted the audit using data from 30 pregnant women in RTGCS groups 1-4. We found 43% of CS with inappropriate indications. With an acceptable error of 6 %, at least 257 women are needed for this study24 in order to determine the appropriateness of indication for CS.
Statistical analysis
Data analysis was performed using R Statistical Software (version 4.2.2). We reported baseline characteristics as mean and standard deviation, median and interquartile range for continuous data, and percentage for dichotomous data. The appropriate, borderline appropriate and inappropriate indications for CS of all women in RTGCS groups 1 to 4 were reported as percentage with 95% confidence intervals (CIs) calculated according to the method of Sison and Glaz25. We also reported all deliveries at Srinagarind Hospital in 2020 according to RTGCS using data from QUALI-DEC project. CSs were also categorized as; 1) pre-labor or 2) intrapartum to assess appropriateness in each group.
Results
In the study period there were 1,725 deliveries, 734 (42.6%) by CS. RTGCS group 1 was the largest (38.2%) and together groups 1 and 3 accounted for almost two-thirds of the obstetric population (61.5%). Although, RTGCS group 5 had the largest relative contribution (26.2%) to the overall CS rate. The CS rates in RTGCS groups 1 to 4 were 24.3%, 14.9%, 4.9% and 2.5%, respectively (Table 1).
Table 1. Cesarean section rate in each RTGCS.
Distribution of all cesarean procedures stratified by the Robson ten’s-Group Classification System.
| Setting: Srinagarind Hospital | Period: January 2020 to December 2020 |
|---|
| Group | Number
of CS in
group | Number of
women in
group | Group
size (%) | Group
CS rate
(%) | Absolute group
contribution to
overall CS rate (%) | Relative
contribution of
group to overall
CS rate (%) |
|---|
| 1 | 178 | 659 | 38.2% | 27.0% | 10.3% | 24.3% |
| 2 | 110 | 132 | 7.7% | 83.3% | 6.4% | 14.9% |
| 3 | 36 | 403 | 23.3% | 8.9% | 2.1% | 4.9% |
| 4 | 18 | 34 | 2.0% | 52.9% | 1.0% | 2.5% |
| 5 | 192 | 192 | 11.1% | 100% | 11.1% | 26.2% |
| 6 | 29 | 31 | 1.8% | 93.6% | 1.7% | 3.9% |
| 7 | 25 | 27 | 1.6% | 92.6% | 1.5% | 3.4% |
| 8 | 51 | 53 | 3.1% | 96.2% | 3.0% | 6.9% |
| 9 | 5 | 5 | 0.3% | 100% | 0.3% | 0.7% |
| 10 | 90 | 189 | 10.9% | 47.6% | 5.2% | 12.3% |
| Total | 734 | 1725 | 100% | 42.6% | 42.6% | 100% |
Of 342 women in RTGCS groups 1-4, thirty-one (9.1%) had incomplete data, hence only 311 were included. Of these, 70 underwent pre-labor CS, while 241 were intrapartum CS (Figure 1). Mean age of these women was 30.1 years (SD ± 5.2 years). Other baseline characteristics were shown in Table 2. Most women had gestational ages at delivery less than 41 weeks and received at least one antenatal care in this hospital. The most frequent complications during pregnancy were gestational diabetes and pregnancy induced hypertension. No perinatal death was observed in this study.
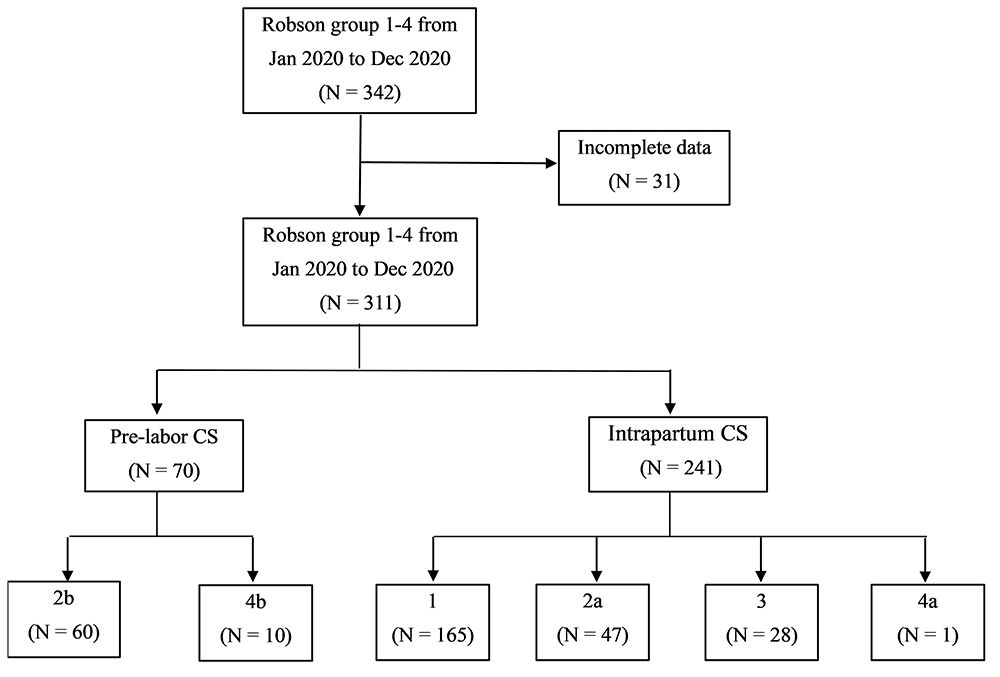
Figure 1. Flow chart of data process.
Table 2. Baseline characteristics of women in RTGCS group 1–4.
| Characteristics | Pre-labor CS
(group 2b, 4b)
(n= 70) | Intrapartum
CS (group 1,
2a, 3, 4a)
(n= 241) | Total
(n=311) |
|---|
| Information about pregnant women | | | |
| Age (years), mean ± SDa | 32.4 ± 5.2 | 29.5 ± 5.0 | 30.1 ±5.2 |
| Maternal age, n (%) | | | |
| < 35 years | 44 (62.9) | 201 (83.4) | 245 (78.8) |
| ≥ 35 years | 26 (37.1) | 40 (16.6) | 66 (21.2) |
| BMIb before delivery (kg/m2), n (%) | | | |
| < 18.5 | 0 | 0 | 0 |
| 18.5 – 22.9 | 1 (1.4) | 16 (6.6) | 17 (5.5) |
| ≥ 23 | 69 (98.6) | 225 (93.4) | 294 (94.5) |
| Parity, n (%) | | | |
| Nulliparous | 60 (85.7) | 212 (88.0) | 272 (87.5) |
| Multiparous | 10 (14.3) | 29 (12.0) | 39 (12.5) |
| Gestational age | | | |
| < 41 weeks | 67 (95.7) | 229 (95.0) | 296 (95.2) |
| 41 weeks | 3 (4.3) | 12 (5.0) | 15 (4.8) |
| Information on the newborn | | | |
| Gender, n (%) | | | |
| Male | 44 (62.9) | 124 (51.5) | 168 (54.0) |
| Female | 26 (37.1) | 117 (48.5) | 143 (46.0) |
| Weight (g), mean ± SD | 3,272.1 ± 498.7 | 3,268.7 ± 456.4 | 3,269.5 ± 465.4 |
| Apgar at 1 minute | 8 (8 – 8) | 8 (8 – 8) | 8 (8 – 8) |
| Apgar at 5 minutes | 9 (9 – 9) | 9 (9 – 9) | 9 (9 – 9) |
| Neonatal outcome, n (%) | | | |
| Live birth | 70 (100) | 241 (100) | 311 (100) |
| Perinatal death | 0 | 0 | 0 |
Recorded complications during
pregnancy, before labor, n (%) | | | |
| None | 47 (67.1) | 180 (74.6) | 227 (66.6) |
| Severe maternal anemia (Hbc <7 g/L) | 0 | 1 (0.4) | 1 (0.3) |
| Chorioamnionitis | 0 | 2 (0.8) | 2 (0.6) |
| Placental abruption | 0 | 1 (0.4) | 1 (0.3) |
| Antepartum hemorrhage | 1 (1.4) | 2 (0.8) | 3 (0.9) |
| Placenta previa | 7 (10) | 1 (0.4) | 8 (2.6) |
| Gestational diabetes | 8 (11.4) | 22 (9.1) | 30 (9.6) |
| Preeclampsia/eclampsia | 4 (5.7) | 13 (5.4) | 17 (5.5) |
| Intrauterine growth retardation | 1 (1.4) | 7 (2.9) | 8 (2.6) |
| Pre-labor rupture of membranes | 0 | 7 (2.9) | 7 (2.2) |
| Other | 3 (4.3) | 11 (4.6) | 14 (4.5) |
The overall appropriate rate of CS indications in RTGCS groups 1-4 was 32.5% (95% CI 26.8% – 38.7%). The appropriate rates of CS indications in RTCGS groups 1, 2a, 2b, 3, 4a, and 4b were 43.0% (95% CI 35.2% - 51.2%), 10.6% (95% CI 0.0% - 24.9%), 11.7% (95% CI 0.0% - 25.0%), 50.0% (95% CI 32.1% - 68.6%), 0% (95% CI 0.0% - 100%), and 40.0% (95% CI 20.0% - 74.8%) respectively (Table 3 and Figure 2). CS for fetal indications had the highest appropriate rate at 54.0% (95% CI 43.7% – 64.7%), while CS for other maternal indications had the lowest appropriate rate at 15.9% (95% CI 5.7% – 27.5%) (Table 3 and Figure 2).
Table 3. Appropriateness of CS indications.
| Indication | No. of
CS (%) | No. of appropriate
CS (%) | No. of borderline appropriate
CS (%) | No. of inappropriate
CS (%) |
|---|
| Group 1: 165 (53.1%) women |
|---|
| CPDa | 99 (60.0%) | 35 (35.4%)
95% CI 26.5% – 45.0% | 0 (0.0%)
95% CI 0.0% - 9.6% | 64 (64.7%)
95% CI 55.6% - 74.3% |
| Fetal | 45 (27.3%) | 31 (68.9%)
95% CI 57.8% - 83.7% | 14 (31.1%)
95% CI 20.0% - 45.9% | 0 (0.0%)
95% CI 0.0% - 14.8% |
| Other maternal | 21 (12.7%) | 5 (23.8%)
95% CI 4.8% - 47.9% | 7 (33.3%)
95% CI 14.3% - 57.4% | 9 (42.9%)
95% CI 23.8% -67.0% |
| Total | 165 (100%) | 71 (43.0%)
95% CI 35.2% - 51.2% | 21 (12.7%)
95% CI 4.8% - 20.9% | 73 (44.2%)
95% CI 36.4% - 52.4% |
| Group 2a: 47 (15.1%) women |
|---|
| CPDa | 7 (14.9%) | 0 (0.0%)
95% CI 0.0% - 23.4% | 0 (0.0%)
95% CI 0.0% - 23.4% | 7 (100%)
95% CI 100% -100% |
| Fetal | 6 (12.8%) | 5 (83.3%)
95% CI 66.7% - 100% | 1 (16.7%)
95% CI 0.0% - 44.5% | 0 (0.0%)
95% CI 0.0% -27.8% |
| Other maternal | 34 (72.3%) | 0 (0.0%)
95% CI 0.0% - 16.0% | 12 (35.3%)
95% CI 20.6% - 51.3% | 22 (64.7%)
95% CI 50.0% - 80.7% |
| Total | 47 (100%) | 5 (10.6%)
95% CI 0.0% - 24.9% | 13 (27.7%)
95% CI 14.9% - 42.0% | 29 (61.7%)
95% CI 48.9% - 76.0% |
| Group 2b: 60 (19.3%) women
|
|---|
| CPDa | 16 (26.7%) | 0 (0.0%)
95% CI 0.0% - 10.1% | 0 (0.0%)
95% CI 0.0% - 10.1% | 16 (100%)
95% CI 100% - 100% |
| Fetal | 16 (26.7%) | 1 (6.3%)
95% CI 0.0% - 24.8% | 14 (87.5%)
95% CI 81.3% - 100% | 1 (6.3%)
95% CI 0.0% - 24.8% |
| Other maternal | 28 (46.7%) | 6 (21.4%)
95% CI 7.1% - 37.9% | 20 (71.4%)
95% CI 57.1% - 87.9% | 2 (7.1%)
95% CI 0.0% - 23.6% |
| Total | 60 (100%) | 7 (11.7%)
95% CI 0.0% - 25.0% | 34 (56.7%)
95% CI 45.0% - 70.0% | 19 (31.7%)
95% CI 20.0% - 45.0% |
| Group 3: 28 (9.0%) women
|
|---|
| CPDa | 14 (50.0%) | 5 (35.7%)
95% CI 14.3% - 59.6% | 0 (0.0%)
95% CI 0.0% - 23.9% | 9 (64.3%)
95% CI 42.9% - 88.2% |
| Fetal | 13 (46.4%) | 9 (69.2%)
95% CI 53.8% - 98.1% | 4 (30.8%)
95% CI 15.4% - 59.6% | 0 (0.0%)
95% CI 0.0% - 28.9% |
| Other maternal | 1 (3.6%) | 0 (0.0%)
95% CI 0.0% - 100% | 0 (0.0%)
95% CI 0.0% - 100% | 1 (100%)
95% CI 100% - 100% |
| Total | 28 (100%) | 14 (50.0%)
95% CI 32.1% - 68.6% | 4 (14.3%)
95% CI 0.0% - 32.9% | 10 (35.7%)
95% CI 17.9% - 54.3% |
| Group 4a: 1 (0.3%) woman
|
|---|
| Other maternal | 1 (100%) | 0 (0.0%)
95% CI 0.0% - 100% | 0 (0.0%)
95% CI 0.0% - 100% | 1 (100%)
95% CI 100% - 100% |
| Total | 1 (100%) | 0 (0.0%)
95% CI 0.0% - 100% | 0 (0.0%)
95% CI 0.0% - 100% | 1 (100%)
95% CI 100% - 100% |
| Group 4b: 10 (3.2%) women
|
|---|
| Fetal | 7 (70.0%) | 1 (14.3%)
95% CI 0.0% - 38.4% | 6 (85.7%)
95% CI 71.4% - 100% | 0 (0.0%)
95% CI 0.0% - 24.1% |
| Other maternal | 3 (30.0%) | 3 (100%)
95% CI 100% - 100% | 0 (0.0%)
95% CI 0.0% - 56.4% | 0 (0.0%)
95% CI 0.0% - 56.4% |
| Total | 10 (100%) | 4 (40.0%)
95% CI 20.0% - 74.8% | 6 (60.0%)
95% CI 40.0% - 94.8% | 0 (0.0%)
95% CI 0.0% - 34.8% |
| Pre-labor CS (group 2b, 4b): 70 (22.5%) women |
|---|
| CPDa | 15 (21.4%) | 0 (0%)
95% CI 0% – 10.8% | 0 (0%)
95% CI 0% – 10.8% | 15 (100%)
95% CI 100% - 100% |
| Fetal | 22 (31.4%) | 1 (4.5%)
95% CI 0% – 18.2% | 20 (90.9%)
95% CI 86.4% – 100% | 1 (4.5%)
95% CI 0% – 18.2% |
| Other maternal | 33 (47.1%) | 10 (30.3%)
95% CI 15.2% – 47.3% | 20 (60.6%)
95% CI 45.5% – 77.6% | 3 (9.1%)
95% CI 0% – 26.1% |
| Total | 70 (100%) | 11 (15.7%)
95% CI 4.3% – 27.3% | 40 (57.1%)
95% CI 45.7% – 68.8% | 19 (27.1%)
95% CI 15.7% – 38.8% |
| Intrapartum CS (group 1, 2a, 3, 4a): 241 (77.5%) women
|
|---|
| CPDa | 121 (50.2%) | 40 (33.1%)
95% CI 24.8% – 41.4% | 0 (0%)
95% CI 0% – 8.4% | 81 (66.9%)
95% CI 58.7% – 75.3% |
| Fetal | 65 (27.0%) | 46 (70.8%)
95% CI 61.5% – 82.8% | 19 (29.2%)
95% CI 20.0% – 41.3% | 0 (0%)
95% CI 0% – 12.1% |
| Other maternal | 55 (22.8%) | 4 (7.3%)
95% CI 0% – 20.2% | 19 (34.5%)
95% CI 21.8% – 47.5% | 32 (58.2%)
95% CI 45.5% – 71.1% |
| Total | 241(100%) | 90 (37.3%)
95% CI 30.7% – 44.1% | 38 (15.8%)
95% CI 9.1% – 22.5% | 113 (46.9%)
95% CI 40.2% – 53.6% |
| Total: 311 women
|
|---|
| CPDa | 136 (43.7%) | 40 (29.4%)
95% CI 22.1% – 37.2% | 0 (0%)
95% CI 0% – 7.8% | 96 (70.6%)
95% CI 63.2% – 78.4% |
| Fetal | 87 (28.0%) | 47 (54.0%)
95% CI 43.7% – 64.7% | 39 (44.8%)
95% CI 34.5% – 55.5% | 1 (1.1%)
95% CI 0% – 11.9% |
| Other maternal | 88 (28.3%) | 14 (15.9)
95% CI 5.7% – 27.5% | 39 (44.3%)
95% CI 34.1% – 55.9% | 35 (39.8%)
95% CI 29.5% – 51.4% |
| Total | 311 (100%) | 101 (32.5%)
95% CI 26.8% – 38.7% | 78 (25.1%)
95% CI 19.3% – 31.3% | 132 (42.4%)
95% CI 36.7%– 48.7% |
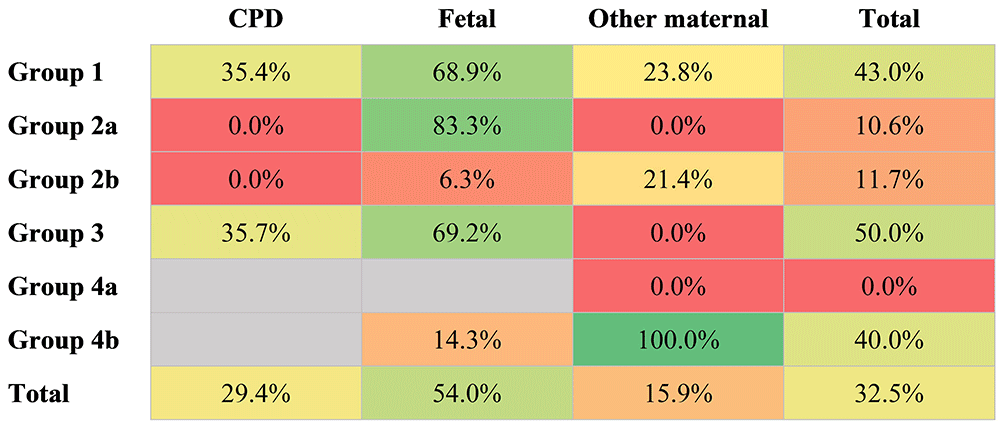
Figure 2. Heat map for appropriateness of CS indications.
Other maternal indications include placenta previa, elderly nulliparous, COVID-19 infection, failed operative vaginal delivery, infertility or failed induction, etc. Green, yellow, orange and red indicate from more appropriateness to less appropriateness, respectively. Grey indicates no data.
For pre-labor CS, the highest appropriate rate was found in other maternal indication in group 4b (100%, 95% CI 100% - 100%), while the lowest appropriate rate was observed in CPD of group 2b (0%, 95% CI 0.0% - 10.1%). In intrapartum CS, we found the highest appropriate rate in fetal indication of group 2a (83.3%, 95% CI 66.7% - 100%). On the other hand, the lowest appropriate rates were other maternal indication in group 3 (0%, 95% CI 0.0% - 100%) and 4a (0%, 95% CI 0.0% - 100%) and CPD in group 2a (0%, 95% CI 0.0% - 23.4%) (Table 3 and Figure 2).
The overall appropriate, borderline appropriate and inappropriate indications for CS were 32.5%, 25.1 % and 42.4%, respectively. The three most common indications for CS were CPD, non-reassuring fetal status and failed induction. The main indication in appropriate group was non-reassuring fetal status. All these fetuses were evaluated for their status using an intrapartum monitoring machine. Whereas fetal macrosomia was the main indication in borderline appropriate group. Cephalopelvic disproportion (CPD) was the most frequent indication in inappropriate group. When assessing cases which were pre-laborly diagnosed as CPD, one case was nearly short stature (148 cm.) and another one was suspected fetal macrosomia. For those diagnosed with fetal macrosomia, only 10.8% (3/28) had birth weight less than 3500 gm (Table 4).
Table 4. Assessment of the appropriateness of indications for CS.
| Assessment | Percentage (N = 311) | Indications |
|---|
| Appropriate | 32.5% (101)
95% CI 26.8 – 38.7 | Non-reassuring fetal status (47)
CPDa (40)
Placenta previa (8)
History of pelvic fracture s/p surgery (4)
Failed operative vaginal delivery (1)
Maternal heart disease (1) |
| Borderline appropriate | 25.1% (78)
95% CI 19.3 – 31.3 | Fetal macrosomia (28)
Occiput posterior (4)
Oligohydramnios (3)
Major fetal anomaly (2)
Head deflexion (1)
Non-reassuring fetal status (1)
Elderly primigravida (17)
Failed induction (11)
Preeclampsia with severe feature (4)
Short stature (2)
Narrow pubic outlet (2)
Infertility with treatment (1)
Placental abruption (1)
Bad obstetric history (1) |
| Inappropriate | 42.4% (132)
95% CI 36.7– 48.7 | Borderline oligohydramnios (1)
CPD (96)
Failed induction (32)
Preeclampsia without severe feature (2)
Maternal short stature (1) |
Discussion
Our study confirms the high rate of CS in Srinagarind Hospital. Our audit of indications for CS shows that only one third of the CS in RTGCS groups 1–4 who represent 70% of the women giving birth in the hospital, complied with the criteria for appropriateness of CS indication. Overall, CS for fetal indications and other maternal indications had the highest and lowest appropriateness rate, respectively. Main appropriate indication in pre-labor group was other maternal indications (placenta previa and history of pelvic fracture S/P surgery), while fetal indications were the highest in intrapartum CS (non-reassuring fetal status).
Appropriate indication of CS was rarely evaluated in prior studies. About two decades ago, the multi-country WHO Global Survey found that only 1% of the CS were conducted without medical indication26. The appropriateness rate in this study differs from that of WHO study due to the difference in definition used. The WHO study defined non-medical indication as maternal request or no recorded indication, while we included other indications as inappropriateness. Moreover, the indications in the WHO Global Survey were not audited and thus reflect the indications as recorded in the medical record. However, the observed appropriateness in this study is closed to the recent study conducted in Saudi Arabia which focused on primary CS27. The appropriate indications of CS were 26.5% which is slightly lower than this study. This highlights that the criteria for appropriateness of CS indication might differ among countries due to the diverse contexts and clinical protocols used in each country or hospital. Comparisons must therefore be made with caution.
Appropriateness in the pre-labor CS group was only half of that in the intrapartum CS group. This underlines the urgent need for intervention in this group, particularly in RTGCS group 2b which pre-labor diagnosis of CPD was predominate. According to WHO19, CPD is diagnosed after women enter active phase of labor. For those antepartum diagnosis, however, we suspected that this would reflect that some providers exploited the term “CPD” in order to avoid using the term “maternal request” or for ease of managing providers’ schedules. This warrants further studies to understand the underlying dynamics for decision-making in pre-labor CS. There are many motivations influencing mothers’ preference for choosing CS such as fear of labor pains or misbelief that CS is safer than vaginal delivery28. In Thailand, the options and availability of pain relief during labor is very limited and, given the relevance of this factor, we recommend the serious consideration of interventions for this purpose. Therefore, implementing effective pain relief intervention is crucial. Furthermore, interventions to educate mothers regarding the risks associated with unnecessary CS and companionship to support women during labor maybe considered in order to amend this situation29. On the other hand, providers’ factors underpinning the increase of CS are more challenging to address. Opinion leaders, a person in the institute who has influence on their colleagues' attitudes and views, may play a significant role to enhance adherence to the standard guideline1. Opinion leaders can take a variety of actions to reduce CS rate such as promoting evidence-based practices, providing guidance, educating healthcare professionals, and advocating for policy changes. A policy for mandatory second opinion before conducting a pre-labor CS may be an intervention with potential to reduce unnecessary use1.
For intrapartum CS, in line with ours, fetal indications are the main appropriate indication reported by other studies30. This is probably because there is a clear standard definition of non-reassuring fetal status31. Among each group, the highest inappropriate rate was in CPD in RTGCS groups 1, 2a and 2b. Define the clear definitions for CPD and other maternal indications such as maternal short stature32 or failed induction33 may be beneficial to ameliorate the situation. Evidence-based clinical intrapartum care algorithms may also help healthcare providers decide a CS for women who need34. In order to enhance the adherence, audit and timely feedback to healthcare providers is crucial1. If we can increase the appropriateness by 50% more, the overall CS would be reduced from 25.3% to 16.4% in RTGCS 1–4 and 42.6% to 36.2% in all deliveries.
Our baseline evaluation of indications will serve to find specific interventions to reduce avoidable CS for the QUALI-DEC project. This is the first study proposing a category of borderline appropriate indications of CS which contributed to one-fourth of overall CS rate. This may be more practical and reflect the real-life situation since in some situations and circumstances, women may not meet the appropriate CS indication, but waiting for normal delivery may put them at higher risk.
The strength of our study includes the recruitment of all women in RTGCS groups 1–4 in the study period, hence no selection bias. However, the retrospective data collection might have some limitations pertaining to lacking some data including electronic fetal heart rate monitoring (EFHRM) records or evidence of maternal requesting for CS that was important to classify the appropriateness. Thirty-one (9.1%) of the selected CS could not be assessed due to missing information in the medical record. This is one of the very important issues that we should always emphasize for our trainees to complete all the information in the medical records. Analysis of women stratified by parity (nulliparous vs. multiparous) may yield more in-depth conclusions and recommendations in each group. Despite our attempt to stratify the data into various groups, our one-year data in 2020 from the QUALI-DEC project, we have very limited number of women in RTGCS groups 4a and 4b.
Low appropriate indications of women in RTGCS groups 1–4 lead to high CS rates. CS for maternal indications other than CPD had the lowest appropriateness rate. Increasing appropriateness of CS in women in RTGCS groups 1–4 will reduce unnecessary CS. Interventions focusing on reducing CS rate of women in RTGCS groups 1–4 by increasing appropriate indications are urgently required to achieve a rational and appropriate use of CS.
Data availability
Underlying data
Open Science Framework: Auditing cesarean section indications in women of Groups 1 to 4 of Robson's Ten-Group Classification System: A descriptive study at a university hospital in Thailand, https://doi.org/10.17605/OSF.IO/AMSFQ18.
This project contains the following underlying data:
Acknowledgements
The authors would like to thank the QUALI-DEC project for allowing the access to the overall Robson Classification data in 2020.
Faculty Opinions recommendedReferences
- 1.
World Health Organization: WHO recommendations on non-clinical interventions to reduce unnecessary caesarean sections. Geneva, Switzerland: World Health Organization; 2018. PubMed Abstract
- 2.
Boerma T, Ronsmans C, Melesse DY, et al.:
Global epidemiology of use of and disparities in caesarean sections.
Lancet.
2018; 392(10155): 1341–1348. PubMed Abstract
| Publisher Full Text
- 3.
Sandall J, Tribe RM, Avery L, et al.:
Short-term and long-term effects of caesarean section on the health of women and children.
Lancet.
2018; 392(10155): 1349–1357. PubMed Abstract
| Publisher Full Text
- 4.
Liabsuetrakul T, Sukmanee J, Thungthong J, et al.:
Trend of Cesarean Section Rates and Correlations with Adverse Maternal and Neonatal Outcomes: A Secondary Analysis of Thai Universal Coverage Scheme Data.
AJP Rep.
2019; 9(4): e328–e336. PubMed Abstract
| Publisher Full Text
| Free Full Text
- 5.
Mi J, Liu F:
Rate of caesarean section is alarming in China.
Lancet.
2014; 383(9927): 1463–1464. PubMed Abstract
| Publisher Full Text
- 6.
Mia MN, Islam MZ, Chowdhury MR, et al.:
Socio-demographic, health and institutional determinants of caesarean section among the poorest segment of the urban population: Evidence from selected slums in Dhaka, Bangladesh.
SSM Popul Health.
2019; 8: 100415. PubMed Abstract
| Publisher Full Text
| Free Full Text
- 7.
Zwecker P, Azoulay L, Abenhaim HA:
Effect of fear of litigation on obstetric care: A nationwide analysis on obstetric practice.
Am J Perinatol.
2011; 28(4): 277–84. PubMed Abstract
| Publisher Full Text
- 8.
Lin HC, Xirasagar S:
Institutional factors in cesarean delivery rates: Policy and research implications.
Obstet Gynecol.
2004; 103(1): 128–36. PubMed Abstract
| Publisher Full Text
- 9.
Opiyo N, Kingdon C, Oladapo OT, et al.:
Non-clinical interventions to reduce unnecessary caesarean sections: WHO recommendations.
Bull World Health Organ.
2020; 98(1): 66–68. PubMed Abstract
| Publisher Full Text
| Free Full Text
- 10.
Heaman M:
Making choices for childbirth: A randomized controlled trial of a decision-aid for informed birth after cesarean.
MCN Am J Matern Nurs.
2006; 31: 336. Reference Source
- 11.
Montgomery AA, Emmett CL, Fahey T, et al.:
Two decision aids for mode of delivery among women with previous caesarean section: Randomised controlled trial.
BMJ.
2007; 334(7607): 1305. PubMed Abstract
| Publisher Full Text
| Free Full Text
- 12.
Eden KB, Perrin NA, Vesco KK, et al.:
A Randomized Comparative Trial of Two Decision Tools for Pregnant Women with Prior Cesareans.
J Obstet Gynecol Neonatal Nurs.
2014; 43(5): 568–579. PubMed Abstract
| Publisher Full Text
- 13.
World Health Organization: WHO recommendations on health promotion interventions for maternal and newborn health. Geneva: World Health Organization; 2015. PubMed Abstract
- 14.
Bohren MA, Hofmeyr GJ, Sakala C, et al.:
Continuous support for women during childbirth.
Cochrane Database Syst Rev.
2017; 7(7): CD003766. PubMed Abstract
| Publisher Full Text
| Free Full Text
- 15.
Dumont A, Betrán AP, Kaboré C, et al.:
Implementation and evaluation of nonclinical interventions for appropriate use of cesarean section in low- And middle-income countries: Protocol for a multisite hybrid effectiveness-implementation type III trial.
Implement Sci.
2020; 15(1): 72. PubMed Abstract
| Publisher Full Text
| Free Full Text
- 16.
Kankoon N, Lumbiganon P, Kietpeerakool C, et al.:
Cesarean rates and severe maternal and neonatal outcomes according to the Robson 10-Group Classification System in Khon Kaen Province, Thailand.
Int J Gynaecol Obstet.
2018; 140(2): 191–197. PubMed Abstract
| Publisher Full Text
- 17.
World Health Organization: WHO statement on caesarean section rates. Geneva: World Health Organization;
Reprod Health Matters. 2015; 23(45): 145–50. PubMed Abstract
| Publisher Full Text
- 18.
Witsawapaisan W, Komwilaisak R, Sothornwit J, et al.:
Auditing cesarean section indications in women of Groups 1 to 4 of Robson’s Ten-Group Classification System: A descriptive study at a university hospital in Thailand. 2023. http://www.doi.org/10.17605/OSF.IO/AMSFQ
- 19.
World Health Organization: Intrapartum care for a positive childbirth experience. Geneva: World Health Organization; 2018. Reference Source
- 20.
World Health Organization: Robson classification: implementation manual. Geneva: World Health Organization; 2017. Reference Source
- 21.
Borisut P, Kovavisarach E:
Standard intrauterine growth curve of Thai neonates delivered at Rajavithi hospital.
J Med Assoc Thai.
2014; 97(8): 798–803. PubMed Abstract
- 22.
Han SN, Mhallem Gziri M, Van Calsteren K, et al.:
Cervical cancer in pregnant women: treat, wait or interrupt? Assessment of current clinical guidelines, innovations and controversies.
Ther Adv Med Oncol.
2013; 5(4): 211–9. PubMed Abstract
| Publisher Full Text
| Free Full Text
- 23.
ACOG Committee Opinion No. 751: Labor and Delivery Management of Women With Human Immunodeficiency Virus Infection.
Obstet Gynecol.
2018; 132(3): e131–e137. PubMed Abstract
| Publisher Full Text
- 24.
Daniel WW, Cross CL:
Biostatistics: a foundation for analysis in the health sciences. Wiley; 2018. Reference Source
- 25.
Glaz J, Sison CP:
Simultaneous confidence intervals for multinomial proportions.
J Stat Plan Inference.
1999; 82(1–2): 251–262. Publisher Full Text
- 26.
Souza JP, Gulmezoglu A, Lumbiganon P, et al.:
Caesarean section without medical indications is associated with an increased risk of adverse short-term maternal outcomes: the 2004-2008 WHO Global Survey on Maternal and Perinatal Health.
BMC Med.
2010; 8: 71. PubMed Abstract
| Publisher Full Text
| Free Full Text
- 27.
Saraya YS, Alashkar AH, Ali MA, et al.:
Indications and rate of first cesarean delivery in central region’s maternity and children hospital.
Saudi Med J.
2019; 40(12): 1251–1255. PubMed Abstract
| Publisher Full Text
| Free Full Text
- 28.
Colomar M, Opiyo N, Kingdon C, et al.:
Do women prefer caesarean sections? A qualitative evidence synthesis of their views and experiences.
PLoS One.
2021; 16(5): e0251072. PubMed Abstract
| Publisher Full Text
| Free Full Text
- 29.
ACOG Committee Opinion No. 761: Cesarean Delivery on Maternal Request.
Obstet Gynecol.
2019; 133(1): e73–e77. PubMed Abstract
| Publisher Full Text
- 30.
Begum T, Rahman A, Nababan H, et al.:
Indications and determinants of caesarean section delivery: Evidence from a population-based study in Matlab, Bangladesh.
PLoS One.
2017; 12(11): e0188074. PubMed Abstract
| Publisher Full Text
| Free Full Text
- 31.
Macones GA, Hankins GDV, Spong CY, et al.:
The 2008 National Institute of Child Health and Human Development Workshop Report on Electronic Fetal Monitoring: Update on Definitions, Interpretation, and Research Guidelines.
Obstet Gynecol.
2008; 112(3): 661–6. PubMed Abstract
| Publisher Full Text
- 32.
Toh-Adam R, Srisupundit K, Tongsong T:
Short stature as an independent risk factor for cephalopelvic disproportion in a country of relatively small-sized mothers.
Arch Gynecol Obstet.
2012; 285(6): 1513–6. PubMed Abstract
| Publisher Full Text
| Free Full Text
- 33.
Edwards N:
Safe prevention of the primary cesarean delivery.
AIMS J.
2014; 26: 20.
- 34.
Bonet M, Ciabati L, De Oliveira LL, et al.:
Constructing evidence-based clinical intrapartum care algorithms for decision-support tools.
BJOG.
2022. PubMed Abstract
| Publisher Full Text