Introduction
During the past five decades, long processes of de/re-industrialization brought the importance of workforce’s skills to the forefront (Thrift, 2008). In the current unstable conjuncture, which has been marked by successive crises, including the 2008/09 Global Crisis, the COVID-19 pandemic, and the subsequent energy crisis, governments and regulatory bodies keep stressing the importance of new hard skills—often associated with the digital and green transitions—as well as soft skills related to problem-solving and adaptability to changing conditions (McGuinness et al., 2018). Indicatively, the European Commission (EC) has published relevant agendas (EC, 2016; EC, 2020), while it proclaimed 2023 as the “European Year of Skills.” EC’s targets for up-/re-skilling initiatives and its policy toolkits strongly resonate with the basic tenets of Human Capital Theory (HCT from now on; Becker, 1964; Mincer, 1958). In this context, investment in education and VET (Vocational Education and Training) is presented not only as a way for employees to improve their skills and competencies but also as a means for upgrading human capital overall, which can lead to economic growth (EC, 2016; EC, 2020).
Despite the above, there are still significant skill mismatches in many European regions, which the EU is trying to alleviate by better linking education and employment, supporting training programmes, and promoting labour mobility. Notably, a key factor in the Europe 2020 Strategy for achieving dynamic labour markets and efficient job matching is labour mobility (European Commission, 2012); to this end, the EU has launched the EURES (EURopean Employment Services) platform and EPALE (Electronic Platform for Adult Learning in Europe). Yet, such efforts have brought varying results, given regional differences overall, including in educational structures. Such differences can reproduce unequal social relations (Galiakberova, 2019), and ultimately, have led to a highly uneven geography of mismatches. In addition, from the perspective of Geographical Political Economy, beyond differences in regulatory, educational, or industrial structures, the very decisions of local, non-business actors regarding education are not always rational and are crucially influenced by the trajectories of globalization, reproducing spatial inequalities all over again (Teixeira, 2022). Notably, most dominant theories related to skills and education are not clearly evidence-based (Tan, 2014; Teixeira, 2022), while empirical research on skill supply and demand has produced several contradictory findings (Brunello & Wruuck, 2021; McGuinness et al., 2018; Sala, 2011).
In an effort to offer a fresh eye on the literature’s contradictory results and rectify its gaps, the paper at hand examines the regional allocation of highly educated workers and examines where they tend to be employed in high-, medium-, and low-skill occupations. This research subject is particularly crucial, considering that overskilling indicates severe short- and long-term consequences. To do so, the paper develops a conceptual framework that combines Geographical Political Economy and human capital-related theorizations. Then, it conducts a comparative empirical analysis that utilises the Location Quotient Index (LQ from now on) for the period 2009–2021 and on 5 countries (Greece, Bulgaria, France, Germany, and Denmark), with the results of this analysis being subsequently correlated with several macroeconomic, population, and demographic metrics that pertain to factors that influence the spatial allocation of workforce skills. Given that the study at hand is conducted for the European Reform University Alliance (ERUA), it is geographically focused on the countries where the Alliance’s universities are based. Specifically, the Alliance comprises universities based on North and South Aegean in Greece, Ιle de France, Yugozapaden in Bulgaria, Freiburg in Germany, and Sjlland in Denmark; throughout the analysis, particular emphasis is put upon these regions.
Our study concludes that five factors are decisive for workforce skills’ geographical and functional allocation: economic dynamism at the national level, regional industrial composition, level of urbanization, demographics, and institutional characteristics. Moreover, it underlines that the mechanisms of human capital development tend to reproduce uneven development rather than ameliorating spatial inequalities.
The above outlines our paper’s multifarious contribution. On the one hand, it offers valuable insight into the negative externalities associated with skill mismatches, taking into account Europe’s different socio-economic models and school-to-work regimes (Pohl & Walther, 2007), as these have been identified in the literature (i.e., Nordic, Continental European, Mediterranean and post-socialist; Farkas, 2011). At the same time, studying skill gaps in ERUA’s associated regions strengthens the Alliance itself and helps bridging existing inequalities; more broadly, this is a crucial contribution to the EU’s European Universities initiative.
The paper is structured as follows. The next section provides a theoretical framework on education and skills in the labour market and develops a conceptual framework based on approaches from Geographical Political Economy and elements from HCT, the concept of optimal allocation, the Job Competition Model, and the Assignment Models. Then it lays out the methodology and presents the results of the empirical analysis. Finally, the key findings are discussed within the context of the relevant literature, while the paper closes with brief conclusions that include a set of policy recommendations.
Human Capital and its uneven spatial distribution: theoretical considerations and a tentative conceptual framework
In general, the skills, competencies, and knowledge required by the workforce are determined by the tasks each worker must undertake for their position and the industry in which they work (Giouli et al., 2021). There are two broad categories of skills. Hard skills are those required to perform a certain job, including for instance language proficiency, expertise on certain software, technical skills, etc. (McGuinness et al., 2018). As these skills are acquired mostly through formal education, (re)training, and on-the-job experience, they are measurable through academic degrees and various types of certificates. Given the latter, this is the type of skills this paper will mostly focus on. Nevertheless, soft skills—also known as non-cognitive skills or interpersonal and personal skills—complement hard skills and are basic competencies needed in the workplace, even if they are not tied to a specific job. Under this category, communication, teamwork, and organizational skills are included, being actively sought after by employers regardless of the sector or occupation (McGuinness et al., ibid). Overall, the development of both hard and soft skills is closely linked to better career prospects, either in waged positions or in self-employment (Vinayan et al., 2020).
To engage with the necessary skills required in the workplace, the relevant literature has developed numerous theories. Although having appeared early after WWII, HCT still has a firm grasp on the public discourse and policy documents. Postulating that wage income is a function of education and work experience, HCT highlights the importance of individual educational attainment (Mincer, 1958). Specifically, education increases skills and thus productivity, which is then rewarded with a higher income (Becker, 1964). In fact, the level of education of a workforce remains crucial also on a broader note, as it increases national income and ultimately generates multiplier effects (Pritchett, 2001). Therefore, education is not only crucial for the workers themselves, but also for economies (Tan, 2014). To maximize the effects of higher educational attainment, however, talent has to be allocated in an optimal way, namely, a worker must employ their skills in the most appropriate setting. It is then through the optimal allocation of talent that a higher educational attainment level generates individual and social returns (Acemoglu, 1995).
Despite the undeniable importance of education for developing the necessary skills, skill mismatches are common, pointing to labour markets being rather imperfect in their nature (Teixeira, 2022). Two broad types of mismatches appear in literature. On the one hand, horizontal mismatches refer to cases where workers are engaged in activities outside their field of education and skills. Extensive horizontal mismatches constitute a distortion in the ideal geographical and functional allocation of human capital, reducing the productivity of firms and economic systems in general, and more importantly, profoundly diminishing an economy’s capacity to adapt to gradual restructuring processes or sudden shocks (Brunello & Wruuck, 2021). On the other hand, vertical mismatches refer to cases where workers engage in activities that do not match their skill level, namely they are either over- or underqualified for the tasks they perform. Although both instances bear significant consequences for the individual, the firm, and the economy, the paper at hand focuses on overskilling. Otherwise coined as surplus human capital (Zhu & Chen, 2016), it has a negative impact on an individual’s wages and job satisfaction (McGuinness & Wooden, 2009). Specifically, overskilled workers tend to earn less than those who are in a position matching their skills, tend to have lower satisfaction levels, and are overall more inclined to quit their job. Importantly, they are less keen on acquiring new competences, despite their high education not protecting them from skill obsolescence (Somers et al., 2019). As such, overskilling diminishes employment prospects in the long run, as it undermines incentives for young people to continue investing in human capital (Cedefop, 2015). Many studies have shown that vulnerable groups such as migrants, women and young people are more often trapped in such situations (Cedefop, 2014). For firms, overskilling indicates an untapped potential that is underutilized or not used at all, lowers productivity as their staff is dissatisfied, and limits their adaptation strategies as overskilled workers are reluctant to retrain (Brunello & Wruuck, 2021). On a wider note, for national economies, firms’ lower productivity erodes competitiveness and investments in education are not returned into the economy (McGuinness et al., 2018).
Various factors shape the widely documented uneven geography of skills and their mismatches (Alamá-Sabater et al., 2024; Cedefop, 2010). Importantly, regional mismatches can be greatly affected by the robustness (or lack thereof) of the broader national economy. In underdeveloped countries, for instance, talent is more starkly concentrated in spatial and sectoral terms, leading to greater cross-sectoral asymmetries in productivity (Porzio, 2017). In contrast, in developed countries, which are characterized by more dynamic economies, talent is more optimally allocated; however, for this to occur institutional barriers have to be low (Allen et al., 2013). At the regional level, the dynamism of an economy is equally crucial. Capital- and technology-intensive activities tend to concentrate in already advanced regions, fueling new rounds of uneven development (Viñuela-Jiménez et al., 2010). As such, metropolitan areas with a diverse economic base concentrate human capital, cutting-edge technology, and finance-related activities, while economically backward and declining regions become even more disconnected from knowledge and innovation (Feldman et al., 2021). Similarly, developed industrial regions tend to attract new activities, workforce, and capital, as they further industrialise (Boudeville, 1968), although in many cases they also spill over positive effects to their surrounding areas (Perroux, 1955). However, in most cases, while the latter regions enter virtuous cycles of regional growth, others—mainly peripheral, rural and less developed regions (MacKinnon et al., 2022)—are locked in vicious cycles due to outdated technology, institutional weaknesses and other factors (Rodríguez-Pose et al., 2023). In the above, apart from the dynamism of a regional industrial structure, the sectoral specialization per se plays a key role. Characteristically, sectors like accommodation and catering, commerce and storage, and transportation, are reported to suffer greater skill mismatches—both horizontal and vertical—than others (Chłoń-Domińczak & Żurawski, 2017).
Having said the above, even within regions where significant volumes of high-skilled workers are employed, labour markets have become increasingly polarized, as different fractions of capital seek for both cheap and skilled workers (Capsada-Munsech & Valiente, 2020; Teixeira, 2022). Such segmentation is crucially sustained by dual human capital development mechanisms. Namely, next to a robust education system, a training system that focuses more on vocational training and apprenticeship initiatives is formed, serving as a channel for precarious labour (Teixeira, 2019). Nevertheless, dual educational systems such as Germany’s have also been praised for their positive effects in school-to-work transitions, albeit having been oversimplified in the relevant literature (Deissinger, 2015). Similarly praised is the universalistic regime in Nordic countries like Denmark, which invest in human capital and match high levels of educational attainment with demand for such workers (Hadjivassiliou et al., 2019). Beyond educational systems, a number of policy and governance factors can shape youth transition regimes. Indicatively, the role of institutions and stakeholders in counselling and supporting graduates ameliorates or exacerbates spatial disparities in skill mismatches (Ali, 2014); in statist regimes, for instance, employers are not sufficiently involved in matching skills’ demand and supply (Capsada-Munsech & Valiente, 2020). As such, in the sub-protective regime of the Mediterranean EU, in countries like Greece, youth transitions to adulthood are long and problematic (Emmanouil et al., 2023). This leads to a large pool of highly qualified people who either cannot find a job, have a profession for which they are overqualified, or have a profession in a different sector from the one in which they were trained, while at the same time many companies are struggling to fill their vacancies (Biagi et al., 2020). Similar phenomena of weak linkages between education and labor market, high levels of temporary employment, extensive skill mismatches and low labor demand characterize the post-socialist regime in countries like Bulgaria (Hadjivassiliou et al., 2019).
Beyond the national and regional factors, sudden shocks of economic or other nature, as well as structural transitions, directly contribute to increasing skill mismatches (Cedefop, 2015). Indeed, the 2008/2009 Global Crisis led to a concerted slashing of public spending on education, impacting on human capital profoundly in the following years (Gourzis & Gialis, 2019). Beyond cuts in public expenses, recession has been found to severely diminish the capacity of policies that are already in place to bring significant effect, especially in the regions lagging behind (Capsada-Munsech & Valiente, 2020; Rodríguez-Pose et al., 2023). On another note, digitalization is predicted to lead to a significant increase in highly skilled occupations, particularly in healthcare and digital technology (Lund et al., 2021), while the number of low and medium-skilled occupations (including many administrative, clerical and manual jobs) is expected to decline, leading to an increasing polarization of the labour market (Chiacchio et al., 2018). Similarly, the green transition will deeply affect jobs in the fossil fuel sectors, affecting certain labour markets disproportionately (Bednorz & Sadauskaitė, 2022). This stresses that the study of the uneven geography of skills and their mismatches is crucially relevant than ever given the new and challenging conditions facing the labour force. Indeed, the Great Recession that began in 2008, the Covid pandemic and the challenges of the twin transitions (the nexus of digitalization and green transformation) have already had and will continue to have a significant impact on labour markets and workplace rules, as they lead to structural changes that affect countries and regions unevenly.
Lastly, it must be mentioned that all the above factors are often shaped through diachronic processes and path dependencies, which can be region-specific or not. For instance, a region’s industrial heritage may have shaped a workforce of high level skills, granting it the capacity to adapt to new demands for higher value added industrial activities. In contrast, regions that are less advanced, having diachronically hosted less innovative, technologically backward sectors may not have this capacity (Calcagnini et al., 2021).
Overall, approaching the equilibrium between the supply and demand of skills within an “institutional vacuum” context—namely, detached from processes outside the market and without considering the broader power relations in place (Psilos & Gereffi, 2011)—is unrealistic. This means that skills and labour are constantly influenced by broader processes including demographic and socio-economic changes, institutional settings, and the field of reproduction, which includes family and peer pressure, cultural practices, etc. (Peck & Smucker, 1998). The above attempt to outline how the development of skills is an inherently social process, brought about and maintained by hierarchical power relations within and outside labour markets (Galiakberova, 2019). The influence of powerful non-entrepreneurial actors is key in shaping human capital, as fittingly described by theorizations around Local Labour Regimes (Werner, 2019). Similarly, labour force development is not an equal opportunity field, but rather depends on characteristics such as class, race, gender, ethnicity and migrant status. In fact, labour force development plays a key role in perpetuating—not only social inequalities but also—labour market segmentation (Teixeira, 2022). The above imply that many reproducing mechanisms of the geography of skill mismatches fuel spatial inequalities by favouring economic stability and growth for certain regions at the expense of others (Teixeira, 2022).
Methodological remarks
The aim of this paper is to study and contextualize the uneven geography of skill mismatches, focusing on highly educated workers. To do so, it first calculates the concentrations of workers with high levels of education in low, medium, and high skill-level occupations. The focus on the workers with high education levels serves in examining the contested issue of overskilling (Brunello & Wruuck, 2021). The severe short- and long-term consequences of overskilling, as indicated in the literature, underline the high scientific importance and policy relevance of this objective. Then, to contextualize the observed uneven geography of skill mismatches, the paper employs a simple correlation analysis, considering various economic, demographic, and spatial metrics that represent crucial underlying factors.
The analysis is conducted at the regional level (NUTS-2) and its geographical scope covers five countries: Greece, Bulgaria, France, Germany, and Denmark. These were chosen on the basis that they represent the main educational/employment regimes in Europe: the universalistic of the Nordic countries, the employment-centered of Continental Europe, the sub-protective of the Mediterranean countries, and the post-socialist of Eastern Europe (Farkas, 2011; Pohl & Walther 2007). While both France and Germany fall under the Continental model, they are both analyzed due to their stark differences in terms of their wage structures (Hein & Vogel, 2009) and educational models (O’Reilly et al., 2019). Given the research’s geographical scope covering all main European regimes pertaining to employment and skills, its findings can be contextualized more broadly and provide insight into the EU as a whole. At various points, we focus on the six regions that are specifically related to the ReERUA Horizon Project, in the frame of which the analysis at hand is conducted. These are the North and South Aegean regions in Greece, Île-de-France in France, Yugozapaden in Bulgaria, Freiburg in Germany, and Sjlland in Denmark (see Figure 1). These regions place particular emphasis on the knowledge that comes from their educational institutions; at the same time, they are developing strong knowledge networks within the ReERUA consortium, despite having very different socio-economic structures. As such, they constitute interesting case studies, especially when seen within their broader context.
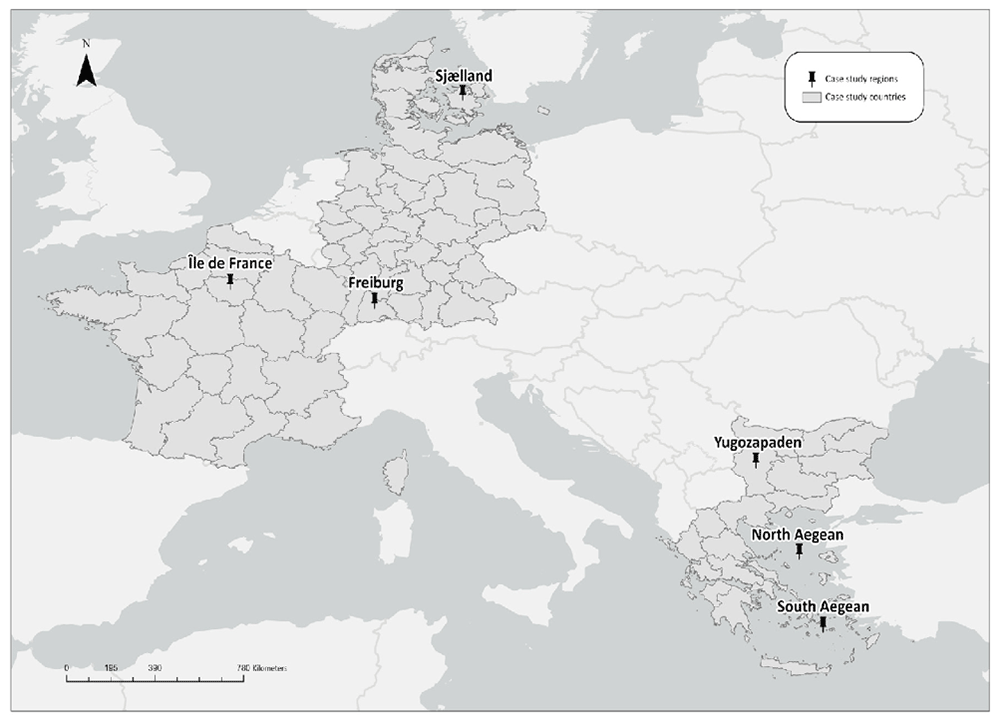
Figure 1. Regions related to the ReERUA Horizon Project.
Source: Own elaboration.
The analysis is conducted for two years (2009 and 2021), which essentially allows for a comparison between the onset of the 2008/2009 Global crisis and the most recent available data at the time of the analysis’s writing. This temporal scope covers a long period characterized by successive challenges for regional and national economies across the EU, including the Great Recession, which lasted from 2009 until 2013–14 for most European economies, a period of partial recovery between 2015 and 2019, and the two pandemic years (2020 and 2021; Herod et al., 2021). As such, this study elucidates the extent of regions’ resilience amidst recessive pressures of various forms.
Data on the matching between highly educated workers and low, medium, and high skill-level occupations are directly calculated by Eurostat,1 based on its Labour Force Survey. It must be mentioned here that data on highly educated workers in low-skill occupations display many missing values (as evident in Figure 2a and Figure 2b); therefore, results of that part of the analysis must be approached with caution. Eurostat’s sample covers all employed persons of both genders, aged 15 and above. Data imputation methods were not used, given that the extent of missing data is limited and most missing values refer to a specific type of skill mismatch (highly educated workers in low skill-level occupations), making most such methods unreliable.
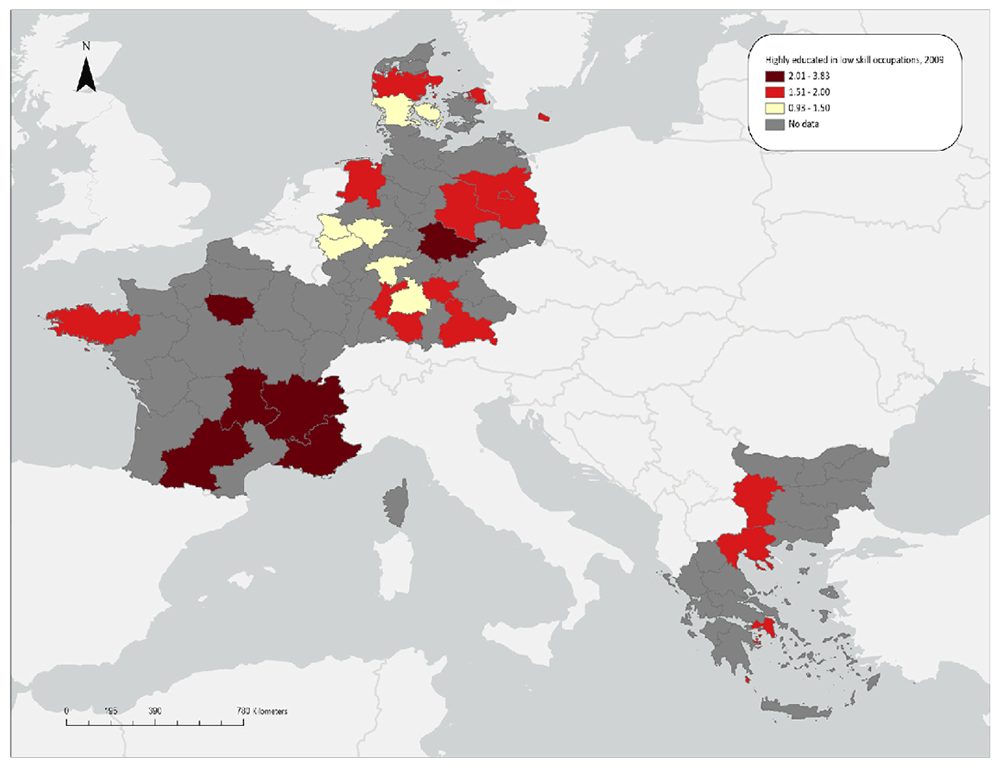
Figure 2a. Over/under-concentrations of highly educated workers in low skill-level occupations, relative regional concentrations 2009.
Source: Own elaboration based on Eurostat data.
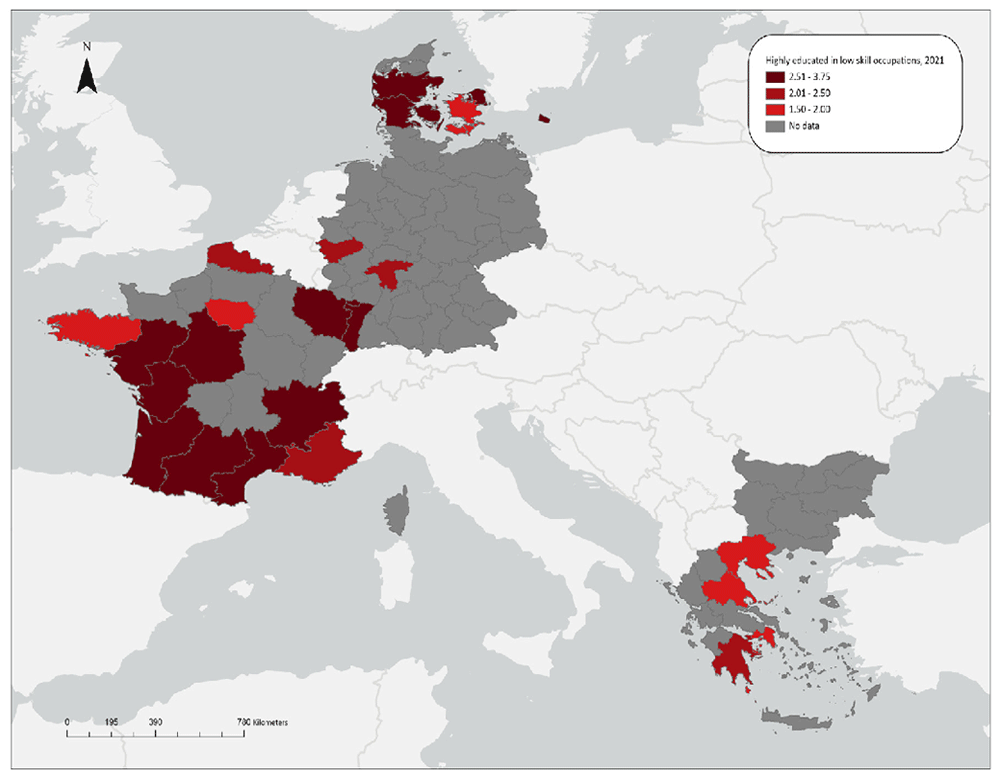
Figure 2b. Over/under concentration of highly educated employed persons in low skill occupations, relative regional concentrations, 2021.
Source: Own elaboration based on Eurostat data.
To identify regional concentrations of education/skills per level we calculate the Location Quotient Index (LQ). In general, the LQ highlights the relative concentration of a group within a region compared to its wider context; e.g., the share of industrial workers within a region divided by the respective share at the national level. Here, the LQ index is calculated by dividing the regional shares by the aggregate transnational share of the five countries under study; this serves in directly comparing skill mismatches between European regions. The LQ in the frame of this study shows the relative-to-transnational concentration of highly-educated employed persons in occupations requiring low [LQ(L)], medium [LQ(M)] and high [LQ(H)] skill levels, calculated through the following formulas (1.1, 1.2 and 1.3 respectively). This way, we find where each type of skill (mis)match is mostly concentrated. In our analysis, values between 0.85 and 1.15 are treated as being close to the average share, values above 1.15 indicate an over-concentration, while values below 0.85 show under-concentration.
where E
LR is the number of employed persons with high educational attainment in low skill-level occupations in region R, E
R is the total employed population in region R, E
LN is the number of employed persons with high educational attainment in low-skill level occupations in all study countries (N), and E
N is the employed population in all study countries (N).
where E
MR is the number of employed persons with high educational attainment in medium skill-level occupations in region R, E
R is—as above—the total employed population in region R, E
MN is the number of employed persons with high educational attainment in medium skill-level occupations in all countries under study (N), and E
N is as above the employed population in all countries under study (N).
where E
HR is the number of employed persons with high educational attainment in high skill-level occupations in region R, E
R is—as above—the total employed population in region R, E
HN is the number of employed persons with high educational attainment in high skill-level occupations in all countries under study (N), and E
N is, as above, the employed population in all countries under study (N).
Apart from calculating the relative regional concentrations using the above formulas (as shown in Figure 2–Figure 4), the paper at hand provides the respective shares of highly educated workers, as allocated in low, medium, and high skill-level occupations (as shown in Annex 1). Doing so, the paper shows the extent of skill mismatches within each region under study.
To distinguish occupations by skill level, Eurostat follows the International Standard Classification of Occupations (ISCO-08) of the International Labour Organization (ILO, 2025). Specifically, occupations are classified as of high skill-level if they correspond to ISCO occupational groups 1 to 3 (managerial and scientific positions), of medium skill-level when they correspond to ISCO levels 4 and 8 (intermediate level manual and non-manual positions), and of low skill-level if they correspond to ISCO level 9 (entry level manual and non-manual positions; see Annex 1). The classification of skill levels was carried out at our request by Eurostat itself, to eliminate the risk of misjudging skill levels and to increase the reliability of the mismatch index. Also, as the focus of this paper is on the regional level, our analysis cannot include skill mismatches by sector and region, given that this would lead to extensive data fragmentation and therefore to issues of reliability and missing values.
To distinguish education levels, Eurostat follows UNESCO’s (2012) classification. Specifically, the education level is designated as high if it corresponds to ISCED levels 6 to 8 (tertiary education: from bachelor’s degree to doctorate or equivalent), medium if it corresponds to ISCED levels 3 to 5 (upper secondary to post-secondary education, including short tertiary education), and low if it corresponds to ISCED levels 0 to 2 (pre-school to lower secondary).
Regarding the correlation analysis, the research at hand statistically associates the LQ values of the above analysis with crucial factors underlying the geographical allocation of skills as noted in the relevant literature (e.g. Cedefop, 2010). Specifically, it links the LQL, LQM, and LQH with regional and national GDP (both total and per capita), the European Commission’s Regional Innovation Index, urbanization levels,2 the Ageing Index,3 and the Dependency Index4 (see Table 1). All metrics were retrieved from Eurostat and were calculated for the years 2009 and 2021 at the regional level, except for the Regional Innovation Index, which was retrieved from the European Commission5 and is available only for 2021. The value of the correlation coefficient (Pearson’s r) between two variables ranges from -1 to 1: a coefficient of +1 shows a perfectly positive linear correlation, while a coefficient of -1 shows a perfectly negative linear correlation. A value of 0 means that there is no correlation between the two variables tested (Gialis & Taylor, 2016).
Table 1. Correlation matrix of several factors that influence the spatial allocation of workforce skills.
Source: Own elaboration based on Eurostat and European Commission data.
concentrations of skil
(mis)matches | LQH
(2009) | LQH
(2021) | LQM
(2009) | LQM
(2021) | LQL
(2009) | LQL
(2021) | LQH
(2021-2009) | LQM
(2021-2009) | LQL
(2021-2009) |
|---|
| underlying factors |
|---|
| pc GDP national (2009) | 0.34 | 0.30 | 0.15 | -0.33 | 0.16 | 0.26 | 0.00 | -0.37 | 0.12 |
| pc GDP national (2021) | 0.39 | 0.28 | 0.23 | -0.60 | 0.16 | 0.11 | -0.13 | -0.64 | -0.01 |
| pc GDP national (2021-2009) | 0.35 | 0.18 | 0.26 | -0.78 | 0.12 | -0.09 | -0.25 | -0.82 | -0.17 |
| total GDP national (2009) | 0.20 | 0.16 | 0.49 | -0.42 | 0.09 | -0.15 | -0.05 | -0.64 | -0.20 |
| total GDP national (2021) | 0.19 | 0.11 | 0.46 | -0.49 | 0.08 | -0.20 | -0.12 | -0.68 | -0.24 |
| total GDP national (2021-2009) | 0.16 | 0.01 | 0.40 | -0.59 | 0.06 | -0.29 | -0.24 | -0.73 | -0.30 |
| total GDP regional (2009) | 0.55 | 0.58 | 0.23 | 0.00 | 0.47 | 0.30 | 0.14 | -0.14 | -0.06 |
| total GDP regional (2021) | 0.57 | 0.58 | 0.24 | -0.07 | 0.48 | 0.27 | 0.11 | -0.20 | -0.10 |
| total GDP regional (2021-2009) | 0.57 | 0.53 | 0.23 | -0.24 | 0.46 | 0.16 | 0.02 | -0.34 | -0.18 |
| pc GDP regional (2009) | 0.50 | 0.50 | 0.06 | -0.30 | 0.29 | 0.25 | 0.08 | -0.30 | 0.01 |
| pc GDP regional (2021) | 0.54 | 0.47 | 0.16 | -0.50 | 0.29 | 0.13 | -0.03 | -0.52 | -0.09 |
| pc GDP regional (2021-2009) | 0.48 | 0.34 | 0.26 | -0.68 | 0.23 | -0.06 | -0.18 | -0.73 | -0.22 |
| Innovation Index (2021) | 0.58 | 0.44 | 0.37 | -0.36 | 0.37 | 0.15 | -0.15 | -0.52 | -0.13 |
| Urbanization (2009) | 0.43 | 0.35 | 0.01 | -0.11 | 0.16 | -0.05 | -0.06 | -0.09 | -0.16 |
| Urbanization (2021) | 0.43 | 0.36 | 0.00 | -0.11 | 0.16 | -0.05 | -0.06 | -0.10 | -0.16 |
| Urbanization (2021-2009) | 0.40 | 0.35 | -0.02 | -0.13 | 0.11 | -0.03 | -0.02 | -0.10 | -0.10 |
| Ageing Index (2009) | -0.09 | -0.40 | 0.17 | -0.17 | -0.09 | -0.45 | -0.57 | -0.24 | -0.33 |
| Ageing Index (2021) | -0.30 | -0.54 | 0.06 | -0.05 | -0.18 | -0.42 | -0.47 | -0.08 | -0.25 |
| Ageing Index (2021-2009) | -0.35 | -0.14 | -0.22 | 0.25 | -0.13 | 0.16 | 0.31 | 0.34 | 0.24 |
| Dependency Index (2009) | -0.25 | -0.08 | -0.02 | 0.17 | -0.17 | 0.25 | 0.27 | 0.16 | 0.35 |
| Dependency Index (2021) | -0.08 | 0.04 | 0.14 | 0.43 | -0.08 | 0.31 | 0.21 | 0.29 | 0.34 |
| Dependency Index (2009-2021) | 0.12 | 0.13 | 0.21 | 0.42 | 0.05 | 0.19 | 0.04 | 0.24 | 0.13 |
An analysis of highly educated workers per occupational skill level from a cross-regional perspective
Highly educated workers in low skill-level occupations
LQL shows the relative regional concentration of highly educated employed persons in low skill-level occupations. Paradoxically, in both Figure 2a and Figure 2b, LQ scores fluctuate exclusively above 1, indicating over-concentrations in all regions for which data were available. The reason for this is because the phenomenon of highly educated workers being employed in low skill-level occupations is inherently limited. As a result, regions with a small number of such workers, which would exhibit LQ scores below 1, have a non-statistically significant sample, thus data for them is missing. Conversely, the available data allows for observing where highly educated workers are over-concentrated in low skill-level occupations. As such, in 2009, ove-rconcentration of this phenomenon was mostly observed in Île-de-France (LQ=2.62) and in the southern regions of France, namely the agricultural regions of Midi-Pyrénées (LQ=3.42) and Auvergne (LQ=3.83), in the affluent region of Rhone-Alpes (LQ=2.36), and in the touristic region of Provence-Alpes-Côte d’Azur (LQ=2.52). Similar trends can also be observed in Thuringia (LQ=2.21), a region in Germany known for its university, the Greek capital region of Attiki (LQ=1.97), and the capital region of Bulgaria Yugozapaden (LQ=1.81). For 2021, we can see that in all French regions for which data are available LQ values are particularly high (above 2.15). Other regions with even higher LQ values are Hovedstaden (LQ=3.30) and Midtjyllan (LQ=3.25) in Denmark.
Highly educated workers in medium skill-level occupations
LQM for 2009 shows that five German regions (Leipzig, Chemnitz, Brandenburg, Dresden, Mecklenburg-Vorpommern and Dresden) stand out in terms of concentrating highly educated workers in medium skill-level occupations, with LQ values around 1.30. Additionally, three regions in the southern part of France (Midi-Pyrénées, Languedoc-Roussillon, Provence-Alpes-Côte d’Azur) exhibit a similarly mild over-concentration. All other regions stay close to the aggregate average of the countries under study. In the regions related to the ReERUA Project, this type of matching is not extensive. Specifically, under-concentration of this type of skill mismatch is observed in North and South Aegean in Greece and Sjaelland in Denmark, while Freiburg and Île-de-France have values close to 1 (Figure 3a, Annex 1).
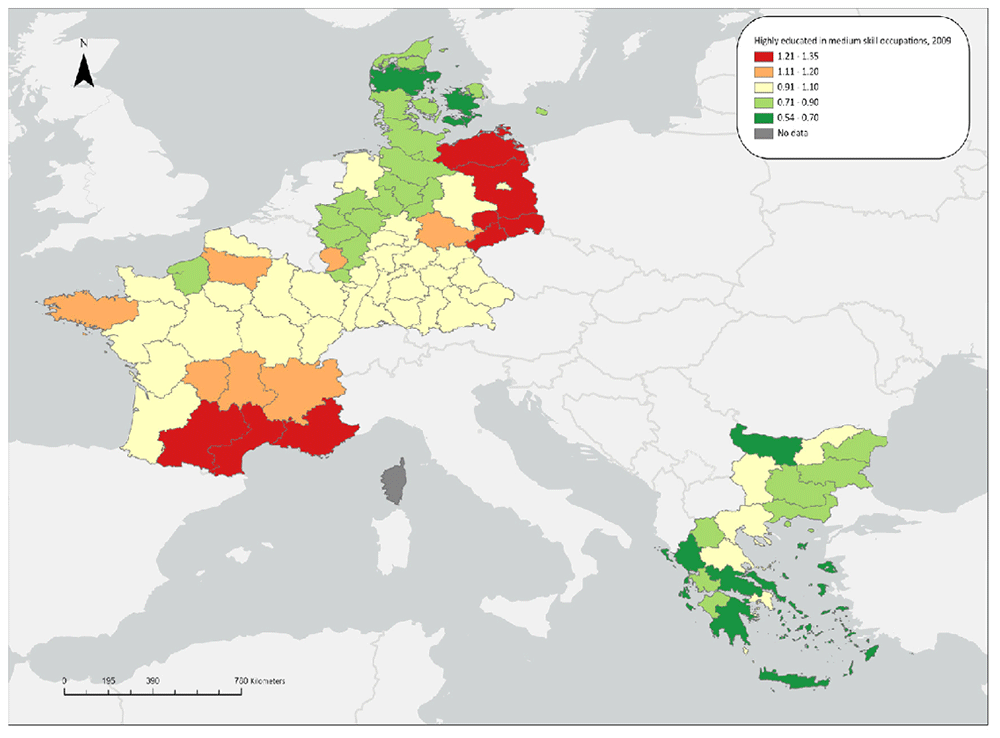
Figure 3a. Over/under concentration of highly educated persons in middle skill occupations, relative regional concentrations, 2009.
Source: Own elaboration based on Eurostat data.
In 2021, the overall number of regions exhibiting over-concentration increased. However, Attica stands out (LQ=2.06), as well as the rest of the Greek regions, which show similar trends with the exception of the rural North Aegean (LQ=1.06). German regions have low or close to the aggregate average shares, including Freiburg. The same applies for Denmark; indicatively, the highest value in the country can be found in Hovedstaden (LQ=0.82). In France, most regions exhibit an over-concentration; only seven regions are exceptions to this, having shares close to the aggregate average, including Île-de-France (Figure 3b).
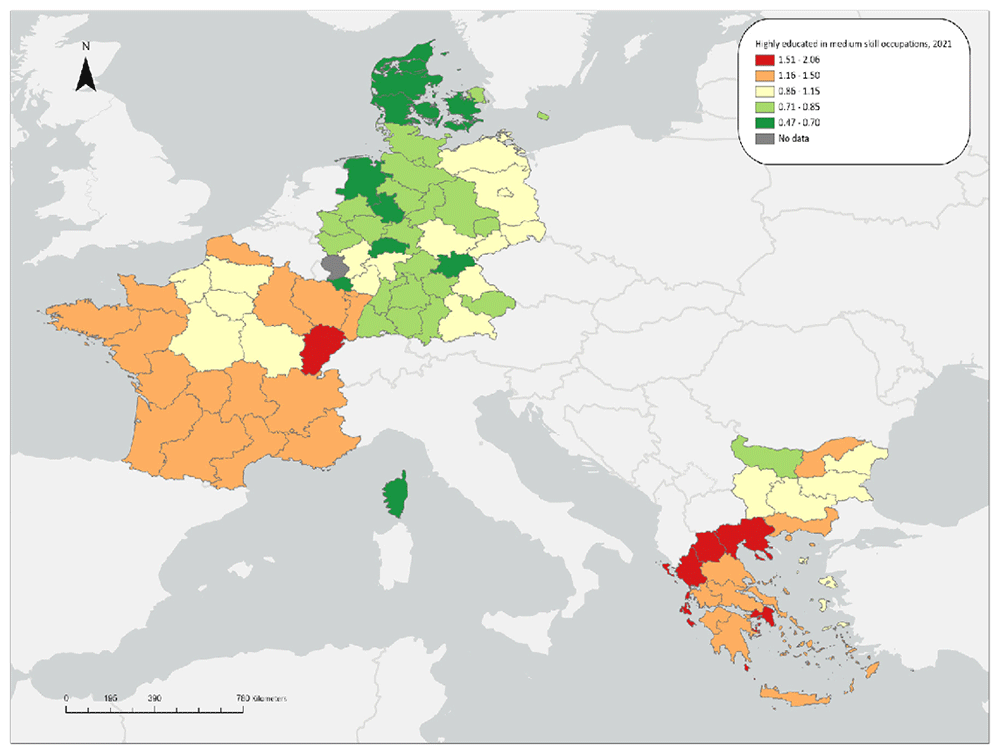
Figure 3b. Over/under concentration of highly educated persons in middle skill occupations, relative regional concentrations, 2021.
Source: Own elaboration based on Eurostat data.
Highly educated workers in high skill level occupations
For 2009, almost all capital regions of the countries under study exhibit notable over-concentrations (1.25 in Yugozapaden, 1.55 in Île-de-France, 1.43 in Berlin and 1.50 in Hovedstaden), except for Attica in Greece, whose share is close to the aggregate average. Most other regions in the countries under study display medium or low LQ scores, with the exception of Leipzig and Midi-Pyrénées (Figure 4a). This pattern remains almost unchanged in 2021. An exception to this is Rhône-Alpes, one of the “four Motors for Europe”, which shows an over-concentration of highly educated workers in high-skill level occupations, illustrating the long-standing concentration of these workers in metropolitan, highly industrialized and research-oriented regions. Finally, as far as the ReERUA-related regions are concerned, the remote North and South Aegean exhibit a notable under-concentration (0.69 and 0.58 respectively), Sjlland and Freiburg exhibit average LQ scores, while Île-de-France has the highest value (LQ=1.69) among all regions under study (Figure 4b, Annex 1).
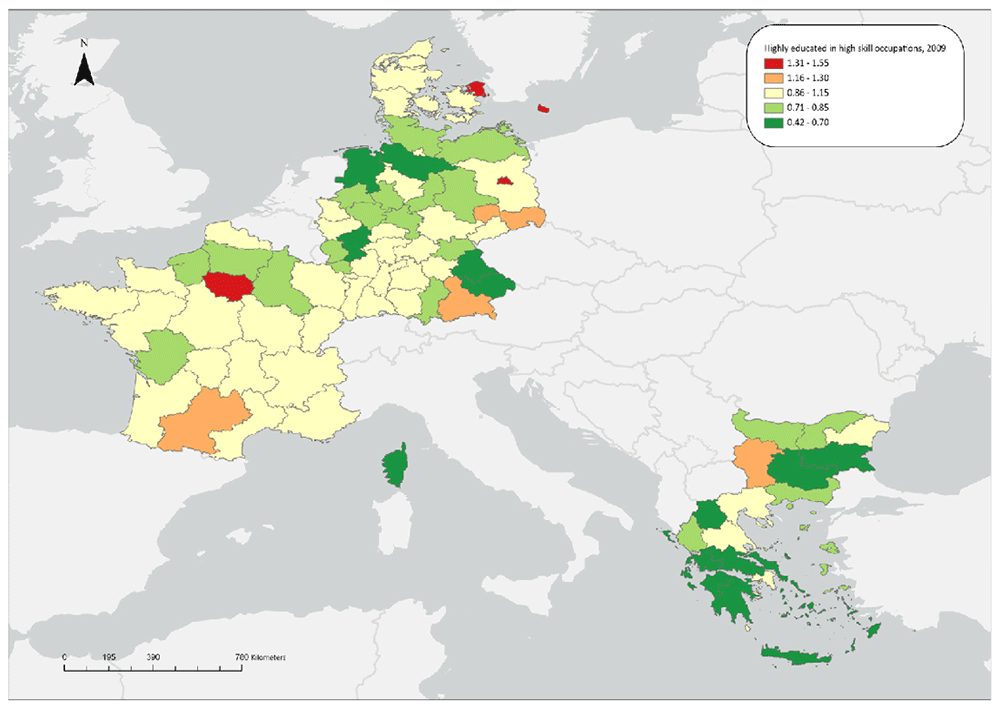
Figure 4a. Over/under concentration of highly educated employed persons in high skill occupations, relative regional concentrations, 2009.
Source: Own elaboration based on Eurostat data.
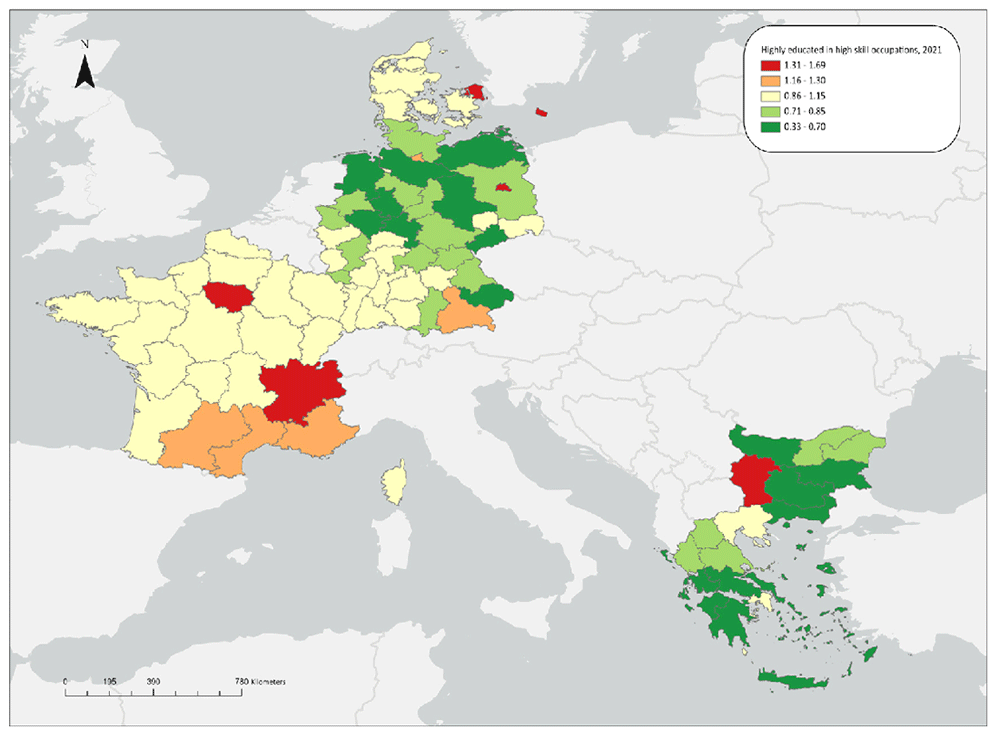
Figure 4b. Over/under concentration of highly educated employed persons in high skill occupations, relative regional concentrations, 2021.
Source: Own elaboration based on Eurostat data.
Contextualizing the uneven geography of skill mismatches
The correlation matrix (Table 1) reveals an important correlation between LQH scores in 2009 and 2021 and total regional GDP, including the latter’s change over the study period (2009–2021). Similar correlations, albeit mostly milder, are observed between LQH scores and regional GDP per capita. In contrast, correlations between LQH scores and national GDP (both total and per capita) cannot be regarded as significant. The above findings indicate that perfect skill matching can mainly be observed in regions with robust economies, regardless if they are located in countries that are not as economically dynamic. A moderate positive correlation can also be observed between LQH scores (for both years under study) and population density in 2009. Although Pearson’s R values diminish when looking into the respective correlation for 2021, the importance of urbanization levels in efficient skill matching is nevertheless highlighted. Conversely, a remarkable negative correlation between LQH scores and the ageing index is evident in Table 1. In fact, this link is consolidating over time, as it becomes stronger for LQ and the Ageing Index’s values in 2021. Another interesting observation is that ageing regions in 2009 were not particularly bad or good in matching workers’ skills with occupations, but they eventually proved pretty weak in this regard later on (in 2021). This marks that the age structure at the regional level has become an indicator of skill mismatches, while in our study it appears to also be an indicator of future mismatches. Lastly, there also is a moderate correlation between the Innovation Index in 2021 and the LQH for both years, underlining the importance of a region’s innovation capacity in the optimal allocation of talent.
Regarding regional concentrations of highly educated workers in medium skill-level occupations (LQM), 2021 scores exhibited a strong negative correlation with national GDP in 2021 (both total and per capita), as well as their change between 2009 and 2021. Interestingly, when it comes to LQM in 2009, the respective correlations are instead mildly positive, signifying that many regions within robust national economies struggled to optimally allocate talent at the onset of the 2008/2009 Global Crisis, but gradually, until 2021, they smoothened these mismatches. This is further confirmed by the negative correlation between LQM in 2021 and the change of national GDP per capita between 2009 and 2021, which is among the strongest observed in Table 1. The above underlines the importance of national economies in skills’ allocation. When it comes to regional GDP, correlations appear similar as above but milder, although that between LQM and the change of regional GDP per capita between 2009 and 2021 in particular is strongly negative. Comparing the correlation patterns between LQM and various regional and national GDP metrics, it is found that productive robustness at the national level affected this type of skill mismatch more than robustness at the regional level did. For its part, the effect of regional innovation systems was not found to be particularly remarkable. Similarly, the Ageing Index does not appear to correlate strongly with LQM, either positively or negatively. Lastly, the Dependency Index’s scores in 2021 and their change during 2009–2021 present a mild positive correlation with LQM in 2021. The latter indicates that regions with large populations outside productive ages are more likely to concentrate more highly educated workers in medium skill-level occupations.
Regional concentrations of highly educated workers in low skill-level occupations (LQL), which is the starkest form of skill mismatch in our study, do not strongly correlate with metrics related to the national GDP. This means that there are many regions within otherwise robust national economies that exhibited extreme overskilling, as well as regions within meagre national economies with optimal skill matches. Notably, the strongest positive correlations in that part of the matrix can be found between LQL and regional GDP, meaning that robust regional economies tend to suffer from overskilling. However, this does not refer to metropolitan regions, considering the low coefficient values between urbanization levels and LQL regardless of the year. Apart from the above, only the Ageing Index displays some notable correlations with LQL. Specifically, the index’s scores in both 2009 and 2021 (but not their change during 2009–2021) positively correlate mildly with LQL in 2021. This suggests that regions with an ageing population tended to concentrate more instances of overskilling then.
It must be noted that the LQ is a relative index, meaning that its changes over time do not indicate neither absolute growth nor retraction of the phenomenon under study. Therefore, correlations pertaining to LQ changes over time must be approached with caution. That being said, LQM changes over the study period exhibit particularly high negative correlation with national GDP (both total and per capita). This indicates that regions within robust national economies managed to limit this type of skill mismatches over time in relation to all other regions. Similarly stark negative correlations can be observed between LQM and the change of regional GDP per capita during the study period; namely, regions which increased their GDP per capita limited the relative concentration of such workers. Despite the LQ being a relative index, the above shows how important the relationship between macroeconomic metrics (measuring the overall size of a national/regional economy and the standard of living of citizens therein) and the optimal allocation of skills is. For example, the Greek regions (Figure 3b), where LQM increased significantly in 2021 compared to 2009, national and regional GDP also decreased significantly.
Discussing the determinants of human capital allocation
Our analysis above highlighted the uneven geography of skill and education levels’ matching across the regions in five countries representing Europe’s main employment/education regimes. To better contextualise our findings, we also conducted a correlation analysis between the concentrations of all types of skill (mis)matches and various metrics that the relevant literature has indicated as significant. Drawing upon our main findings, here we discuss the most crucial factors underlying the uneven geography of skill mismatches. In this framework, we put particular emphasis on the economic dynamism of national economies, regional industrial structures, urbanization, local institutional structures and practices, and demographic structures, drawing from the main findings of the relevant literature (Alamá-Sabater et al., 2024; Cedefop, 2010).
First, there are multiple indications that the dynamism of national economies is a prime determining factor for the spatially uneven distribution of human capital and skills’ matching. In our study, this dynamism’s role in human capital allocation is reflected in the negative correlation between national GDP and LQM. Indeed, robust national economies, both in terms of total and per capita GDP (Germany, Denmark, France), were found to overall exhibit more notable concentrations of highly educated workers in high skill positions than less dynamic ones (Bulgaria, Greece). Additionally, a closer look reveals that the former countries have oriented their production towards dynamic sectors comprising high added value manufacturing, financial services, and other specialized B2B services, in a more decisive way than the latter ones (Herod et al., 2021). As such, beyond exhibiting more efficient skill matching, countries with dynamic sectoral specializations concentrate much higher shares of a high-skilled workforce in the first place (Lee & Rodriguez-Pose, 2013).
The reason that some countries can attract or develop a workforce with a higher skill set whereas others struggle to follow cannot be seen independently of a broader context pertaining to their positioning within global value chains (henceforth GVCs). The very constitution of “sequential structures” such as GVCs implies uneven development: some countries get to host the strong links of these chains—i.e., the activities of higher value added which demand skilled labour—whereas the rest are left with the weaker ones (Smichowski et al., 2016). Within a value chain, a higher value added is typically attributed to the initial-stage and the later-stage activities, whereas those in the middle are lower value added (forming a “smiley face” curve; Mohiuddin & Su, 2014). Specifically, activities which come first in production chains relate to the standardization, innovation, and design of a product, activities coming afterwards include the manufacturing and assembly of a product, and activities that come last relate to logistics, marketing, and branding (Fróes de Borja Reis & Barroso de Souza, 2018).
As such, it is commonly accepted that already advanced economies achieve a better positioning within these complex structures. This brings upon them a series of positive outcomes, including being able to improve productivity through attracting high-skilled labour (Fernandez-Stark et al., 2011). Moreover, this positioning is clearly reflected in country-level differences in education systems, which allows benefited countries to better develop high-skilled labour in the first place. As mentioned above, the countries that we study follow different educational paths that have a direct impact on the labour market. For example, the universalistic (e.g.Denmark) regime with high investments in education and fast and stable school-to-work transitions is completely different from countries of the sub-protective regime (e.g. Greece), which display severe skills mismatches and low labour demand in general (Hadjivassiliou et al., 2019).
Beyond the national scale, positioning within GVCs translates in profoundly different ways at the regional level as well (Fernandez-Stark et al., 2011). Characteristically, stark inequalities among regions regarding skill and education matching were found in Germany and France despite being strong national economies overall, while instances of a great matching were identified within lagging national economies, as in the case of Bulgaria’s and Greece’s capital regions (Yugozapaden & Attica respectively). For one, this observation underlines how robust regions within a less robust national context over-concentrate capital and activities at the expense of their surrounding regions. Such a case is Yugozapaden in Bulgaria, with an LQH score of over 1.31 in 2021. Interestingly, the same applies even in Germany, France, and Denmark, although to a lesser extent. Indicatively, LQH was found to be particularly high in Berlin (Germany) and Hovedstaden (Denmark), while many regions in these countries did not perform as well. The above helps us to—at least partially—refute theoretical and empirical postulations around the spillover effect of growth poles (see Florida et al., 2008).
Overall, the above highlights the importance of regional industrial specializations and innovation capacity, which are deeply interconnected. Specifically, beyond the correlation between LQH and regional GDP, our analysis documented the statistical significance of the Innovation Index’s scores. As shown, then, not only is the size of a regional economy or the standard of living of its citizens important in the optimal allocation of human capital, but also regional innovation performance. Regions which for example host innovation research centres or constitute strong logistic centres are positioned in better terms within the global geography of skills, whereas those which constitute manufacturing/assembly centres are positioned in worse terms (Cedefop, 2018), except for the case of particularly high added value products (e.g., biotech; Mohiuddin & Su, 2014). In our analysis, regions standing out in terms of matching highly educated workers with high skill occupations included Île-de-France, Berlin in Germany, and Hovedstaden in Denmark. All of the above constitute innovative regions with a high GDP per capita; for instance, Île-de-France is an innovation leader at a pan-EU level (European Commission, 2022). Similarly, Yugozapaden, which also exhibited a notable high skill/education matching, has taken significant steps towards economic modernization and technological improvement in recent years (European Commission, ibid).
Nevertheless, regions cannot upgrade within GVCs completely detached from their broader national context, especially if this refers to an obsolete domestic economic system (Gereffi & Lee, 2016). This postulation is indicated by the concentrations of highly skilled workers in middle skill level occupations, which reflects some extent of skill mismatching. Specifically, all Greek regions displayed relevant over-concentrations, with Attica standing out among all study regions. This reflects the weaker productive structures of Greece as a whole as well as its regions. For instance, the North Aegean specializes in small-scale agriculture, while the other insular regions in the country overfocus on tourism (Herod et al., 2022). Even the country’s capital region is only a moderate innovator, lagging significantly in terms of R&D spending (European Commission, 2022). Apart from tourism, there are many manufacturing- and assembly-related activities along GVCs that favor medium skill-level occupations and therefore generate tendencies towards a disproportionate amount of highly educated workers in such occupations. Such is the case with most French regions, and especially the agri-food heavy Franche-Comté.
Of course, beyond a current positioning within broader GVCs, these industrial specializations at the national and regional level also reflect a historical context, including the effect of long structural transformations and abrupt crises. Specifically, in the aftermath of the crisis of Fordist industrialization during the 1970s, regions in Northern and Central Europe took a turn toward technologically advanced sectors; in contrast, being unable to maintain their export capacity, peripheral regions across Southern Europe saw their industrial systems dismantled and resorted to less innovative, constructions-driven growth models (Herod et al., 2021). Moreover, the 2008/09 Global Crisis put a heavy strain on the peripheral parts of the EU and led to the burst of the real estate bubbles they had developed, decimating their construction activity (Gourzis & Gialis, 2019). However, having their industrial structures already dismantled, these regions followed a course further into deindustrialization, gradually developing a heavy dependence on tourism activities (Herod et al., 2022). As a result, their economic base in recent years comprises a mix of less innovative, technologically backward sectors such as construction, retail, and low value-added market services (Fana et al., 2016).
In further examining the determinants of skill (mis)matches, closely related to industrial specializations is the extent of urbanization. As the analysis revealed, there is a positive moderate correlation between the LQH and the population density, showing that urbanization is important in human capital allocation. Regions with dynamic metropolitan areas typically abound in occupations requiring higher skill levels, thus, demand for skilled labour is high there (Psycharis et al., 2014); on the other end, urban environments often constitute more attractive environments for a high skilled and creative labour force as they are characterized by more amenities—cultural, transportations-wise, choices for education, etc.—and lower entry barriers for newcomers (Florida et al., 2008). This is rather expected, since large urban agglomerations act as dominant poles, accumulating population and capital, concentrating the better part of domestic infrastructure, and attracting foreign investments (Perroux, 1955), eventually fueling processes of self-sustained growth (Polyzos, 2015). Nevertheless, our analysis highlighted a mild positive correlation between population density and perfect skill matching (LQH), as well as no negative correlation between density and LQL and LQM. This indicates that, instead of metropolitan regions in general, it was mostly the capital regions within each country that exhibited a good performance in skill matching. In fact, many metropolitan regions were found to simultaneously display over-concentrations of highly educated people in low-skill occupations, as for instance Île-de-France. This is a particularly important observation, as it implies deep cutting inequalities and fierce competition even within the most dynamic regional labour markets, which have in fact exacerbated during the 2010s recession (Herod et al., 2021). Indeed, the relevant literature has noted that urbanized regions exhibit highly polarized labour markets (Capsada-Munsech & Valiente, 2020). Namely, besides the core of well-qualified people working in high skill occupations, there is a periphery of precarious workers undertaking menial tasks (Teixeira, 2022). Moreover, with super-star cities within robust national economies and capital cities within smaller national economies concentrating a larger highly educated workforce than what their labour markets can absorb, and thus channeling it to lower skill-level occupations, the simultaneous high scores in LQH and LQL cannot be seen as a paradox.
Nevertheless, it is not central metropolitan areas that were found to exhibit the starkest overskilling (LQL) but those around them. Aside from some robust regions then, overskilling is so widespread that one out of four university graduates in the EU works in jobs requiring lesser skills than what they have acquired through their education (Cedefop, 2018). Moreover, this phenomenon is persisting, as skill mismatches in most peripheral regions do not solely emerge in times of economic turbulence, but they constitute diachronic traits (Iammarino et al., 2019); this is despite approaches such as HCT postulating that overskilling cannot persist in the long run and that it is automatically balanced out by market mechanisms (McGuinness & Pouliakas, 2016). Even worse, beyond being unable to attract high skilled labour so as to cover their needs, most peripheral regions also appear unable to keep the one they have developed (Florida et al., 2008). In this context, apart from extensive overskilling, they also suffer from extensive underskilling as well (Lee & Rodriguez-Pose, 2013). As such, they enter a vicious cycle of deepening skill mismatches. This self-regenerating vulnerability comes in stark antithesis with the virtuous cycle of self-sustained growth in dynamic regions. Combined, these cycles make clear that—in the absence of decisive institutional interventions—spatial inequalities tend to deepen instead of being ameliorated over time (Teixeira, 2022).
Therefore, the link between peripherality and skill mismatches highlights the importance of local institutional structures and practices, which are particularly weaker in peripheral regions (Herod et al., 2022). Weak market and state institutions bring a series of consequences. For one, they can influence entrepreneurial activities (Junaid et al., 2022). In fact, “institutional sclerosis”, namely entrenched interest groups within weak institutions, has long been accused of impeding economic growth by resisting changes that could disrupt their established benefits, and leading to economic stagnation and less innovation (Olson, 1982). Moreover, weak institutions lead to “information asymmetries” among graduates, leading to poor career choices (McGuinness et al., 2018). In our analysis, although an indicator of effective governance was not included, proxies such as GDP and the Innovation Index were found to be positively correlated with LQH and negatively with LQM.
One last decisive difference between urbanized and rural areas that has to be taken under consideration is their demographic structure. Our analysis revealed a negative correlation between the LQH and the Ageing Index and a mild positive correlation between the LQM and the Dependency Index. However, the relationship between allocation of talent and demographics is more complex. What cannot be reflected in our analysis—and most other secondary ones—is that older workers generally lose their incentive to retrain over time, with the introduction of new technologies rendering their skill sets obsolete (McGuinness et al., 2018). At the same time, the weight of meeting skill demand falls upon the shoulders of those entering the labour market, who must develop the appropriate competencies (Cedefop, 2015). Amid intensified competition, younger people are further pushed to invest in their training (Brunello & Wruuck, 2021), with education being their main defence mechanism in retaining their place in the job market (Sala, 2011). As such, younger labour markets are not necessarily functioning better in terms of talent allocation.
Conclusions
This study examined the issue of human capital allocation at the regional level across five European countries, which represent key employment models within the EU. Our findings highlighted the uneven geography of skill mismatches, as capital and metropolitan regions were observed to be more efficient than less affluent and peripheral ones in matching supply (in terms of education attainment level) and demand (in terms of demanded skill-level in occupations), especially when it comes to upper-level skills. To further decipher this remark, we discussed the role of five interrelated factors: economic dynamism at the national level, regional sectoral specializations, urbanization, institutional structures, and demographic trends. In this framework, we briefly discussed the role of regions’ positioning within broader structures such as GVCs. Importantly, our analysis pinpointed that human capital is shaped by multiple forces at the same time, most of which relate with each other in a dialectical way. Furthermore, we identified a series of self-sustained, regenerating processes of resilience and vulnerability, i.e., virtuous and vicious cycles. Ultimately, we found human capital to be of the utmost importance in regional development. Although it can generate spatial growth, its concentration in certain areas leaves lagging regions out of growth pathways.
To break this pattern of uneven development, policy interventions are required. Thus, here we recommend a series of actions drawing upon the five factors discussed above, while taking into account the EU’s “New Skills Agenda”. Our recommendations have been tailored for the regions associated with the ERUA but can be applied to other contexts as well, given that these regions represent Europe’s key employment regimes. Looking at the local institutional structures and practices, in the regions with strong research and academic activity like the ones related to the consortium, it is important that their universities work together with stakeholders from industry to spill over knowledge and cover the research and innovation needs of the labour market. In this frame, learning events for reskilling and upskilling in emerging sectors—e.g., green skills—are necessary. In addition, high quality career counselling is key, especially for vulnerable groups such as the youth, women, and migrants, for not only making sensible early career decisions but also in overcoming career challenges throughout their lives (Papakota, 2016). In fact, as noted above, such career counseling is more than necessary in peripheral regions, where career choices are less informed due to “information asymmetries” (McGuinness et al., 2018). In this context, educational structures such as schools, universities or vocational training centres should respond to the needs of students at different stages of career development by identifying skills, experiences, values and personality traits of graduates, technological trends and employment opportunities, employers' expectations and career planning (Litoiu & Oproiu, 2012). Lastly, tighter networks of social, scientific, and policy-related stakeholders should be encouraged, so that through joint actions they engage in labour market forecasting and early identification of skill shortages.
Regarding the spatially uneven distribution of human capital due to national economies’ dynamism (or lack thereof) or regional industrial specializations, it can be addressed through targeted investment incentives and guided industrial reorientation. Governments can rechannel entrepreneurial activity into underdeveloped regions through financial incentives like tax breaks, grants and subsidies. More crucially, countries and regions with economies entirely oriented towards medium and low-skill sectors (e.g., tourism) that generate mainly low-quality jobs, should pursue a re-specialization in more dynamic high value-added and high-skill sectors (Emmanouil et al., 2024); this should reduce spatial and talent inequalities. Furthermore, our analysis showed that high skills increase inversely with population ageing and are positively associated with the degree of urbanization; as such, investment in education, training, and continuous learning, or policies promoting economic resilience and adaptability, may not be sufficient in rural and underdeveloped regions. This highlights the need for a move away from a horizontal implementation of policies, which is the case with many EU initiatives such as the Youth Guarantee (Emmanouil et al., ibid). Instead, policies should be spatially sensitive so as to keep young people with high levels of education in non-urban and/or peripheral regions, where they will work in high-skill occupations and put their human capital in good use. Taking into account the specific needs of regions, promoting innovation, incentivizing investment, and sharing best practices, can therefore promote balanced economic growth and reduce inequalities in the geographical distribution of skills.
Annex
Annex 1. Share of highly educated workers in low, medium and high skill-level occupations, per region, 2009 and 2021.
Source: Eurostat.
| Region | Year | % Low skills | % Medium Skills | % High skills |
|---|
| BG34 | 2021 | 13,86 | 58,55 | 26,53 |
| 2009 | 14,51 | 62 | 22,2 |
| BG41 | 2021 | 7,85 | 44,55 | 47,6 |
| 2009 | 11,06 | 49,67 | 38,4 |
| BG33 | 2021 | 17,44 | 54,01 | 28,55 |
| 2009 | 14,07 | 57,61 | 28,32 |
| BG31 | 2021 | 12,96 | 60,27 | 26,77 |
| 2009 | 13,05 | 61,52 | 25,43 |
| BG42 | 2021 | 11,64 | 62,8 | 24,33 |
| 2009 | 12,52 | 63,11 | 23,67 |
| BG32 | 2021 | 10,73 | 61,98 | 27,29 |
| 2009 | 11,44 | 60,77 | 27,79 |
| DK04 | 2021 | 10,74 | 41,96 | 47,3 |
| 2009 | 10,19 | 46,37 | 43,44 |
| DK02 | 2021 | 10,83 | 45,25 | 43,93 |
| 2009 | 8,94 | 46,98 | 44,08 |
| DK01 | 2021 | 7,38 | 31,52 | 61,09 |
| 2009 | 7,97 | 36,25 | 55,78 |
| DK05 | 2021 | 11,91 | 45,86 | 42,22 |
| 2009 | 10,7 | 48,64 | 40,66 |
| DK03 | 2021 | 12,95 | 44,03 | 43,02 |
| 2009 | 11,49 | 50,06 | 38,46 |
| DE92 | 2021 | 8,46 | 45,32 | 46,22 |
| 2009 | 7,93 | 46,29 | 45,78 |
| DEB1 | 2021 | 9,6 | 48,78 | 41,62 |
| 2009 | 9,32 | 50,74 | 39,17 |
| DEC0 | 2021 | 7,79 | 48,52 | 43,69 |
| 2009 | 9,21 | 51,02 | 39,77 |
| DE26 | 2021 | 6,95 | 46,87 | 46,18 |
| 2009 | 9,11 | 50,83 | 40,06 |
| DE60 | 2021 | 5,12 | 37,23 | 57,65 |
| 2009 | 6,58 | 40,22 | 53,2 |
| DEB2 | 2021 | 12,89 | 39,27 | 47,84 |
| 2009 | 9,06 | 50,08 | 40,86 |
| DE50 | 2021 | 10,04 | 44,81 | 45,15 |
| 2009 | 9,56 | 48,65 | 41,79 |
| DED5 | 2021 | 4,81 | 41,12 | 54,07 |
| 2009 | 8,16 | 48,21 | 43,63 |
| DEB3 | 2021 | 7,44 | 45,36 | 47,2 |
| 2009 | 8,92 | 46,77 | 44,31 |
| DE30 | 2021 | 4,19 | 35,33 | 60,48 |
| 2009 | 7,06 | 38,59 | 54,36 |
| DE11 | 2021 | 7,85 | 44,67 | 47,48 |
| 2009 | 7,91 | 46,83 | 45,26 |
| DE80 | 2021 | 6,18 | 52,19 | 41,62 |
| 2009 | 7,54 | 55,6 | 35,92 |
| DEE0 | 2021 | 7,12 | 53,92 | 38,96 |
| 2009 | 8,25 | 53,19 | 37,85 |
| DEG0 | 2021 | 7,56 | 51,55 | 40,89 |
| 2009 | 7,42 | 53,63 | 38,44 |
| DEF0 | 2021 | 7,28 | 47,09 | 45,64 |
| 2009 | 8,36 | 47,95 | 42,9 |
| DE12 | 2021 | 7,78 | 43,89 | 48,33 |
| 2009 | 8,33 | 46,5 | 45,17 |
| DE21 | 2021 | 5,45 | 40,93 | 53,62 |
| 2009 | 6,63 | 43,44 | 49,64 |
| DE93 | 2021 | 8,44 | 48,72 | 42,84 |
| 2009 | 8,68 | 50,65 | 39,94 |
| DE94 | 2021 | 8,57 | 51,58 | 39,85 |
| 2009 | 9,62 | 53,06 | 36,58 |
| DE22 | 2021 | 7,04 | 52,22 | 40,74 |
| 2009 | 9,88 | 55,55 | 34,57 |
| DED4 | 2021 | 5,34 | 55,53 | 39,13 |
| 2009 | 6,21 | 54,26 | 39,52 |
| DE23 | 2021 | 7,87 | 51,29 | 40,84 |
| 2009 | 9,28 | 54,68 | 36,03 |
| DE25 | 2021 | 6,74 | 46,42 | 46,85 |
| 2009 | 8,31 | 47,79 | 43,9 |
| DE40 | 2021 | 6,02 | 49,86 | 44,11 |
| 2009 | 7,18 | 51,48 | 41,34 |
| DEA3 | 2021 | 7,58 | 47,63 | 44,79 |
| 2009 | 8,36 | 51,13 | 40,5 |
| DEA5 | 2021 | 8,08 | 48,99 | 42,94 |
| 2009 | 9,24 | 49,83 | 40,93 |
| DE73 | 2021 | 8,05 | 49,6 | 42,35 |
| 2009 | 10,68 | 48,65 | 40,67 |
| DE91 | 2021 | 7,32 | 47,04 | 45,64 |
| 2009 | 8,54 | 50,49 | 40,97 |
| DEA1 | 2021 | 6,78 | 45,73 | 47,49 |
| 2009 | 7,49 | 47,87 | 44,64 |
| DE24 | 2021 | 7,1 | 46,76 | 46,14 |
| 2009 | 9,97 | 50,62 | 39,41 |
| DE14 | 2021 | 7,81 | 46,68 | 45,52 |
| 2009 | 9,09 | 49,38 | 41,53 |
| DED2 | 2021 | 3,69 | 49,91 | 46,39 |
| 2009 | 8,35 | 49,75 | 41,9 |
| DE71 | 2021 | 7,68 | 42,98 | 49,34 |
| 2009 | 7,57 | 43,75 | 48,68 |
| DE13 | 2021 | 7,79 | 48,34 | 43,88 |
| 2009 | 8,08 | 50,08 | 41,84 |
| DE27 | 2021 | 7,31 | 50,58 | 42,11 |
| 2009 | 7,9 | 54,06 | 38,04 |
| DEA4 | 2021 | 8,61 | 48,92 | 42,48 |
| 2009 | 10,14 | 50,61 | 39,25 |
| DE72 | 2021 | 7,71 | 44,22 | 48,07 |
| 2009 | 8,96 | 48,88 | 42,16 |
| DEA2 | 2021 | 6,84 | 43,23 | 49,94 |
| 2009 | 7,78 | 44,44 | 47,44 |
| EL63 | 2021 | 6,23 | 71,36 | 22,4 |
| 2009 | 4,95 | 65,64 | 28,78 |
| EL41 | 2021 | 7,13 | 62,31 | 26,54 |
| 2009 | 4,93 | 51,11 | 37,53 |
| EL51 | 2021 | 7,81 | 65,77 | 19,59 |
| 2009 | 4,96 | 63,82 | 27 |
| EL62 | 2021 | 14,04 | 68,91 | 17,06 |
| 2009 | 7,3 | 66,53 | 26,17 |
| EL54 | 2021 | 10,9 | 63,25 | 25,85 |
| 2009 | 6,19 | 65,78 | 28,03 |
| EL30 | 2021 | 5,1 | 52,13 | 40,96 |
| 2009 | 8,34 | 50,8 | 39,52 |
| EL52 | 2021 | 6,3 | 61,34 | 31,01 |
| 2009 | 6,49 | 58,1 | 34,66 |
| EL53 | 2021 | 5,55 | 68,02 | 26,43 |
| 2009 | 4,75 | 66,72 | 28,53 |
| EL65 | 2021 | 6,55 | 70,5 | 22,95 |
| 2009 | 6,87 | 68,08 | 25,05 |
| EL43 | 2021 | 7,96 | 66,01 | 25,35 |
| 2009 | 7,53 | 62,62 | 29,28 |
| EL64 | 2021 | 10,22 | 69,98 | 19,8 |
| 2009 | 9,23 | 64,08 | 26,68 |
| EL61 | 2021 | 6,21 | 62,34 | 29,99 |
| 2009 | 6,15 | 60,33 | 32,83 |
| EL42 | 2021 | 5,86 | 65,97 | 27,01 |
| 2009 | 9,67 | 61,19 | 29,14 |
| FRI1 | 2021 | 8,5 | 44,63 | 44,98 |
| 2009 | 8,08 | 48,99 | 42,35 |
| FRF1 | 2021 | 10,11 | 46,34 | 43,55 |
| 2009 | 7,32 | 50,89 | 40,92 |
| FRB0 | 2021 | 10,35 | 46,47 | 42,52 |
| 2009 | 8,3 | 50,41 | 40,19 |
| FRC1 | 2021 | 10,25 | 44,24 | 45,51 |
| 2009 | 9,75 | 54,71 | 35,55 |
| FRG0 | 2021 | 8,95 | 48,41 | 42,13 |
| 2009 | 8,03 | 55,26 | 36,26 |
| FRJ2 | 2021 | 8,58 | 40,28 | 50,44 |
| 2009 | 8,47 | 48,91 | 42,62 |
| FRF3 | 2021 | 11,37 | 47,69 | 40,2 |
| 2009 | 9,83 | 54,17 | 33,51 |
| FRF2 | 2021 | 9,23 | 51,32 | 38,05 |
| 2009 | 10,06 | 57,59 | 32,35 |
| FRE2 | 2021 | 8,76 | 47,05 | 44,19 |
| 2009 | 9,83 | 56,54 | 33,62 |
| FRJ1 | 2021 | 9,14 | 41,16 | 48,9 |
| 2009 | 9,79 | 50,11 | 38,1 |
| FRD2 | 2021 | 8,24 | 47,83 | 43,92 |
| 2009 | 11 | 52,66 | 36,34 |
| FRE1 | 2021 | 10,11 | 43,53 | 46,37 |
| 2009 | 10,39 | 50,27 | 39,34 |
| FRK2 | 2021 | 7,86 | 41,04 | 51,1 |
| 2009 | 10,47 | 49,26 | 39,94 |
| FRK1 | 2021 | 8,87 | 52,12 | 39,01 |
| 2009 | 9,98 | 51,14 | 38,88 |
| FRC2 | 2021 | 6,89 | 54,85 | 38,26 |
| 2009 | 8,87 | 55,5 | 35,63 |
| FRD1 | 2021 | 7,86 | 50,79 | 41,35 |
| 2009 | 8,79 | 54,72 | 36,49 |
| FRL0 | 2021 | 9,4 | 40,67 | 48,39 |
| 2009 | 12,41 | 48,48 | 37,93 |
| FRH0 | 2021 | 9,58 | 45,62 | 43,19 |
| 2009 | 8,79 | 53,07 | 37,14 |
| FR10 | 2021 | 6,31 | 31,07 | 62,38 |
| 2009 | 9,6 | 35,02 | 54,68 |
| FRM0 | 2021 | 6,37 | 51,11 | 42,52 |
| 2009 | 13,79 | 53,25 | 32,96 |
| FRI2 | 2021 | 10,6 | 45,84 | 43,56 |
| 2009 | 8,72 | 55,3 | 35,97 |
| FRI3 | 2021 | 11,84 | 47,83 | 40,33 |
| 2009 | 9,27 | 56,71 | 32,93 |
Faculty Opinions recommendedReferences
- Acemoglu D:
Reward structures and the allocation of talent.
Eur Econ Rev.
1995; 39(1): 17–33. Publisher Full Text
- Alamá-Sabater L, de Llanos Y, Márquez MÁ, et al.:
Evaluating the spatial mismatch between population and factor endowments: the case of the European Union.
Reg Stud.
2024; 59(2): 1–24. Publisher Full Text
- Ali HO:
Career/vocational guidance/counselling: a tool for functional education and graduate employability.
Int J Educ Pract.
2014; 2(10): 234–242. Publisher Full Text
- Allen JP, Levels M, Van der Velden RKW:
Skill mismatch and skill use in developed countries: evidence from the PIAAC study. Maastricht University, Research Centre for Education and the Labour Market (ROA). 2013; (No. 017). Publisher Full Text
- Becker GS:
Human capital: a theoretical and empirical analysis, with special reference to education. University of Chicago press, 1964. Reference Source
- Bednorz J, Sadauskaitė A:
Unionisation and the twin transition-good practices in collective action. Policy Department for Economic, Scientific and Quality of Life Policies Directorate-General for Internal Policies, 2022. Reference Source
- Biagi F, Castaño Muñoz J, Di Pietro G:
Mismatch between demand and supply among higher education graduates in the EU. European Union, Luxembourg. 2020. Publisher Full Text
- Boudeville JR:
Planning and the rural economy. Planning and the rural economy, 1968.
- Brunello G, Wruuck P:
Skill shortages and skill mismatch: a review of the literature.
J Econ Surv.
2021; 35(4): 1145–1167. Publisher Full Text
- Calcagnini G, Marin G, Perugini F:
Labour flexibility, internal migration and productivity in Italian regions.
Struct Chang Econ Dyn.
2021; 57: 308–320. Publisher Full Text
- Capsada-Munsech Q, Valiente O:
Sub-national variation of skill formation regimes: a comparative analysis of skill mismatch across 18 European regions.
Eur Educ.
2020; 52(2): 166–179. Publisher Full Text
- Chiacchio F, Petropoulos G, Pichler D:
The impact of industrial robots on EU employment and wages: a local labour market approach. Bruegel working paper (No. 2018/02). 2018. Reference Source
- Chłoń-Domińczak A, Żurawski A:
Measuring skills mismatches revisited–introducing sectoral approach. IBS Working Paper 03/2017. 2017. Reference Source
- Deissinger T:
The German dual vocational education and training system as ‘good practice’?
Local Econ.
2015; 30(5): 557–567. Publisher Full Text
- Emmanouil E, Chatzichristos G, Herod A, et al.:
In what way a “Guarantee for youth”? NEETs entrapped by labour market policies in the European Union.
J Youth Stud.
2024; 27(8): 1207–1226. Publisher Full Text
- Emmanouil E, Herod A, Gourzis K, et al.:
Youth labour markets in the Southern European Union, 2009–2021: deciphering trajectories of resilience through a decade of consecutive crises.
Geografisk Tidsskrift-Danish Journal of Geography.
2023; 123(2): 69–86. Publisher Full Text
- European Centre for the Development of Vocational Training (CEDEFOP):
The skill matching challenge: analysing skill mismatch and policy implications. Luxembourg: Publications Office, 2010. Reference Source
- European Centre for the Development of Vocational Training (CEDEFOP):
Skill mismatch: appearances are deceiving. Unemployment is not due to a lack of skills. Europe's most talented workforce remains untapped. Luxembourg: Publications Office, 2014. Reference Source
- European Centre for the Development of Vocational Training (CEDEFOP):
Skills, qualifications and jobs in the EU: the making of a perfect match? Luxembourg: Publications Office, Cedefop reference series; No 103, 2015. Reference Source
- European Centre for the Development of Vocational Training (CEDEFOP):
Insights on skill shortages and skill mismatch: learning from Cedefop’s European skills and jobs survey. Luxembourg: Publications References 131 Office. Cedefop reference series. No 106, 2018. Reference Source
- European Commission:
Labour Mobility - Towards a European Labour Market. (Lunch debate at the EPSCO Council) 14323/12. 2012. Reference Source
- European Commission:
A New Skills Agenda for Europe. 2016. Reference Source
- European Commission:
European Skills Agenda. 2020. Reference Source
- European Commission:
Regional innovation scoreboard. 2022. Reference Source
- Fana M, Guarascio D, Cirillo V:
Did Italy need more labour flexibility? The consequences of the jobs act.
Intereconomics.
2016; 51(2): 79–86. Publisher Full Text
- Farkas B:
The Central and Eastern European model of capitalism.
Postcommunist Econ.
2011; 23(1): 15–34. Publisher Full Text
- Feldman M, Guy F, Iammarino S:
Regional income disparities, monopoly and finance.
Camb J Reg Econ Soc.
2021; 14(1): 25–49. Publisher Full Text
- Fernandez-Stark K, Frederick S, Gereffi G:
The apparel global value chain. Duke Center on Globalization, Governance & Competitiveness, 2011. Reference Source
- Florida R, Mellander C, Stolarick K:
Inside the black box of regional development—human capital, the creative class and tolerance.
J Econ Geogr.
2008; 8(5): 615–649. Publisher Full Text
- Fróes de Borja Reis C, Barroso de Souza A:
Drawing value curves: lessons from financial statements of the world’s biggest manufacturing corporations.
Revue d’économie industrielle.
2018; (163): 229–262. Publisher Full Text
- Galiakberova AA:
Conceptual analysis of education role in economics: the human capital theory.
Journal of History Culture and Art Research.
2019; 8(3): 410–421. Publisher Full Text
- Gereffi G, Lee J:
Economic and social upgrading in global value chains and industrial clusters: why governance matters.
J Bus Ethics.
2016; 133(1): 25–38. Publisher Full Text
- Gialis S, Taylor M:
A regional account of flexibilization across the EU: the ‘flexible contractual arrangements’ composite index and the impact of recession.
Soc Indic Res.
2016; 128: 1121–1146. Publisher Full Text
- Giouli E, Pisinas Y, Kanzola AM, et al.:
Human capital and production structure: evidence from Greece.
European Journal of Economics and Business Studies.
2021; 7(1). Publisher Full Text
- Gourzis K, Gialis S:
Dismantled spatial fixes in the aftermath of recession: capital switching and labour underutilization in the Greek capital metropolitan region.
Int J Urban Reg Res.
2019; 43(4): 741–759. Publisher Full Text
- Hadjivassiliou KP, Tassinari A, Eichhorst W, et al.:
How does the performance of school-to-work transition regimes vary in the European Union.
Youth labor in transition. Inequalities, mobility, and policies in Europe.
2019; 71–103. Publisher Full Text
- Hein E, Vogel L:
Distribution and growth in France and Germany: single equation estimations and model simulations based on the Bhaduri/Marglin model.
Rev Polit Econ.
2009; 21(2): 245–272. Publisher Full Text
- Herod A, Gialis S, Psifis S, et al.:
The impact of the COVID-19 pandemic upon employment and inequality in the Mediterranean EU: an early look from a labour geography perspective.
Eur Urban Reg Stud.
2022; 29(1): 3–20. Publisher Full Text
- Herod A, Gourzis K, Gialis S:
Inter-regional underemployment and the industrial reserve army: precarity as a contemporary Greek drama.
Eur Urban Reg Stud.
2021; 28(4): 413–430. Publisher Full Text
- Iammarino S, Rodriguez-Pose A, Storper M:
Regional inequality in Europe: evidence, theory and policy implications.
J Econ Geogr.
2019; 19(2): 273–298. Publisher Full Text
- ILO: International Standard Classification of Occupations (ISCO). 2025. Reference Source
- Junaid D, He Z, Afzal F:
The impact of weak formal institutions on the different phases of the entrepreneurial process.
J Bus Res.
2022; 144: 236–249. Publisher Full Text
- Lee N, Rodríguez-Pose A:
Innovation and spatial inequality in Europe and USA.
J Econ Geogr.
2013; 13(1): 1–22. Publisher Full Text
- Litoiu N, Oproiu CG:
The need of career counselling in universities: a competencies-based approach. In: Proceedings of the international conference of scientific paper AFASES, Brasov, Romania. 2012; 24–26. Reference Source
- Lund S, Madgavkar A, Manyika J, et al.:
The future of work after COVID-19. McKinsey global institute. 2021; 18. Reference Source
- MacKinnon D, Kempton L, O’Brien P, et al.:
Reframing urban and regional ‘development’ for ‘left behind’ places.
Cambridge Journal of Regions, Economy and Society.
2022; 15(1): 39–56. Publisher Full Text
- McGuinness S, Pouliakas K:
Deconstructing theories of overeducation in Europe: a wage decomposition approach. (No. 9698). Institute of Labor Economics (IZA), 2016. Reference Source
- McGuinness S, Pouliakas K, Redmond P:
Skills mismatch: concepts, measurement and policy approaches.
J Econ Surv.
2018; 32(4): 985–1015. Publisher Full Text
- McGuinness S, Wooden M:
Overskilling, job insecurity, and career mobility.
Industrial Relations: A Journal of Economy and Society.
2009; 48(2): 265–286. Publisher Full Text
- Mincer J:
Investment in human capital and personal income distribution.
J Polit Econ.
1958; 66(4): 281–302. Publisher Full Text
- Mohiuddin M, Su Z:
Global value chains and the competitiveness of Canadian manufacturing SMEs.
Academy of Taiwan Business Management Review.
2014; 10(2): 82–92. Reference Source
- Olson M:
The rise and decline of nations: economic growth, stagflation, and social rigidities. New Haven, CT: Yale University Press, 1982. Reference Source
- O'Reilly J, Grotti R, Russell H:
Are some sectors more “youth friendly” than others? Employment regimes, sectors, and gender disparities in the Great Recession.
Human Resource Management Journal.
2019; 29(3): 490–508. Publisher Full Text
- Papakota A:
Career counselling development: a case study of an innovative career counselling tool.
Industry and Higher Education.
2016; 30(5): 327–333. Publisher Full Text
- Peck J, Smucker J:
Workplace: the social regulation of labor markets.
Can J Sociol.
1998; 23(1): 118–120. Publisher Full Text
- Perroux F:
Note sur la notion de pole de croissance. Economie Appliquee. F. Perroux, J. Friedmann e J. Tinbergen: A Planiflcação e os Ppõlos de Desenvolvimento, Edições Rés, 1955. Reference Source
- Pohl A, Walther A:
Activating the disadvantaged. Variations in addressing youth transitions across Europe.
International Journal of Lifelong Education.
2007; 26(5): 533–553. Publisher Full Text
- Polyzos S:
Urban development. Kritiki Publications Texts on spatial planning, urban planning and development, 2015; (29): 192–196.
- Porzio T:
Cross-country differences in the optimal allocation of talent and technology.
Econometrica.
2017; 1–51. Reference Source
- Pritchett L:
Where has all the education gone?
World Bank Econ Rev.
2001; 15(3): 367–391. Publisher Full Text
- Psilos P, Gereffi G:
Workforce development in the global economy: linking skills and capabilities to upgrading. In: Gereffi G, Fernandez-Stark k and Psilos P(eds), Skills for upgrading: workforce development and global value chains in developing countries. Duke University: Center on Globalisation, Governance & Competitiveness, 2011; 1–12. Reference Source
- Psycharis Y, Kallioras D, Pantazis P:
Economic crisis and regional resilience: detecting the ‘geographical footprint’ of economic crisis in Greece.
Reg Sci Policy Prac.
2014; 6(2): 121–141. Publisher Full Text
- Rodríguez-Pose A, Terrero-Dávila J, Lee N:
Left-behind versus unequal places: interpersonal inequality, economic decline and the rise of populism in the USA and Europe.
J Econ Geogr.
2023; 23(5): 951–977. Publisher Full Text
- Sala G:
Approaches to skills mismatch in the labour market: a literature review.
Papers: revista de sociologia.
2011; 96(4): 1025–1045. Reference Source
- Smichowski BC, Durand C, Knauss S:
Uneven development patterns in global value chains. An empirical inquiry based on a conceptualization of GVCs as a specific form of the division of labor. (No. 2016-06). Centre d'Economie de l'Université de Paris Nord, 2016. Reference Source
- Somers MA, Cabus SJ, Groot W, et al.:
Horizontal mismatch between employment and field of education: evidence from a systematic literature review.
J Econ Surv.
2019; 33(2): 567–603. Publisher Full Text
- Tan E:
Human capital theory: a holistic criticism.
Rev Educ Res.
2014; 84(3): 411–445. Publisher Full Text
- Teixeira TR:
The state, aerospace multinational corporations and variegated forms of corporate capture in regional training systems: a cross-national comparative study between Charleston. SC, USA and São José Dos Campos, SP, Brazil. PhD Thesis. Syracuse University, 2019. Reference Source
- Teixeira TRA:
Global production networks and the uneven development of regional training systems: conceptualizing an approach and proposing a research agenda.
Prog Hum Geog.
2022; 46(2): 507–526. Publisher Full Text
- Thrift N:
A perfect innovation engine: the rise of the talent world.
Distinktion: Journal of Social Theory.
2008; 9(1): 115–140. Publisher Full Text
- UNESCO Institute for Statistics:
International Standard Classification of Education: ISCED 2011.
Comp Soc Res.
2012; 30.
- Vinayan G, Harikirishanan D, Ling SM:
Upskilling and reskilling the workforce via industry driven technical and vocational education and training: strategies to initiate Industry/Institution partnership in Malaysia.
Journal of Economic Info.
2020; 7(2): 94–103. Reference Source
- Viñuela-Jiménez A, Rubiera-Morollón F, Cueto B:
An analysis of urban size and territorial location effects on employment probabilities: the Spanish case.
Growth Change.
2010; 41(4): 495–519. Publisher Full Text
- Werner M:
Geographies of production I: global production and uneven development.
Prog Hum Geog.
2019; 43(5): 948–958. Publisher Full Text
- Zhu R, Chen L:
Overeducation, overskilling and mental well-being.
B E J Econom Anal Policy.
2016; 16(4): 20150187. Publisher Full Text