Fault Tree Analysis
Qualitative fault tree analysis. In the fault tree analysis, the top event under consideration is EV fires, which represent the ultimate outcome being assessed. This top event branches into four major identifiable causes - human factors, vehicle faults, management factors, and external factors. A fifth major event, which encapsulates unknown causes of ignition, is also included but remains undeveloped in the tree. These five major causes, constituting both developed and undeveloped events, further diverge into seven intermediate and 22 basic events. Since any of these major events could independently trigger the top event, they are interconnected with 'OR' gates. The identifier (ID) used in this qualitative fault tree analysis diagram are detailed in Table 2 and Figure 2 shows the standard qualitative fault tree analysis diagram.
Table 2. Fault tree analysis events and codes linked with the fault tree analysis diagram in Figure 1.
| ID | Event | ID | Event | ID | Events |
|---|
| S01 | Human factors | B3 | Defect | C9 | Short circuit |
| S02 | Vehicle faults | B4 | Degradation | C10 | Trip |
| S03 | Management factors | B5 | Rapid failure | C11 | Other |
| S04 | External factors | B6 | Mechanical abuse | C12 | Other |
| S05 | Unknown | B7 | Thermal abuse | D1 | Animals |
| A1 | Intentional | B8 | Electrical abuse | D2 | Firebrands |
| A2 | Unintentional | C1 | Charger related | D3 | External building fire |
| A3 | Arson | C2 | BESS | D4 | Natural phenomenon |
| A4 | Crash | C3 | Electrical fault | | |
| A5 | Hot work | C4 | Building related | | |
| A6 | Negligence | C5 | Work near live electrical equipment | | |
| A7 | Smoking | C6 | Operating above safe limits | | |
| B1 | Battery | C7 | Failure of equipment | | |
| B2 | Other parts | C8 | Ignition of flammable fuels at charger | | |
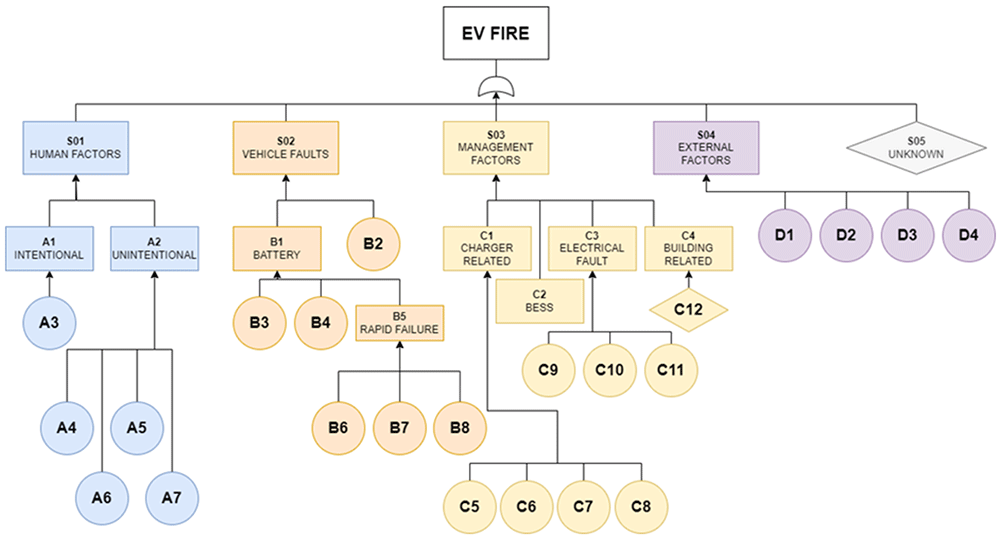
Figure 2. Complete standard qualitative Fault Tree Analysis Diagram for EV fire.
S01 Human factors
The first major event, human factors are referred to as ergonomics, encompass all the elements that influence the interaction between humans and the systems they use31. Human factors leading to EV fires encompass actions, behaviours, or conditions attributable to human interaction that can increase the risk of fire in these vehicles. In this work, the human factors are divided into two intermediate events which are intentional and unintentional. In the intentional category, arson is identified as a basic cause that can lead to a fire. While there are no reports of arson on EV, there is always a possibility that this will happen in the future.
For unintentional fires, the causes are expanded into four basic causes, crash, hot work, negligence, and smoking. A4 refers to crash, which is an unwanted event that is identified to lead to an EV fire. Like other types of vehicles, EV are also prone to crashes due to various human factors including driver error, distracted driving, reckless behaviour, impaired driving, and failure to follow traffic rules, among others32. A5 refers to hot work which encompasses tasks that generate heat, flames, or sparks. Within the automotive industry, this includes procedures like welding on body components, making electrical solder connections, operations involving cutting, or any repair tasks that emanate heat or spark. A6 refers to negligence, in the context of EVs, this pertains to any actions or inactions that amplify the potential for a fire outbreak. Such lapses might encompass inappropriate handling or usage, inadequate maintenance of the EV, or overlooking the safety directives stipulated by the vehicle maker. A7 refers to smoking: smoking within or near to an EV could pose an increased fire risk, particularly when careless practices are observed. Cigarettes, cigars, or other smoking materials can create a fire hazard when they encounter flammable materials33. Inside a vehicle, these materials can include fabric upholstery, seat covers, floor mats, or other flammable interior components.
To effectively prevent and avoid EV fires, it's crucial to understand and address these basic causes. In the case of unintentional causes, strategies might involve improving vehicle design and manufacturing standards, promoting safe charging practices, and implementing robust vehicle monitoring and safety systems. For intentional causes, solutions may focus on raising awareness about the dangers of reckless behaviour, strengthening legal deterrents, and improving surveillance and security measures for EVs.
In both cases, consolidating and analyzing incident data from various sources can provide valuable insights into the specific factors contributing to EV fires, helping to identify potential areas of focus for preventive measures and to continuously improve the safety and reliability of EVs.
S02 Vehicle factors
The second major event, termed ‘vehicle factors’ is defined as the issues relating to inherent characteristics, conditions, or faults within the vehicle itself. Vehicle factors contributing to EV fires can largely be divided into two intermediate causes: issues related to the battery and issues related to other vehicle components.
The battery issues can be extended to two basic causes i.e. defect and degradation and one intermediate cause i.e. rapid failure. B3 refers to defect: These can stem from the manufacturing process or design of the battery18. Manufacturing defects might include contaminants in the battery cell, poor quality control, improper alignment of components, or insulation failure34. Any of these could potentially lead to internal shorts or other malfunctions, causing the battery to overheat and potentially ignite. Design defects might include inadequate safety features, improper thermal management, or insufficient protection against overcharging.
B4 refers to degradation: All types of batteries experience degradation over time, characterized by a gradual loss of capacity and increase in internal resistance35. Battery degradation stems from physical and chemical changes within the cell, primarily observed as capacity fade (a reduction in the usable capacity) and power fade (a reduction in the deliverable power). Key degradation modes include loss of active material, reduction in available lithium for transport between electrodes, and changes in impedance or resistance. Common mechanisms causing degradation encompass solid-electrolyte interphase (SEI) formation, lithium plating, particle fracture, and the interaction between various degradation processes. As batteries degrade, the structural and chemical alterations can compromise the cell's integrity, potentially leading to internal short circuits, overheating, or thermal runaway, all of which elevate the risk of fires.
B5 refers to rapid failure: This intermediate cause generally refers to sudden catastrophic battery failure, often involving thermal runaway36. Rapid failure can be triggered by severe mechanical, thermal, and electrical abuse in which can be further derived to be the potential basic causes of EV fire37. The first basic cause is B6 refers to mechanical abuse: This refers to any form of physical damage to the battery, which can be caused by accidents, mishandling, or poor maintenance38. Mechanical abuse could result in deformation of the battery components or even rupture of the casing. For example, a severe car crash could physically damage the battery pack, potentially causing an internal short circuit or a breach of the battery's protective casing. Both could lead to rapid failure, such as thermal runaway, which can in turn cause a fire. B7 refers to thermal abuse which is exposing the battery to extreme temperatures, either too high or too low36. Overheating can be particularly dangerous as it can cause the battery's electrolyte to break down, leading to a build-up of gas and potentially causing the battery to explode36. For example, if a battery overheats, the breakdown of its electrolyte can produce excess gas, potentially leading to an explosion and subsequent fire. A well-designed thermal management system is crucial in an electric vehicle to avoid such issues and to keep the battery operating within its ideal temperature range39. B8 refers to electrical abuse: This typically refers to inappropriate charging or discharging conditions, such as overcharging, undercharging, or rapid charging/discharging beyond the battery's design limits36,40. Overcharging can cause lithium-ion batteries to heat up and could potentially lead to thermal runaway40. For instance, overcharging a lithium-ion battery can induce excessive heat, pushing it towards thermal runaway, which can ultimately spark a fire, highlighting the perils of electrical misuse41. Rapid charging or discharging can strain the battery and accelerate degradation, increasing the risk of failure.
By understanding these basic causes, strategies for prevention and mitigation can be formulated and implemented. This includes designing robust safety systems, improving manufacturing practices, implementing rigorous quality checks, and raising awareness among users about proper maintenance and operation. Also, data collection and analysis from real-world incidents can help in identifying patterns and refining preventive measures over time.
S03 Management factors
The third major event are management factors that relate to the operational processes, policies, and maintenance practices related to the vehicle. Management factors can significantly contribute to EV fires, and these can be broken down into four main intermediate causes: charger-related incidents, battery energy storage system (BESS), electrical faults, and building-related issues.
C1 refers to charger related incidents: Chargers for electric vehicles need to handle high levels of electrical power, making them potential fire hazards. Basic causes that can lead to charger-related incidents include working near live electrical equipment (C5), operating chargers above safe limits (C6), equipment failures (C7), and ignition of flammable fuels at the charger (C8). Enhancing safety protocols around charger use, enforcing safe operational limits, regular maintenance, and ensuring the charging area is free from flammable materials can minimize these risks. C2 refers to battery energy storage system (BESS): The BESS of an electric vehicle is intricate and requires effective management to maintain safety. Poor design, substandard manufacturing, and misuse are potential basic causes of failure. By improving design and manufacturing processes, conducting regular maintenance, and educating users, the risk of BESS-related fires can be reduced.
C3 refers to electrical faults: Electrical faults are a primary concern in EV fire incidents. Basic causes of such faults can include short circuits and tripping. These issues could originate from manufacturing defects, wear and tear, lack of maintenance, or improper installation. Regular inspections and maintenance, effective design and manufacturing practices, and proper installation can significantly reduce the risk of such faults leading to fires. C4 refers to building-related issues: Issues related to building structures, including insufficient fire safety precautions or inherent design flaws, can increase the risk of EV fires during charging sessions inside these buildings.
By identifying these basic causes, efforts can be focused on improving safety protocols, enhancing vehicle design, and educating users to effectively prevent and avoid fires related to electric vehicles.
S04 External factors
The fourth major event is external factors which are typically beyond the control of vehicle manufacturers, owners, or operators. External factors also pose a significant risk of leading to EV fires. These can generally be categorized into four basic causes: animal interference, firebrands, external building fires, and natural phenomena.
D1 refers to animal interference: Certain types of animals, such as birds or rodents, can pose an external fire risk to electric vehicles. These animals may carry flammable materials, such as dried grass or twigs, for their nests, which could be left near or inside the vehicle. Additionally, some larger animals may knock over external heating sources or ignite flammable materials through other means. These situations could potentially cause a fire that might spread to the vehicle. To prevent such scenarios, it is recommended to park vehicles in areas that are not easily accessible to wildlife, and to regularly inspect and remove any accumulated materials near the vehicle.
D2 Firebrands: Firebrands are burning pieces of airborne wood or vegetation that can land on or near an EV, posing a fire risk42. The threat is especially significant in areas prone to wildfires. Vehicles should be parked away from vegetation, and in covered areas during wildfire events, to minimize exposure to firebrands. D3 refers to external building fires: If an EV is parked inside or near a building that catches fire, it could also be set alight. Keeping the vehicle in well-maintained, fire-resistant structures, and ensuring proper fire safety measures in the building (like smoke detectors and fire extinguishers), can mitigate this risk. D4 refers to natural phenomena: Certain natural events like lightning strikes or extreme weather conditions can cause fires in EVs43. While such incidents are largely unpredictable, keeping vehicles sheltered during extreme weather and installing lightning protection systems in areas prone to such events can offer some level of protection.
Understanding these external factors and implementing preventive measures can significantly reduce the risk of EV fires. Regular inspection, careful storage, and increased awareness of environmental threats are all key elements of fire prevention for electric vehicles.
Quantitative fault tree analysis. In this section, the collected incident data are analysed and discussed as to provide insights of the current trends of EV fires from the involved countries. The primary intent of this analysis is to determine the failure rates triggering EV fires and identify the predominant causative factors. Quantitative fire risk in this investigation is defined by the annual count of national EV-related fires, balanced against the sum of registered EVs within the country. The choice of this approach is due to the expectation of increasing number of fire cases with the number of corresponding registered EVs in a country. This approach is supported by the qualitative fault tree analysis from the previous section where it was understood that the presence of more EVs will potentially cause more EV fires. As more countries factor EVs into their post-fire assessments as potential ignition sources, and as the existing data-contributing nations supply more information, the analysis will naturally evolve and enhance its accuracy. Therefore, this following quantitative fault tree analysis represents the most comprehensive and reliable quantitative examination achievable with the accessible data as of 2022.
Datasets from six countries were collated and Table 3 summarizes the number of fires, the cumulative number of registered EVs in its corresponding countries, the number of EV fires per registered EVs, the weighted average of EV fires per registered EV per year and the overall weighted average for all datasets. The annual frequency of EV-related fires, based on data presented in Table 2, is graphically depicted in Figure 3, clearly illustrating the stark disparity among the four countries examined. There are no obvious trends over year of incidents based on EV fires per registered EVs in all six countries. Apart from a solitary instance, neither Netherlands, Sweden and Norway exceed a frequency of 3.00 × 10⁻⁴ fires per MW per year, in contrast to Korea, Denmark and Finland where the numbers are generally inconsistent. This notable difference can be primarily attributed to the way the data is collected. A work by a consortium led by Efectis in a European Union project outlines the problems with various countries defining and interpreting information prior entering it into incident report system44. This has led to potential bias in the data collected from different countries. From the limited data, there are no clear trends of incidents as the year progresses.
Table 3. Input data and calculation of the overall number of EV fires per registered EV per year.
| Country | Year | Number of Fires | Cumulative of registered EV | EV Fires/Registered EV | Weighted Average EV Fires/Reg EV/year | Overall weighted average (EV fires/Reg. EV/year) |
|---|
| Denmark | 2018 | 3 | 10541 | 2.85E-04 | 6.52E-04 | 2.44E-04 |
| 2019 | 10 | 15205 | 6.58E-04 |
| 2020 | 18 | 25345 | 7.10E-04 |
| Korea | 2017 | 21 | 25108 | 8.36E-04 | 6.07E-04 |
| 2018 | 21 | 55756 | 3.77E-04 |
| Netherlands | 2020 | 71 | 270303 | 2.63E-04 | 2.92E-04 |
| 2021 | 118 | 381335 | 3.09E-04 |
| Norway | 2016 | 17 | 97532 | 1.74E-04 | 9.97E-05 |
| 2017 | 28 | 138983 | 2.01E-04 |
| 2018 | 8 | 195351 | 4.10E-05 |
| 2019 | 18 | 260692 | 6.90E-05 |
| 2020 | 24 | 340002 | 7.06E-05 |
| 2021 | 32 | 460734 | 6.95E-05 |
| 2022 | 24 | 599169 | 4.01E-05 |
| Sweden | 2018 | 8 | 156331 | 5.12E-05 | 4.96E-05 |
| 2019 | 6 | 207904 | 2.89E-05 |
| 2020 | 20 | 308485 | 6.48E-05 |
| 2021 | 24 | 452413 | 5.30E-05 |
| 2022 | 23 | 610716 | 3.77E-05 |
| Finland | 2015 | 1 | 1587 | 6.30E-04 | 3.04E-04 |
| 2016 | 2 | 3285 | 6.09E-04 |
| 2017 | 0 | 7168 | 0.00E+00 |
| 2018 | 3 | 15499 | 1.94E-04 |
| 2019 | 3 | 29364 | 1.02E-04 |
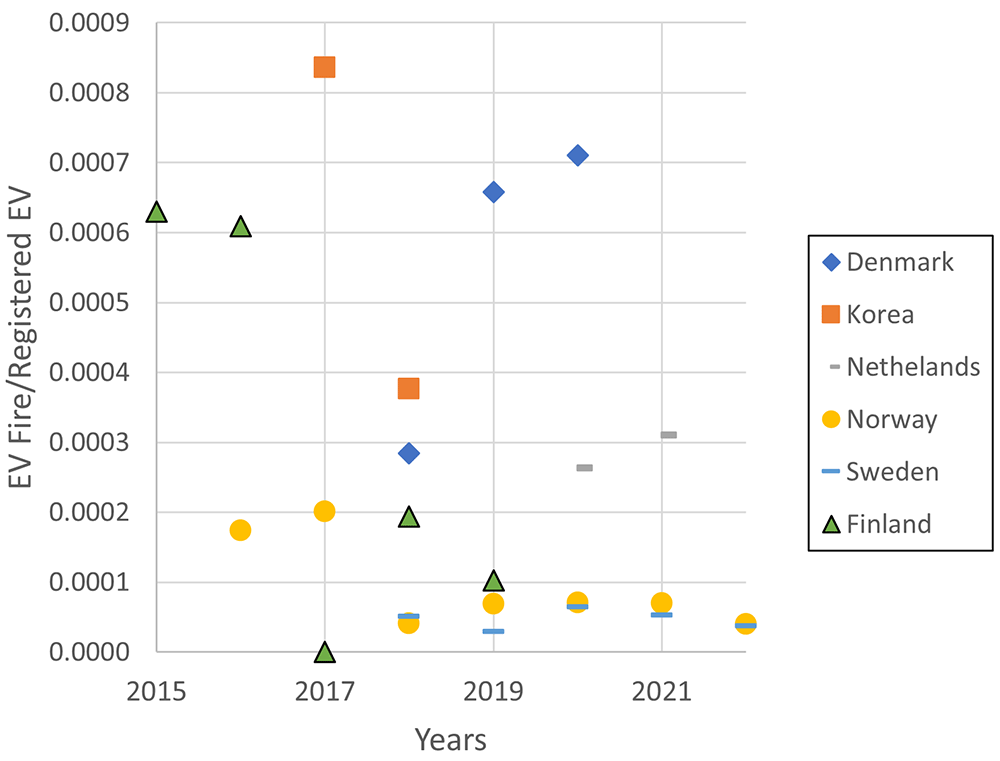
Figure 3. The annual frequency of EV-fires for the six countries over recent years.
In this analysis, a weighted average is used to calculate the annual EV fire frequency of each country. Eventually, considering the data from the six countries, an average annual EV fire frequency of 2.44 × 10⁻⁴ fires per registered EV is produced from the analysis by using a weighted average, factoring in the annual fire count. In terms of per million units, the EV fire frequency is determined to be 244 fires per million registered EVs. This is significantly higher compared to the average value of 5.29 EV fires per million registered EVs reported by Hassan et al.24. The substantial discrepancy between these values can be attributed to the method employed to calculate the fire frequency. In Hassan et al.'s study, fire frequency was computed by summing all EV fire incidents for a specific year, irrespective of location, and then dividing by the global number of registered EVs. In contrast, this study utilizes a weighted average in place of the traditional arithmetic average. This approach ensures that each incident is equally represented, preventing the skewing of data from countries with thorough and consistent reporting systems. Nevertheless, the frequency is an important finding as it provides data-backed information of possible estimation of EV fires based on number of EV registered. Given the uncertainties surrounding the data quality and the potential discrepancies in fire incident reports, this challenges the necessity for further analyses.
The International Energy Agency forecasts that by 2025 and 2030, the number of EVs on European roads will approximate 21.3 million and 56 million, respectively. Given the average annual frequency of 2.44 × 10⁻⁴ fires per registered EV, we can project around 5,194 EV fires in Europe for 2025 and about 13,655 for 2030. These figures are cause for concern, even if they might lean towards overestimation. While advancements in technology are expected to enhance fire safety measures, potentially reducing the real number of incidents, one thing is clear: as the number of EVs on the roads grows, so will the occurrence of EV fire incidents.
In this analysis aimed at ascertaining the frequency of incidents tied to specific causes, only intermediate causes were taken into account. This decision was influenced by the limitations inherent in the data sources, which originated from Denmark, The Netherlands, and Sweden. It's imperative to understand that each of these countries adopts its own unique method for collecting and registering data. Given these disparities in data collection methodologies, ensuring a consistent cross-country analysis became challenging. To overcome this and provide a consistent frame of reference, the authors classified the various causes into intermediate causes. This approach even though with limitations, proved instrumental in identifying which causes are pivotal to focus on in addressing the issues of EV fires moving forward.
Further analysis into the causes of EV fires, Table 4 shows the collated data of identified major causes for the three countries; Denmark, Netherlands, and Sweden; and its normalised average percentage of initiating causes of an EV fire. Given the limited data available, this analysis offers a preliminary insight into the initiating causes of EV fires. The table also presents the frequency of major causes that can lead to EV fire based on the available data. Recognizing the constraints, it is essential to approach the findings with cautious optimism while emphasizing their unique contribution to a relatively uncharted domain.
Table 4. Normalized Percentages of Initiating Causes for EV Fires.
| Major events for EV fire cause | Countries from where data of causes are taken from | Normalised average percentage of initiating causes of EV fire (%) | Number of fires per registered EV per year by causes (Normalised percentage of causes initiating the fire × 2.44E-04) |
|---|
| Denmark % | Netherlands % | Sweden % |
|---|
| S01: Human factors | 16 | 11 | 7 | 9 | 1.90E-05 |
| S02: Vehicles faults | 49 | 25 | 32 | 29 | 5.77E-05 |
| S03: Management faults | 2 | 0 | 22 | 7 | 1.32E-05 |
| S04: External factors | 31 | 0 | 1 | 13 | 2.60E-05 |
| S05: Unknown | 2 | 64 | 37 | 42 | 8.41E-05 |
| Total | 100 | 100 | 100 | 100 | 2.44E-04 |
Figure 4 demonstrates the proportional representation of initiating causes for EV fires based on Table 3. Vehicle Faults are discernible as a predominant cause, representing approximately 29% of incidents. This statistic emphasizes the necessity for rigorous regulatory oversight and enhanced quality assurance protocols in the realm of EVs. Human Factors, accounting for around 9%, exhibit noticeable disparities across countries. While these disparities might hint at cultural, educational, or infrastructural differences, drawing concrete conclusions is rendered intricate due to the aforementioned data acquisition challenges. Equally significant are the External Factors and Unknown Factors categories. The former, contributing to 13% of the dataset, possibly captures a spectrum of environmental and infrastructural elements. Meanwhile, the latter, with a considerable 42% contribution, accentuates the multifarious nature of EV fire incidents and the inherent challenges in pinpointing specific causes. Lastly, Management Faults, though comprising a smaller fraction at 7%, still present considerable variations across countries. This variance underscores the distinct management practices and post-incident procedural differences inherent to each nation. While the data provides a valuable preliminary insight into the causes of EV fires, the nuances and challenges tied to data acquisition across different countries warrant a measured interpretation of the findings.
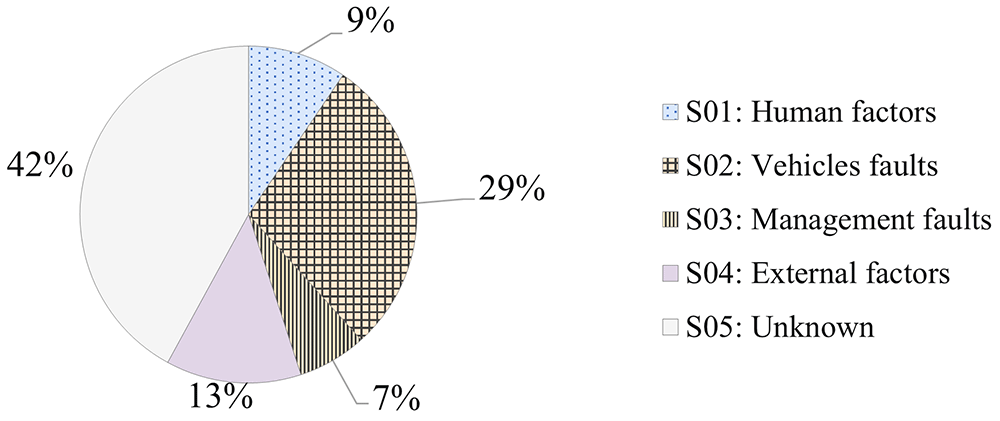
Figure 4. Proportional Representation of Initiating Causes for Electric Vehicle Fires.
Even though the normalized average percentage offers a somewhat unified perspective, the true value of this research lies in its pioneering nature. When juxtaposed with the number of fires per registered EV per year, the data, albeit limited, paints a crucial initial image of EV safety dynamics in these countries. In conclusion, while the data's scope is narrow, this research serves as a much-needed starting point in understanding the complex landscape of EV fires.
The primary limitation encountered in this analytical approach is the scarcity of data. Such a deficiency can potentially undermine the robustness of the conclusions drawn. While it is evident that sparse data may not provide a comprehensive representation of the real-world scenario pertaining to EV fires, it is imperative to underscore that this dataset, albeit limited, offers some foundational insights. In the absence of this data, the academic discourse would be devoid of any empirical evidence on the topic.
The constructed fault tree analysis illuminates the integral role of intermediate and basic causes. As such, these findings should serve as the cornerstone for data collection protocols implemented by first responders, particularly in the context of EV fires. This underscores the need for a homogeneous data acquisition approach, wherein uniform response mechanisms are employed across similar cohorts of responders. A case in point here would be the national fire and rescue services, who emerge as the ideal responders for such endeavours.









