Introduction
Efficient heat transfer has always been a subject of considerable interest and is essential for enhancement of a system’s overall performance, energy efficacy, and to minimize operational costs1. Phase change heat transfer holds paramount importance in energy-related fields owing to its substantial amplification of heat transfer due to the difference between latent and sensible heat2. Heat transfer enhancement techniques are categorized into two methods; active and passive techniques1. Active techniques rely on mechanical or electrical energy input to produce oscillations or disturbances in fluid flow1,3. On the other hand, passive techniques are more commonly used in industries as they offer ease of implementation, simplicity and cost-effectiveness. Moreover, they do not require any external power input beyond fluid movement1. Passive techniques generally involve geometrical modification which increases the surface area and/or facilitates condensate removal (typically done for high Reynolds numbers2 coiling of wired tubes around the component and incorporation of fins, fluted or grooved tubes, and wavy surfaces1–3. Other passive techniques include increasing roughness of surfaces and deposition of coatings3. Augmentation of heat transfer by increasing surface roughness is achieved by expanding the net contact area for heat exchange and by increasing the number of nucleation or precipitation sites. Surface roughness of a material can be achieved through mechanical, chemical and electrochemical methods. In terms of surface coatings, surface wettability plays a pivotal role in upgrading heat transfer performance4. It is assessed through the contact angle formed between condensing fluid and the surface of material5. For condensation heat exchangers, heat transfer through surface wettability is classified into two modes; film condensation (FC) and dropwise condensation (DwC). In FC, the condensate envelops the surface as a continuous liquid film and sheds due to gravitational force whereas DwC involves formation of discrete vapor-condensed droplets on the surface instead of formation of a continuous film. Substantial research demonstrates that dropwise condensation exhibits superior heat transfer efficiency than film condensation5. Another approach to enhance heat transfer is based on introduction of slippery liquid-infused surfaces (SLIPS) which are known for their high water sliding ability and surface smoothness resulting from the presence of a liquid layer6.
In a study conducted by Ma et al., it was demonstrated that steam condensation heat transfer on a hydrophobic and hydrophilic hybrid surface is approximately 23% greater compared to complete dropwise condensation. This improvement was observed at a surface subcooling of 2.0 K, with the width of hydrophobic region being around 0.55 mm. Additionally, modifying surface subcooling, maximum droplet radius and droplet size distribution with a vertically patterned hybrid surface was identified as a viable approach for enhancing and optimising condensation heat transfer performance. It was also established that heat transfer performance of steam condensation decreases with increase in width of the hydrophilic region7. Peng et al. showcased that the primary factors influencing dropwise condensation heat transfer encompass steam temperature, steam velocity, the resistance to heat transfer at the gas-liquid interface, and the presence of non-condensable gases. In this research, various micro-structured surfaces, including cylinders, cubes, cones, and pyramids, with a uniform height of 6μm were created on silicon surfaces. The study unveiled that, under equivalent conditions (steam pressure of 0.1 MPa, saturated steam temperature of 100°C, and steam flow rate at 0.298 ± 0.02 m³/h), the heat flux across all micro-structured surfaces displayed a linear increase with increase in the cooling water temperature difference and subcooling. The cylindrical micro-structured surface, having superhydrophobic properties with a contact angle θ = 158.4°, displayed optimum results owing to its less sharp edges and larger contact angles5. In another study, a liquid-infused smooth surface, ‘SPLASH’ (surface with π electron interaction liquid adsorption, smoothness, and hydrophobicity) was presented as a solution to the challenges posed by rough surface structures. It was established that the maximum condensation heat-transfer coefficient of SPLASH was 175% higher compared to an uncoated substrate and it also outperformed superhydrophobic surfaces and SLIPS in terms of droplet mobility and the thermodynamic energy barrier for nucleation, resulting in superior heat transfer and more consistent dropwise condensation. Moreover, presence of a smooth base layer and the utilization of a low-viscosity infusing liquid proved to be essential factors in augmenting droplet mobility and enhancing the efficacy of heat transfer. SPLASH displayed better dropwise condensation performance and heat transfer over extended periods, compared to those achieved with rougher surfaces6. In a study by Lo et al., a three-dimensional (3D) hybrid surface, entailing a combination of superhydrophobic silicon nanowire (SiNW) arrays and hydrophilic micro-channels, was investigated to amplify the efficiency of condensation under elevated subcooling temperatures. A notably high heat flux of 655 ± 10 kW/m² was achieved using this 3D hybrid surface. It was exhibited that the nanostructures on the 3D hybrid surfaces bolster the heat transfer coefficient whereas the micro-channels facilitate the efficient drainage of condensed droplets leading to an improve in the condensation heat transfer coefficient and heat flux8.
Zhang et al., carried out an investigation to develop prediction methods for thermal-hydraulic performance to measure frictional pressure drop and heat transfer coefficients for flow condensation in plate heat exchangers, with a specific focus on their applicability to organic Rankine cycle and heat pump systems. They evaluated seven working fluids namely hydrofluorocarbons (R134a, R236fa, and R245fa), hydrofluoroolefins (R1234ze(E) and R1233zd(E)), and hydrocarbons (propane and isobutane), for condensation temperature conditions, ranging from 30°C to 90°C. Their findings suggested that the frictional pressure drop and the heat transfer coefficient exhibit an increase with the increase in mass fluxes and a decrease with elevated condensation temperatures. This indicated that shear-controlled condensation was the prevailing mechanism throughout all working conditions. Moreover, R1233zd(E), isobutane, and R245fa demonstrated superior heat transfer coefficients than other working fluids. This was attributed to their lower vapour density and higher surface tension, which resulted in intensified convection at the interface between the liquid and vapour phases. Additionally, R1233zd(E), R236fa, and R245fa established higher frictional pressure drops due to their larger density ratios between the liquid and vapour phases9. Dropwise condensation is strongly dependent on surface orientation of the condenser, where in contrast to a horizontally oriented surface, a vertically oriented surface minimizes the departure size of a droplet thus leading to an increase in heat transfer10. Boreyko et al. demonstrated that surface orientation of a condenser has a significant impact on the droplet size distribution and heat transfer of jumping droplet condensation. On the horizontal surface, the maximum droplet size achieved was Dmax ≈ 1.4 mm, whereas Dmax ≈ 160 µm was attained on the vertical surface (α = 90°). This was attributed to the inability of droplets to shed on a horizontal surface. These droplets had stuck to the surface due to gravitational return or difference in size. A vertically inclined surface allowed for the removal of trapped droplets through gravitational shedding which also removed neighbouring condensate. In a partially inclined surface, α = 45°, it was observed that large, stuck droplets rolled down the surface due to synergistic working of capillary-inertial and gravitational effects. The projected surface coverage of dropwise condensation levelled off to a self-similar value of around ε2 ≈ 0.7 for horizontal surface, ε2 ≈ 0.45 for partially inclined surface and ε2 ≈ 0.3 for vertical surface. These authors observed an enhancement in condensation heat transfer by approximately 40% and 100% for partially inclined surface and vertically inclined surface, respectively11. Another study by Moosavi et al., utilised spraying to develop a hierarchical micro-nano coating on aluminium substrate. In their findings, the authors observed that the fabricated surface was highly superhydrophobic exhibiting a contact angle of 158° and the contact angle hysteresis observed was less than 5°. Moreover, at a surface temperature of 70°C, relative humidity of 98% and sub-cooling temperature of 25.5°C, the heat transfer coefficient of the coated sample increased by 20.6% in comparison to that of bare aluminium substrate12.
Lee et al. fabricated superhydrophobic silver/silica (Ag/SiO2) coatings on aluminium substrates using a process involving screen printing, spray-coating and co-firing. The authors compared thermal conductivity of Ag/SiO2 coating with polyurethane/silica (PU/SiO2) coating. Ag/SiO2 coatings exhibited a thermal conductivity of 83.32 W/m·K which was 40 times superior to that of PU/SiO2 coating (2.63W/m·K) thus owing to this higher thermal conductivity, faster dropwise condensation was observed in Ag/SiO2 coatings. The superior thermal conductivity of Ag/SiO2 coatings was because of the highly thermal conductivity Ag (KPU = 429 W/m.K) in comparison to that of PU (KPU < 1 W/m·K)13. Martucci et al.14 deposited a hybrid octyl-modified silica coating on aluminium (Al) substrate using sol-gel technique and studied its thermal efficiency and durability during saturated vapour condensation. The hybrid silica-based coating constituted of 20% octyltriethoxysilane and 80% tetraethylorthosilicate (O2T8). DWC was observed on the coated aluminium surface throughout the period (7 hours) of condensation tests and a stable thermal performance was observed with the heat transfer coefficient (HTC) value of ~90 kW/m2.K. This dropwise condensation HTC was nine-fold higher than HTC evaluated from FWC under analogous heat flux conditions by Col et al.15.
This research is within the framework of a European commission project called GeoHex, where coatings are developed for commercial heat exchangers for geothermal power plants for improving efficiency, anti-scaling and corrosion performance. In particular, this paper discussed the phase II of III of the testing of coatings, more information about the project can found in reference16. The paper is focused on observing how parameters such as wettability or adhesion change as a function of exposure to an organic Rankine cycle (ORC) fluid (in this case, R-134a), while the thermal performance is evaluated, the results of this were used to select a coating for further trials in a commercial heat exchanger.
Methods
Heat transfer performance evaluation
In order to measure the heat transfer performance of the bare substrate and coatings materials, tests were conducted in a mock up heat exchanger device designed and fabricated by Spike Ltd, see Figure 1. This device was equipped with temperature, pressure and flow sensors, both for inlet and outlet sides of the fluids in both cooling and condensation chambers. In brief, the test consisted of passing a cool fluid by one side of the plate, and ORC fluid (R-134a) was condensed on the other side of the plate. The tests were conducted on plates of 100mm x 100mm by 6mm thickness, in vertical1 position (allowing the rolling of the condensing fluid), see schematic of Figure 1; the testing plate itself was used to separate the water-cooled side of the system from the condensation chamber. The testing plate was fixed to the system using a bolt clamping system, and nitrile rubber O-rings for sealing. For the cold side, water was used, which was cooled in the refrigeration vessel to 5 °C, and pumped (in a close loop system) towards the cooling side of the testing plate (the flow of water ran parallel to the plate), therefore, before contacting the plate, the water temperature could be slightly increased. For the organic fluid (R134a), this was heated to ≈43 °C (in the chamber where a heating element was located), in order to reach a target temperature of ≈ 35 °C in the testing plate condensation chamber. The pressure on the condensation side was 9 bars.
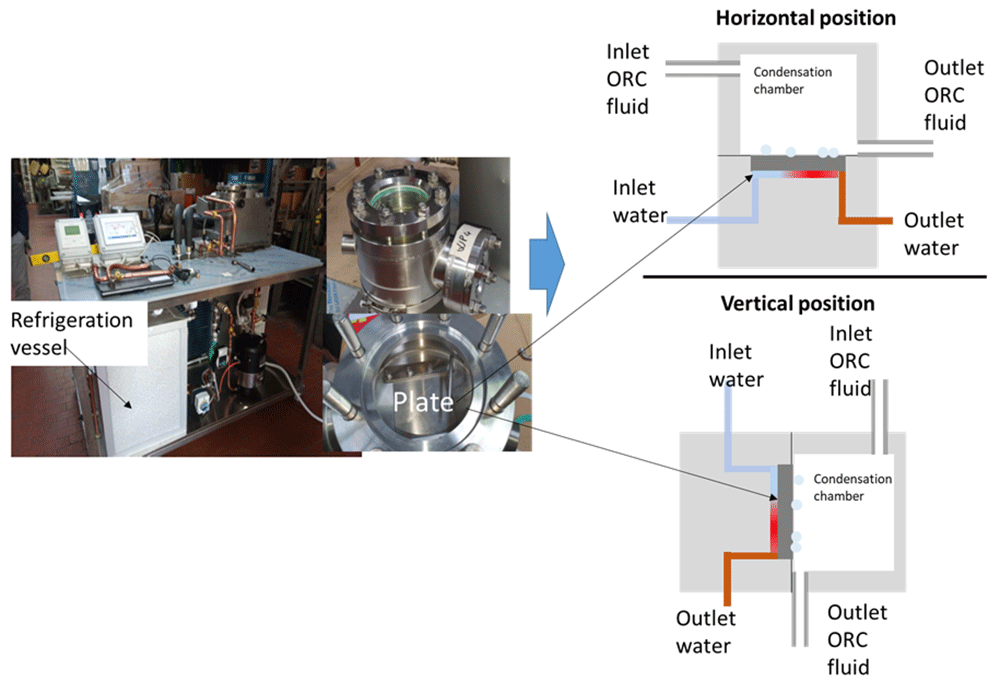
Figure 1. Photography of the fabricated heat transfer testing rig, including schematic of the testing chamber in vertical and in horizontal position.
The heat transfer performance was evaluated using two metrics, heat flux, denoted as q, and overall heat transfer coefficient, denoted as U. The Heat flux (or heat flux density) is a measure of energy transfer from the hot fluid to the cold fluid per unit area per unit time. It is assumed that the increase in energy in the cold fluid is equal to the decrease in energy in the hot fluid. Heat flux is calculated as:
where ρ is the cold fluid density in kg m-2, cp is the cold fluid specific heat capacity in kJ kg-1 K-1, is the cold fluid flowrate in m3 s-1, A is the surface area of the substrate in m2, and To and Ti are the cold fluid outlet and inlet temperatures respectively. In most cases, heat flux will be measured in kW m-2.
The overall heat transfer coefficient is the proportionality constant between heat flux and temperature gradient, which in this case is the log mean temperature difference. Since the hot fluid is at saturation temperature with no large differences between inlet and outlet temperature, it is assumed that all of the energy loss in the refrigerant results in phase change. Therefore, log mean temperature difference is measured as:
where Tr is the refridgerant temperature. Note that Tr > To > Ti. The overall heat transfer coefficient can be calculated as:
Due to the small differences in the heat transfer performance indicators in some cases and due to the influence of external variables such as ambient temperature, the data was analysed statistically, this analysis is presented in the result section.
Wettability evaluation
The wettability of the surface studied was determined by performing static and dynamic contact angle measurements in deionised water and diiodomethane before and after testing; the tests were performed in a drop shape analyser DSA100 from KRÜSS. In this paper, the static water contact angle in the two selected fluids will be reported, along with the advancing (WCA [A]) and receding (WCA[R] contact angle, the contact angle hysteresis (CAH) and roll off tilt angle from the dynamic contact angle measurements.
Adhesion evaluation
To determine the adhesion of the coatings, tests according to ASTM D3359 (Standard Test Methods for Rating Adhesion by Tape Test) and to ASTM D4541 (Standard Test Method for Pull-Off Strength of Coatings Using Portable Adhesion Testers) were conducted, this last test was conducted using a Elcometer 510 Automatic Pull-Off Adhesion Gauge. For the tests according to ASTM D3359, the tape adhesion grade was qualified according to the following scale: 5B, 4B, 3B, 2B, 1B and 0B. The criteria for each definition can be found in the standard, but in summary, 5B and 4B are considered good ratings; and 1B and 0B poor ratings and the adhesion grade is determined based in the number of quadrants of the coating removed by a tape after the test is carried out.
Materials and coatings
A list of the materials and coatings used for the tests is shown in Table 1. Two different approaches were used, in order to obtain different levels of hydrophobicity, the first type of coating was an amorphous metal coating, where the surface of the bare aluminium was shifted from hydrophilic to hydrophobic without affecting the surface finish/roughness and the second type of coating was targeted to achieve super-hydrophobicity (or close) by altering the surface roughness and adding low surface energy materials.
Table 1. Test samples used for detailed heat transfer performance evaluation.
| Substrate | Position | Coating side | Surface preparation | Coating type | Coating name |
|---|
| Aluminium | Vertical | | As-received | - | |
| Aluminium | Vertical | Two faces | Grit blasting + degreasing + etching + anodising | Sharc® Sapphire (25%wt) + SMS35 particles (dual functionalised) (75%wt) | Sharc ® Sapphire silica |
| Aluminium | Vertical | Two faces | Grit blasting + degreasing + etching + anodising | Tutoprom™ (50%wt) + SMS35 particles (dual functionalised (50%wt) | Tutoprom™ Bright silica |
| Aluminium | Vertical | One face | As received | Amorphous hydrophobic Si:Nd:Zr | Amorphous Si:Nd:Zr |
Silica based coatings
Substrate: Aluminium with 100 x 100 x 6 mm dimensions was used as a substrate.
Surface pre-treatment: For a better adhesion of coating to the substrate, substrates were pretreated using the following procedure:
Step 1: Grit blasting - (aluminium oxide grit #100, 30 psi applied pressure in a position of 45°, 10 cm away from the nozzle). Grit blasting was performed in order to build-up microscale roughness (top-down modification).
Step 2: Degreasing – samples were immersed in the solution of METFIN AK 16 (NST cleaner): a cleaner that consists of tetrasodium pyrophosphate, sodium hydroxide, sodium metasilicate and distilled water, purchased from Silmid. Immersion was carried out for 15 minutes in thermal bath at 65°C (using a heater from T100 from Grant instruments).
Step 3: Etching – samples were immersed in sulphuric acid and sodium dichromate solution in thermal bath at 65°C for 30 minutes.
Step 4: Anodizing – in orthophosphoric acid solution carried out for 20 minutes.
Coating procedure: The coating procedure used can be divided into three steps, (1) Synthesis of silica nanoparticles, (2) functionalization of silica nanoparticles, and (3) reinforcement of functionalized silica nanoparticles into coating matrix.
Step 1: Silica nanoparticles were prepared using the sol-gel Stöber process1, enables the fabrication of monodispersed, porous particles that can be made in a range of sizes. Briefly, desired amount of tetraethoxysilane (TEOS), methylated sprit (alcohol), water and ammonia were mixed with a magnetic stirrer in a sealed vessel, vigorously for four hours, followed by keeping the mixed solution undisturbed at room temperature for 24 hours. Later, the mixed solution was cleansed via evaporation at a rotovap Stuart model RE300DB at 65°C, where the removed solvent was replaced with fresh ethanol, this step was repeated twice before the final product was ready for evaluation. It was found by dynamic light scattering (DLS) using a malvern zetasizer that the synthesized silica nanoparticles showed monomodal size distribution with an average size of 35nm.
Step 2: Functionalisation of silica nanoparticles was done using silane coupling reagents, with aim exchanging the surface silanol groups with aliphatic hydrocarbon or fluorocarbon groups to reducing surface energy levels and promote hydrophobicity (Figure 2). The procedure used for this reaction is to mix until homogeneous (max one minute) the silica nanoparticle with a silane reagent and catalyst, and leaving overnight at 65°C inside a fume hood. To maximise the potential repellency characteristics of the nanoparticle, as close to monolayer coverage as possible is required. Here, dual functionalization of silica nanoparticles was done using Trimethoxy (3,3,3-trifluoropropyl) silane and Hexamethyldisilazane (used for Sharc® Sapphire). The functionalized silica nanoparticles are referred as SMS35.
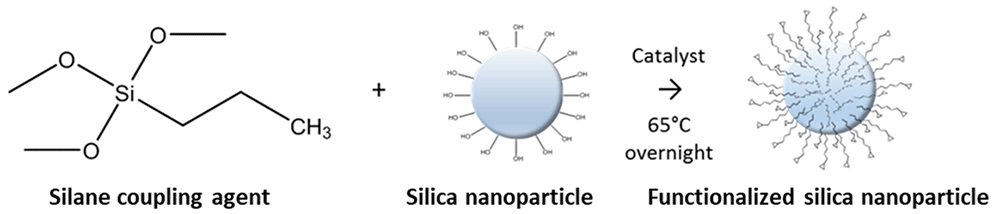
Figure 2. Functionalization of silica nanoparticles.
Step 3: Two different types of coatings were used, namely Tutoprom™ Bright and Sharc® Sapphire, supplied by durxtreme and sharc ® matter respectively. Both of them are polysilazane based coating formulations which react with the surface and moisture from the atmosphere to cure, neither contain fluorine. Different wt.% of functionalised silica nanoparticles were incorporated into these matrices (Table 1).
The coating formulation was applied on the substrate via dip coating with a speed of 100 mm/min, followed by the curing as per manufacturer’s guidance.
Amorphous coating. The amorphous metal coatings were prepared by direct current magnetron sputtering (dcMS) from 4” diameter circular planar magnetrons in a custom-built high vacuum deposition system with a base pressure of the order of 10-6 mbar. The coatings were deposited onto aluminium substrates (100 x 100 mm2) which were cleaned in acetone and isopropanol prior to being inserted into the vacuum system. Before deposition, a radio-frequency plasma etch (100 W for 15 minutes at 30 sccm Ar flow) was performed in-situ to remove the native surface oxide. This mild etch should not introduce any significant surface roughness. Sputtering was carried out in an Ar flow of 40 sccm which resulted in a chamber pressure of 3.6x10⁻³ mbar. First, a 200-nm-thick Cr layer was deposited from a 99.9% pure Cr target to promote adhesion to the substrate. Subsequently, the 1-μm-thick Si:Nd:Zr layer was grown from a composite target of 99.9% purity with an applied magnetron power of 600 W. The samples were placed on a rotating sample holder and were continuously rotated during growth to ensure thickness uniformity. No substrate heating was employed, in order to avoid the crystallisation of the Si:Nd:Zr film. Nonetheless, a bias voltage of 100 V was applied to the sample holder throughout to increase density and adhesion but this did not result in crystallisation. This was confirmed by x-ray diffraction (XRD) measurements in both grazing incidence (GiXRD) and standard θ-2θ geometry in a Panalytical Empyrean x-ray diffractometer. XRD measurements are employed both to confirm the absence of clear peaks corresponding to crystalline phases but will also display the characteristic broad peak or halo associated with the amorphous structure of the material. This halo was observed clearly in all cases.
The selection of the Si:Nd:Zr alloy described here is the result of a comprehensive screening of a range of compositions to optimise for hydrophobicity. Combinatorial methods were employed whereby samples with composition gradients were fabricated and characterised in terms of their amorphicity, corrosion resistance and hydrophobicity. The combinatorial optimisation procedure is described in detail in Reference 17 for similar amorphous ternary alloy systems. The substrate preparation procedure was designed to emphasise the effects of coating composition on hydrophobicity, irrespective of surface morphology. Future implementations could aim to apply this coating to a surface with the multiscale roughness needed for superhydrophobicity.
Statistical analysis of the data
To determine the heat transfer performance indicators, statistical analysis over the data was performed. The preliminary analysis started with time series analysis. The important time series measurements for heat transfer evaluation are water inlet and outlet temperatures, refrigerant temperature, and flowrate. Each of these measurements were taken ten seconds apart, and therefore adjacent measurements are highly correlated (i.e., a high degree of association). Hourly averages (mean) were determined in order to get a more statistically independent sample. This made adjacent raw measurements like To and Ti (see section heat transfer performance evaluation for notation) no longer significantly correlated, see Figure 3a (and b). However, the calculated metrics q and U were still showing high levels of autocorrelation (i.e., correlation between adjacent measurements), see Figure 3 (c and d). This is not surprising as To is strongly and similarly affected by Ti, so variables dependent on their difference have much less variation and show more subtle patterns (like the ambient temperature effect).
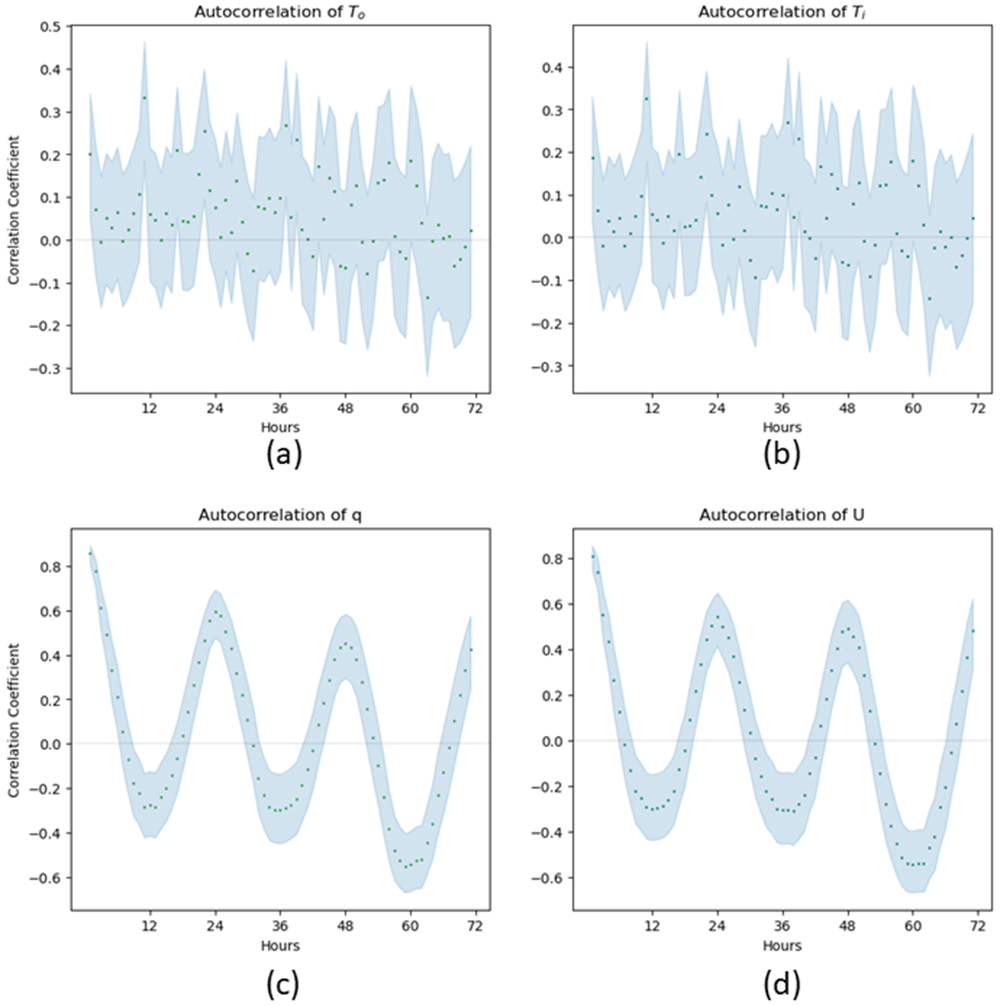
Figure 3. Autocorrelation Graphs of horizontal bare aluminium measurements with 95% confidence intervals indicated by blue shading.
It is obvious from the autocorrelation graphs in Figure 3 that q and U variables have a cyclic measurement effect with a 24-hour cycle. Ambient temperature, Figure 4, has a very similar autocorrelation graph, so it was decided that the ambient temperature is an important covariant that should be taken into account in the analysis.
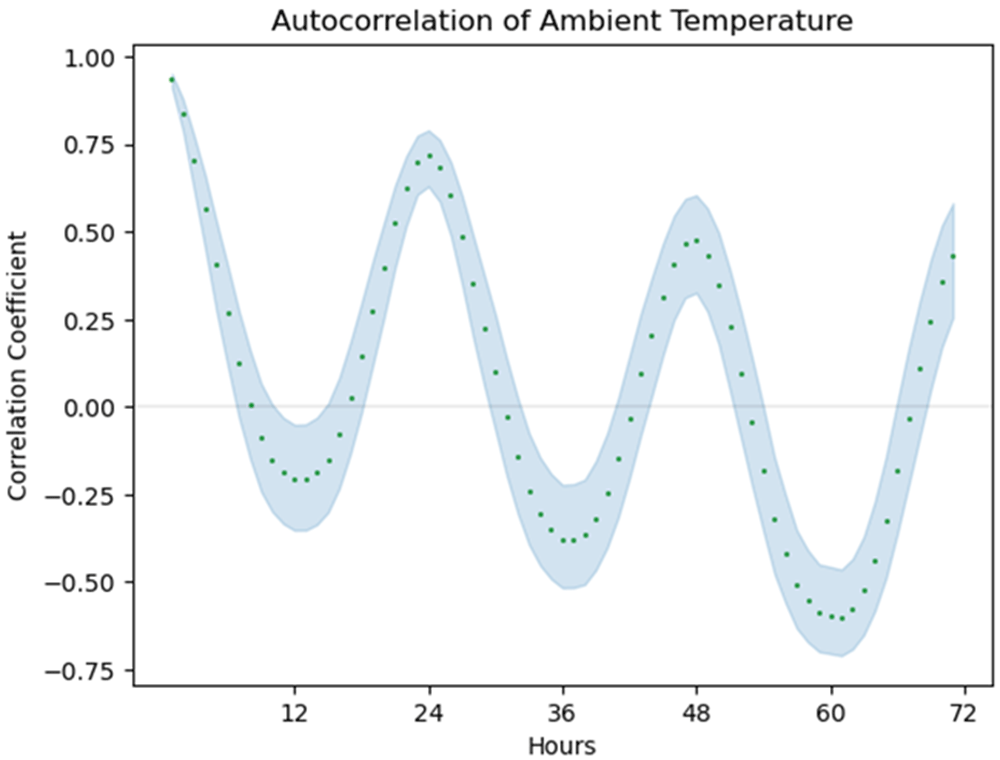
Figure 4. Autocorrelation graph of ambient temperature during the horizontal bare aluminium test with 95% confidence intervals indicated by blue shading.
As seen from Figure 5, ambient temperature seems to have a negative impact on the measurements of the heat transfer performance metrics (in other words, when ambient temperature increases heat transfer performance decreases). One possible explanation for this is that although To and Ti are both affected by ambient temperature, Ti is more affected by ambient temperature, as it is lower than To.
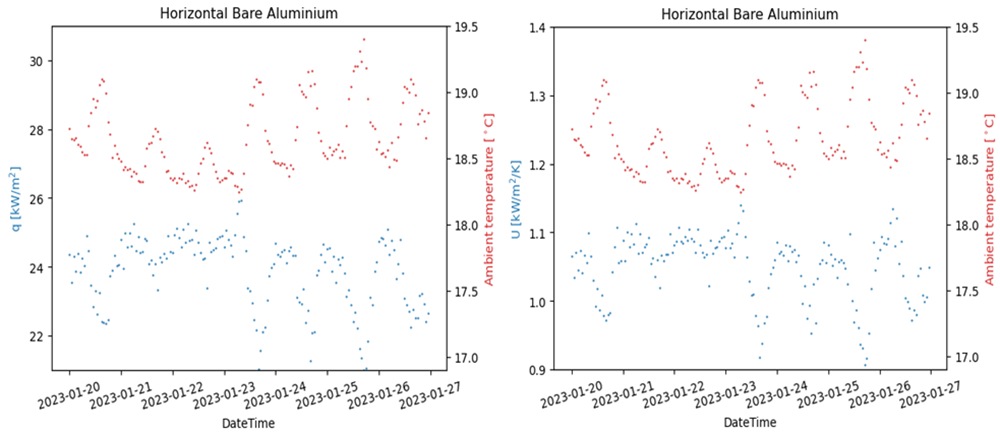
Figure 5. Heat transfer performance and ambient temperature by time.
Figure 6 shows the graphs of q and U by ambient temperature, along with the best-fit lines. By inspection, these graphs indicate a strong linear relationship. We use two metrics to determine the strength of a linear relationship. The first metric is the coefficient of determination, R2, which is a measure of correlation strength ranging from 0% to 100%, with 0% indicating no correlation and 100% indicating perfect correlation. The second metric is the p-value from an F-test comparing a linear model to a random model, which is a measure of the significance of the linear model. The F-test is a standard test to determine the statistical significance of the linear relationship by comparing the variance about the mean to the variance about the line. The p-value can be thought of as a probability of seeing the data assuming a random model instead of a linear one. The smaller the p-value, the more significant the linear relationship. We will consider the linear relationship to be statistically significant if the p-value is less than 0.05. An explanation of both of these metrics and the F-test is provided by Draper et al.18.
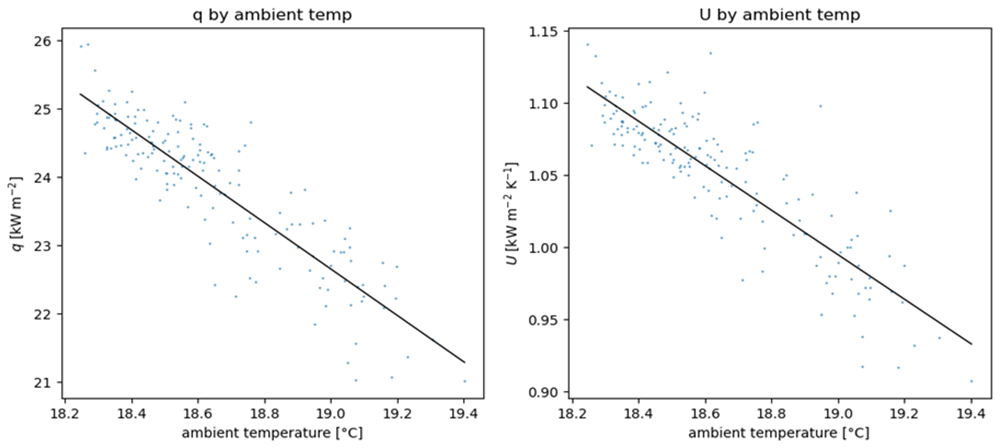
Figure 6. Heat transfer performance by ambient temperature.
In the case of Figure 6, R2 was 78% for q and 75% for U. In both cases an F-test comparing this linear model with a random model gave a p-value<0.001, meaning that this relationship is statistically highly significant. When this linear relationship was taken into account, the residuals (the data minus the best-fit line) were approximately normally distributed and have much less significant autocorrelation (correlation between subsequent hourly means), see Figure 7 and Figure 8.
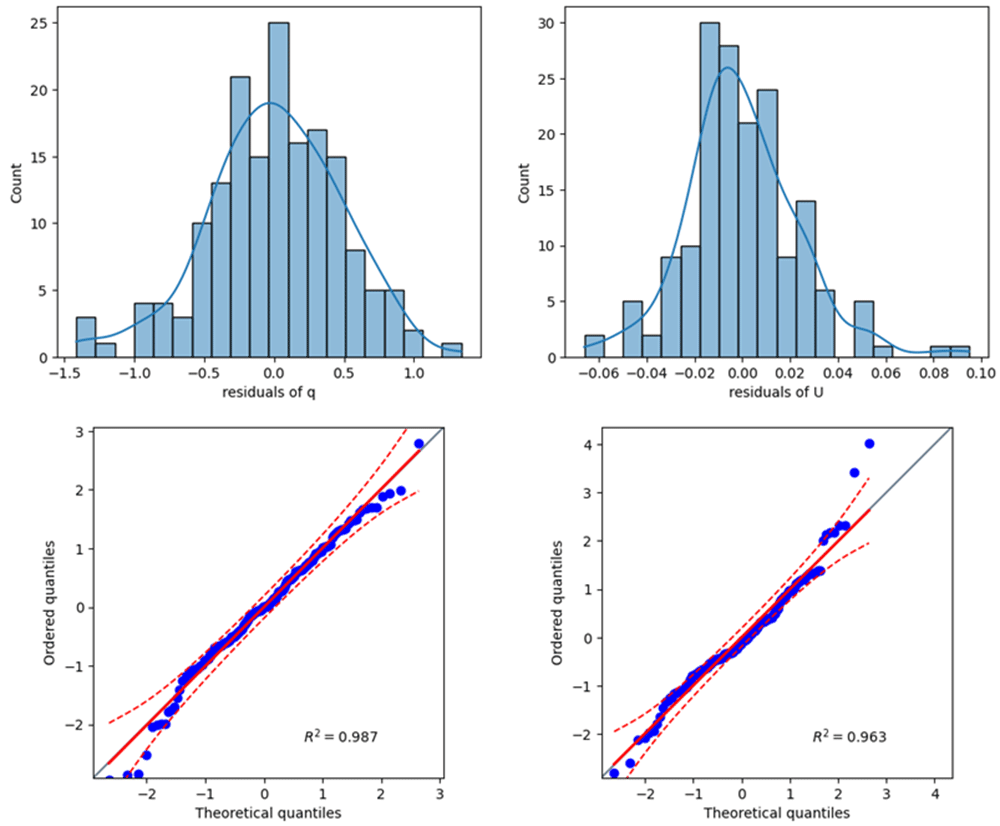
Figure 7. Distribution of residuals on horizontal bare aluminium.
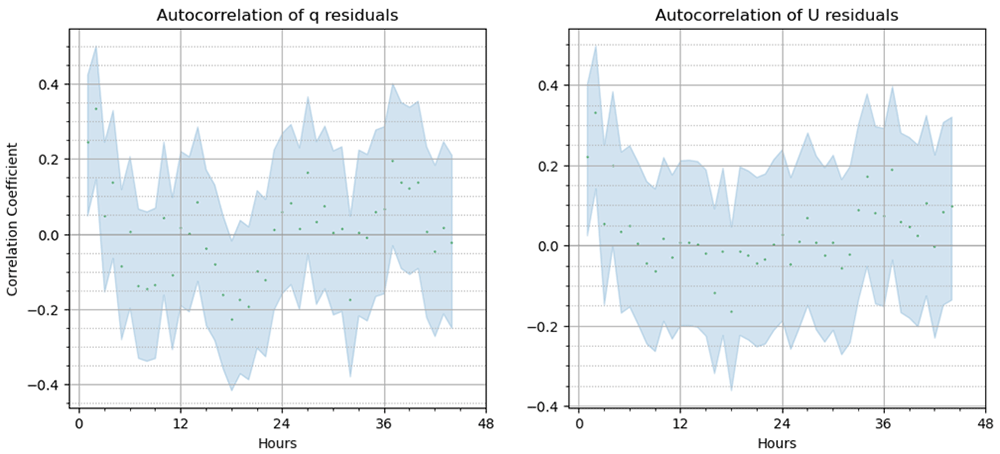
Figure 8. Autocorrelation of residuals on horizontal bare aluminium with 95% confidence interval.
Another important factor is degradation of heat exchange performance over time, an example of which is shown in Figure 9. This was most pronounced in the first day of the experiment, but can last longer. When choosing a sample, inspection of q and U (and their respective residuals) by time was used in order to adopt as much data as possible that did not include performance degradation. In cases when performance degradation lasted for the whole experiment, 48 hours of the best continuous data were chosen with preference for data towards the end of the experiment.
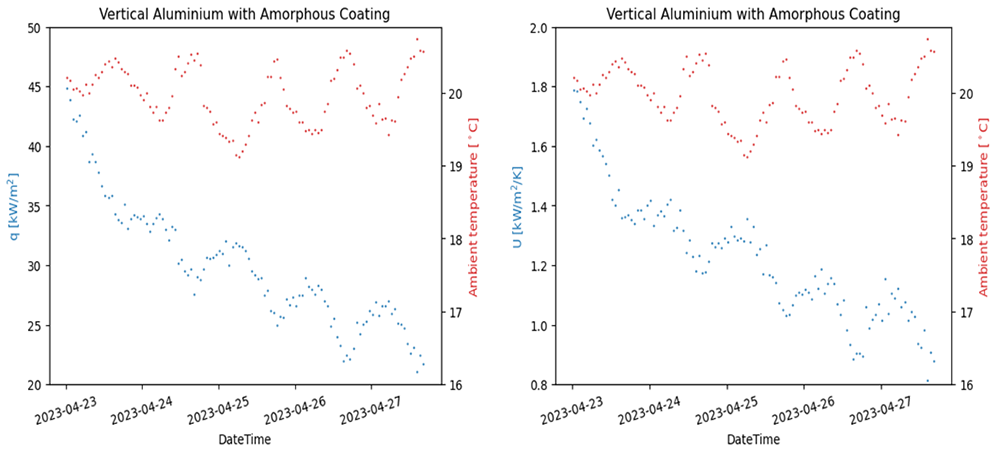
Figure 9. A different experiment demonstrating performance degradation over time.
After choosing the sample of hourly means from a continuous time period, the sample was assessed for a linear relationship with ambient temperature using an F-test. If there was a statistically significant linear relationship with ambient temperature, the residuals were assessed for normality and autocorrelation. Non-linearity was tested with an F-test comparing the linear model with a quadratic model. Confidence intervals denote the confidence on the linear regression18.
If there was no statistically significant relationship with ambient temperature, the sample was assessed for normality and autocorrelation. Confidence intervals denote confidence in the population mean using a t-distribution. This is because the mean of a small sample is t-distributed18.
In both cases, normality was tested with a quantile-quantile plot (Q-Q plot) comparing the data to a perfect normal distribution. The straighter the line on the Q-Q plot, the better it fits a normal distribution. If the line is within a 95% confidence interval, the distribution is approximately normal, see Figure 7 for an example. Autocorrelation was tested with an autocorrelation graph. The closer this graph is to random variation, the less correlated adjacent hourly means are, see Figure 8 for an example. These graphs are often included as figures in this report, especially if there is something to note about them. When confidence intervals did not intersect, a statistically significant difference existed. If confidence intervals did intersect, statistical tests were used. All tests were conducted at a significance level of 0.05.
Any statistically significant improvements observed were followed up with an approximation of the effect size and a judgement on whether this improvement has practical significance. Statistical significance was measured with a p-value and practical significance was assessed from the size of the effect.
Heat transfer performance evaluation
Figure 10 compares the performance of bare aluminium with against the samples with the different type of coatings, as a function of the outer room temperature. Note: the data in Figure 10 was presented this way because it was found that the heat transfer performance indicators were affected by the ambient temperature i.e q and U variables have a cyclic measurement effect with a 24-hour cycle, therefore, the ambient temperature is an important covariant that should be taken into account in the analysis. In addition, it is worth noting that ambient temperature seems to have a negative impact on the measurements of the heat transfer performance metrics (in other words, when ambient temperature increases heat transfer performance decreases). One possible explanation for this is that although To and Ti are both affected by ambient temperature, Ti is more affected by ambient temperature, as it is lower than To. In relationship to the results itself, as observed in Figure 10, none of the confidence intervals overlap and so each coating results in a statistically significant difference in heat performance. All the original heat transfer data can be found in reference 19
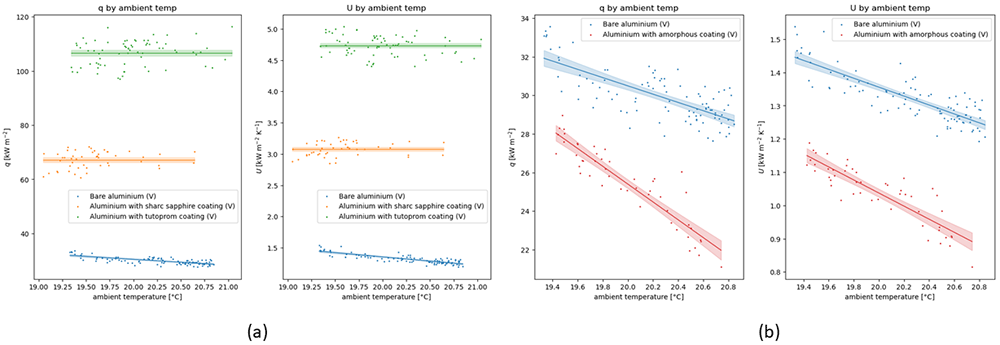
Figure 10.
A comparison of the heat transfer performance indicators q and U as a function of the ambient temperature for the (a) silica-based coatings and (b) the amorphous metal coating.
A summary of presented results shown in Figure 10 is presented in Table 2. The summary statistics for the uncoated material are the regression values at the midpoint ambient temperature. The summary statistics for the coated material are the regression values at the midpoint of the ambient temperatures measured in both the coated experiment and the uncoated experiment. Based on the values used for the comparison, in Figure 10a it can be observed that the silica-based coatings in aluminium (Sharc ® Sapphire silica and Tutoprom™ bright silica), offer an increase in the heat transfer performance, the increase in performance can be up to 253%. When the comparison was established against the amorphous hydrophobic Si:Nd:Zr coating, a decrease of ≈17.5% and ≈24% was observed in the heat transfer performance indicators.
Table 2. Performance metrics for aluminium under condensing heat transfer.
| Coating | q [kWm-2] | Percentage difference
from uncoated | U [kWm-2K-1] | Percentage difference
from uncoated |
|---|
| None (aluminium substrate) | 30.3 | | 1.34 | |
| Sharc® sapphire | 67.2 | +120% | 3.08 | +127% |
| Tutoprom™ bright | 106.6 | +252% | 4.74 | +253% |
| Amorphous | 25.0 | -17.5% | 1.02 | -24.1% |
Wettability evaluation
All the coatings tested are hydrophobic (see properties before testing), water contact angle larger than 90°, and some of them (Sharc® Sapphire silica and Tutoprom™ bright silica) are almost super-hydrophobic, with contact angle hysteresis and roll-off tilt below 10°, and water contact angle very close to 150°. The situation is different in diiodomethane, where all the values are lower.
In terms of the durability of the wetting properties, the values of the water and diiodomethane contact angle obtained before and after exposure to ORC fluid for 200 hours are reported in Table 3 and Table 4. A representation of the results can be seen in Figure 11 for the static measurements. From the column graphs (Figure 11), it can be noted that for all the coatings, the hydrophobicity decreased after exposure to the ORC fluid, the largest difference is in any case below 10%. The decrease in fluid-phobicity is more accentuated in the measurements in diiodomethane, where the decrease is higher, again, in the sample coated with Sharc® Sapphire silica.
Table 3. Performance metrics for aluminium under condensing heat transfer.
| Substrate /coating name | | Water contact angle | St Dev | Diiodomethane contact angle | Standard deviation |
|---|
| As received Bare aluminum | before | 80.95 | 6.47 | 53.95 | 3.85 |
| after | 79.82 | 9.54 | 58.04 | 2.52 |
| Rough Aluminium/Sharc® sapphire silica | before | 148.19 | 0.32 | 109.63 | 0.21 |
| after | 134.39 | 1.06 | 85.06 | 4.72 |
| Rough Aluminium / Tutoprom™ bright silica | before | 146.04 | 1.46 | 98.67 | 0.17 |
| after | 139.22 | 1.36 | 80.52 | 17.88 |
| As received Aluminium /amorphous Si:Nd:Zr | before | 100.38 | 2.0 | 63.15 | 4.7 |
| after | 93.38 | 0.72 | 47.1 | 1.79 |
Table 4. Dynamic contact angle with water and diiodomethane as the probe liquids in samples developed in D3.2 to D3.5 before and after exposure to R-134(a) in condensation tests.
| Substrate /coating name | | Roll-off tilt (o)1 | WCA [R]
(o)1 | WCA [A]
(o)1 | CAH (o)1 | Roll-off tilt (o)2 | DCA
[R]
(o)2 | DCA
[A]
(o)2 | CAH
(o)2 |
|---|
| Aluminium | before | 80 | 77.62 | 102.53 | 24.91 | 26.36 | 36.99 | 74.73 | 37.74 |
| after | 89.38 | 54.31 | 84.59 | 30.28 | 18.76 | 16.95 | 60.67 | 43.72 |
Aluminium/ Sharc® sapphire
Tutoprom™ bright | before | 5 | 139.5 | 141 | 1.5 | 30.5 | 29.5 | 113 | 83.5 |
| after | 39.48 | 118.90 | 134.15 | 15.3 | 49.05 | 32.46 | 128.53 | 96.07 |
| Aluminium / Tutoprom™ bright | before | 17 | 126 | 133.5 | 7.5 | 32 | 26 | 113.5 | 87.5 |
| after | 39.58 | 117.36 | 132.92 | 15.6 | 36.71 | 34.23 | 104.87 | 70.64 |
| Aluminium /amorphous Si:Nd:Zr | before | 79.57 | 59.67 | 87.08 | 27.41 | 12.11 | 41.08 | 76.39 | 35.31 |
| after | 80 | 65.33 | 90.32 | 25 | 37.83 | 46.7 | 89.95 | 43.25 |
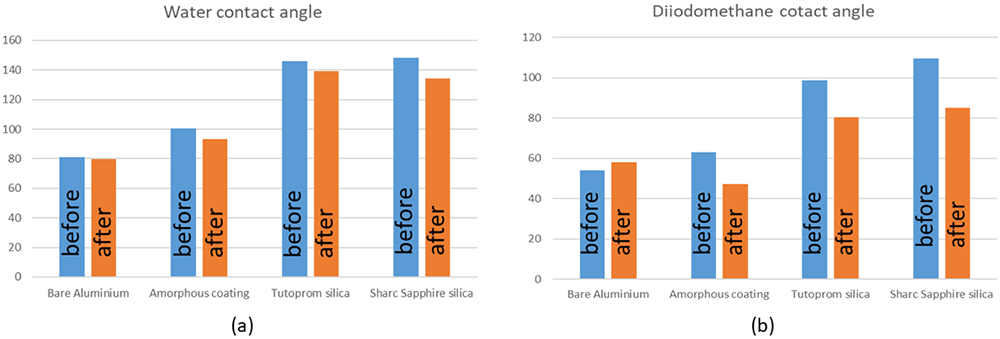
Figure 11.
Static contact angles before and after testing (in ORC fluid condensation tests) in (a) water and (b) Diiodomethane.
From the measurements obtained from the dynamic contact angle tests Table 4, in the samples coated with the silica-based coatings (tutoprom bright™ silica and sharc ® sapphire silica), a considerable increase was seen in the roll-off tilt angle in water after exposure to the ORC fluid, however, the differences are not so significant when measured in diiodomethane. When the measurements were performed in the amorphous coating, the first observation is that this produced a low roll-off tilt angle before testing diiodomethane, this very low value increase after exposure to the ORC fluid. No degradation in the roll-off tilt angle was seen in this coating after measurements using water as the probe liquid. A peculiar observation is that the roll-off tilt angle reduced in diiodomethane after exposure to the ORC fluid for the bare aluminium plate.
Adhesion strength
For all cases, the tests carried out by ASTM D3359 (tape adhesion), the coatings displayed a good adhesion strength before and after exposure to the ORC fluid, see Table 5.
Table 5. Tape adhesion and pull-off tests of in the coated samples before and after testing according to ASTM D3359 and ASTM D4541.
| Substrate /coating name | | Tape adhesion grade | Dolly pull-off |
|---|
| Strength [MPa] | Failure location |
|---|
| Aluminium/ Sharc® sapphire | before | 4B | 0.22 | Coating-substrate interface adhesion failure |
| after | 4B | 1.84 | |
| Aluminium / Tutoprom™ bright | before | 4B | NA | Glue failure, coating too repellent to be tested |
| after | 4B | 2.33 | |
| Aluminium /amorphous Si:Nd:Zr | before | | | |
| after | 4b | 1.33 | |
Regarding the tests conducted in accordance to ASTM D4541, the strength of the Sharc® Sapphire coating was noticeably low before exposure to the ORC fluid. Given that there is no mechanism to explain an increase in bonding strength of the coating after exposure to R134(a), and given that the strength of the other Sharc® Sapphire formulation used during the coating developing process was between 1.03MPa and 1.26MPa, it is assumed that this could be a measurement error. For the Tutoprom™ bright coating, this was too repellent for measurements to take place before exposure to the ORC fluid, for this reason, the measurements were only taken after. For the Amorphous Si:Nd:Zr coating, no value was acquired before tests. For all these reasons, it was difficult to assess the durability of the adhesion strength of the coatings developed in this program. In addition to this, no compliance value was found for coatings for heat exchanger applications, as a reference, for protective coatings in concrete, a minimum adhesion strength from 1.4 to 1.75 MPa is recommended20, the values of adhesion strength of the coating developed in this project are within this range on aluminium, however, using the same silica based coatings but for stainless steel and copper, the values of adhesion strength was between 7.87MPa and 10.07MPa.
Discussion
The results of this work can be divided into different stages, one that relates to the characterization of the surface i.e., wettability measurements, or adhesion, another relates to the durability of the coatings as a function of the exposure to a refrigerant and finally how improving the mode of condensation in a surface from film-wise condensation to dropwise condensation can assist in the decrease of thermal resistance to improve heat transfer. The objective of the work at this moment is not to explain the gaps between these stages, rather to make observations and highlight them.
In terms of the wettability, based on the literature, for example, the book written by Yee Law and Zhao21, it would seem than even more important for this application than the static contact angle, is the angle of tilting at which the droplet start moving. From these measurements, from the measurements in water, it is observed that the sharc® sapphire coating has the lower roll-off tilt angle, therefore, it would be expected, based on this parameter, that this coating presented the better dropwise condensation2. If the heat transfer was based on the drop mobility on diiodomethane, then the amorphous coating should have the better heat transfer performance indicators. However, when heat transfer condensation tests were conducted, Tutoprom™ bright presented the better behaviour. It should be noted that at this stage, we did not expect a one to one correlation, either between water-phobicity or diiodomethane-phobicity and heat transfer performance indicators, as the wetting properties that can be obtained in a refrigerant, and at a different pressure, can be quite different, for example, the surface tension of water can be between ≈30 and ≈5 greater than the surface tension of a refrigerant22. This is certainly a gap during the stage of developing of the coatings, in agreement with other investigations in the topic23. However, the wetting properties in water seem to be more adequate for the estimation of the properties in the ORC fluids (at least in R-134A).
Regarding the durability of the coating, there are three aspects of consideration: (i) Adhesion strength, (ii) wettability and (iii) and heat transfer performance. The last two will be analysed in conjunction. With respect to the adhesion strength, not much can be said, given the difficulties presented for obtaining those measurements. However, the values measured after testing were no different to the average values obtained during the developing of the coatings (from the different formulations, which ranged from 0.81MPa to 1.49MPa)24, therefore, it can be said that the ORC fluid did not affect the adhesion strength of the coatings. Equally, it would be irresponsible to say that this is good enough, given that is an application where a fluid is travelling at high speed, and adhesion strength is very relevant. Regarding the heat transfer performance over time, Figure 12 shows how this changed. At the beginning of the tests, a sharp drop is seen for all the samples (Coated and uncoated), the reason for this is unknown, however, given that this is not specific to the coating, this part of the curve will not be analysed. Still, in the “steady state region”, a variation over time in the heat transfer performance can be observed, this variation includes the cyclic effects associated to day and night (ambient temperature), as explained before, although these are not the only changes present. For example, the curve of overall heat transfer performance U for the sample coated with Tutoprom™ bright display what appears to be visually a decrease over time, this behaviour is similar for the sample coated with amorphous Si:Nd:Zr coating. In the Tutoprom ™ bright coated specimen, the scatter is larger than in the other cases. For the sharc® Sapphire coating sample, the behaviour in the time observed finished with an upward trend. Despite all these different observations, in any case, for each sample, the variation in the heat transfer indicators in the time observed overlaps with the heat transfers indicators of the other configurations. Now, if we try to link the heat transfer performance to the wetting behaviour, the results indicate that there was a reduction in the fluid-phobicity of all the coatings after exposure to the ORC fluid, which as shown, not necessarily correlate with the performance of the heat transfer performance indicators over time. Given that there could be also other factors affecting the heat transfer performance indicators, i.e., fouling on the side of the sample exposed to water, we consider that there must be a fluid-phobic threshold value at which at increase in the properties can be seen, and that if you do not cross this value, the change in the performance is not going to be significant.
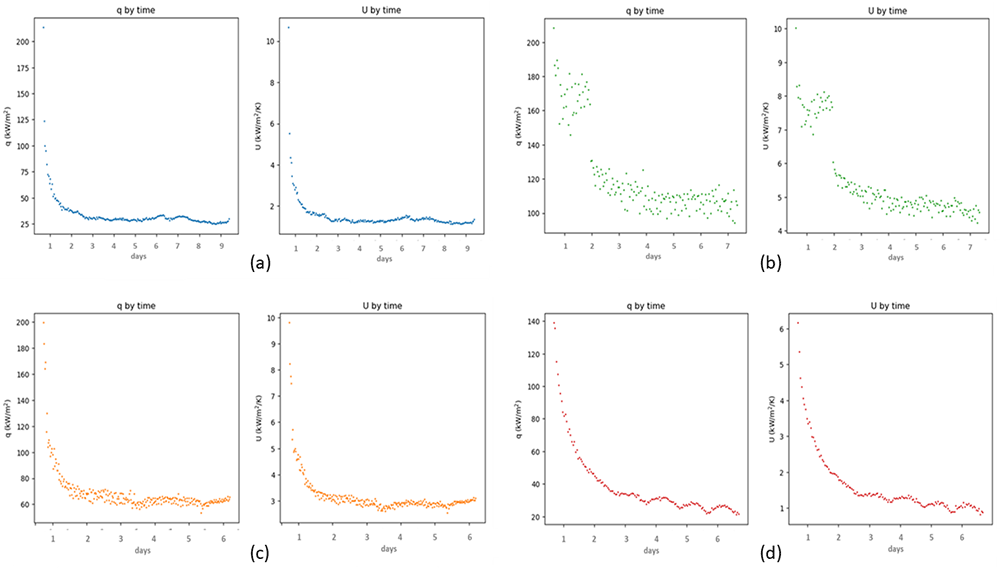
Figure 12.
Heat transfer performance indicators q and U over time duration of the tests for (a) uncoated aluminium, (b) Tutoprom ™ bright, (c) Sharc® sapphire and (d) amorphous Si:Nd:Zr coating.
Another factor that indicates that the coatings are not degrading during the duration of the test is that the visual aspect of this does not change after exposure to the ORC fluid, this is not surprising given that this is a refrigerant with no other contaminant. Given that water is other working fluid for thermal applications, we exposed coated samples (with the same formerly mentioned coatings) to condensation conditions in water at 60°C for ≈200 hours, the images of before and after exposure are shown in Figure 13. Again, the coatings displayed no visual affection by the working fluid.
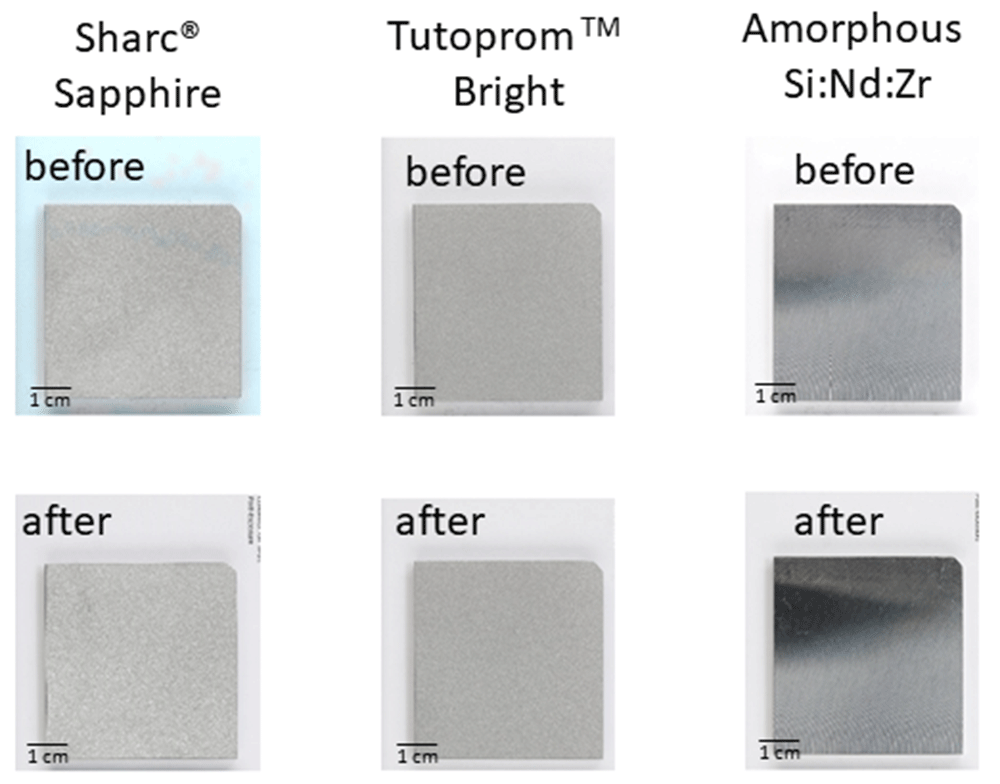
Figure 13. Images of the coatings before and after being exposed to condensation in water at 60oC.
These conditions were chosen because they were considered more aggressive than exposure to the ORC fluid at 35oC.
Finally, regarding the improvement in the heat transfer condensation, two levels of coating were developed, one with microscale roughness and low surface energy materials to achieve very high levels of hydrophobicity and the other hydrophobic, with the same surface finish as the as received bare aluminium. Based on the observations of the heat transfer performance, we attribute, as based in the current knowledge, the increase in performance to the change in the transfer mode, when high levels of fluid-phobicity are reached. This is also because sharc® sapphire silica and tutoprom ™ bright silica are polymeric coatings, therefore, they are actually thermal barriers and the thermal performance should be less if no other change in the system is provided. However, as mentioned in the introduction, there are also other aspects of the dropwise condensation mode that also affect the heat transfer i.e., mobility of the droplets, size of these, sub-cooling, among others. To explore one of these variables, a test was conducted with the system in horizontal position, see results in Table 6. Mukherjee et al. explain in detail the mechanism by which the surface orientation plays a role in heat transfer experiments11. In brief, orientation will have an enhanced effect due to two interlinked factors; in hydrophobic surfaces, (i) the condensation droplets will jump out of the solid/condensation plate, the distance of the jump will depend on the level of hydrophobicity of the surface (size of the departure droplet), and in the presence of vertical surfaces, (ii) the gravitational shedding will cause a larger jump of the droplet or its complete removal from the surface. Vice versa, in horizontal surfaces, a jumping droplet could fall into the same plate until eventually get stuck, due to coalescence with other droplets. From the very small changes in the heat transfer performance indicators shown in Table 6, it can be concluded that mobility of the droplets/orientation is not very important but if couples with dropwise condensation, this can have a major impact.
Table 6. Heat flux (q) and overall heat transfer coefficient ( U) for the uncoated aluminium plate in vertical and horizontal position.
| Sample | position | q [kWm-2] | U [kWm-2K-1] |
|---|
| Uncoated aluminium | Vertical | 30.3 | 1.34 |
| Uncoated aluminium | Horizontal | 23.2 | 1.02 |
The reason why this study is not intended to understand all the gaps between the relationship between wetting and heat transfer mode is that there are many variables that play a role. And it is not very easy to assess all of these in laboratory tests, just to give an example, in a geothermal power plant, condensation will take place after the working fluid is coming from the turbine at very high speed, this is difficult to implement in a laboratory study. Investigating all these parameters could be time consuming and with no guarantee that will lead to heat exchangers with improved efficiency. However, in this project, we will actually use commercial heat exchanger to tests the coatings developed in the program; this new information will be used to feedback our coating development process in a more pragmatic way and with more certainties.
Conclusions
In this study, the surface of aluminium plates was modified to increase the heat transfer performance. In the medium level of hydrophobicity samples (coated with Amorphous Si:Nd:Zr), no increase in the heat transfer performance indicators was achieved with small reduction in the q and U parameters. In the very high hy-drophobicity level samples (silica coated samples with high roughness), an increase in the thermal performance indicators was observed. All the materials displayed excel-lent durability in the mild environment that presented. Given the results of this study, a logical future line of investigation would be if a metallic coating (good thermal conductivity) is added to a nano-hierarchical surface (this can lead to enhanced hydrophicity), is a candidate coating material for an application that require high heat transfer for condensation heat exchanger.
Ethics and consent statement
No ethical approval or consent were required.