Introduction
The Arctic, a region undergoing alarming and irreversible ice melting due to climate change, is becoming increasingly accessible. This presents both challenges and opportunities for human activities, particularly in the realm of Arctic navigation. With fewer ice sheets in the Arctic, there are now navigable waters providing the ability to extract natural resources, support commerce, and encourage tourism. However, the presence of floating ice blocks can pose significant risks to vessels navigating these waters. Therefore, the development of technology for the automatic accurate detection of ice blocks in near-real time in the Arctic Ocean is not only a response to the challenges posed by climate change but also a proactive measure to ensure the safety and efficiency of Arctic navigation in the face of these rapidly changing conditions.
In this letter, we are excited to introduce a groundbreaking method for detecting ice blocks in radar satellite images, powered by Artificial Intelligence (AI). Our method is rooted in the application of a combination of state-of-the-art image segmentation and deep learning techniques. These techniques are employed to accurately locate ice blocks within the images and then retrieve their precise geographic coordinates. The strength of our method lies in its performance. The models we have developed have shown promising results in accurately identifying and locating ice blocks. This has significant implications for improving the safety and efficiency of Arctic navigation, particularly in the context of the rapidly changing conditions in the region. Our work was presented as part of the AI-ARC project’s1 Arctic demo, where it was well-received by different end users, the ones from the project’s consortium and as well as external ones. This validation from the user community underscores the potential of our method to make a meaningful contribution to addressing the challenges posed by climate change in the Arctic.
Data collection and processing
Our primary objective is to build a technology capable of detecting floating ice blocks at sea. To achieve this, we leverage the Copernicus program2, the European Union’s Earth observation program. Copernicus aims at achieving a global, continuous, autonomous, high-quality, wide-range Earth observation capacity. The Copernicus program includes several missions, each with its own unique capabilities:
Sentinel-13 comprises a constellation of satellites performing C-band Synthetic Aperture Radar (SAR) imaging.
Sentinel-24 provides high-resolution optical imagery for land services, including vegetation, soil and water cover, inland waterways, and coastal areas.
Sentinel-35 offers high-accuracy optical, radar, and altimetry data for marine and land services.
Sentinel-46 and Sentinel-57 are dedicated to atmospheric composition monitoring.
Sentinel-5P8 is a precursor mission to Sentinel-5, providing data continuity until the launch of Sentinel-5.
Sentinel-69 provides high accuracy altimetry for measuring global sea-surface height.
Inside Copernicus, we specifically use Sentinel-1, which comprises a constellation of satellites performing C-band Synthetic Aperture Radar (SAR) imaging. SAR satellite sensors can see through clouds and in the dark, providing 24/7 unobscured views of Earth10. This makes SAR ideal for our purpose as it can penetrate cloud cover and “see through” darkness and weather, allowing a unique view of ice block distribution. This is particularly useful in the Arctic region where weather conditions can be extreme and unpredictable.
We download Sentinel products from the publicly available Copernicus API11. The Copernicus Data Space Ecosystem offers multiple Application Programming Interfaces (APIs) that provide a range of services including access to the catalogue, product download, visualization, and processing web services. After downloading the products, we perform sigma-0 calibration on them12, and convert them to decibels, using geospatial libraries, obtaining as a result an image like the one shown in Figure 1. We use these calibrated products to build a dataset that is subsequently used to validate the technology we develop. In addition to this, we also have access to a labelled dataset of small, 75×75 pixel patches of sea from Sentinel-1 images. These patches contain either a vessel, an ice block (Figure 2), or neither of them, providing a diverse range of data for our model to learn from.
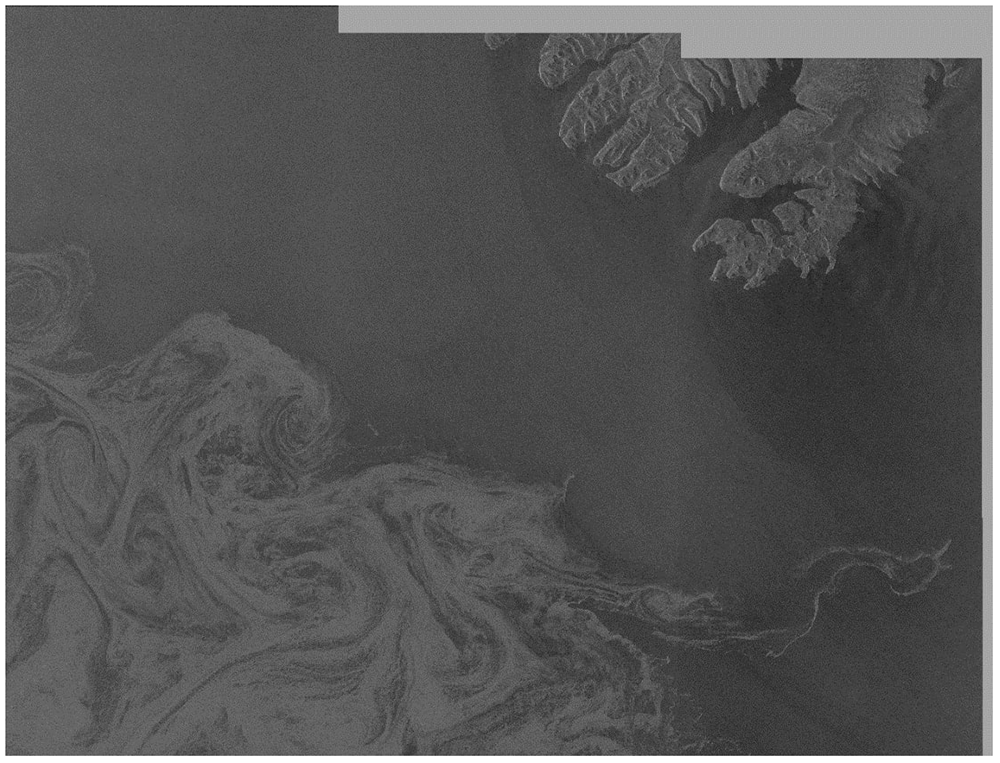
Figure 1. Example Sentinel-1 product after calibration and conversion to decibels.
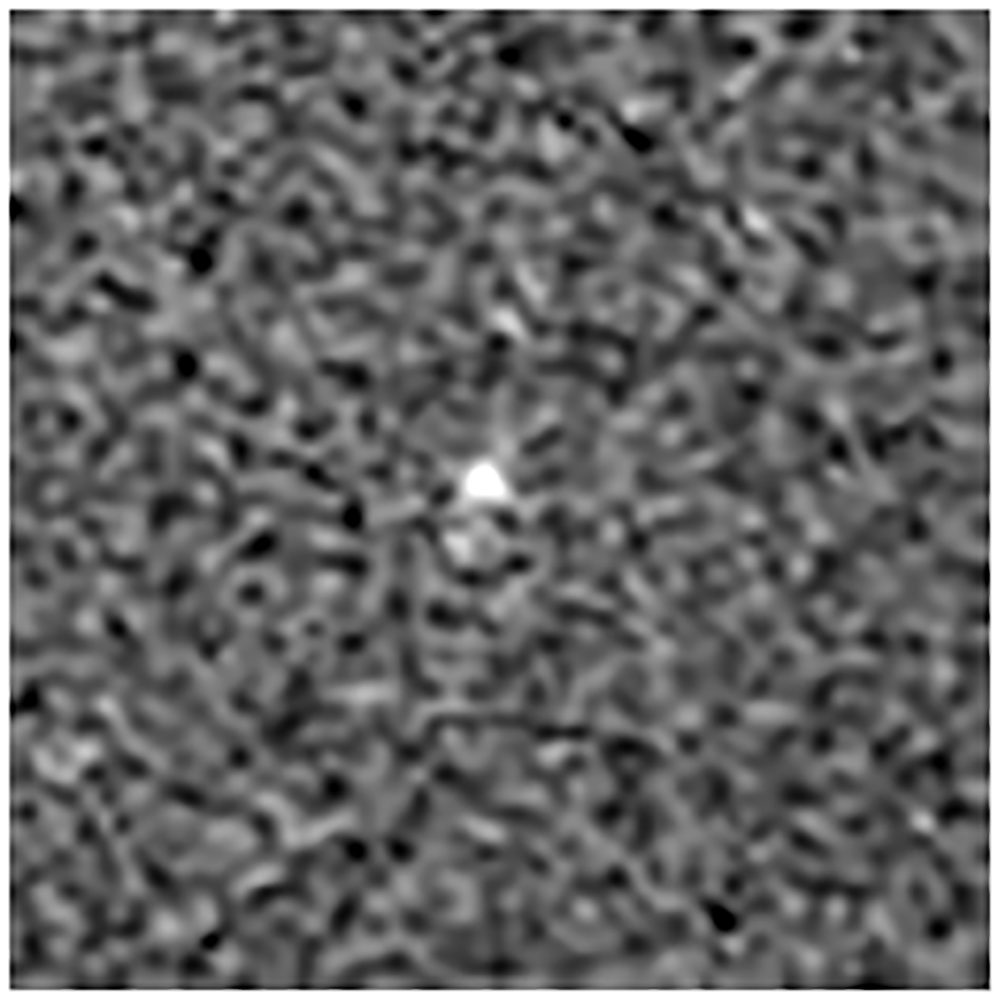
Figure 2. Example 75×75 pixel patch containing an ice block.
Methods
Our methodology begins with the receipt of a calibrated Sentinel-1 product. This product is then processed using a state-of-the-art image segmentation model, SAM13. The SAM model is specifically designed to distinguish between different elements in the image, such as the sea, land, and sea-ice sheets. An example of a segmented image can be seen in Figure 3.
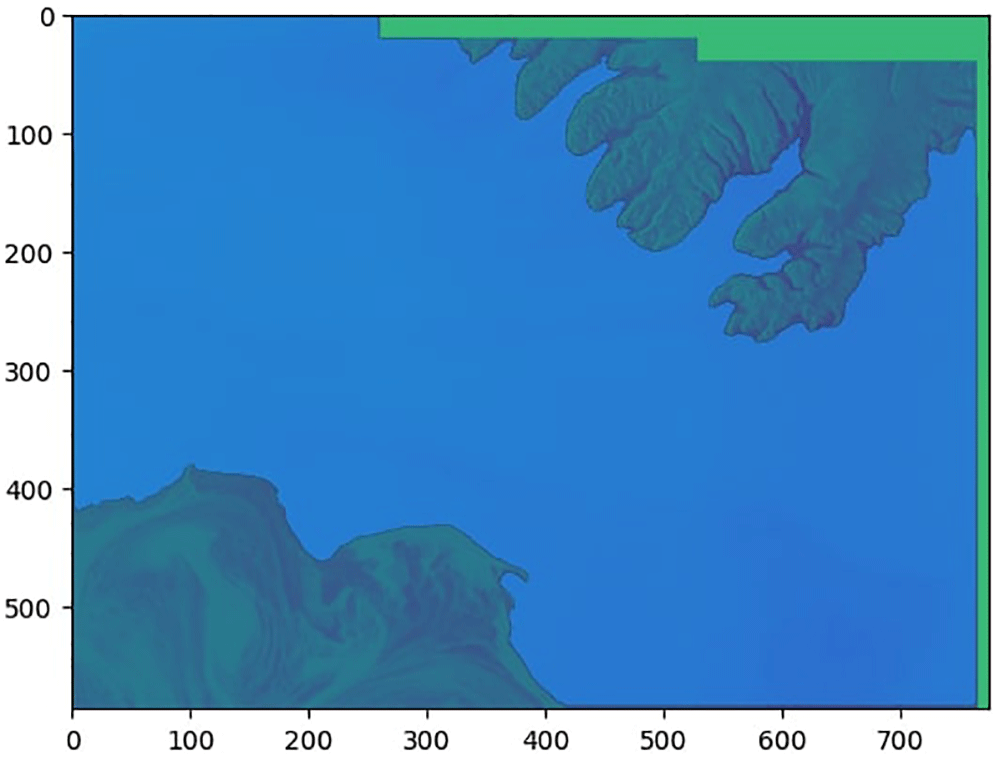
Figure 3. Example Sentinel-1 product after segmentation.
The separation between land and sea is clearly seen, with the coastline accurately delimited.
Once the image is segmented, the sea area is scanned using a moving window approach. This process involves extracting patches of 75×75 pixels that cover the entire sea area. These patches are then processed using a Convolutional Neural Network (CNN)14 multilabel classifier. The CNN is trained using the labelled dataset of patches, presented in the former section, which match the size of the extracted patches. This allows the CNN to detect the presence of a boat or an ice block within each patch. The performance of the CNN model is validated using standard metrics such as precision, recall, and F1-score.
Patches where ice blocks are detected are marked on the image, as can be seen in Figure 4. Following the detection process, the geographic coordinates of the patches containing ice blocks are retrieved. This is achieved by correlating the image coordinates of these patches with the geolocation information contained in the full Sentinel-1 product. This allows us to geographically locate the detected ice blocks and issue alerts accordingly.
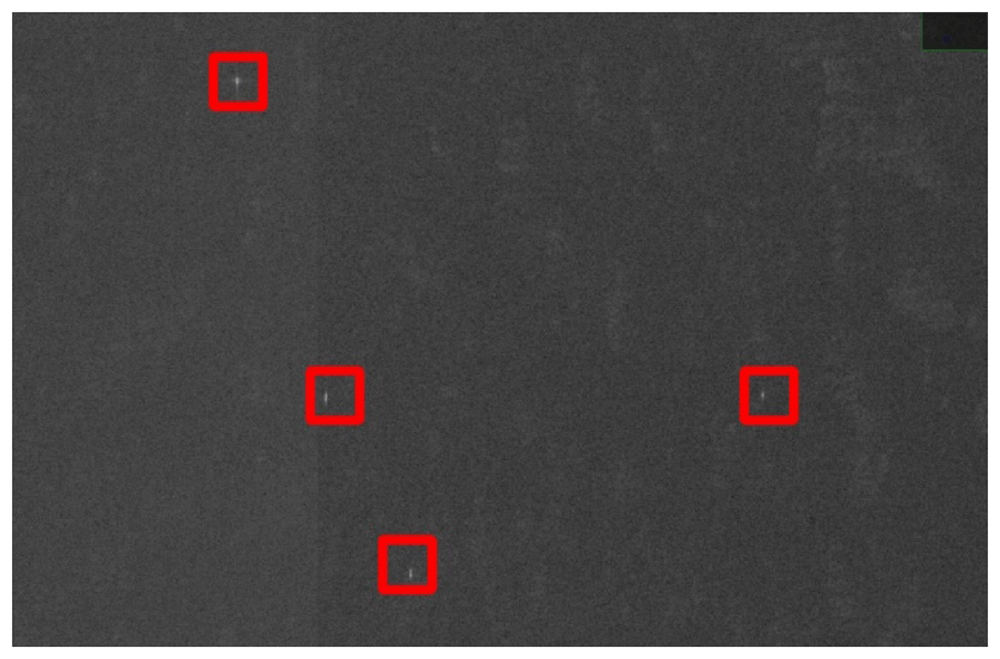
Figure 4. Detail of ice blocks detected on sea in a Sentinel-1 product.
There is an ice block inside every red square.
The results of this process, including the geographic coordinates of detected ice blocks, are sent via Kafka15, an open-source distributed event streaming platform, to a geospatial visualization and analysis software. In the demos of the project, we use the DigLT16, developed by another project partner. This software displays the detected ice blocks on a map for users and provides the image of the 75×75 pixel patch containing the ice block, along with its metadata. Our system is also equipped to receive Sentinel-1 products in streaming. This feature enables it to alert about near-real time detections, providing timely and critical information for maritime navigation and safety. Free alternatives that perform equivalent functions to the DigLT include QGIS17, OpenLayers18, CelsiumJS19, and Leaflet20.
Results and demonstration
Our multilabel CNN classifier, which is designed to detect ice blocks and vessels in 75×75 pixel patches of sea, has been thoroughly evaluated using precision, recall, and F1-score metrics. The results of this evaluation are presented in Table 1, demonstrating the robust performance of our model. The unsupervised detections of ice blocks, as visualized in Figure 4, further substantiate the accuracy of our model.
Table 1. Results of the CNN detecting ice blocks and vessels in 75×75 pixel patches.
| precision | recall | f1-score | support |
|---|
iceberg
vessel | 0,92
0,88 | 0,82
0,91 | 0,86
0,89 | 66
86 |
micro avg
macro avg
weighted avg
samples avg | 0,89
0,9
0,89
0,54 | 0,87
0,86
0,87
0,55 | 0,88
0,88
0,88
0,54 | 152
152
152
152 |
To showcase the practical application of our technology, we conducted a demonstration in Reykjavik as part of the AI-ARC project’s Arctic demo. This event provided an excellent platform to exhibit the capabilities of our system in a real-world setting. For this demonstration, we curated a set of Sentinel-1 products located in the vicinity of Iceland. These products were specifically chosen for their proximity to the demo location and the presence of ice blocks within them.
During the demonstration, the detected ice blocks were displayed on the geospatial visualization and analysis software. We also conducted an alert simulacrum to illustrate how our system can provide timely alerts about detected ice blocks. This demonstration was conducted in front of an audience of end users, primarily consisting of coast guards from various European countries. The audience expressed satisfaction with the results of the exercise, validating the effectiveness of our system.
Conclusions
Our system significantly contributes to Arctic navigation safety by detecting ice blocks and providing near-real-time alerts to vessels. This allows for timely route adjustments, reducing the risk of collisions. This work represents a substantial advancement in the use of AI for environmental monitoring.
We anticipate further refining our method based on user feedback and advancements in AI technology. This underscores the transformative potential of AI in environmental monitoring and maritime safety. We are optimistic about the future of our system and its role in promoting safe navigation in the Arctic or other regions that may have ice blocks.
Ethics and consent
Ethical approval and consent were not required.
Software availability
The software developed by us to detect ice blocks in satellite images is archived and available from: https://zenodo.org/doi/10.5281/zenodo.12684755.
License: Creative Commons Attribution 4.0 International.
Additionally, for geospatial visualization and analysis, our project utilizes the DigLT17, developed by another project partner. However, there are several open-source alternatives available that can perform equivalent functions, including QGIS18, OpenLayers19, CesiumJS20, and Leaflet21.
Faculty Opinions recommendedReferences
- 1.
AI-ARC project. Reference Source
- 2.
Copernicus Programme. Reference Source
- 3.
Sentinel-1. Reference Source
- 4.
Sentinel-2. Reference Source
- 5.
Sentinel-3. Reference Source
- 6.
Sentinel-4. Reference Source
- 7.
Sentinel-5. Reference Source
- 8.
Sentinel-5P. Reference Source
- 9.
Sentinel-6. Reference Source
- 10.
Zhao Q, Yu L, Du Z, et al.:
An overview of the applications of earth observation satellite data: impacts and future trends.
Remote Sens-Basel.
2022; 14(8): 1863. Publisher Full Text
- 11.
https://dataspace.copernicus.eu/analyse/apis/sentinel-hub
- 12.
Laur H, Bally P, Meadows P, et al.:
Derivation of the backscattering coefficient σ0 in ESA ERS SAR PRI products.
Proc of the Second International Workshop on ERS Applications.
2002; 139.
- 13.
Kirillov A, Mintun E, Ravi N, et al.:
Segment Anything.
Proceedings of the IEEE/CVF International Conference on Computer Vision.
2023; 4015–4026. Publisher Full Text
- 14.
Schmidhuber J:
Deep learning in neural networks: an overview.
Neural Netw.
2015; 61: 85–117. PubMed Abstract
| Publisher Full Text
- 15.
Sax MJ:
Apache kafka. In: Sakr, S., Zomaya, A. (eds) Encyclopedia of Big Data Technologies. Springer, Cham, 2018. Publisher Full Text
- 16.
Alonso J:
Set of Copernicus Sentinel-1 images around Iceland. [Data set].
Zenodo.
2024. http://www.doi.org/10.5281/zenodo.12653878
- 17.
The digital map table. Reference Source
- 18.
QGIS:
A free and open source geographic information system. Reference Source
- 19.
OpenLayers:
A high-performance, feature-packed library for all your mapping needs. Reference Source
- 20.
CesiumJS:
3D geospatial visualization for the web. Reference Source
- 21.
Leaflet:
A JavaScript library for interactive maps. Reference Source