Introduction
Safety assurance for Assisted and Automated Driving (AAD) systems is an extremely challenging process. Such systems rely on environment perception as well as tactical and operational decision-making systems. The challenge is in large part due to the state-explosion resulting from all possible real-world scenarios and operational conditions, and due to the huge amount of on-road data needed to comprehensively demonstrate the behaviour of different perception and driving tasks1,2. In this context, the ROADVIEW project aims to improve the state-of-the-art for perception, decision-making, and testing capabilities for road vehicle AAD features3 in harsh weather conditions. To ensure that the investigated improvements are effective for real-world applications, it is necessary to apply a relevant and feasible methodology for the system testing and evaluation. Given the focus on harsh weather conditions, the initial aim of the project has been to find a set of test cases that can enable the end-to-end testing of the identified driving functions for the specific use cases, including all weather conditions. The testing strategy can then be mapped to appropriate testing environments, such as open-road testing, X-in-the-Loop (XiL) rigs, virtual simulations, and test facilities.
The methodology we propose here has been pioneered by a team with diverse expertise and aims to bridge the gap between abstract “operational design domains” and concrete “test cases” by (i) analysing different driving contexts (e.g. highway, urban, and rural road driving) and eliciting a limited set of relevant basic use cases for a specific AAD feature, (ii) analysing weather and traffic conditions and their potential system impact, (iii) determining which attributes, metrics, and ranges are most relevant for performance evaluation (e.g. for rain, what are the typical rainfall rates and the relevant metrics, such as rain rate and droplet size), (iv) exploring the scenarios and specific variable values needed to achieve the required coverage in testing, (v) mapping the conditions to different test environments, and (vi) generalising the process to make it available to the wider automotive community.
There are several standards currently in progress to support common terminology and the safe development and validation of AAD features. For example, the international standard ISO 34503, ‘Road Vehicles—Test scenarios for automated driving systems, Specification for operational design domain (ODD)’, defines the terminology and elements for ODD4. Based on the terminology in 4, we go one step further and show how the basic use cases can be parameterised so that they can be subjected to variation and combined with ODD attributes to form a large set of relevant test scenarios and test cases, including severe weather. It is worth noting that given the significant variability that can be encountered during driving, the test cases need to be designed with specific fail/pass or evaluation criteria to verify the identified system requirements. For instance, the subsystem most affected by harsh weather is the sensor suite, as sensors can return noisy readings and attenuated signals. This data degradation can have a significant impact on the detection of real targets, such as Vulnerable Road Users (VRUs)5. In this regard, our methodology paves the way to systematically measure the impact of sensor noise in each test case.
The contributions of this paper are manifold: (i) In the context of AAD features, a generic definition of harsh weather is introduced with a link to the sensing-perceiving pipeline. (ii) The existing terminology is unified to have a consistent taxonomy and definition of ODDs, use cases, scenarios, and test cases, covering various adverse weather conditions. (iii) Based on the provided definitions, a methodology is proposed to demonstrate how to use the ODD taxonomy to define a weather-aware testing strategy, including where and what to test at each stage. The application of the methodology is also demonstrated by a concrete case study.
Background and related work
ISO/SAE PAS 22736:20213 defines a taxonomy related to driving automation, where a driving automation feature can perform a part or all of the dynamic driving task (DDT), which includes the real-time operational and tactical functions needed to operate a vehicle in traffic on a sustained basis. This includes some advanced driver assistance systems, e.g., adaptive cruise control, as well as higher levels of automation where a driver is not constantly involved in the driving task, e.g., a robotaxi. The driving automation system is the system implementing a driving automation feature; for the higher levels of automation, this is also called an automated driving system (ADS)3. For simplicity, we use the terms AAD feature and AAD system in this paper to collectively refer to such assistance and automation functions.
AAD features are designed to work within a specified ODD, defined by the manufacturer. Therefore, it is important to ensure that it is fully tested according to its ODD. ISO/SAE define an ODD as “Operating conditions under which a given driving automation system or feature thereof is specifically designed to function, including, but not limited to, environmental, geographical, and time-of-day restrictions, and/or the requisite presence or absence of certain traffic or roadway characteristics“3, while ISO 34503 provides a taxonomy for ODD attributes4. Figure 1 shows a part of this taxonomy. ROADVIEW mainly focuses on incorporating harsh weather conditions, as they can strongly impact perception systems, e.g. 6,7, and other related aspects highlighted in the figure. ASAM OpenODD focuses on creating a machine-readable format8 for ODDs, with the main motivation to ease/automate the use of ODD within the simulation domain.
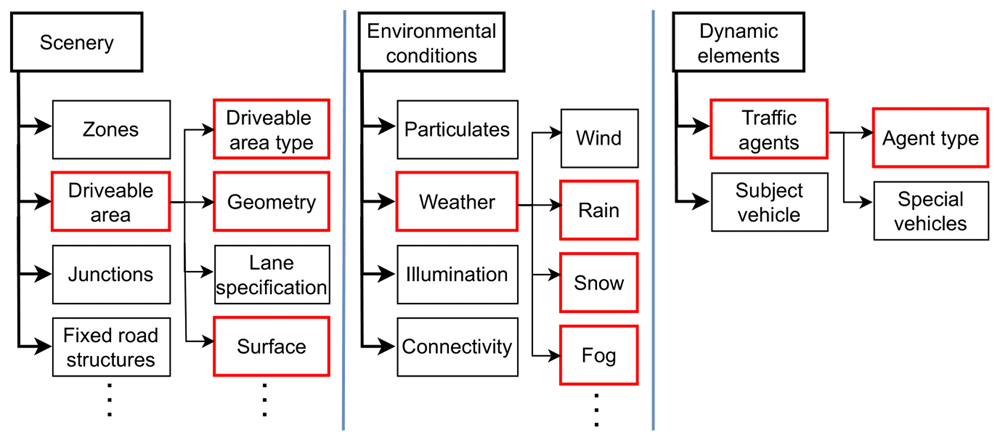
Figure 1. Different elements to describe the ODD of an AAD function; red contours to indicate the focus of this paper and the ROADVIEW project.
Scenario-based test methods for AAD systems focus on evaluating the system using a set of test scenarios, typically evaluated in a mix of test environments. Crucial aspects are the integrity and representativeness of scenarios9. According to ISO 345034, “The ODD definitions shall be used as one of the inputs for scenario-based safety evaluation framework.” Another major part of scenario-based testing is to define the desired behaviour of the AAD system. In the scope of this paper and ROADVIEW, the desired behaviour is specified by use cases. The same standard defines a scenario as a “sequence of scenes usually including the automated driving system(s) (ADS)/subject vehicle(s), and its/their interactions in the process of performing the dynamic driving task (DDT)”9. ASAM defines a scenario as a “description of how the view of the world changes with time, usually from a specific perspective”10. ASAM OpenScenario is a framework that allows road network, entities and storyboard—which also contains events and triggers—to be defined within the scenarios for use in simulation tools10. The PEGASUS project has split the definition of a scenario by level of abstraction: (i) an initial functional scenario describes a high-level overview of the ‘sequence’ of events; (ii) logical scenarios add a range of values that each parameter can take; (iii) finally, concrete scenarios provide specific values for each parameter11. In ROADVIEW, OpenScenario has heavily influenced the definition used for the scenario, since the project outputs aim to conform to the ASAM OpenX standards. Note that as ROADVIEW mainly focuses on incorporating weather conditions, the methodology proposed in this paper does not aim to create a complete test scenario library as presented in 12.
Harsh Weather parameters related to AAD
There is no common definition of conditions to be considered as harsh, however, some environmental factors known to adversely affect the sensing performance of AAD systems are rain, fog, snow, strong winds, and illumination13–15. The effect of these factors depends on multiple aspects, e.g. intensity, the vehicle sensor suite configuration, and interdependencies between phenomena (e.g., rain and darkness). There are also secondary effects, e.g. heavy rain causes wet road surfaces and hence reflections and spray. Within the ROADVIEW project, there is a particular focus on the effects of rain, fog, and snow; hence, their impact on automotive perception sensors is presented in Table 1. The following sections discuss parameters and testing methods for these phenomena.
Table 1. The impact that adverse weather can have on perception sensors.
| Sensor | Weather |
|---|
| Rain | Fog | Snow |
|---|
| Camera | - Captured raindrops causes streaks23.
- In the far field, visibility range and contrast are reduced.
- Raindrops on the lens cause artefacts.
- Overcast of clouds lower luminosity, surface wetness affects reflectance. | – Fog scatters visible light, thus reducing the visibility range.
– Reduction of contrast for objects against the background environment24.
– The suspended water droplets will settle, creating wet surfaces affecting reflectance. | – In the near field, falling snow will obstruct the camera view.
– In the far field, snow will cause a decrease in contrast.
– Settled snow on surfaces result in areas with high reflectance. |
| LiDAR | – Reflection from raindrops can cause false positives.
– Attenuation may cause false negatives due to reduced reflected intensity25,26.
– Wet surfaces affect reflectivity by causing false points below the ground surface. | – The small size of water particles and density of droplets in fog will result in diffused scattering, reducing maximum range and creating false positives. | – Maximum range is reduced.
– Snow may cause false positives and obstructions27.
– Further effects observed are blooming, objects appearing bigger; and ghosting, objects appear multiple times. |
| RADAR | – The EM wave is less attenuated by rain, however, 4D RADAR data points become more variable as rain rates increase.
– Build-up of water film in front of the radome can cause attenuation, degrading performance28. | – RADAR is less susceptible to foggy conditions. 77 GHz frequency has been found to have minor attenuation, even at 50 m visibility28.
– Fog may form a minor water film over the radome cover. | – Snowfall can play a role in attenuating the power of the EM wave, hence reducing maximum range28.
– Whilst ice in front of the radome has minor attenuation, it can melt into water which has a drastically higher attenuation. |
Parameters for Rain, Fog, and Snow
Rain. Rain consists of water droplets falling from the atmosphere16,17. Direct and indirect phenomena, e.g. falling water and wet road surface or road spray respectively, are equally relevant. The macroscopic parameter rainfall rate measures the quantity of rain in millimetres per hour (mm/h) and is a key metric representing the volume of water falling on a surface per time unit. Another parameter relevant to the sensor performance is the droplet size distribution (DSD) of raindrops. Raindrops generally have diameters (Ø) in the range of 0.5 to 5 mm, 100–1000 times the size of fog particles. Rain with Ø < 0.5 mm is called drizzle and is typically not measurable with rain gauges; droplets with Ø > 4 mm can be found mostly in torrential downpours in tropical regions. ISO 34503 mentions additional potential parameters for rain, including type (dynamic/frontal, convective, orographic/relief), rate of onset, interval, and spatial scale4. For example, the onset rate can be a vital parameter for an ADS to determine the time interval available to achieve a minimal risk condition (safe state) in near ODD exit conditions.
A comparison of rain classification in ISO 345034 and in two documents by national meteorological offices18,19 is shown in Figure 2, combined with the range of rain generation at ROADVIEW facilities20.
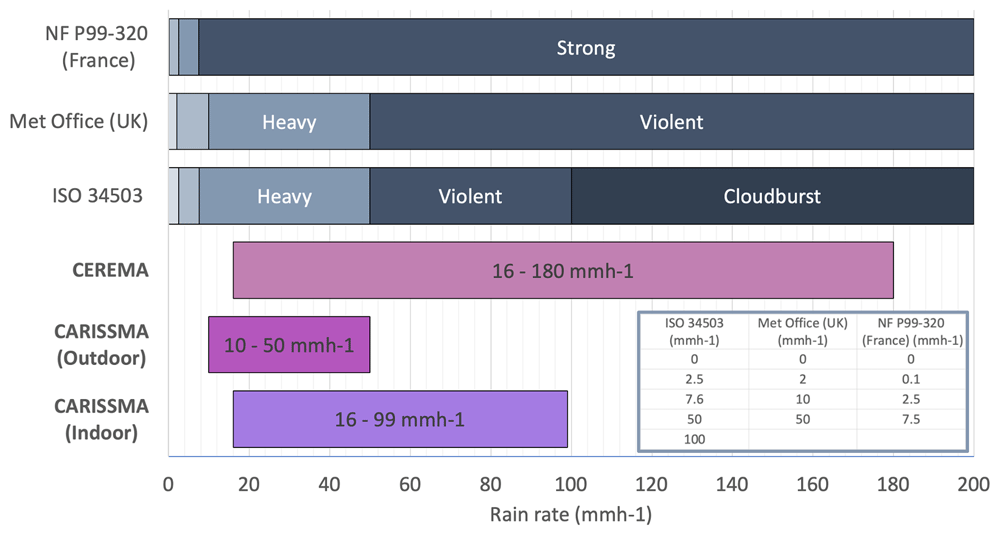
Figure 2. Rain classifications by standard bodies/national meteorological offices.
Each colour represents a different range in the classification. The rows with bold font highlight rain rates achievable at ROADVIEW indoor and outdoor facilities CEREMA and CARISSMA. The inserted table defines the rain rate value at the classification boundary.
Fog. The World Meteorological Organization defines fog as the “suspension of very small, usually microscopic water droplets in the air, generally reducing the horizontal visibility at the Earth’s surface to less than 1 km”17. To cover the large majority of driving cases, it is possible to focus only on radiation and advection fog types, which are also the most well-researched, e.g. 21,22. Radiation fog originates from radiative cooling of the surface under a clear sky, which is frequently occurring in continental climates and is composed mostly of small droplets (few μm), while advection fog consists of moist, warm air flowing over water with different temperatures, typical in coastal regions and usually composed of bigger droplets (> 5–10 μm). Important parameters for fog are visibility and DSD. The visibility, often represented by the Meteorological Optical Range (MOR), correspond to the human capacity to see objects at distance and can be measured with a transmissiometer or a diffusiometer17.
In a road context, fog is typically considered to have an effect when visibility is less than 200 meters. ISO 34503 does not define fog ranges; in ROADVIEW we use the terms dense fog for MOR<30 m, medium for 30<MOR<60 m and light for MOR>60 m, both for radiation and advection fog.
Snow. Atmospheric water vapour, like rain, but due to low temperature frozen into icy crystals. Snow falls in flakes and might stay on the ground. The characteristics are highly dependent on the combination of temperature and humidity. In near-zero conditions, rain and snow could be mixed, and at near zero or even plus degrees, snowflakes can be big and stick to surfaces. In severe frost, even small amounts of precipitation can affect visibility, with blowing snow caused by wind and traffic. The size of the snowflakes and intensity are good basic metrics. Meteorologically, intensity is typically measured converted to water, i.e. in mm/h, but can also be measured as visibility using the same metrics as fog. Moreover, snow can be characterised by the snowflake size distribution or the snowflake mass distribution. However, they are less practical to measure.
ROADVIEW uses the ISO 34503 ranges for snow4, though with the addition of the category very heavy snow with visibility of <100 m, as the top range of ISO 34503, heavy snow with visibility <500 m, may be too coarse, e.g. to characterise Nordic weather conditions.
Testing for harsh weather
Key to improving and evaluating AAD performance in harsh weather conditions is the ability to thoroughly test the systems. The proposed test cases can be performed in real, controlled, or virtual environments and with different combinations of hardware/software, i.e. X-i-L (X-in-the-loop, where X denotes anything, such as vehicles, hardware, software, among others)25. All test environments have their advantages and challenges, e.g. for open roads or test tracks the weather cannot be controlled, and whenever including simulation as part of the testing, the difference that exists between a real world and its fully or partially simulated counterpart is known as simulation-to-reality gap29. For the simulated results to be transferable to the real world, it is important that the simulation-to-reality gap is small enough.
Virtual testing. Virtual testing provides a cheaper and faster way to test multiple iterations of the same algorithm in an accelerated fashion. In automotive, virtual testing also allows for the testing of dangerous and safety-critical scenarios, or edge cases and environmental conditions that are difficult to reproduce in the real world. For a virtual test to be performed, all real assets need to be virtualised. The virtualisation outcome of a specific real scenario/asset into a digital one is known as a Digital Twinning30. A digital twin with a small simulation-to-reality gap could potentially help increase the ODD, given the flexibility of the simulated environment. If a Digital Twin of sufficient fidelity can be created, i.e. with validated assets, sensor models and noise models, weather conditions, etc., the test track is only needed as a validation of the virtual world.
Testing facilities. Test facilities are a vital part of harsh weather testing, providing physical tests where weather parameters can be controlled. Several such facilities exist7. In the ROADVIEW project, the use of two complementary facilities enables a wide range of measurements in rain and fog conditions. See Figure 2 for a comparison of rain capabilities. The CARISSMA Outdoor Test Facility is a test track mainly focused on longer distance dynamic tests. This test track also has rain capabilities, with 3 achievable rain rates, i.e. 10, 25, and 50 mm/h31. The Cerema PAVIN fog & rain platform is designed as a 30 m long enclosed track that is equipped with tools such as a rain and fog generator, advanced weather sensors, and reference vision sensors. The track is divided into two sections: a solid tunnel and a greenhouse area with a removable opaque cover, which enables testing in different lighting conditions and allows for a wide range of scenarios to be simulated. It is also possible to saturate the PAVIN platform completely with fog and allow it to dissipate naturally, with the MOR rising to the desired value. Two different types of fog can be produced, corresponding to different natural phenomena (radiative and advection fog) and implying two distinct DSDs. This facility has been used in previous research, e.g. in 27,32.
Proposed methodology
The ODD extension is a vital step toward the adoption of AAD features in harsh weather conditions. Current features are mostly limited to relatively favourable conditions, which limits the operational and safety benefits. However, such ODD extension requires thorough evaluation, and tests can be difficult to reproduce in different weather conditions. The proposed methodology aims to establish a set of test cases with simple vehicle motions reproducible in weather-focused test environments, yet still giving a good coverage of the test space. In this way, full AAD feature validation can subsequently be performed with high confidence in its ability to robustly handle harsh weather conditions.
This section describes the methodology used to derive harsh weather-aware test cases for an AAD system, taking the intended ODD into account. The test case derivation process is illustrated in Figure 3, starting with an AAD feature definition in terms of use cases and ODD, design of tests, and finally test evaluation. Each step is described in detail in the following sections. Since terminology differs slightly between standards and literature, some key definitions used in this paper and in the ROADVIEW project are listed in Table 2.
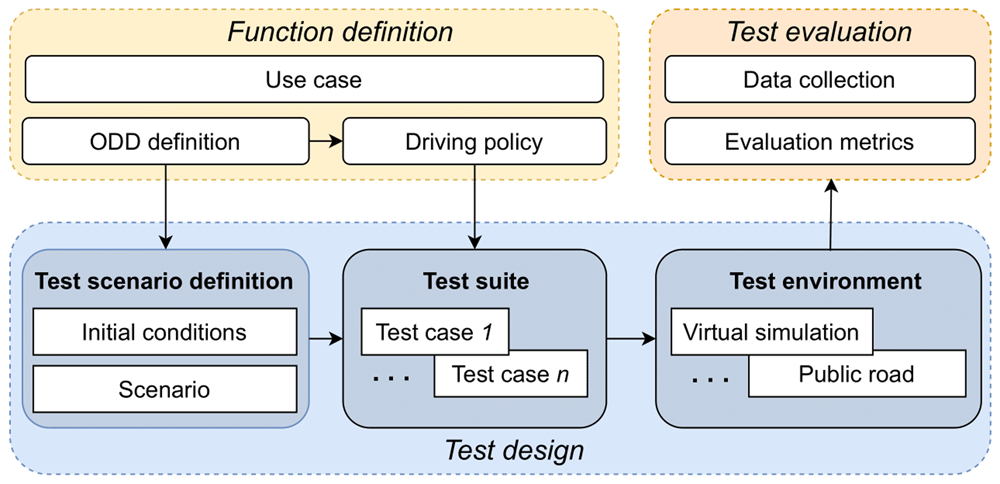
Figure 3. Proposed flow to elicit how a single use case is expanded into multiple scenarios and test cases.
Table 2. Proposed terminology from use case to testing in the AAD context, to unify different standards and literature.
| Term | Definition |
|---|
| Use case | In this context, a description of typical driving tasks expected of an AAD system under test. |
| Test scenario | Scenario intended for testing and assessing an AAD feature including, e.g., road layout, range of weather conditions, and dynamic elements such as vehicles and VRUs (cf. logical scenario in 11). |
| Test case | Specific test with all test scenario parameters fixed, e.g., number of lanes, rain rate, traffic density, VRU behaviour. (cf. concrete scenario in 11). Can be modelled in OpenScenario10. |
| Test environment | Environment able to execute a test case and provide test results, e.g, virtual simulation, XiL rigs, physical test facilities. |
| Test evaluation | Methods and metrics for evaluating the test results. |
Driving feature definition
Use Cases. Use cases can be defined as general driving capabilities that an AAD feature should handle under the defined ODD. In the ROADVIEW scope, three driving environments were considered: highway, rural road, and urban. The approach to create harsh weather tests for AAD features in such use cases is optimised for coverage of the driving tasks and AAD system functionality while keeping the number of tests manageable and as far as possible reproducible in multiple test environments.
The first step to elicit such a practical set of use cases was generating use cases through brainstorming with experts working on products targeting the different environments, starting with obvious capabilities such as driving straight, coming to a full stop, lane change, exiting the road and entering the road, and continuing to more specific situations such as starting movement after a red light.
The second step was use case refinement, where the aim is to refine the large set of generated use cases to create a manageable set covering as much of the needed capabilities as possible. This is done by analysing the uncurated list considering the test objectives, preliminary AAD system architecture, and reducing redundancy. Although some use cases may seem different, they might impose the same challenges to the technology. For example, exiting a road have very similar challenges to lane change to the right with respect to harsh weather testing. Use case refinement is crucial to focus development and testing effort to the critical challenges; assessing use case coverage is a core part of this activity.
For the purposes of the ROADVIEW project, the set of use cases listed in Table 3 and illustrated in Figure 4a–4d was defined as the outcome of the use case generation activity33.
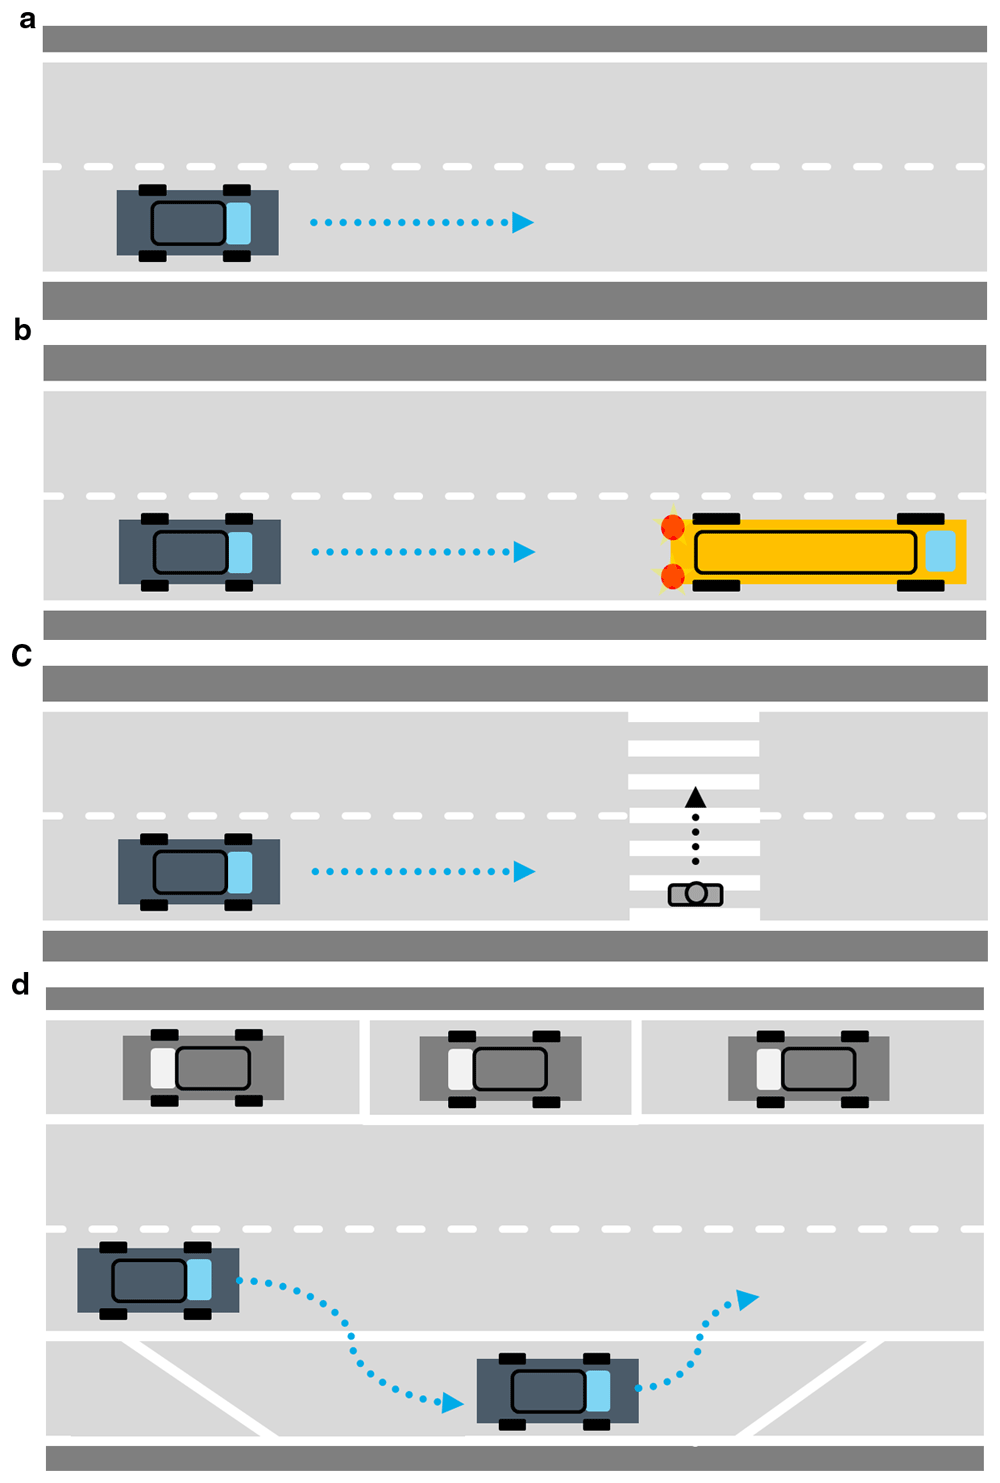
Figure 4.
a. Illustration of use case ‘Driving straight’. b. Illustration of use case ‘Full stop or adjusting speed’. c. Illustration of use case ‘Interacting with VRUs’. d. Illustration of use case ‘Entering a lane/Exiting a lane’.
Table 3. Use cases for the AAD feature ensuring coverage, reducing redundancy, and to evaluate harsh weather performance.
| Use case | Illustration | Description |
|---|
| Driving straight | Figure 4a. | Most AAD systems depend on perception of lanes, and markings can be covered with snow or water in harsh weather conditions. Perception range may be degraded, reducing AAD safe speed and causing issues with faster-moving vehicles on the road.
This use case allows for a function evaluation in adverse weather in low manoeuvring complexity. |
| Full stop or adjusting speed | Figure 4b. | Braking distance is a major harsh weather challenge due to reduced perception range and potentially lower friction. Full stop is a simple action and easy to reproduce in test environments; adjusting speed to a (slower) lead vehicle is also reproducible and requires more accurate motion control.
This use case tests object detection and deceleration manoeuvres to avoid accidents in harsh weather. |
| Interacting with VRUs | Figure 4c. | VRUs, i.e. pedestrians and cyclists, are the road users most vulnerable to harm, but also among the hardest to detect by a perception system due to their smaller size and varying appearance.
This use case evaluates the detection and avoidance of VRUs under harsh weather conditions. |
| Entering a lane / Exiting a lane | Figure 4d. | Lane changes or entering a new road when navigating road networks is necessary for advanced AAD features. Provoking real lane-change conditions is challenging, but the effects can be reproduced by entering a lane from a lay-by or emergency refuge area; the manoeuvre can be even more challenging when performed from stationary or a lane with slower traffic than the AAD vehicle intends to access. Exiting a lane is similar.
This use case evaluates the function during challenging manoeuvres in harsh weather conditions. |
ODD Attributes. The methodology is focused on adverse weather conditions, and therefore the ODD attributes are highlighted in red in Figure 1. ODDs were defined for the driving environments in the scope of ROADVIEW34 and the most relevant weather attributes are summarised in Figure 5, e.g., rain is based on the rain comparison from Figure 2. Compared to ISO 345034, we have added some classes and ranges for fog and induced surface conditions, very heavy snow, and road weather (which alternatively could be expressed as a dependency between water/snow on the road and the presence of traffic or strong winds).
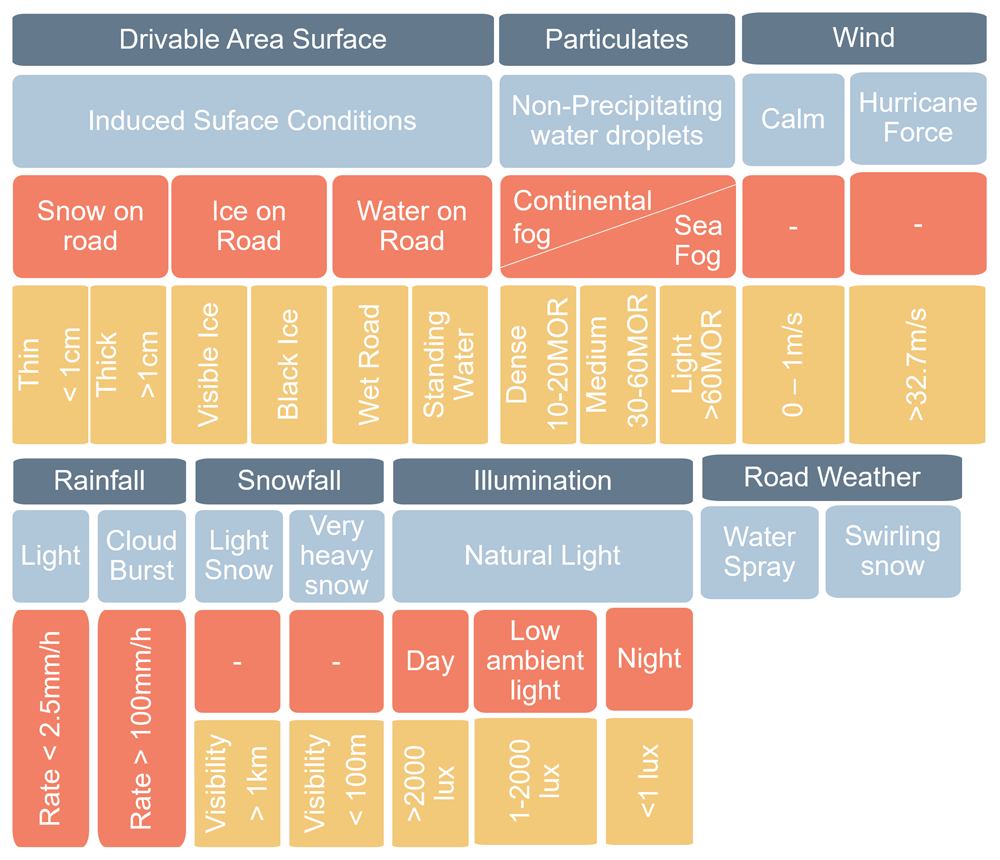
Figure 5. An example on how to expand and define ‘Harsh Weather’-related ODD attributes.
In Dark the attributes, in light blue the sub-attributes, in orange the classification, and in yellow the Range/Type.
Design tests
Use cases, test scenarios, and test cases are interrelated concepts. Test scenarios are specific situations where the use cases can be tested. Generation of test cases includes specifying parameters of the test scenarios.
Test Scenario Creation. Once ODD and use cases are fixed, it is possible to define the test scenarios in which the AAD systems must be tested through. This step is especially important for attributing test cases between the different testing environments. The full determination of the test scenarios is what allows the comparison between the real-world tests and the virtual ones, and the simulation-to-reality gap can be reduced by the usage of XiL rigs and suitably validated digital twins. This specific definition of scenario is composed of multiple items such as lighting, target and ego spatial initial positioning, adverse weather definitions, traffic objects positioning, road layout, street furniture, etc.
Test Case Creation. Evaluating one test scenario, there are multiple ‘variables’ that can be changed, e.g. in the initial velocity of the ego vehicle may be a variable that can be altered from test case to test case, to observe how the system reacts in different specific conditions and to understand which are the variable values that cause the test not to be passed. Note that some of the specific test cases will be implemented only in one testing environment, whereas some of them (e.g. more safety critical) will need to be implemented in multiple testing environments. This setup phase of the scenario variables is known as the creation of the test case suite, the central bottom block of n test cases in Figure 3.
Due to time being a limited important constraint, special care must be taken when defining the number of variables needed and the granularity and boundaries of values to be considered. Moreover, clear evaluation criteria and pass or fail criteria must be defined for each test case suite, thus, the outcomes of the tests are always easy to interpret and compare. As a simple example in our case study in the next section, the inputs ‘Rain Rate’, ‘Ego Vehicle Speed’, ‘Ego Vehicle Following Distance’, ‘Ego Vehicle Following Speed’, and ‘VRU Type’ are configurable. For these variables, a discrete and adequate number of values is chosen to cover the test space. For the sake of time reduction, some variables are fixed with constant ‘average’ values, e.g. clouds and sun position, road layout, etc. Selecting only 4 rain rates, 4 ego vehicle speeds, 2 ego vehicle following distance, 2 following vehicle speeds, and 2 VRU types, there are already a total of 128 test cases to cover a specific aspect of one scenario.
Test evaluation
With the execution of the proposed tests, it is important to establish a suitable methodology for evaluating the outcome of the tests. This evaluation can also be used to compare test cases with identical conditions carried out in different testing environments, where the real-world tests are the benchmark. This comparison must be based on a suitable methodology and on relevant, measurable quantities, hence the introduction of metrics. A metric is a mathematical function which, for a given scenario S and time t, returns a value, metric (S,t) that needs to be maximised or minimised.
Each metric is generally associated with, or at least particularly relevant to, a specific road context and test case. The metric studied should therefore be chosen in direct relation to the scenario in which it will be applied, so does the threshold for the metric associated to the pass or fail criteria of the test. Existing metrics are generally related to either object detection (low-level) or motion planning (high-level)35.
As an example, directly related to the case study in the following section, the VRU has to be accurately detected, identified, and tracked with low uncertainty, and the ego vehicle has to stop in front of the VRU within certain limits of space and time. Focusing on object detection, ‘intersection over union metric is a commonly implemented metric36. This metric, given at each instant t, then returns a value between 0 (zero intersection) and 1 (intersection = union). Then, it generally implies the application of a threshold. If the ratio exceeds this threshold, the object is considered detected, otherwise it is not. There are several ways of extending the definition of this metric to the scale of a scenario. Simple ways are to just consider the first moment when a given object is detected or to evaluate the sensitivity of the algorithm by evaluating it for a given period.
To assess the fidelity of a testing environment, e.g. XiL testing, the same metric is calculated for both the proving ground/real world and XiL. Once the metrics are well-defined with the test case studied, the values of the metrics are compared to assess the relevance of the tests carried out in XiL.
Case study
This section demonstrates how the methodology proposed into the previous section can be applied, starting from the use cases up to the generation of test cases.
From Use Cases to scenarios
Table 4 shows how use cases 1-3 (i.e. UC1, UC2, UC3) from Table 3 have been combined to generate test scenarios with 3 different road layouts (i.e. rural, urban, highway), 3 different harsh weather conditions, and the addition or omission of a VRU. Notice that there is no scenario for VRU on a highway as pedestrians and cyclists are not permitted on the highway, and therefore are considered not part of the initial testing for hash weather conditions. For each use case, only a subset of tests is considered (see tick in the table), but overall, the full set of combinations of use case/scenario demonstrates coverage of every factor, reducing the total number of combinations.
Table 4. Case Study: example of combining 3 use cases (i.e. UC1, UC2, UC3) with 3 Road Layouts, 3 Harsh Weather Conditions, and Vulnerable Road User (VRU) Existence.
| Use Case | Scenario |
|---|
UC1
Driving straight | UC2
Full stop […] | UC3
Interacting with VRUs | Scenario ID | Road layout | Weather Condition | VRU present |
|---|
| Rain | Fog | Snow |
|---|
| ✓ | | | S1 | Urban | | | ✓ | |
| ✓ | | S2 | Urban | | ✓ | | |
| | ✓ | S3 | Urban | ✓ | | | ✓ |
| ✓ | | | S4 | Rural | | ✓ | | |
| ✓ | | S5 | Rural | ✓ | | | |
| | ✓ | S6 | Rural | | | ✓ | ✓ |
| ✓ | | | S7 | Highway | ✓ | | | |
| ✓ | | S8 | Highway | | | ✓ | |
The Use Case selected for the case study, is ‘Interacting with VRUs’, as this is one of the most challenging situations related to safety for AAD functions. To define suitable test cases, first, the test scenario must be defined. The test scenario adds extra information to the use case such as road layout and environment, weather conditions, and type of VRU; this information is needed to implement the tests in any test environment. For any use case, many scenarios can be defined and tested, and scenarios can be jointly defined across use cases. Moreover, for every scenario there are multiple variables that need to be varied, so the number of scenarios must be limited but adequate to cover a sufficient variability of scenarios that can be encountered by the real automated system.
From scenarios to test cases
Scenario S3 in Table 4 has been selected as the case study scenario, where the road layout is urban, the weather is rainy, and a pedestrian (i.e. the VRU) is crossing the road at a pedestrian crossing. This test scenario gives far more information on what is being tested than the use case, but not enough information to execute the testing. The various parameters associated with the test scenario are known, such as rain intensity and vehicle speed, however, their values need to be fully defined to completely specify the test cases.
When creating test cases, it is important to consider both the coverage and resources required to appropriately limit the number of test cases. This process will enable the definition of which parameters will take fixed values and which will be configurable within the test plan. Of the configurable parameters, the number of their values must be defined. These values together will dictate the number of test cases. To reduce the number of test cases without heavily reducing coverage, parameters that are highly related can be grouped under a single parameter. For example, a parameter such as ‘Traffic Density’ can encapsulate the number, spacing, and speed of other vehicles in the scenario. Applying this reduction to the test scenario the case study, the configurable parameters are:
Rain Intensity: (0mm/h, 25mm/h, 50mm/h, 100m/h)
Ego Vehicle Target Speed: (30km/h, 50km/h)
Pedestrian Behaviour: (Waiting, Crossing)
Traffic Density: (Low, Moderate, High).
Based on the test input variables above, there are 48 combinations. These combinations correspond to 48 unique test cases generated for this specific implementation of the selected UC3 with an urban scenario. This number can be further reduced depending on the selected testing environment. Software-in-the-Loop (SiL) testing is less resource intensive, and tests can be run above real-time speed, so more test cases can be executed (e.g. all the 48 mentioned above). For the SiL testing to be meaningful, validated digital twins of the test facilities and validated sensor noise models are key, e.g. rain noise model for camera, LiDAR, and RADAR. As a further step, fixing e.g. ‘Traffic Density’ reduces the number of tests to 16 cases for Hardware-in-the-Loop (HiL) testing, and then fixing ‘Ego Vehicle Target Speed’ reduces the test cases to 8 for Vehicle-in-the-Loop (ViL). These reductions will need to be properly verified and validated, cross-checking the test results of test cases run across different testing environments. Figure 6 shows an example where a physical VRU test is replicated in simulation.
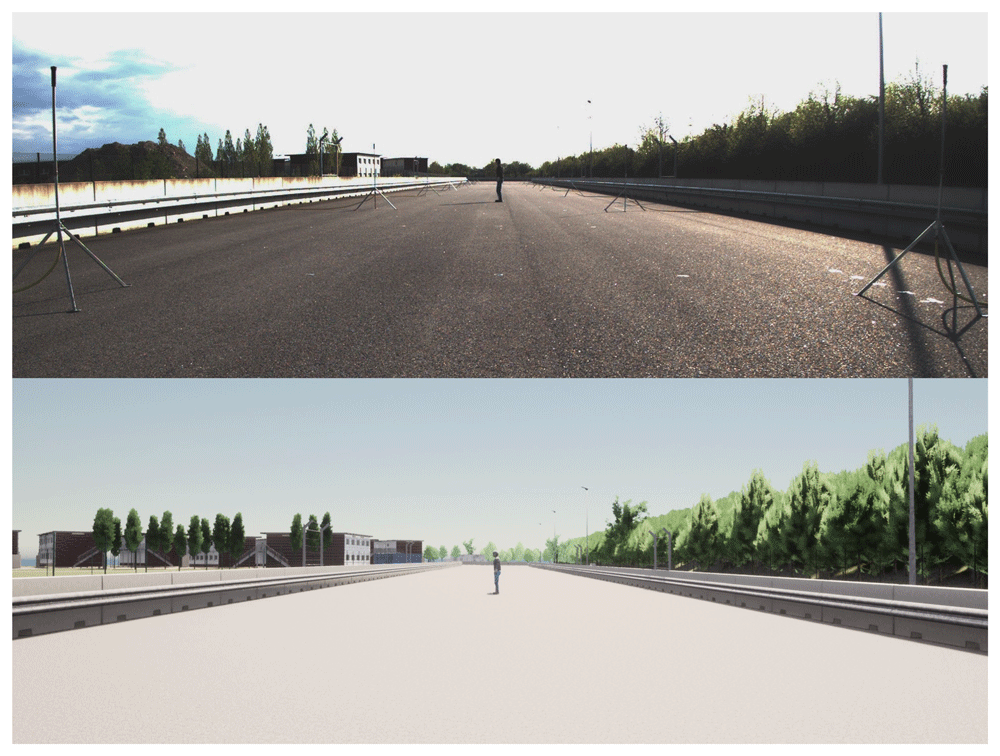
Figure 6. Example of a test case from this case study with the ego vehicle slowing down due to a VRU (e.g. pedestrian).
The frames are rendered with a camera behind the ego vehicle windshield. Top image: frame captured by the real camera in the test facilities: bottom: simulated version.
Conclusions
In the development cycle of automated vehicles, testing is key for the safety argument. In particular, suitably designing test cases enables system evaluation and validation inside the proposed ODD. This work proposes a clear methodology to derive test cases in harsh weather, starting from ODD and use cases. As a part of this methodology, the current terminology around ODD, scenarios, testing, and harsh weather in the automotive context has been reviewed and unified to propose a common understanding of these terms.
Linking ODD and test cases through our proposed parameterised scenario generation methodology is essential for systematically generating a large set of test scenarios, including the weather aspect. In this way, it can help to cover the significant variability that can emerge during driving.
An important aspect when AAD systems need to be tested in harsh weather is to have validated sensor noise models, to generate multiple high-fidelity test cases in the virtual environment, accelerating the overall process and reducing the cost and time of tests in the real world. In this respect, the proposed methodology can play an important role by allowing to systematically measure the impact of harsh weather on system performance including validated sensor models.
Dealing with adverse weather conditions deserves more attention in AAD research and development, as the usefulness of such systems will be severely limited unless they can also perform well in common phenomena such as rain, fog, and snow. The hereby proposed methodology can significantly contribute to both increased efficiency in testing and stronger safety arguments for such conditions.







