Overview of development and financial flows in Oceania
General context. Historically Australia has been the largest aid donor to the Pacific, with New Zealand, Japan, the US, and the EU also contributing; however, in the past 15 years China’s aid contribution to the Pacific has increased. Since the 1980s the major regional aid donor Australia has adopted policies that have sought to integrate Melanesian states more closely with the global market so as to boost Pacific agricultural exports, create wealth, and reduce poverty (Hawksley, 2009: 127). Australian politicians in particular have historically been dismissive of the Pacific region’s concerns, and until recently also held a view that many Pacific governments were plagued by corruption (Hawksley & Georgeou, 2023: 146).
Concerns over growing Chinese influence prompted the Australian (Liberal-National) governments of Malcolm Turnbull (2015–2018) and Scott Morrison (2018–2022) to announce the Pacific ‘Step up’ as a ‘step change’ in engagement. From September 2016, the main initiatives were a $2bn Infrastructure financing facility, access to the Australian seasonal (fruit and vegetable) labour market for some Pasifika peoples, telecommunications infrastructure, and revitalized policing cooperation (DFAT, 2019a). Outsider notions of security in the Pacific are also changing—they are adapting from initial concerns over law and order that for decades influenced donor efforts towards creating centralised state control and stability (Georgeou & Hawksley, 2016), towards a human-security model that considers a range of factors, including gender-based violence, disability inclusion, food security, access to education and support for climate action. In terms of a ‘diplomatic footprint’, Australia is the best represented power in Oceania with extensive official Embassies and High Commissions across the Pacific, and Consulates General in New Caledonia and French Polynesia (DFAT, 2024b).
China has long term Pacific relationships with Fiji and Samoa (1975), PNG (1976), Vanuatu, 1982, and Micronesia (1989) (China Embassy NZ, 2023). It has since worked assiduously at prising states from the Taiwanese diplomatic orbit in the Pacific with recent ‘flips’ including Kiribati (2019), Solomon Islands (2019), and Nauru (2024) (Al Jazeera, 2024; Hawksley & Georgeou, 2019; MOFA PRC, 2021). Such switches form part of a much longer-term global diplomatic game involving Chinese attempts to extinguish recognition of Taiwan that date back well over two decades (Hawksley, 2009), and which have seen support for Taiwan’s separate existence as a state eroded in Africa, the Pacific and in the Caribbean. In the Pacific, China now claims recognition by 10 states, and has embassies in eight (China Embassy NZ, 2023).
China’s expanding links with Oceania have been and remain of great concern to Australia and the Western Alliance but are arguably a problem of their own making. Australia and New Zealand both imposed supposedly ‘smart sanctions’ on Fiji in 2007 in an attempt to convince the Fijian military regime to return power to its democratically elected government. These sanctions backfired in a spectacular manner, and the main beneficiary was China, which strengthened its economic and political relations with Fiji (O’Keefe, 2021). By 2018, Australian media was reporting that China was seeking to establish a military base in Vanuatu, which is a member of the non-aligned movement (O’Keefe, 2020), and while those reports were false, in 2007 China did build a new headquarters for the sub-regional Melanesian Spearhead Group (MSG) in Port Vila, Vanuatu (Hegarty, 2015).
While Oceania is marginal in terms of its percentage of global population, or its economic activity, the geostrategic importance of the Pacific Ocean region is bound up with the Western strategic denial of the Pacific to China; effectively Australia, New Zealand, France and the US are attempting to keep China out or reduce its influence over the PICTs (Hawksley & Georgeou, 2023: 147).
In 2015 China’s aid spending (US$233.9 million) exceeded that of New Zealand (US$204) for the first time (Hawksley & Georgeou, 2023: 148), however, Chinese spending in the Pacific has also been declining since 2019 (Pryke & Dayant, 2021), a decline that could be linked to the Chinese state’s efforts to cut spending and restructure debt (Deng, 2022). It is also likely due to the PICTs' concerns over debt trap development loans (Smith, 2021). In addition to grants and loans China also deploys considerable Foreign Direct Investment (FDI), and State-Owned Enterprise (SOE) to expand its geopolitics influence (Stone et al., 2022)
Increased Chinese engagement in the Pacific has presented an opportunity for some Pacific states to use their sovereignty to leverage influence (Hawksley & Georgeou, 2023) and has caused diplomatic panic in Australia (Varrall, 2021). Between 2003–2017 Australia spent over AUD$2.8bn leading the Regional Assistance Mission to Solomon Islands (RAMSI) (SBS News, 2017), but in March 2022, Australia’s Morrison government was caught unaware and was diplomatically embarrassed when Solomon Islands and China drafted the Inter-governmental Framework Agreement on Security Cooperation’, an agreement that allowed for widespread Chinese security support (VIF Brief, 2022: 5).
Solomon Islands may, according to its own needs, request China to send police, armed police, military personnel and other law enforcement and armed forces to Solomon Islands to assist in maintaining social order, protecting people’s lives and property, providing humanitarian assistance, carrying out disaster response or provide assistance on other tasks agreed upon by the Parties; China may, according to its own needs and with the consent of Solomon Islands, make ship visits to, carry out logistical replenishment in, and have stopover and transition in Solomon Islands, and the relevant forces of China can be used to protect the safety of Chinese personnel and major projects in Solomon Islands.
China sending its police, troops, and naval vessels to Solomon Islands is part of an attempt by Solomon Islands to expand its traditional donor development relationships (Sora, 2022) and to embrace the more infrastructure-based grants offered by Chinese State-owned enterprises. Such moves have prompted limited US re-engagement in the Pacific; for example in February 2023 the USA re-opened its embassy in the capital, Honiara, which it had closed in 1993 (Hawksley, 2023).
The other important Asian donor to the Pacific, Japan, emerged as the world’s largest aid donor in absolute terms in 1989 (Donortracker.org, 2024). In the Pacific, Japanese aid has undergone gradual changes since it commenced as war reparations to neighbouring countries. Heavily criticised both internationally and domestically over the mercantile nature of its initial aid policy, and for the severe environmental damage of many of its assistance projects, Japan responded with the adoption of its Overseas Development Aid (ODA) Charter in 1992. The Charter sets out a standard list of goals that must be met by Japanese aid programs, such as social welfare, democratisation and scrutiny of military expenditures. Additional to ODA expenditures, Japan’s contributions and subscriptions to Multilateral Grants come in the form of its support for the Asian Development Bank (ADB), an organisation in which it plays a leading role and in which it advances much of the capital or loans.
The top donors to the four Melanesian PICTs chosen for this aid analysis are Australia, New Zealand, China, and Japan, which has recently significantly increased its assistance in the region, along with multilateral organisations such as the World Bank, the Asian Development Bank and European Union institutions (See Figure 1)
These official financial flows, in the form of overseas development assistance (ODA) subsidies and loans, need to be set against other official flows (OOF) and remittances, which are very important in Fiji (Jayaraman et al., 2011) and in Vanuatu because of an increase of seasonal workers to Australia (See Table 3). Personal remittances represented 21% of Vanuatu GDP in 2021 (World Bank). An examination of the development finance in the four Melanesian PICTs during the 2008–2021 (Table 3) period per flow type (in Millions Constant USD) reveals a strong role for remittances in Fiji and Vanuatu, and a central role for grant aid in PNG, Solomons and Vanuatu.
Table 3. Sum of development finance in Melanesian countries during the 2008–2021 period per flow type (Millions USD, 2021 constant prices).
| Flow type | Fiji | Vanuatu | Papua New Guinea | Solomon Islands | Total |
|---|
| ODA - Grant | 2,026 (29.7%) | 1,954 (55.7%) | 9,175 (54.4%) | 4,239 (80.0%) | 17,394 (53.5%) |
| ODA - Loan | 630 (9.2%) | 441 (12.6%) | 3,166 (18.8%) | 129 (2.4%) | 4,366 (13.4%) |
| OOF - Grant | 49 (0.7%) | 44 (1.3%) | 430 (2.5%) | 495 (9.3%) | 1,018 (3.1%) |
| OOF - Loan | 741 (10.9%) | 16 (0.5%) | 3,951 (23.4%) | 144 (2.7%) | 4,852 (14.9%) |
| OOF - Other | 6 (0.1%) | 3 (0.1%) | 31 (0.2%) | | 40 (0.1%) |
| Persol remittances | 3,360 (49.3%) | 1,053 (30.0%) | 125 (0.7%) | 290 (5.5%) | 4,828 (14.9%) |
| Total | 6,812 (100.0%) | 3,511 (100.0%) | 16,878 (100.0%) | 5,297 (100.0%) | 32,498 (100.0%) |
As Table 4 shows, the nature of financial flows in Melanesian PICTs differs from donor to donor.
Table 4. Donor by loan or grant type, including overseas development assistance (ODA) as subsidies (grants) or loans, and other official flows (OOF) as loans or grants. (Millions USD, 2021 constant prices).
| Donor | ODA - Grant | ODA - Loan | OOF - Loan | OOF - Other | OOF - Grant | Total |
|---|
| Asian Development Bank | 199 (6%) | 691 (21%) | 2,387 (73%) | 11 (0%) | | 3,288 (100%) |
| Australia | 11,238 (86%) | | 888 (7%) | | 1,016 (8%) | 13,142 (100%) |
| China | 564 (20%) | 1,467 (53%) | 752 (27%) | | 1 (0%) | 2,784 (100%) |
| EU Institutions | 816 (96%) | 38 (4%) | | | | 854 (100%) |
| Japan | 1,008 (56%) | 785 (44%) | | | | 1,793 (100%) |
| New Zealand | 1,249 (100%) | | | | | 1,249 (100%) |
| Other | 2,180 (66%) | 448 (13%) | 662 (20%) | 29 (1%) | | 3,319 (100%) |
| World Bank | 139 (11%) | 937 (76%) | 162 (13%) | | | 1,238 (100%) |
| Total | 17,393 (63%) | 4,366 (16%) | 4,851 (18%) | 40 (0%) | 1,017 (4%) | 27,667 (100%) |
We may thus see which type of ODA activities donor states favour. As noted above, the importance of loans within Chinese aid has heightened mistrust in the region about a possible debt trap trajectory (Hawksley & Georgeou, 2023:146; Rajah et al., 2019). However, it is worth noting that the recently completed 2023 Pacific Games in Honiara Solomon Islands relied heavily on ODA Grants for new venues, mostly from China, but also from Japan (Hawksley, 2023).
New Zealand (100%), the EU (98%) and Australia (91%) utilise grants in their ODA, while different forms of loans account for 100% of the IFC, 90% of World Bank lending, and 96% of ADB aid. China is 80% loans and 20% grants, and Japan 56% grants and 44% loans. This is in line with the influence struggle on infrastructure development (Katada & Liao, 2020; Knoerich & Urdinez, 2019) and the traditional use of aid provided by Japan or China throughout the world these last years (Ky et al., 2012).
Additionally, not all Melanesian PICTs are equally dependent on foreign aid, with loans accounting for a significant, and in some cases a majority, share of development aid from multilateral organisations, as well as from China.
Figure 2 charts development finance in $US to the four Melanesian states during the 2008–2021 period by flow type and donor (as % of each donor) and reveals the four PICTs have very different aid donor dynamics. Figure 3 presents these amounts as a percentage of GDP and shows that aid to PNG is 6–8% GDP. For Solomon Islands and Fiji aid is 20% of GDP, and in Vanuatu as much as 35–40% GDP.
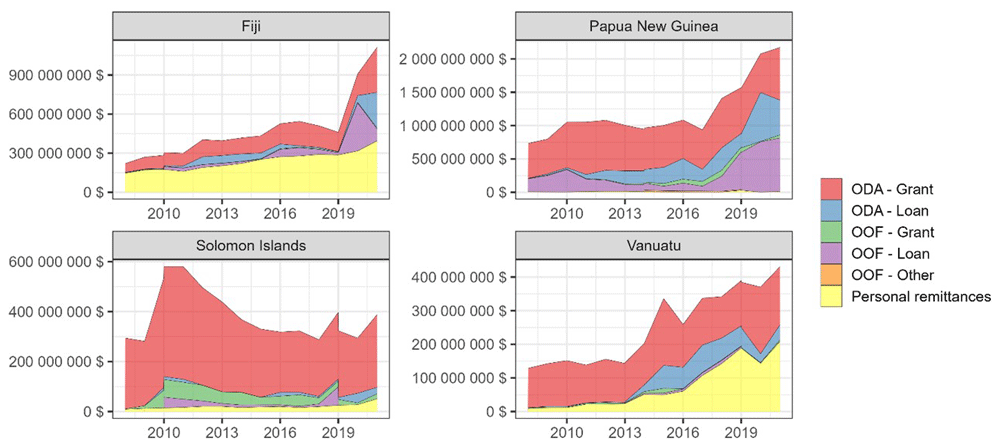
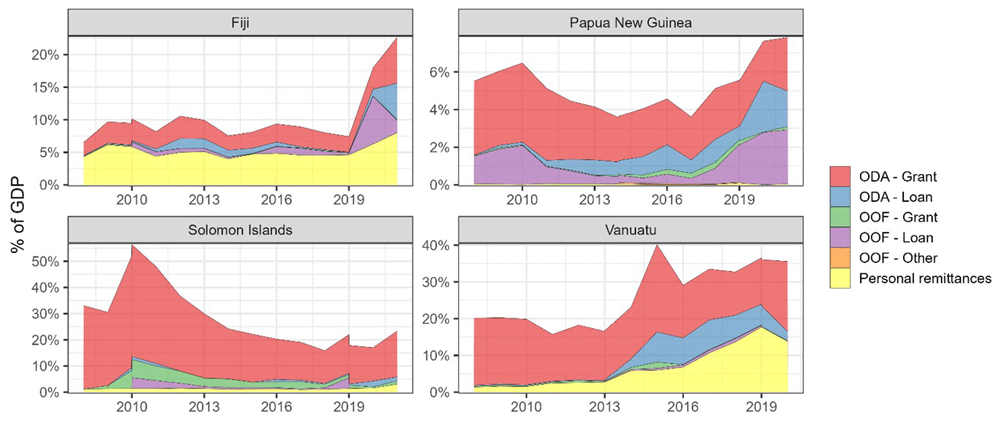
Finally, as can be seen in Table 5 below, Australia ‘outspends’ any other state in aid dollars to these PICTs by a factor of four over China, almost nine over Japan and ten over New Zealand. In 2023/24 the Australian aid budget was estimated to be AUD $4.77 bn, out of which the Pacific region would receive $1.433 bn (22%), Southeast Asia $775.4 million, South and West Asia $124.1 million, and the Middle East and Africa $35 million, and East Asia $11.5 million Australian support for cross-cutting regional and global programs on inter alia, gender, climate, resilience, and disability, were funded with $1.874bn million in 2023/24. Most Australian aid is delivered by DFAT, however there are nine other Australian government entities in the aid delivery business expending a total of $349.9 million, the largest of which is the Australian Centre for International Agricultural Research (ACIAR) which in 2023/2024 delivered $104 million in aid alone, and another $4.1 million in partnership with DFAT (DFAT, 2023)
Table 5. Development finance in Melanesian countries during the 2008–2021 period per recipient and donor (in Millions USD, 2021 constant prices).
| Donor | Fiji | Vanuatu | Papua New Guinea | Solomon Islands | Total |
|---|
| Asian Development Bank | 544 (17%) | 75 (2%) | 2,506 (76%) | 163 (5%) | 3,288 (100%) |
| Australia | 863 (7%) | 911 (7%) | 8,095 (62%) | 3,274 (25%) | 13,143 (100%) |
| China | 421 (15%) | 364 (13%) | 1,935 (69%) | 65 (2%) | 2,785 (100%) |
| EU Institutions | 198 (23%) | 84 (10%) | 436 (51%) | 136 (16%) | 854 (100%) |
| Japan | 361 (20%) | 222 (12%) | 931 (52%) | 280 (16%) | 1,794 (100%) |
| New Zealand | 218 (17%) | 291 (23%) | 359 (29%) | 380 (30%) | 1,248 (100%) |
| Other | 507 (15%) | 378 (11%) | 1,858 (56%) | 577 (17%) | 3,320 (100%) |
| World Bank | 340 (27%) | 132 (11%) | 634 (51%) | 132 (11%) | 1,238 (100%) |
| Total | 3,452 (12%) | 2,457 (9%) | 16,754 (61%) | 5,007 (18%) | 27,670 (100%) |
We can see from the above that some donors share their aid around more evenly than others, while other donors are mostly interested in programs in one Melanesian state. Notably more than half the aid from ADB, Australia, China, EU Institutions, Japan and the Word Bank goes to PNG. New Zealand has the most balanced and equitable aid strategy, with a slight preference for Solomon Islands during the period concerned (2008–2021). We now focus on the individual Melanesian states and unpack the structure of their aid support and identify the levels of funding devoted to agriculture.
Papua New Guinea. The largest and most populous of the Pacific Islands States, PNG has extensive minerals, oil and gas, and both Australia and China wish to gain access to its mines and commodities. These two states are using aid to secure the trade in commodities; however, PNG’s economy is five times as large as the next largest PICT (Fiji). As Figure 4 shows this gives PNG an advantage in attracting and securing funding for development projects from a range of development partners, including the World Bank and the Asian Development Bank, and Japan.
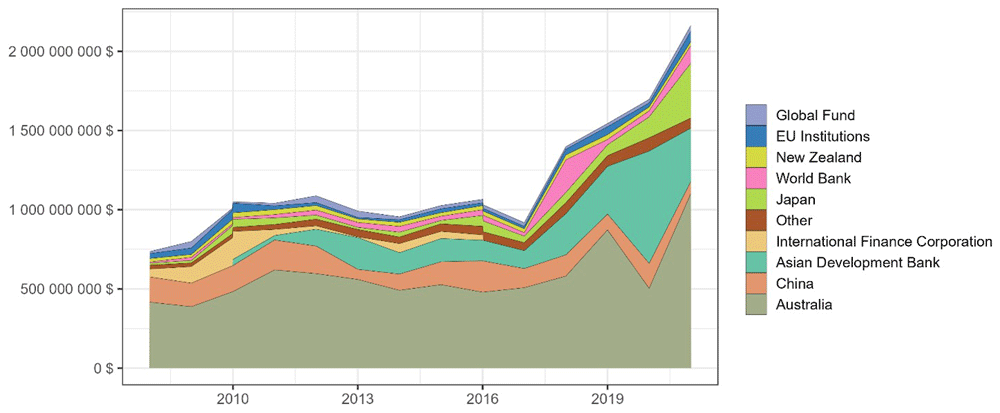
Figure 4. Evolution of ODA and OOF received by Papua New Guinea per donor between 2008 and 2021 (USD 2021 constant prices).
Source: Adapted from data from Lowy Institute Pacific Aid Map database (2024), data are publicly available.
Papua New Guinea currently receives about 40% of total Australian aid to the Pacific region. The historical Australian aid focus in PNG has been around health and education, much of it delivered through churches (Georgeou, 2012: 93; Hawksley, 2008: 146–147). There are now three foci of the Australia-PNG relationship: “health security; stability; and economic recovery”. The last of these has meant a return to budgetary support since 2019 (DFAT, 2024a). In addition, a total of $1.2bn has gone to support PNG government spending through the $4bn Australian Infrastructure Financing Facility for the Pacific (AIFFP) which partners “with governments and private sector in the Pacific and Timor-Leste, to provide grant and loan financing for high quality, transformational energy, water, transport, telecommunications and other infrastructure” (AIFFP, 2024).
Apart from donor states Australia, China, Japan and New Zealand, institutional donors to PNG include the World Bank and the ADB, the latter providing the second largest amount of development funding by 2020. In 2022 the World Bank approved projects to the value of US$229 million for road repair and maintenance, worker employment services for those looking to access labour markets in Australia and New Zealand, and nutrition-focused health services (See Figure 5) to end stunting in children (World Bank PNG, 2024b). The ADB has lent on average $332 million per year for the five years 2017–2021, and in its total history with PNG through 292 projects, some $4.26bn, over half of which was spent in the transport sector (ADB PNG, 2024).
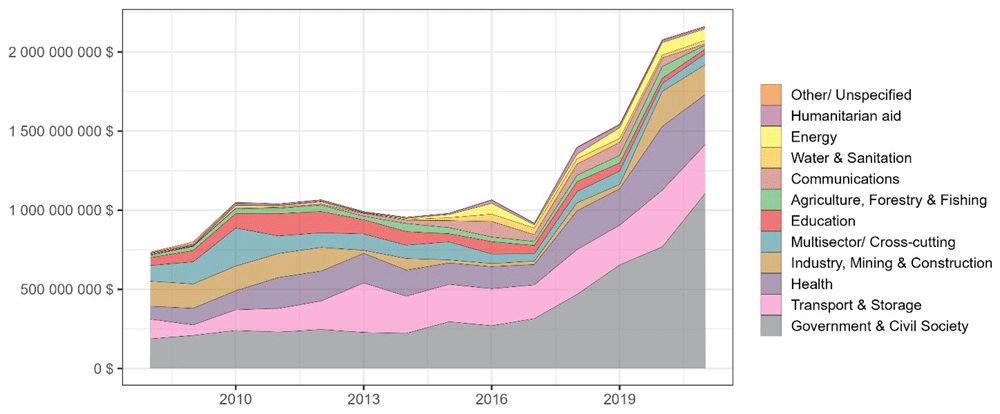
Figure 5. Evolution of ODA and OOF received by Papua New Guinea per sector between 2008 and 2021 (USD, 2021 constant prices).
Source: Adapted from data from Lowy Institute Pacific Aid Map database (2024), data are publicly available.
Japan and PNG have an aid relationship that commenced in 1974 and has been defined at various points by the collection of the bones of Japan’s war World War II dead, existing fisheries and Liquified Natural Gas (Japan PNG, 2012). Japan’s ODA to PNG is mostly allocated to transports projects, such as the Nadzab Airport Redevelopment Project, or the Ramu Transmission System Reinforcement Project (MOFA, 2016). During the COVID-19 Pandemic, Japan also provided emergency support to the four Melanesian countries in this study (MOFA, 2022).
As Figure 6 below shows, Australia’s largest contribution is to the “Government and Civil Society” sector ($2.5 billion between 2008 and 2021), which is divided between multiple governmental cooperation programs with Australia in the fields of policing and justice (DFAT, 2019c). This is in keeping with Australia’s traditional use of development aid over the past few decades, seeing it as a means of ensuring stability in the region through the implementation of “good governance” (Carroll & Hameiri, 2007).
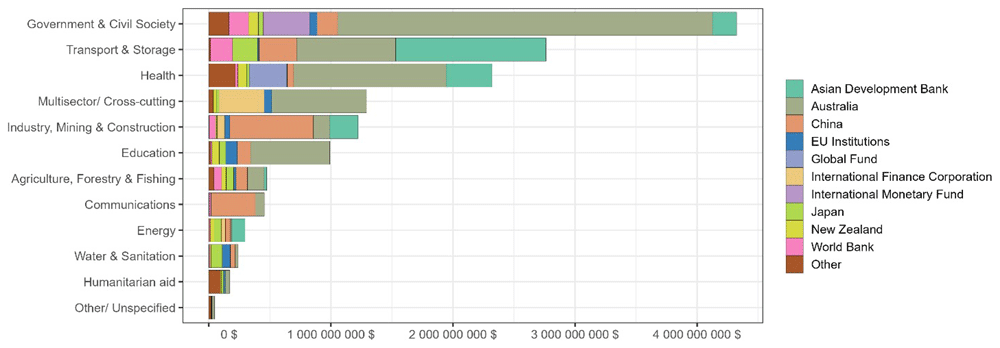
Figure 6. Total ODA and OOF received by Papua New Guinea per sector and donor between 2008 and 2021.
(USD, 2021 constant prices). Source: Adapted from data from Lowy Institute Pacific Aid Map database (2024), data are publicly available.
The second most funded sector in PNG is the “Transport” sector, and the ADB is the main donor to this sector, notably with the upgrade of five national airports in the “Civil Aviation Development Investment Project” (IEG, 2019). The ADB also funds road and bridges, construction, or infrastructure for the port of Lae (ADB, 2017). Australia funds a program to support PNG transport infrastructure, including the Junction-Yamagi Road Project-designed to increase access to the Ramu Nickel-Cobalt site (Tetra Tech, 2022). These projects are monitored by Chinese SOE which hold most of the development contracts, even with the ADB infrastructure projects (Connolly, 2020).
The third most funded sector is the “Health” sector, mainly composed of cooperation programs funded by Australia (DFAT, 2012) or the ADB ADB/PNG, 2020), including the Covid 19 responses programs (ADB, 2022). The fourth most funded sector is the “Industry, Mining and Construction”, mainly funded by China ($656 Millions USD during the 2008–2021 period), and mostly concerning the Ramu Nickel-Cobalt Road from 2008 to 2013 and monitored by Metallurgical Corporation of China Limited (MCC) since a 2005 agreement with PNG (AIDDATA (2021a) (Figure 6). This trend provides a significant illustration of China's strategy to secure access to mining commodities and critical metal ores (Fortier et al., 2019). Support for the Agricultural Forestry and Fisheries sector ranks 8th of 11 named sectors.
Solomon Islands. Between 2003–2017 most of the aid to Solomon Islands was funnelled through the Regional Assistance Mission to Solomon Islands (RAMSI), specifically the cost of maintaining the police personnel of the Participating Police Force (PPF), and in training Royal Solomon Islands Police Force (RSIPF) police cadets, and constructing RSIPF police buildings, including a new HQ at Rove near Honiara, and a program of renovation of police stations (Hawksley & Georgeou, 2016). As Figure 7 and Figure 8 below show, more than 60% of Australian Aid in the “Government and Civil Society” sector currently was dedicated to the RAMSI Program, while other projects concerned the “Governance and stability” sector.
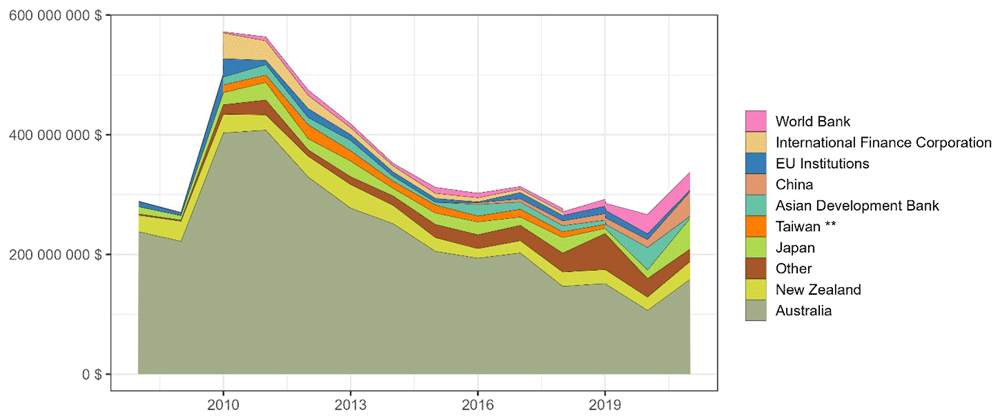
Figure 7. Evolution of ODA and OOF received by Solomon Islands per aid donor between 2008 and 2021 (USD, 2021 constant prices).
Source: Adapted from data from Lowy Institute Pacific Aid Map database (2024), data are publicly available.
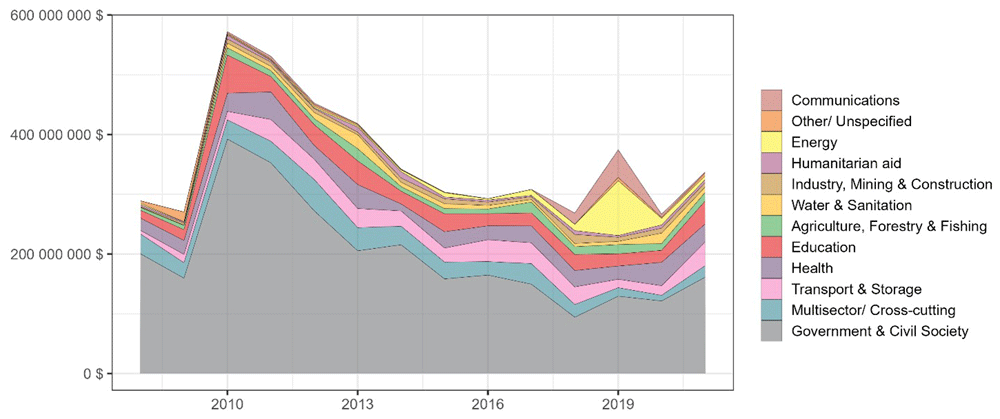
Figure 8. Evolution of ODA and OOF received by Solomon Islands per sector between 2008 and 2021 (USD, 2021 constant prices).
Source: Adapted from data from Lowy Institute Pacific Aid Map database (2024), data are publicly available.
From around 2000–2010 aid donor coordination in Solomon Islands operated through the unofficial “Honiara Club” of donors from Australia, New Zealand, UK (EU), Japan, Republic of Korea (ROK) & Taiwan (ROC). Donor coordination involved different embassies and monthly meetings of donors including Japan (Japan International Cooperation Agency - JICA), NZ Aid (through NZ High Commission), AusAid (Australian High Commission), World Bank, International Finance Corporation (IFC), Asian Development Bank (ABD), Republic of Korea, ROC (Taiwan), South Pacific Commission (now Pacific Community), and the Commonwealth (the UK). The purpose of the Honiara Club was to avoid aid project duplication through information sharing. This enabled Australia and NZ to work on health, education and security issues, while the other main donor (Japan) worked on infrastructure projects (Kemakeza, 2012).
Following the conclusion of RAMSI Australia and New Zealand maintain security and bilateral policing support missions with the RSIPF, recently joined by China. Other Australian and New Zealand aid projects in Solomon Islands tend to focus on education and health.
Past Japanese projects have included a jetty and a covered open-air market in Auki (Malaita) ($80 million between 2007–2012); the construction of bridges to the west of Honiara after flooding; Honiara city’s water supply at Panatina (2009–2014), and a hospital in the Western Province capital of Gizo (2008–2011) in response to the 2005 Tsunami. The Gizo hospital is one of two major hospitals in the entire country (JICA, 2012).
Lowy Institute figures for 2020 show Australian aid ($95.3m) is much larger than that of New Zealand ($21.26m) and the World Bank ($14.5m). Since the diplomatic relationship with China was formalised and that with Taiwan5 ended in 2019, a range of aid projects have been undertaken. China built new infrastructure for Solomon Islands for the November 2023 Pacific Games, with the showcase being a 10,000-seat open air athletics stadium. Japan contributed a new international airport terminal and major connecting roads into Honiara for the same event (Hawksley, 2023).
After the establishment of diplomatic relations, Beijing has promised Honiara around US$730 million in financial aid funding “for health, agriculture, sport, and climate change adaptation and mitigation” (CFE-DM, 2023: 84). If this figure is correct, it helps explain the new-found enthusiasm in Honiara for a comprehensive security partnership with China, which was signed in March 2022 (Hawksley & Georgeou, 2023: 147), and subsequent Western (Australian and US) attempts at re-engaging with the PICTs.
Solomon Islands’ economy is primarily linked to global trade in the export of commodities, in particular timber, palm oil and fisheries. Agriculture however remains an important feature of most households as the country is primarily rural and people grow part and sometimes all of their own food. Wage employment is limited, and the state is the main employer (Georgeou et al., 2019). As Figure 8 and Figure 9 below shows, most of the aid funding is devoted to government and civil society programmes. Agriculture, Fishing and Forestry ranks 6th of 11 named sectors.
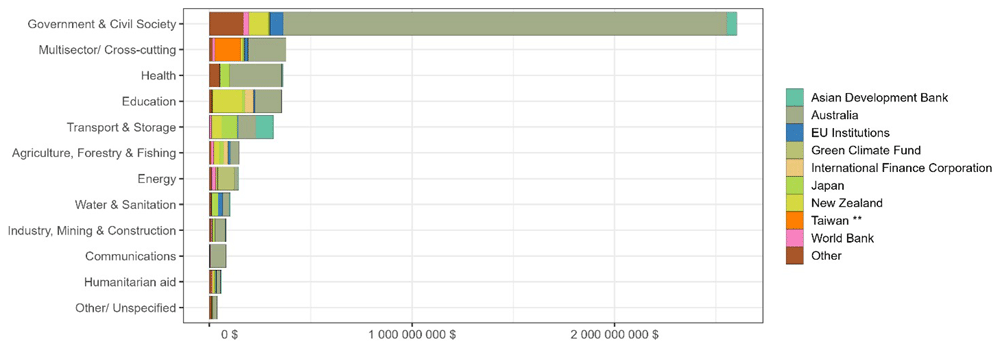
Figure 9. Total ODA and OOF received by Solomon Islands per sector between 2008 and 2021 (USD, 2021 constant prices).
Source: Adapted from data from data from Lowy Institute Pacific Aid Map database (2024), data are publicly available.
Fiji. Fiji is amongst the most developed states in the Pacific region with rich forests, minerals, and fish resources. Fiji’s economy is diversified and is growing by virtue of its services sector which includes the Pacific’s largest tourism industry, construction, manufacturing and its agricultural sector (DFAT, 2019b). Fiji’s economy is however partly dependent on tourism and agriculture. Subsistence agriculture is largely practiced by local indigenous farmers while sugarcane is grown for commercial purposes (Britannica, 2022). The last Agricultural Census (2020) recorded 71,000 households whose main activity is agriculture (among a total of 191,910 private households in the 2017 population and housing census). Over the reference period (the 12 months preceding 10 Feb 2020) of the Census, the total volume of crop production in the country was recorded at 399,056.7 tonnes. The production of temporary crops represents 76.7% (306,035 tonnes) of total crop production, while the remaining 23.3% (93,022 tonnes) is accounted for by permanent crops.
Fiji cannot be categorised as an “aid dependent country” (Schmaljohann & Prizzon, 2014). According to Lowy Institute Data, development aid represented c.3% of Fiji GDP during the 2010–2018 period, while personal remittances represented c.5% of GDP. This low rate is partly explained by Australia and New Zealand’s ‘smart sanctions’ that were adopted after the 2006 coup which significantly reduced aid flows to the country, and which led to much closer relations between Fiji and China (O’Keefe, 2019). We note that development aid increased during the 2018–2021 period to c.15% of Fijian GDP.
Figure 10 below provides the top six ODA donors to Fiji. The World Bank appeared as a new actor with its emergency programs in response to Cyclone Winston in 2016. The World Bank (2021a) also funds a fiscal modernization program to reduce Fiji’s external balance of trade. ADB becomes important only from 2020 because of its post-Covid 19 recovery programs and emergency responses.
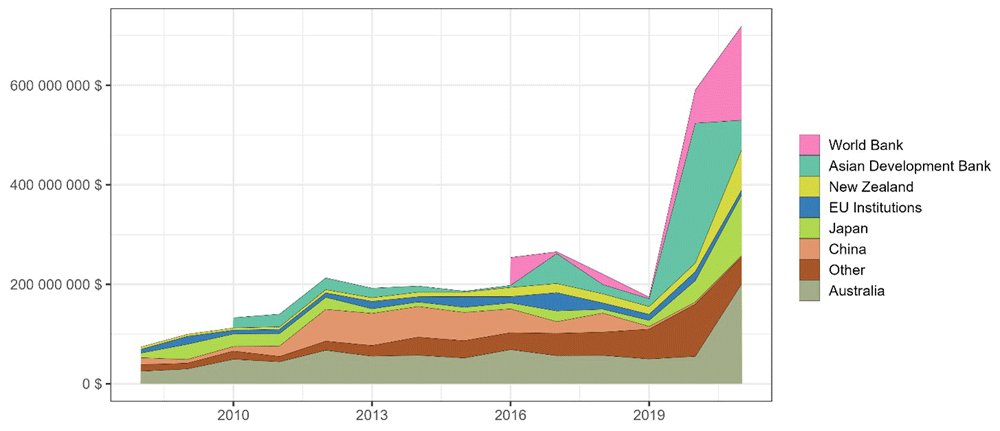
As with PNG and Solomon Islands, Fiji’s most aid-financed sector (See Figure 11) is “Government and civil society”, although Fiji is characterized by the strong presence of the ADB in this sector, making it the largest donor, ahead of Australia (Figure 10 & Figure 12). This is due to the more than $330 million injected by ADB into this sector, 60% of which relates to post Covid-19 aid programs. The more than $251 million injected by Australia into this sector is divided into multiple projects piloted by the Fijian government, which can be used to alleviate the public finance crisis to reduce debt to GDP ratio, or is spent on specific government projects aimed at building civil society (e.g. “Pacific Women Shaping Pacific Development”).
Once again AFF is a low priority, ranking 7th of 11 named sectors, but EU institutions are the main donor in this sector.
Vanuatu. In 2021 the Vanuatu government budget was just over 52 bn Vatu (VDP, 2021) which at the time was equal to US$416 millions, while development aid (ODA + OOF) to Vanuatu represented $222 millions, or more than 50% of the total gov budget (Lowy Aid Map, 2024). Vanuatu can thus be considered as a “highly aid dependent” country as a good share of its services is financed by development assistance (Schmaljohann & Prizzon, 2014). Vanuatu’s biggest aid donors are Australia, China, New Zealand, the World Bank and Japan. Aid from China rose sharply between 2013 and 2017, surpassing New Zealand aid in 2014 and Australian aid in 2017. However, as Figure 13 shows, Australia has increased its contribution significantly since 2019, while aid from other countries and multilateral institutions has decreased over this same period.
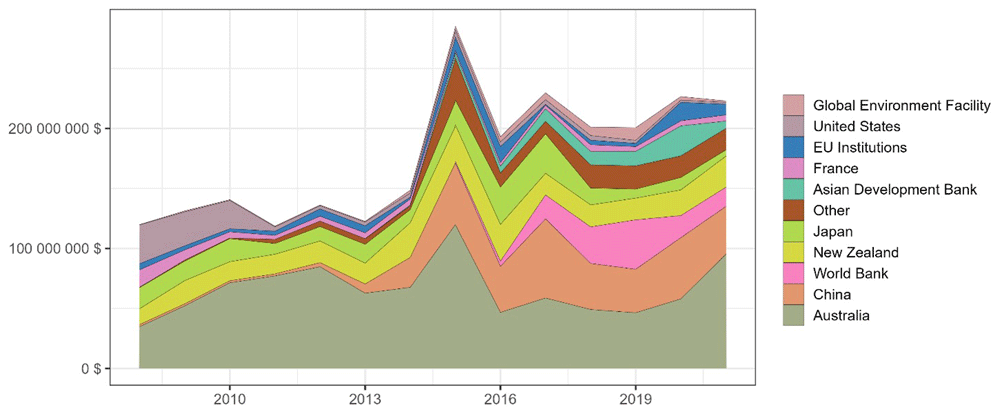
As Figure 14 shows, Vanuatu’s Transport sector is the most allocated sector during the period, with almost US$600M constant USD and various projects concerning different infrastructure and islands: the US$73M Vanuatu Aviation Investment Project funded by the World Bank (IEG, 2019), the US$70M Luganville Wharf Redevelopment (AIDDATA, 2021b) and the US$45M road upgrade in Tanna and Malekula (AIDDATA, 2021c), both funded by China.
As with the other Melanesian PICTs, the “Government & Civil Society” sector is mainly funded by Australia and mostly concerns cooperation projects about police and justice (DFAT, 2016).
The third most funded sector is the “Education” sector, mainly funded by Australia and Japan in the framework of the “Vanuatu Education Road Map” project which is a multi-country agreement (Vanuatu Education Road Map, 2010).
Figure 15 shows the fourth most funded sector is the “Health” sector, over half of which comes from Australian Aid. AFF ranks 7th of 11, with a significant contribution from EU institutions, as is the case in Fiji.
We now turn to specifically examine aid donor support for agriculture within the AFF category, which we have established already as a relatively low priority for all donors.
ODA to Agriculture in Melanesian PICTs
General context and ODA to Agriculture. As Table 6 shows, agriculture plays a significant role in the four countries studied, but this vital aspect of economy and culture is not visible in the standard economic indicators (between 31% (SI) to 15% (Fiji) of the GDP in 2021). Agriculture in these four countries, is a complex interplay of traditional practices, modern influences, and is facing emerging challenges (migration, mining activity and climate change).
Table 6. World development indicators for Agriculture in Melanesian countries (2020).
| $ | Fiji | Vanuatu | Papua New Guinea | Solomon Islands |
|---|
| 2018 | 2021 | 2018 | 2021 | 2018 | 2021 | 2018 | 2021 |
|---|
| Agriculture forestry and fishing value added (constant 2015 US$) | 377 201 679 | 409 776 953 | 175 409 195 | NA | 4 166 520 942 | 4 387 003 381 | 466 911 044 | NA |
| Agriculture forestry and fishing value added (% of GDP) | 10.91 | 15.28 | 21.22 | NA | 16.97 | 18.99 | 33.97 | NA |
| Agriculture forestry and fishing value added (annual % growth) | 3.68 | 0.79 | 0.90 | NA | 4.57 | 1.08 | 0.38 | NA |
| Employment in agriculture (% of total employment) (modelled ILO estimate) | 29.52 | 29.40 | 51.05 | 43.47 | 20.06 | 18.97 | 38.84 | 37.88 |
| Crop production ind. ex (2014-2016 = 100) | 103.25 | 110.62 | 83.09 | 84.58 | 101.18 | 98.77 | 103.63 | 108.11 |
| Food production index (2014-2016 = 100) | 117.90 | 115.07 | 82.48 | 84.08 | 101.64 | 100.07 | 100.76 | 101.58 |
The majority of the inhabitants of PNG, Solomon Islands, Fiji, and Vanuatu practice subsistence agriculture. This form of agriculture, often referred to as horticulture, focuses on growing enough food to feed the farmer and their family (Bourke, 2019). Nevertheless, this subsistence family farming has a high level of productivity despite having less access to productive resources (inputs and support). For example, in Fiji, 84% of yams, cassava, corn and beans are farmed on only 47% of the land (FAO, 2014). That is why we propose to deepen our analysis of aid development strategies by examining the agriculture sector in the databases. Specifically we seek to understand “What is the place for agriculture in aid development flows?” “What type of projects are funded?” “Is there any difference between donors?” and “Are these projects adapted to the specificities of Melanesian agriculture and its subsistence dimension?”
The Agricultural sector comes under the wider category of “Agriculture, Forestry, Fishing” (AFF). The funds allocated to the AFF sector (Figure 16) spike in Fiji after 2015’s Cyclone Pam then stabilise until 2019 and then increase; there is also a significant increase for Vanuatu. Figure 17 shows the allocated part of ODA to this sector oscillates between 5 and 7% for PNG, Solomon Islands and Vanuatu.
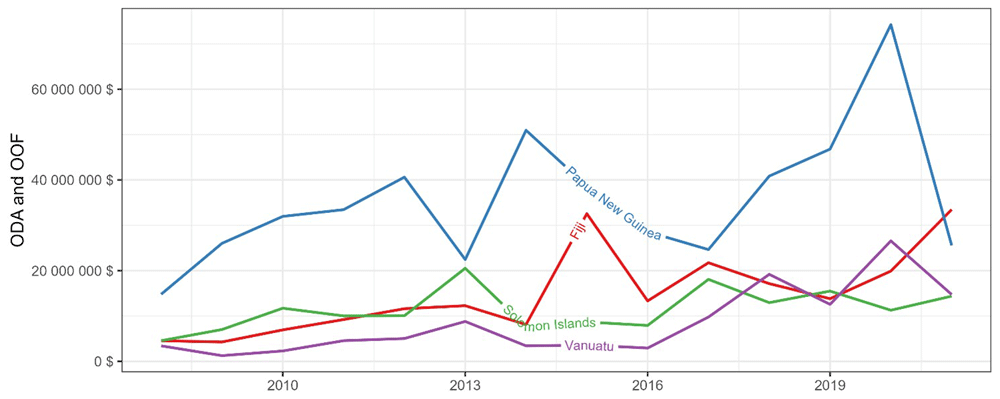
Figure 16. Development finance allocated to ‘Agriculture, Forestry, Fishing’ per recipient state & year (USD 2021 constant).
Source: Adapted from data from Lowy Institute Pacific Aid Map database (2024), data are publicly available.
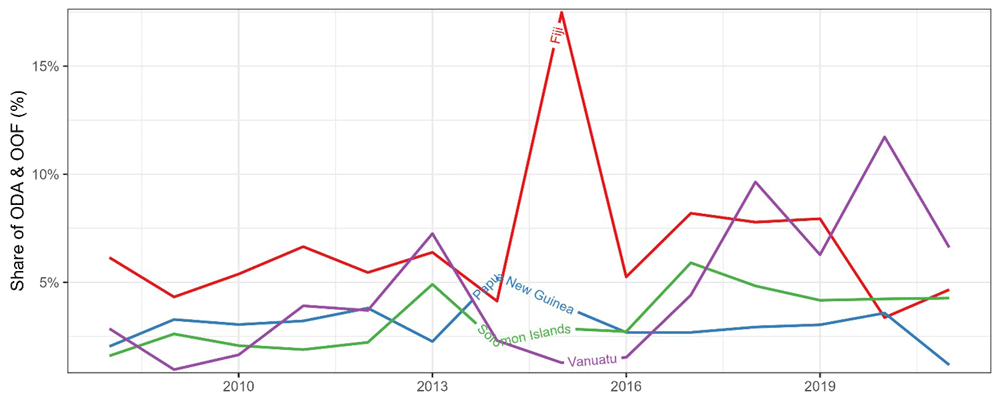
Figure 17. Part of development finance allocated to ‘Agriculture, Forestry, Fishing’ per recipient state & year (% of ODA and OOF).
Source: Adapted from data from Lowy Institute Pacific Aid Map database (2024), data are publicly available.
Figure 18 shows that in comparison to Gross Domestic Product (GDP), the ODA allocated to AFF is residual for PNG and Fiji (<1% of GDP), but it can oscillate between 1–2% of GDP for Solomon Islands and Vanuatu, the latter of which increases substantially after 2019.
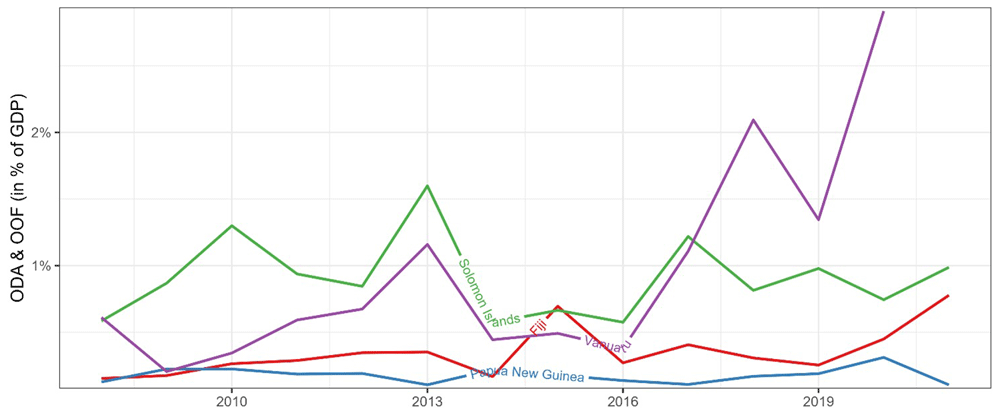
Figure 18. Part of development finance allocated to ‘Agriculture, Forestry, Fishing’ per recipient state & year (in % of GDP).
Source: Adapted from data from Lowy Institute Pacific Aid Map database (2024) and SPC (2024) for GDP, data are publicly available.
As Table 7 illustrates, ODA Grants clearly dominate the AFF sector in all four PICTs.
Table 7. Development finance in Melanesian countries 2012–2021 for Agriculture, Forestry, Fishing period per flow type (Millions Constant USD).
| Donor | Fiji | Vanuatu | Papua New Guinea | Solomon Islands | Total |
|---|
| ODA - Grant | 189 (90%) | 97 (82%) | 334 (67%) | 129 (81%) | 749 (76%) |
| ODA - Loan | 15 (7%) | | 145 (29%) | 4 (2%) | 164 (17%) |
| OOF - Grant | | 6 (5%) | 0 (0%) | 5 (3%) | 11 (1%) |
| OOF - Loan | 5 (2%) | 16 (13%) | 21 (4%) | 22 (14%) | 64 (6%) |
| Total | 209 (100%) | 119 (100%) | 500 (100%) | 160 (100%) | 988 (100%) |
When viewing by donor per recipient state we may see from Table 8 below that some aid donors are more active in some PICTs than in others. As previously indicated, EU institutions are demonstrably more engaged in the support of Fiji and Vanuatu's AFF sector.
Table 8. Development finance in Melanesian countries for Agriculture, Forestry, Fishing during the 2012–2021 period (in Millions USD, 2021 constant prices) per donor.
| Donor | Fiji | Vanuatu | Papua New Guinea | Solomon Islands | Total |
|---|
Asian Development
Bank | 1 (3%) | 8 (27%) | 21 (70%) | | 30 (100%) |
| Australia | 33 (13%) | 32 (12%) | 148 (57%) | 48 (18%) | 261 (100%) |
| China | 27 (22%) | | 98 (78%) | | 125 (100%) |
Climate Investment
Funds | | | 10 (100%) | | 10 (100%) |
| EU Institutions | 88 (59%) | 29 (20%) | 18 (12%) | 13 (9%) | 148 (100%) |
| France | 0 (0%) | 6 (100%) | 0 (0%) | | 6 (100%) |
| Germany | 1 (10%) | | 8 (80%) | 1 (10%) | 10 (100%) |
Global Environment
Facility | | | 22 (81%) | 5 (19%) | 27 (100%) |
International
Finance Corporation | | 2 (8%) | | 22 (92%) | 24 (100%) |
| Japan | 14 (13%) | 10 (9%) | 64 (59%) | 21 (19%) | 109 (100%) |
| Korea | 2 (10%) | 14 (67%) | 2 (10%) | 3 (14%) | 21 (100%) |
| New Zealand | 16 (16%) | 15 (15%) | 38 (38%) | 32 (32%) | 101 (100%) |
| Other | 8 (53%) | 2 (13%) | 4 (27%) | 1 (7%) | 15 (100%) |
| World Bank | 19 (20%) | | 65 (67%) | 13 (13%) | 97 (100%) |
| Total | 209 (21%) | 118 (12%) | 498 (51%) | 159 (16%) | 984 (100%) |
Australia and the World Bank are two donors that distribute their aid across multiple countries. Australia provides 13% of its aid to Fiji, 12% to Vanuatu, 57% to Papua New Guinea, and 18% to the Solomon Islands. The World Bank, on the other hand, gives 20% to Fiji, 67% to Papua New Guinea, and 13% to the Solomon Islands. Some donors focus their aid on specific countries. For instance, the Asian Development Bank directs 70% of its aid to Papua New Guinea, while China concentrates 78% of its aid on the same country. Similarly, France directed all its aid to Vanuatu, and the Climate Investment Funds allocate all their aid to Papua New Guinea. In terms of recipients, Papua New Guinea receives the majority of AFF aid, with 51% of the total aid directed towards it. This is followed by Fiji (21%), the Solomon Islands (16%), and Vanuatu (12%). Within the ‘III.1. Agriculture, Forestry, Fishing’, (AFF) sector (Figure 19) we can distinguish the part allocated to each of the three sub-sectors.6 We observe Agriculture is the most allocated sub-sector in three of the Melanesian PICTs between these three sub-sector categories, but in Solomon Islands the fishing sub-sector has a higher proportion of funding. Forestry receives the least aid by sub-sector (3–12%) in all the selected PICTs.
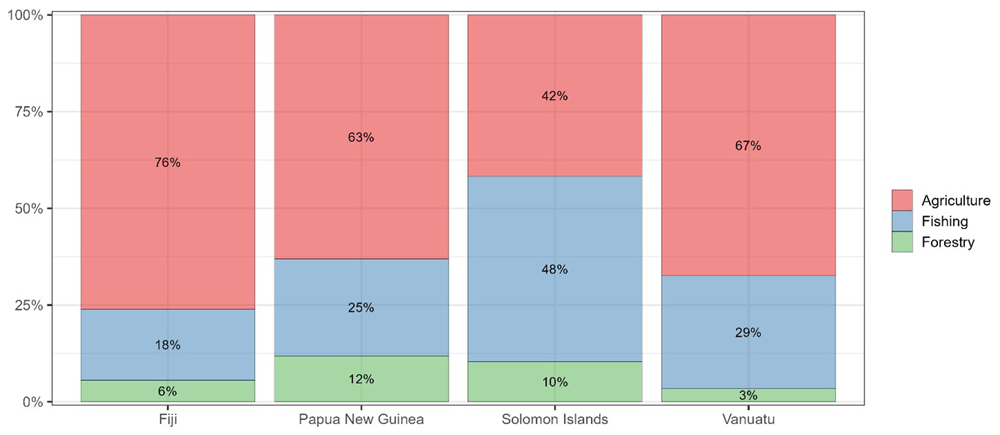
Examining disbursement repartition per donor for each PICT by AFF sub-sector (Figure 20) permits us to distinguish the main donors.
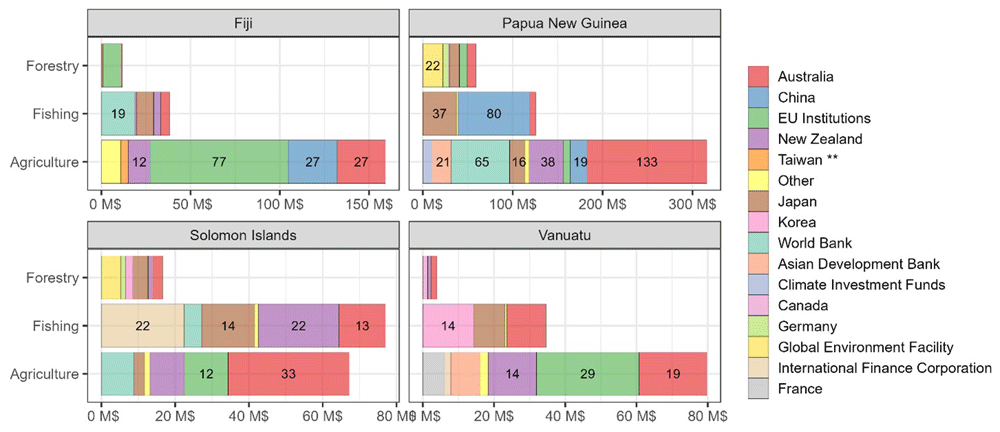
Figure 20. ODA disbursement repartition within ‘III.1. Agriculture, Forestry, Fishing’ per sub-sector & donor (in Millions USD Constant).
** Taiwan was recognised by Solomon Islands until 2019. Source: Adapted from data from Lowy Institute Pacific Aid Map database (2024), data are publicly available.
The ODA reimbursement repartition per subsectors and donors (Figure 20 above) shows that Australia is the main donor for Agriculture in PNG and Solomon Islands, and the EU is the main donor for Agriculture in Vanuatu and Fiji. Concerning Fishing, Solomon Islands is characterized by the presence of non-conventional donors for this sector: International Finance Corporation, Japan and NZ are the main donors for this sub-sector for Solomon Islands, while their contribution to others sub-sectors or other PICTs in Agriculture ODA is residual. Even if AFF is not its favoured sector for investment and support, China focuses its support to the Fishing sub-sector in PNG.
Agriculture in Papua New Guinea. As Figure 21 below shows, the most funded aspect of the PNG Agriculture sub-sector is “Fishery services” mostly funded by China (notably the controversial Pacific Marine Industrial Zone – PMIZ project) (AidData, 2021a), and Japan for the Project for Rehabilitation of Alotau Town Market and Fisheries Facilities (JICA, 2019).
The second most funded category of project is “Agricultural Research”, almost entirely funded by Australia and mainly composed by the Agricultural Research and Development Support Facility project (AusAID, 2012), funded by Australia destinated to “assist smallholder farmers by translating good science into sustainable and profitable farming practices”, we can note that the increase of exportation revenue was mentioned in the project. Australia also funded ACIAR-AusAID partnerships in PNG which are included in this aspect.
The third is the “Agricultural development”, mainly composed of the “PNG Productive Partnerships in Agriculture” funded by World Bank (IDA) (World Bank PNG, 2024a), the JUNCAO project, funded by China to develop mushroom cultivation (Xinhua, 2019), NZ projects to support smallholders, and other Japanese funding to the Agriculture sector.
The fourth most funded sector is the “Agricultural policy and administrative management” sector, constituted by the World Bank’s “Productive Partnerships in Agriculture Project” (PPAP) and its “Smallholder Agriculture Development Project” (World Bank, 2013). We can note than these projects are explicitly intended to improve specialisation in production; the PPAP is destinated to improve value chains for cocoa and coffee, and the SADP project is destinated to “improve revenue from oil palm”. A part of China’s funding for the PMIZ project is also classified in this category. There are also some Australian projects as the “Private sector and rural development” to encourage trade (AHC PNG, 2015) or the PHAMA-PLUS project (PHARMA Plus, 2024).
Concerning the “Food crop production” subsector, one part of the ADB COVID-19 rapid response program is classified in this category. Other projects are helping the Autonomous Bougainville Government by Australia, or the “Fresh Produce Supply Chain Investment”, founded by NZ, linking areas of production with the private sector to improve agriculture production (NZMFAT, 2018).
Solomon Islands. As Figure 22 shows, the most funded aspect in Solomon Islands AFF sub-sectors is the “Fishery development” sector, constituted by IFC Loans to acquire fishing vessels (World Bank SI, 2017), NZ fisheries programs (NZMFAT, 2016), or programs by Japan (MOFA, 2012),7 or Australia.8
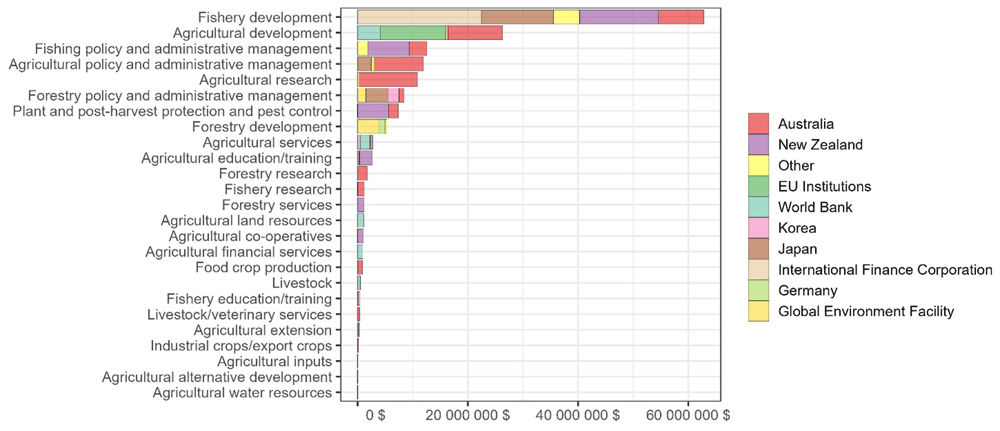
Figure 22. ODA disbursement repartition in Solomon Islands within ‘III.1. Agriculture, Forestry, Fishing’ per sector detailed.
Source: Adapted from data from Lowy Institute Pacific Aid Map database (2024), data are publicly available.
The second most funded category is the “Agricultural development” sector, mainly funded by the EU Intuitions (70% of the funding) with the “Rural Development Program Phase II”, which is a common program with IFAD (IFAD, 2015) directly allocated to PNG’s Agriculture ministry; one of the program objectives was to “assist farming households to engage in productive partnerships with commercial enterprises”.
The third is the “Fishing policy and administrative management” funded by NZ, Japan and Australia.9
The fourth is the “Agricultural policy and administrative management”, principally funded by Australia and its Pacific Horticulture and Agriculture Market Access (PHAMA) Plus project (DFAT, 2018), and ACIAR projects on improving export cocoa quality (ACIAR, 2021).
The fifth aspect concerns “Agricultural research”, mostly funded by Australia and unsurprisingly allocated to ACIAR projects.
There is no specific support for food crop production.
Fiji. As Figure 23 shows, the most funded aspect in Fiji’s AFF Agriculture sub-sector is the “Agricultural development” aspect, mostly comprised of the EU funded program “Support to sustainable Livelihoods”,10 the SPC-EU “Improving Key Services to Agriculture” (IKSA) project (Relief Web, 2017), and the NZ program “Fiji Dairy Industry Development Initiative” (Prime, 2017).
The second most funded aspect is “Fishing policy and administrative management”, most of the funding for which is actually drawn from the recent World Bank “Fiji - Recovery and Resilience First Development Policy Operation with a Catastrophe-Deferred Drawdown Option” (World Bank, 2021b). The third most funded aspect is “Agriculture policy and administrative management”, mostly composed of SPC-EU agreements, the Junca Mushroom project from China, Taiwanese funding for dragon fruit production, and some Japanese funding.
The third most funded concern Agricultural Research and is essentially constituted of ACIAR funding and some grant contracts between EU and Sugar Research Institute of Fiji, in collaboration with Australia (Narayan, 2021).
The fourth most funded category is “Industrial crops/export crops”, almost fully funded by EU Institutions, and mainly allocated to the “Rural Access Roads and Associated Infrastructure (RARAI)” project (Pacific Community, 2014). New Zealand funds all of the less than 1% of aid that is dedicated to Fijian food crop production.
The fifth is the “Agricultural education/training” aspect and is constituted of the Mushroom Technology Demonstration Center, funded by China (MOFO PRC, 2019), the EU funded “Fiji pro-resilience project” to reduce food insecurity (FAO, 2019), and some Australian funding to University of the South Pacific.
Vanuatu. As Figure 24 shows, the most funded aspect in the Vanuatu AFF is “Agricultural development”, mostly constituted by the EU funded program “Vanuatu Value Chain (VaVaC) Budget Support program.” (EU, 2021), NZ funded program “Strengthening Agriculture Value Chains” and some funding from France or Japan.
The second most funded aspect is “Agricultural research", mainly funded by Australia’s ACIAR, but one part of which comes from France, which finances research into healthy rice fields.
The third largest aspect is “Fishing policy and administrative management” mainly funded by Japan and allocated directly to the Vanuatu government. Funding from Australia in this aspect is allocated through the Forum Fisheries Agency.
The fourth is the “Food crop production”, which consists of the ADB’s “COVID-19 Fiscal Response Program” (ADB Vanuatu, 2020).11
The fifth aspect concerns “Fishery development” and is almost entirely constituted by the “Pacific Patrol Boat Program” funded by Australia.