Introduction
The Arctic is warming faster than any other region on the planet (Graversen et al., 2008) and has experienced extreme positive temperature anomalies constantly increasing in the last three decades (Graversen et al., 2008; Walsh, 2014). As a result, the Arctic has lost significant amounts of summer ice cover and permafrost (Graversen et al., 2008; Serreze & Barry, 2011; Tepes et al., 2021). In the last few decades, permafrost temperatures have risen across the Arctic (Smith et al., 2022), and the Global Terrestrial Observing System (GTOS) has identified permafrost as one of six cryospheric indicators of global climate change (Streletskiy et al., 2017). Permafrost thaw has liberated organic carbon, nutrient and trace elements that have been trapped for hundreds to many thousands of years in a frozen state, stimulating microbial activity and increasing the flux of CO2, N2O, and CH4 to the atmosphere (Hayes et al., 2014). While these processes have been extensively studied in soils during the summer months (e.g. Jansson & Taş, 2014; Sipes et al., 2022), the activity of microbial communities and the associated greenhouse gas fluxes during the winter have received comparatively little attention (Graham et al., 2012; Nikrad et al., 2016; Schostag et al., 2015; Vigneron et al., 2019), and data on full seasonal patterns of microbial activity and carbon cycling are scarce. Additionally, the direct coupling between carbon and nutrient utilization by soil microbial communities with the exports to the marine ecosystems, and how these can significantly alter the biogeochemical balance of the area, are significantly less understood (Walvoord & Striegl, 2007).
The response of the Arctic ecosystems to increased melting events is mediated by the microbial community response to these events (Graham et al., 2012). Processes such as respiration, fermentation, methanogenesis, and methane oxidation, together with the efficiency of carbon transfer to higher trophic levels, significantly influence the ultimate fate of the newly released carbon and nutrients (Jansson & Taş, 2014). Characterizing the microbial communities and soil gas fluxes across seasons is of paramount importance to better constrain the response of Arctic soils to ongoing climate change (Graham et al., 2012). While the quality and quantity of carbon released during the summer (and winter) melting events is a strong control on microbial activity (Miner et al., 2022), the release of nutrients and trace elements might place additional constraints on the microbial community response, potentially influencing the type of metabolic processes that are active (Giovannelli, 2023).
The Svalbard archipelago, located in the Arctic Ocean between 74 °N and 81 °N, is highly glaciated and it is experiencing rapid increases in temperature and glacial retreat, making it a model system for future changes to the rest of the Arctic (Martín-Moreno et al., 2017). Approximately 60 % of the archipelago surface is covered by glaciers, leaving a periglacial area where about 25,000 km2 is covered by permafrost making Svalbard the largest permafrost area in Europe. The archipelago has a continuous permafrost layer that reaches up to 100 m depth in coastal areas and greater than 500 m in mountainous areas. Svalbard permafrost, also known as “warm permafrost”, is particularly sensitive to climate change, since its temperature is close to 0 °C (Humlum et al., 2003; Isaksen et al., 2007; Keating et al., 2018). Mountain topography also has a role in making Svalbard permafrost more sensitive to climate change, as variables like altitude, slope, and snow cover can cause changes in the ground temperature and affect the permafrost thickness. Temperatures in the area have steadily increased to about ~3 °C above the seasonal mean, and winter snow cover has been rapidly declining (Isaksen et al., 2007; Vickers et al., 2021). The increasing temperatures have resulted in longer and deeper permafrost thawing events, increasing greenhouse gas emissions in the area. While extensively studied during the summer months, a handful of studies have investigated the soil microbial communities during the winter months in Svalbard (Loganathachetti et al., 2022; Schostag et al., 2015).
The project Melting-ICE was designed to provide an integrated view of the active layers of microbial communities during the winter, summer and autumn seasons while spanning the land-to-sea transition. The project will generate data on the microbial diversity in the active layer, together with quantitative estimates of greenhouse gas fluxes and isotopic signatures. Three independent field expeditions have been conducted to compare the fluxes and microbial diversity during the Arctic winter with the conditions present at the beginning of the summer melt season and the beginning of Autumn freeze events. This report describes the three expeditions to the Ny-Ålesund area, on the island of Spitsbergen, Svalbard archipelago, Norway.
The expedition team and logistics
The project team is composed of a team of interdisciplinary scientists spanning the microbiology, biogeochemistry, microbial ecology and gas geochemistry fields. The expedition was hosted by the Italian “Dirigibile Italia” Arctic Station managed by the Institute of Polar Sciences of the Italian National Research Council and the UK Arctic Research Station, both located in Ny-Ålesund, which provided logistic support. The field science party was responsible for the sample collection and the field measurements. Three sampling expeditions were performed, in February 2022, June 2022 and September 2022, coinciding with a full active layer thaw cycle.
During the winter expedition (i.e., February 2022), given the extremely low temperatures, drilling operations and gas flux measurements were particularly challenging. The Field Science Party performed sampling operations for 17 days with windchill temperatures down to -38 °C (air temperature of -28 °C). Sampling operations were suspended for two days during bad weather conditions when windchill temperatures reached as low as -44 °C. Recovery of intact core samples was difficult due to the fast freezing of the core within the core drill barrel during operation, and only a few intact cores were recovered. For the rest of the locations, coring was performed in sections and the recovery was limited to loose material dislodged from the core barrel. Gas flux measurements were limited by battery life at low temperatures, in spite of the isolation and heat sources placed in proximity of the instruments. The Onshore Science Party was responsible for supporting the logistics and preparation of the expedition as well as collaborating on sample processing and analysis.
The second 10 days expedition, performed in June, allowed the collection of sediment and fluid samples from the 6 sites originally chosen during the first campaign, and from an additional 7th site. Air temperature ranged between 5 and 8 °C and snow cover was absent. Soils were soaked with meltwater. The 7 days of fieldwork originally planned were reduced to 6 due to the presence of several polar bears nearby the BY4 and BY5 sites (Figure 1).
The fall sampling expedition was carried out at the end of September. Air temperature ranged between 2 and 5 °C, and snow cover was absent. Soil was mostly dry. During this third field expedition, all 7 sites were sampled. (Table 8)
Field Science Party composition: Francesco Montemagno, Martina Cascone, Carlo Cardellini (CoI of the project), James Bradley, Margaret Cramm, Jacopo Pasotti, Enrico Maiero, Delia Segato, Riccardo Cerrato (Italian Acting Station Leader), Massimiliano Vardè, Ian Rudkin, Donato Giovannelli (Expedition Leader and PI of the project).
Support Science Party composition: Elena Manini (CoI of the project), Elisa Baldrighi, Mauro Mazzola, Angelina Cordone (CoI of the project), Stefano Caliro.
Geological and environmental settings
The sampling was performed in the Ny-Ålesund (Svalbard) area (Figure 1) that is located on the Brøggeralvøya on the SW shore of Kongsfjorden, in the northwestern part of Spitsbergen, Svalbard. The area sits on a plateau, surrounded by three main mountains, Zeppelinfjellet (556 m a.s.l.), Berteltoppen (785 m a.s.l.), and Scheteligfjellet (719 m a.s.l.) and by the glacial valleys of Austre-Vestre Brøggerbreen, Vestre Lovénbreen and Midtre Lovénbreen. The Paleocene sandstone, shales, conglomerates, and coal-rich sequence is overlaid by sedimentary rocks from the Middle Carboniferous-Early Triassic (Figure 2) (Van Everdingen, 1981). The bedrock sequences that include conglomerate, sandstone, dolomite, shale, chert, and limestone are involved in a NE-verging thrust fault and NNE-SSW high-angle faults, with closely spaced joints and fractures systems (Cianfarra & Salvini, 2016). The area is also interested by conspicuous moraine deposits and glacier forefield deposits, as Ny-Ålesund is surrounded by a large number of large ice streams, Kongsvegen, Kronebreen, Kongsbreen and Conwaybreen, and glaciers, like Austre Brøggerbreen, Vestre Brøggerbreen, Lovénbreen, Pedersbreen, Botnbreen and Midtre Lovénbreen. The Austre-Vestre Brøggerbreen and Vestre Lovénbreen glaciers melt waters converge in the Bayelva river, discharging directly in the Kingsfjord just NW of Ny-Ålesund.
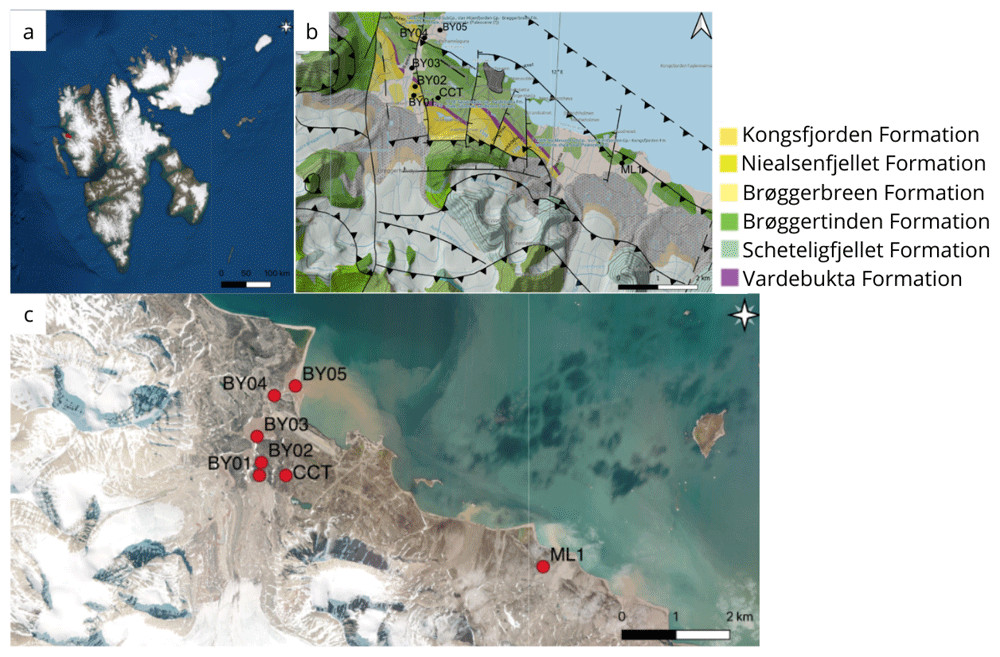
The Bayelva river is collated in two major glacier valleys that result from the recession of the Brøggerbreen during the present interglacial period (Sadiq et al., 2022). The sampling sites were either placed within moraine deposits or meltwater sedimentary deposits. A sixth site was sampled south-east of Ny-Ålesund, in the forefield of the polythermal valley glacier Midtre Lovénbreen, in an area more representative of the arctic tundra and external to the moraine fields, and close to a temporary year-round monitoring observatory (Cimpoiasu et al., 2024a; Cimpoiasu et al., 2024b). A permanent permafrost monitoring site has been active in proximity of site BY01 since 1998, reporting a yearly average temperature of -2.8 °C (Boike et al., 2018). The area is also monitored by the Italian eddy-covariance system hosted at the “Amundsen-Nobile Climate Change Tower” located eastward of BY01 and in close proximity to site CCT (Figure 1). The average temperature in the region in January ranges between -17.0 and -3.8 °C, while the mean July temperature ranges from 4.6 to 6.9 °C (Maturilli et al., 2012).
Sampling methods
Sediment collection and handling
The sampling was carried out along a transect that flanks the Bayelva river, with the exception of a site located in the forefield of the Midtre Lovénbreen glacier. (Table 1) The exact location of each site was decided in the field during the winter, and at times several attempts were made digging snow pits with the aim of finding areas of soil with minimal rock cover to allow for easy drilling of the permafrost. At each location a snowpit of about 2×3 m was dug to allow at least two people to work inside. The thickness of the snow removed to create the snowpit was recorded, and varied between 19 and 105 cm per site, although in some attempts up to 185 cm of snow were removed. Permafrost depth was also recorded at each site (Table 2).
Table 1. Site coordinates and soil temperatures.
| | | | Soil temperature | |
|---|
| SiteID | Site name | Latitude
(°N) | Longitude
(°E) | Expedition 1
@ 2 cm (°C) | Expedition 2
@ 2 cm (°C) | Expedition 3
@ 2 cm (°C) | Notes |
|---|
| BY1 | Bayelva 1 | 78.92102 | 11.83289 | -1.6 | 7.8 | 4.3 | Bayelva permafrost observatory
(Boike et al., 2018) |
| BY2 | Bayelva 2 | 78.92315 | 11.83403 | -3.4 | 5.8 | 4.9 | |
| BY3 | Bayelva 3 | 78.92743 | 11.82908 | -5.4 | 7.7 | 4.9 | |
| BY3A | Bayelva 3 | 78.92683 | 11.82886 | NA | 10.7 | 5.2 | |
| BY4 | Bayelva 4 | 78.93416 | 11.84456 | -2.8 | 9.2 | 2.7 | |
| BY5 | Bayelva 5 | 78.93651 | 11.85860 | -6.5 | 7.7 | 2.2 | |
| ML1 | Midtre
Lovénbreen 1 | 78.90833 | 12.08157 | -2.4 | 8 | 3.6 | ST. 3 form J Bradley
(QMUL, UK) |
| CCT | Climate
ChangeTower | 78.921367 | 11.865867 | NA | 8.1 | 5 | |
Table 2. Average depths of the active layer in the three expeditions for each site.
| | Active layer depth (cm) |
|---|
| SiteID | Site name | Expedition 1 | Expedition 2 | Expedition 3 |
|---|
| BY1 | Bayelva 1 | 0 | 30 | 35 |
| BY2 | Bayelva 2 | 0 | 20 | 26 |
| BY3 | Bayelva 3 | 0 | 5 | 20 |
| BY3A | Bayelva 3 | NA | 20 | 23 |
| BY4 | Bayelva 4 | 0 | 25 | 27 |
| BY5 | Bayelva 5 | 0 | 15 | 31 |
| ML1 | Midtre Lovénbreen 1 | 0 | 35 | 33 |
| CCT | Climate ChangeTower | NA | 40 | 40 |
Coring of the permafrost was performed using a portable driller (Shaw Drill Sondaj, https://backpackdrill.com) equipped with a 41 mm diameter core barrel and a diamond drill bit. At each site three independent boreholes were drilled (Figure 3, Table 3). The presence of rocks at depth prevented complete recovery of all the cores. Once the core was extracted from the ground, the low external temperature immediately froze the material, often preventing the recovery of the intact core. Hot water was used to warm the external surface of the core barrel to allow core recovery (Figure 4). The cores were extracted by placing it on a sterile housing for photographic documentation and length measurements and then transferred into sterile Whirl-Pak sample bags. Either continuous intact cores or multiple core sections were recovered from each borehole. Cores were preserved frozen at -20 °C and returned to the laboratory for further analysis.
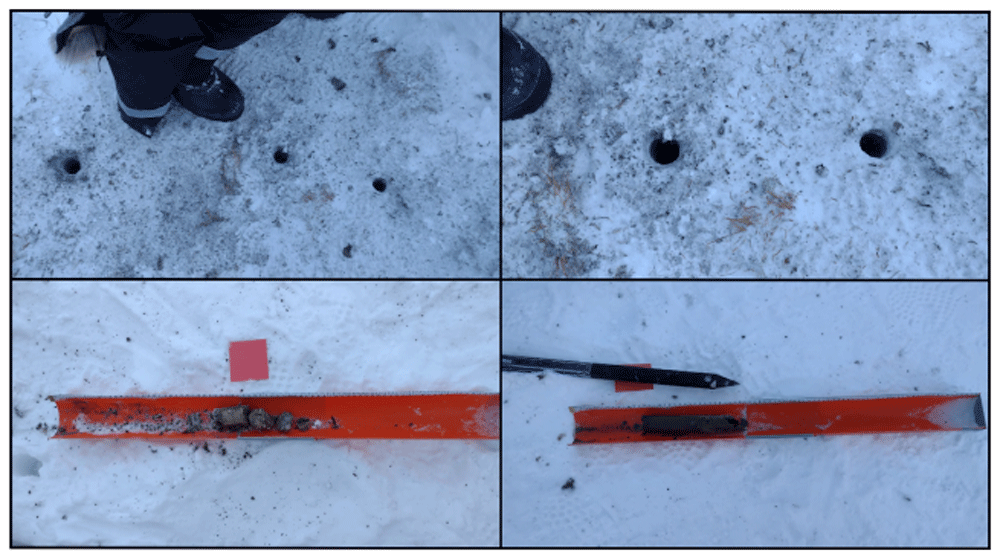
Figure 3. Panel showing snow pit and core operations.
Photograph taken by author FM for this publication.
Table 3. List of boreholes and recovered cores in the first expedition, February 2022.
| SiteID | Site name | CollectionID | Borehole | Drill depth (cm) | Core Recovery (%) |
|---|
| BY1 | Bayelva 1 | BY1220225 | a | 0–19 | 79 |
| BY1 | Bayelva 1 | BY1220225 | b | 0–12 | 20 |
| BY1 | Bayelva 1 | BY1220225 | b | 12–20 | 50 |
| BY1 | Bayelva 1 | BY1220225 | c | 0–19 | 68 |
| BY2 | Bayelva 2 | BY2220227 | a | 0–14 | 71 |
| BY2 | Bayelva 2 | BY2220227 | a | 14–25 | 145* |
| BY2 | Bayelva 2 | BY2220227 | b | 0–14 | 121* |
| BY2 | Bayelva 2 | BY2220227 | c | 0–17.5 | 91 |
| BY3 | Bayelva 3 | BY3220227 | a | 0–14 | 46 |
| BY3 | Bayelva 3 | BY3220227 | a | 14–19 | 140* |
| BY3 | Bayelva 3 | BY3220227 | b | 0–13 | NA |
| BY3 | Bayelva 3 | BY3220227 | c | 0–24 | NA |
| BY3 | Bayelva 3 | BY3220227 | c | 24–32 | 175** |
| BY4 | Bayelva 4 | BY4220228 | a | 0–15 | 87 |
| BY4 | Bayelva 4 | BY4220228 | a | 15–21 | 83 |
| BY4 | Bayelva 4 | BY4220228 | b | 0–11 | 54 |
| BY4 | Bayelva 4 | BY4220228 | c | 0–15 | 57 |
| BY5 | Bayelva 5 | BY5220228 | a | 0–10 | NA |
| BY5 | Bayelva 5 | BY5220228 | a | 10–23.5 | 111** |
| ML1 | Midtre Lovénbreen 1 | ML122031 | a | 0–17.5 | NA |
| ML1 | Midtre Lovénbreen 1 | ML122031 | a | 17.5–22 | NA |
| ML1 | Midtre Lovénbreen 1 | ML122031 | a | 22–27 | 130** |
| ML1 | Midtre Lovénbreen 1 | ML122031 | b | 0–11 | NA |
| ML1 | Midtre Lovénbreen 1 | ML122031 | b | 11–18 | 157** |
| ML1 | Midtre Lovénbreen 1 | ML122031 | c | 0–7.3 | NA |
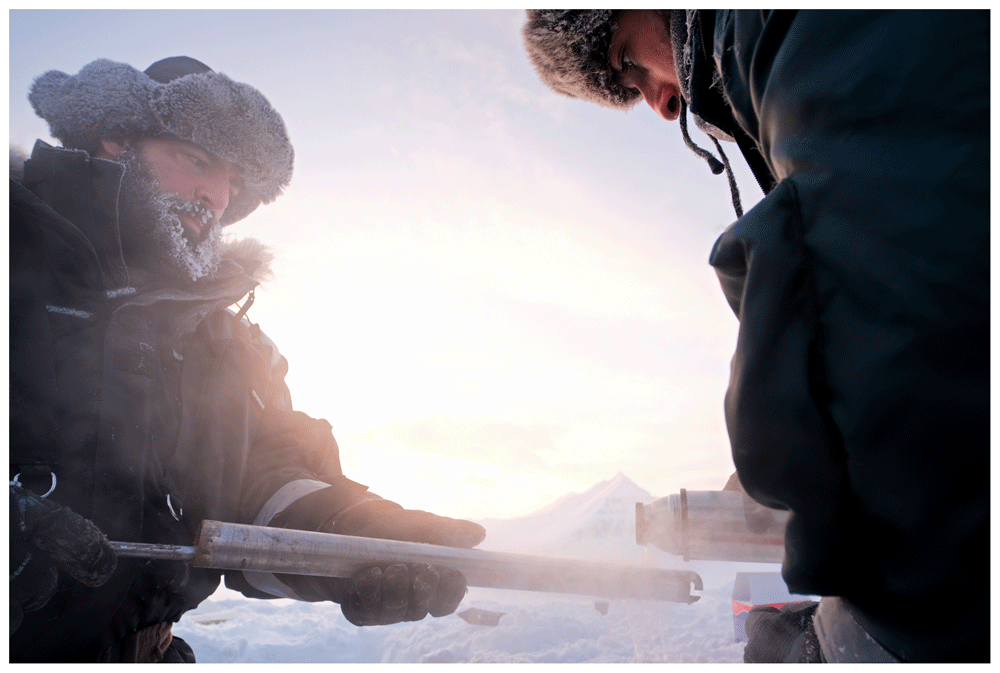
Figure 4. Given the low air temperatures, the cores were freezing inside the barrel expanding and hindering easy recovery.
Hot water was used to warm the external surface of the core barrel to allow for core extrusion. Photograph taken by a member of the first expedition JP for this publication.
During the summer, we revisited the sampling sites previously surveyed in winter, and added one additional location (Table 1). Utilizing shovels and hand tools, we excavated rectangular soil pits, consistently digging from one side to maintain an intact wall. This approach aimed to facilitate soil sampling without the risk of disturbance or mixing. The excavated pits, ranging from 20 to 40 cm in depth, provided a stratified profile for comprehensive analysis (Table 4 and Table 5). At various depths within the excavated pits, sediment samples were collected and subsequently preserved in Whirl-Pak bags (Figure 5). All sampled soils are classified as Gelisoil (IUSS Working Group WRB, 2022).
Table 4. List of sites and sampled depths in the second expedition, June 2022.
| SiteID | Site name | CollectionID | Depths sampled (cm) |
|---|
| BY1 | Bayelva 1 | BY1220614 | 0–5 / 10–15 / 20–30 |
| BY2 | Bayelva 2 | BY2220614 | 0–5 / 10–15 / 20–25 |
| BY3 | Bayelva 3 | BY3220614 | 0–5 |
| BY3A | Bayelva 3 | BY3A220614 | 0–5 / 10–15 / 20 |
| BY4 | Bayelva 4 | BY4220619 | 0–5 / 10–15 / 20–25 |
| BY5 | Bayelva 5 | BY5220619 | 0–5 / 10–15 |
| ML1 | Midtre Lovénbreen 1 | ML1220615 | 0–5 / 10–15 / 20–30 /
30–40 |
| CCT | Climate
Change Tower | CCT220618 | 0–5 / 10–15 / 20–30 /
30–35 |
Table 5. List of sites and sampled depths in the third expedition, September 2022.
| SiteID | Site name | CollectionID | Depths sampled (cm) |
|---|
| BY1 | Bayelva 1 | BY1220930 | 0–5 / 10–15 / 20–25 / 30–35 |
| BY2 | Bayelva 2 | BY220930 | 0–5 / 10–15 / 20–26 |
| BY3 | Bayelva 3 | BY3220930 | 0–5 / 10–15 / 20 |
| BY3A | Bayelva 3 | BY3A220930 | 0–5 / 10–15 / 20–23 |
| BY4 | Bayelva 4 | BY422103 | 0–5 / 10–15 / 20–27 |
| BY5 | Bayelva 5 | BY422103 | 0–5 / 10–15 / 20–25 / 30–31 |
| ML1 | Midtre Lovénbreen 1 | ML122101 | 0–5 / 10–15 / 20–25 / 30–35 / 40 |
| CCT | Climate Change Tower | CCT220930 | 0–5 / 10–15 / 20–25 / 30–33 |
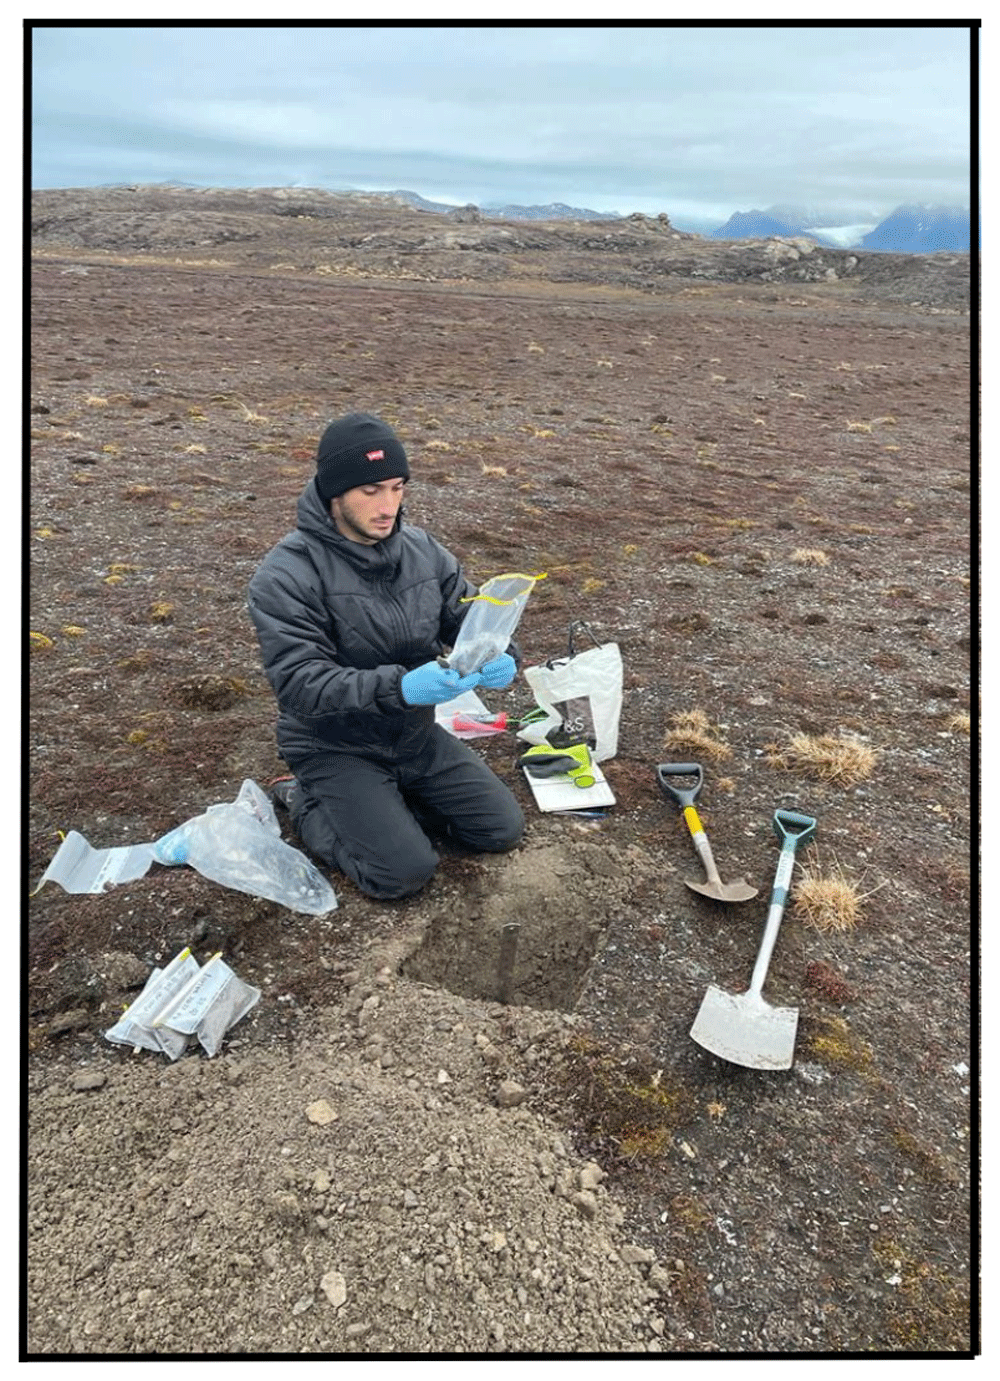
Figure 5. During the second and third expedition, the soil was collected and placed into a Whirl-Pak bag.
Photograph taken by a member of third expedition MC for this publication.
Gas flux measurements
The diffuse gas flux from the soil surface, and at some sites from the snow surface, was measured using the accumulation chamber method (Chiodini et al., 1998). Three different instrumentations were used. For the first expedition: 1) an in house built instrument by the University of Perugia, equipped with a LI-COR LI-820 Infra-Red detector (IR) for CO2 set in a range from 0 to 5,000 ppm, connected with an accumulation chamber of ~2.8 L volume; 2) a West System© instrument, equipped with a LI-COR 820 IR for CO2 set in a range from 0 to 20,000 ppm, with a Tunable Diode Laser Absorption Spectroscopy (TDLAS) detector for CH4 and an electrochemical sensor for H2S, connected with an accumulation chamber of ~2.8 L volume. For the second and the third expedition: 1) an in house built instrument by the University of Perugia, equipped with a LI-COR LI-820 Infra-Red detector (IR) for CO2 set in a range from 0 to 5,000 ppm, connected with an accumulation chamber of ~2.8 L volume; 2) a Thearen © instrument, equipped with a LI-COR 830 IR for CO2 set in a range from 0 to 20,000 ppm and a Tunable Diode Laser Absorption Spectroscopy (TDLAS) detector for CH4 connected with an accumulation chamber of ~3.6 L volume. For the first survey the gas flux measurements from the permafrost surface were carried out after removing the layer of snow and ice present above the permafrost, which was instead left undisturbed. Measurements were performed at the sites of permafrost coring and nearby the Italian Arctic station “Dirigibile Italia”, for comparison and instrumentation testing.
Gas samples collection
In the first expedition interstitial gas was sampled from the boreholes using a dedicated sampling probe (Figure 6a). The probe is made by an external body of plastic materials containing a stainless-steel capillary of about 3 mm of diameter. The probe is equipped with a series of 4 silicone gaskets at 2 cm from the bottom and every 15 cm, to allow the fitting of the probe to the drilled hole and preventing/limiting air contamination. The gas was collected in both 20 mL glass vials and pre-evacuated vacutainer for laboratory analyses of its chemical composition and of the isotopic composition of the carbon of CO2. The gas was collected after purging the line using a syringe connected to a 3-way valve (Figure 6b). In the other two expeditions where coring was not performed, a stainless steel probe of 5 mm of diameter was used to reach the desired depth in the soil and, in addition to vacutainer and glass vials, Tedlar and multi-layer foil gas sampling bags of 1 L were used to collect soil gas (Table 6, Table 7 and Table 8).
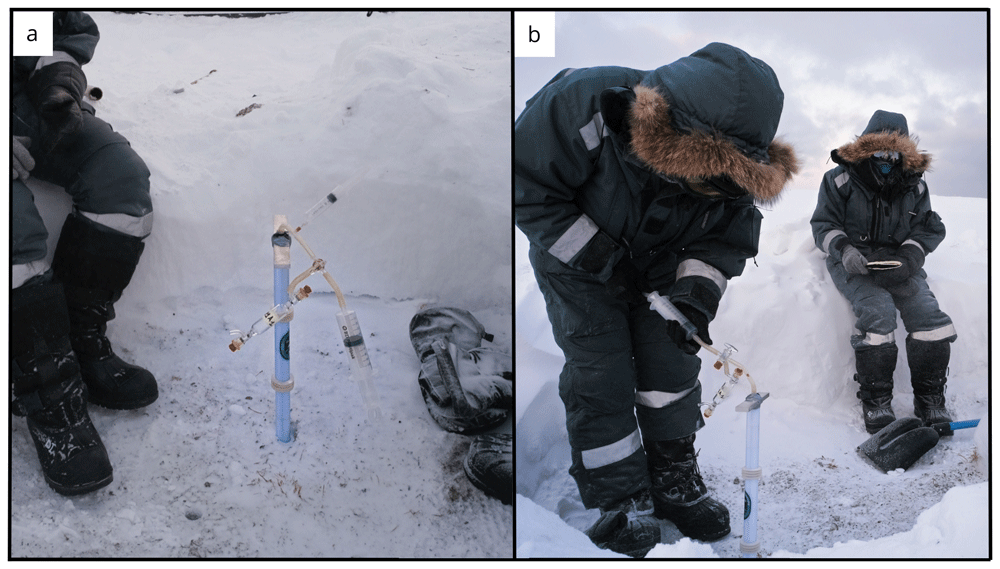
Figure 6. Permafrost borehole gas sampling apparatus.
(a) Detailed view of gas sampling probe designed for the project. Inside the plastic body is placed a 1/8 inch stainless steel capillary. (b) the sampling probe inserted into a borehole during gas sampling operations. Photographs taken by a member of the first expedition JP for this publication.
Table 6. List of collected gas samples for the first expedition, February 2022.
| SiteID | Site name | CollectionID | Borehole | Depth
(cm) | AC
sample | Glass
vial | Vacutainer | Notes |
|---|
| BY1 | Bayelva 1 | F1A | | | x | | x | |
| BY1 | Bayelva 1 | F1B | | | x | | x | |
| BY1 | Bayelva 1 | BY1A | a | 19 | | x | | |
| BY1 | Bayelva 1 | BY1B | a | 19 | | x | | |
| BY1 | Bayelva 1 | BY1A | a | 19 | | | x | |
| BY1 | Bayelva 1 | BY1B | a | 19 | | | x | |
| BY2 | Bayelva 2 | BY2A1 | a | 25 | | | x | |
| BY2 | Bayelva 2 | BY2A1 | a | 25 | | x | | |
| BY2 | Bayelva 2 | BY2A2 | b | 14 | | | x | |
| BY2 | Bayelva 2 | BY2A2 | b | 14 | | x | | |
| BY2 | Bayelva 2 | BY2F10 | | | x | | | |
| BY2 | Bayelva 2 | BY2F11 | | | x | | | |
| BY2 | Bayelva 2 | BY2F12 | | | x | | | bad sample |
| BY2 | Bayelva 2 | BY2F13 | | | x | | | |
| BY2 | Bayelva 2 | BY2F14 | | | x | | | |
| BY3 | Bayelva 3 | BY3A1 | | | | | x | |
| BY3 | Bayelva 3 | BY3A1 | | | | x | | |
| BY3 | Bayelva 3 | BY3F10 | a | 19 | x | | | |
| BY3 | Bayelva 3 | BY3F11 | a | 19 | x | | | |
| BY4 | Bayelva 4 | BY4A1 | a | 21 | | x | | |
| BY4 | Bayelva 4 | BY4A2 | a | 21 | | x | | |
| BY4 | Bayelva 4 | BY4A1 | a | 21 | | | x | |
| BY4 | Bayelva 4 | BY4A1-B | a | 21 | | | x | |
| BY4 | Bayelva 4 | BY4F1 | | | x | | | |
| BY4 | Bayelva 4 | BY4F4 | | | x | | | |
| BY5 | Bayelva 5 | BY5A1 | a | 23.5 | | | x | |
| BY5 | Bayelva 5 | BY5A1-B | a | 23.5 | | | x | |
| BY5 | Bayelva 5 | BY5A2 | a | 23.5 | | | x | |
| BY5 | Bayelva 5 | BY5A1 | a | 23.5 | | x | | |
| BY5 | Bayelva 5 | BY5A1-B | a | 23.5 | | x | | |
| BY5 | Bayelva 5 | BY5F1 | | | x | | x | On the snow |
| BY5 | Bayelva 5 | BY5F3 | | | x | | x | On the snow |
| BY5 | Bayelva 5 | BY5F4 | | | x | | x | On the snow |
| BY5 | Bayelva 5 | BY5F10 | | | x | | x | |
| BY5 | Bayelva 5 | BY5F11 | | | x | | x | |
| ML1 | Midtre
Lovénbreen 1 | J3F1 | | | x | | x | No Flux measure |
| ML1 | Midtre
Lovénbreen 1 | J3F2 | | | x | | x | No Flux measure |
| ML1 | Midtre
Lovénbreen 1 | J3F3 | | | x | | x | No Flux measure |
| ML1 | Midtre
Lovénbreen 1 | J3F4 | | | x | | x | No Flux measure |
| ML1 | Midtre
Lovénbreen 1 | J3F6 | | | x | | x | No Flux measure |
| ML1 | Midtre
Lovénbreen 1 | J3F7 | | | x | | x | No Flux measure |
| ML1 | Midtre
Lovénbreen 1 | J3F8 | | | x | | x | No Flux measure |
| ML1 | Midtre
Lovénbreen 1 | ML1A-1 | a | 17.5 | | x | | |
| ML1 | Midtre
Lovénbreen 1 | ML1A-1A | a | 17.5 | | | x | |
| ML1 | Midtre
Lovénbreen 1 | ML1A-1B | a | 17.5 | | | x | |
| ML1 | Midtre
Lovénbreen 1 | ML1A-2 | a | 22.0 | | x | | |
| ML1 | Midtre
Lovénbreen 1 | ML1A-2A | a | 22 | | | x | |
| ML1 | Midtre
Lovénbreen 1 | ML1A-3A | a | 27 | | x | | |
| ML1 | Midtre
Lovénbreen 1 | ML1A-3B | a | 27 | | x | | |
| ML1 | Midtre
Lovénbreen 1 | ML1A-3A | a | 27 | | | x | |
| ML1 | Midtre
Lovénbreen 1 | ML1A-3B | a | 27 | | | x | |
| ML1 | Midtre
Lovénbreen 1 | ML1F10 | | | x | | x | |
| ML1 | Midtre
Lovénbreen 1 | ML1F11 | | | x | | x | |
| ML1 | Midtre
Lovénbreen 1 | ML1F12 | | | x | | x | |
| ML1 | Midtre
Lovénbreen 1 | ML1F13 | | | x | | x | |
| BASE | Base 3 | BASEF1 | | | x | | | Ny-Ålesund base |
| BASE | Base 3 | BASEF2 | | | x | | | Ny-Ålesund base |
Table 7. List of collected gas samples for the second expedition, June 2022.
| SiteID | Site name | CollectionID | Depth
(cm) | AC
sample | Glass
vial | Vacutainer | Gas
bag | Notes |
|---|
| BY1 | | BY1B | 30 | | x | x | | water @40 cm |
| BY1 | Bayelva 1 | BY1B1 | 30 | | | x | | water @40 cm |
| BY1 | Bayelva 1 | BY1B2 | 30 | | | x | | water @40 cm |
| BY1 | Bayelva 1 | BY1A1 | 20 | | | | x | water @40 cm |
| BY1 | Bayelva 1 | BY1B | 30 | | | | x | water @40 cm |
| BY1 | Bayelva 1 | BY1F1 | | x | | x | | |
| BY1 | Bayelva 1 | BY1F3 | | x | | x | | |
| BY1 | Bayelva 1 | BY1F5 | | x | | x | | |
| BY1 | Bayelva 1 | BY1F2 | | x | | x | | |
| BY1 | Bayelva 1 | BY1F4 | | x | | x | | |
| BY1 | Bayelva 1 | BY1F6 | | x | | x | | |
| BY2 | Bayelva 2 | BY2A1 | 20 | | | x | | |
| BY2 | Bayelva 2 | BY2A2 | 20 | | | x | | |
| BY2 | Bayelva 2 | BY2 | 20 | | | | x | |
| BY3A | Bayelva 3A | BY3A1 | 20 | | | x | | wet soil |
| BY3A | Bayelva 3A | BY3A2 | 40 | | | x | | wet soil |
| BY3A | Bayelva 3A | BY3AF1 | | x | | x | | wet soil |
| BY3A | Bayelva 3A | BY3AF3 | | x | | x | | wet soil |
| BY3A | Bayelva 3A | BY3AF2 | | x | | x | | wet soil |
| BY3A | Bayelva 3A | BY3AF4 | | x | | x | | |
| BY4 | Bayelva 4 | BY4A1 | 40 | | | x | | |
| BY4 | Bayelva 4 | BY4A2 | 40 | | | x | | |
| BY4 | Bayelva 4 | BY4A | 40 | | x | | x | |
| BY4 | Bayelva 4 | BY4B1 | 20 | | | x | | |
| BY4 | Bayelva 4 | BY4B2 | 20 | | | x | | |
| BY4 | Bayelva 4 | BY4B3 | 20 | | | x | | |
| BY4 | Bayelva 4 | BY4B | 20 | | x | | x | |
| BY4 | Bayelva 4 | BY4F1 | | x | | x | | |
| BY4 | Bayelva 4 | BY4F2 | | x | | x | | |
| BY4 | Bayelva 4 | BY4F3 | | x | | x | | |
| BY4 | Bayelva 4 | BY4F4 | | x | | x | | |
| BY5 | Bayelva 4 | BY5A | 40 | | | x | | |
| BY5 | Bayelva 4 | BY5B | 40 | | | x | | |
| BY5 | Bayelva 4 | BY5 | 40 | | x | | x | |
| BY5 | Bayelva 4 | BY5F | | x | | | | |
| BY5 | Bayelva 4 | BY5F11 | | x | | | | |
| ML1 | Midtre
Lovénbreen 1 | ML1A1 | 30 | | | x | | water @>30cm |
| ML1 | Midtre
Lovénbreen 1 | ML1A2 | 30 | | | x | | water @>30cm |
| ML1 | Midtre
Lovénbreen 1 | ML1A1 | 30 | | x | | x | water @>30cm |
| ML1 | Midtre
Lovénbreen 1 | ML1F1 | | x | | | | |
| ML1 | Midtre
Lovénbreen 1 | ML1F2 | | x | | | | |
| ML1 | Midtre
Lovénbreen 1 | ML1F3 | | x | | | | |
| M1L | Midtre
Lovénbreen 1 | ML1F4 | | x | | | | |
| CCT | Climate Change Tower | CCT1A1 | 40 | | | x | | |
| CCT | Climate Change Tower | CCT1A2 | 40 | | | x | | |
| CCT | Climate Change Tower | CCT1A | 40 | | x | | x | |
| CCT | Climate Change Tower | CCT1B1 | 20 | | | x | | |
| CCT | Climate Change Tower | CCT1B2 | 20 | | | x | | |
| CCT | Climate Change Tower | CCT1B | 20 | | x | | x | |
| CCT | Climate Change Tower | CCT1F1 | | x | | | | |
| CCT | Climate Change Tower | CCT1F2 | | x | | | | |
Table 8. List of collected gas samples for the third expedition, October 2022.
| SiteID | Site name | CollectionID | Depth (cm) | AC sample | Glass vial | Vacutainer | Gas bag | Notes |
|---|
| BY1 | | BY1A | 40 | | | x | | |
| BY1 | | BY1A | 40 | | | x | | |
| BY1 | | BY1A | 40 | | x | | x | |
| BY1 | | BY1B | 20 | | | x | | |
| BY1 | | BY1B | 20 | | | x | | |
| BY1 | | BY1B | 20 | | x | | x | |
| BY1 | | F7 | | x | | | | |
| BY1 | | F8 | | x | | | | |
| BY1 | | F9 | | x | | | | |
| BY1 | | F10 | | x | | | | |
| BY1 | | F11 | | x | | | | |
| BY1 | | F12 | | x | | | | |
| BY2 | | BY2A | 20 | | | x | | water @40 cm |
| BY2 | | BY2B | 20 | | | x | | water @40 cm |
| BY2 | | BY2A | 20 | | x | | x | water @40 cm |
| BY2 | | F13 | | x | | | | |
| BY2 | | F14 | | x | | | | |
| BY2 | | F15 | | x | | | | |
| BY2 | | F16 | | x | | | | |
| BY3A | | BY3AA | 40 | | | x | | |
| BY3A | | BY3AA | 40 | | | x | | |
| BY3A | | BY3AA1 | 40 | | | x | | |
| BY3A | | BY3AA2 | 40 | | | x | | |
| BY3A | | BY3AA | 40 | | x | | x | |
| BY3A | | BY3AB | 20 | | | x | | |
| BY3A | | BY3AB | 20 | | | x | | |
| BY3A | | BY3AB | 20 | | x | | x | |
| BY3A | | F17 | | x | | | | |
| BY3A | | F18 | | x | | | | |
| BY3A | | F19 | | x | | | | |
| BY3A | | F20 | | x | | | | |
| BY4 | | BY4A1 | 40 | | | x | | |
| BY4 | | BY4A2 | 40 | | | x | | |
| BY4 | | BY4A | 40 | | x | | x | |
| BY4 | | BY4B1 | 20 | | | x | | |
| BY4 | | BY4B2 | 20 | | | x | | |
| BY4 | | BY4B | 20 | | x | | x | |
| BY4 | | F21 | | x | | | | |
| BY4 | | F22 | | x | | | | |
| BY4 | | F23 | | x | | | | |
| BY4 | | F24 | | x | | | | |
| BY4 | | F25 | | x | | | | |
| BY4 | | F26 | | x | | | | |
| BY5 | | BY5A1 | 40 | | | x | | |
| BY5 | | BY5A2 | 40 | | | x | | |
| BY5 | | BY5A | 40 | | x | | x | |
| BY5 | | BY5B1 | 20 | | | x | | |
| BY5 | | BY5B2 | 20 | | | x | | |
| BY5 | | BY5B | 20 | | x | | x | |
| CCT | | CCT1A | 40 | | | x | | |
| CCT | | CCT1A | 40 | | x | | x | |
| CCT | | CCT1B | 20 | | | x | | |
| CCT | | CCT1B | 20 | | x | | x | |
| CCT | | F1 | | x | | | | |
| CCT | | F2 | | x | | | | |
| CCT | | F3 | | x | | | | |
| CCT | | F4 | | x | | | | |
| CCT | | F5 | | x | | | | |
| CCT | | F6 | | x | | | | |
| ML | | ML1A1 | 40 | | | x | | |
| ML | | ML1A2 | 40 | | | x | | |
| ML | | ML1A | 40 | | x | | x | |
| ML | | ML1B1 | 20 | | | x | | |
| ML | | ML1B2 | 20 | | | x | | |
| ML | | ML1B | 20 | | x | | x | |
| ML | | FML1 | | x | | | | |
| ML | | FML2 | | x | | | | |
| ML | | FML3 | | x | | | | |
| ML | | FML4 | | x | | | | |
| ML | | FML5 | | x | | | | |
| ML | | FML6 | | x | | | | |
| SUN2 | | SUN2A | 40 | | | x | | |
| SUN2 | | SUN2A | 40 | | | | x | |
| SUN2 | | SUN2B | 20 | | | x | | |
| SUN2 | | F1SUN | | x | | | | |
| SUN2 | | F2SUN | | x | | | | |
| SUN2 | | F3SUN | | x | | | | |
| SUN2 | | F4SUN | | x | | | | |
To characterize the isotopic composition of the carbon of CO2 released by the permafrost surface, the gas accumulating in the accumulation chamber was sampled using two pre-evacuated vacutainers, one taken at the begin of the measurement and the other after some time, i.e., at higher CO2 concentration. The time lapse between the two samples depends on the CO2 flux, in order to ensure a significant difference in CO2 concentration between the two samples (Chiodini et al., 2008).
Sites and samples log
Details on the sampling locations are given in Table 1 and the underlying data (Montemagno et al., 2024). The complete list of boreholes, pit and recovered cores and gas samples retrieved on the different expeditions are reported in Table 3, Table 4, Table 5 and Table 6. Soil in the selected areas consisted mainly of silty-clay with interspersed stones of various nature. Soil density was previously reported in this area with values of 1.70×10³ kg m-3 and porosities varying from 0.36 to 0.5 (Roth & Boike, 2001).
Site 1 - Bayelva 1 (BY1)
The Bayelva 1 site (78.921000 °N, 11.832895 °E) is located in close proximity to the German Alfred Wegener Institute for Polar and Marine Research and the French Polar Institute Paul-Émile Victor (AWIPEV) Bayelva Permafrost monitoring site (Roth & Boike, 2001). The location is on the top of a moraine hill on the right bank of the Bayelva river.
The first sampling was performed during the winter season on February 24th 2022. At the time of this sampling, the site was covered by 60–70 cm of snow containing a few frozen layers on the top half of the snow cover. A snow pit of 2×2 m was dug to access the soil surface. The surface CO2 and CH4 fluxes were measured as described in the field protocols on the undisturbed surface of the permafrost. Additional measurements were made after removing the musk cover. Gas samples from the accumulation chamber were sampled at one site inside the pit. On February 24th 2022 we were unable to drill due to a malfunction of the portable core drill. On February 25th 2022 we returned to the site and successfully completed the sampling. The snow pit was cleaned up before starting drilling operations. The obtained cores were mainly composed of fine-grained particles (silt and small rock debris). A total of 3 boreholes were drilled (Table 3), with recoveries ranging from 20 % to 79 %. Soil gasses were sampled from borehole a, at the bottom, to assess the composition and isotopic signature of CO2. On March 5th 2022 surface CO2 and CH4 flux measurements were performed over the snow at several points in the area of the snow pit.
On the 14th of June 2022, we started performing the second sampling. Due to the warmer temperatures, the absence of snow allowed us to choose the best spot near the site sampled in February. We made a soil pit of 40×45 cm (Figure 7a) with a depth of 30 cm using a shovel; the surface soil temperature was 7.8 °C (Table 1). The site was characterized by clayey soil. We took samples of soil at 3 different depths (Table 4). In this season the soil was saturated with meltwater, and liquid water was present in the soil pit. For this reason, we collected, together with the usual samples, water samples. We took three sterivex filters (0.22 μm) after having filtered 360 mL of water for each one of them. We also collected two 50 mL falcons of filtered water and a 10 mL vial. Soil gas samples were collected using the stainless steel probe inserted into the soil next to the pit. Soil CO2 and CH4 flux measurements were performed at several points in the area of the pit. At several locations around the pit gas samples from the accumulation chamber were also collected. During the sampling of this site on the second expedition, we also collected approximately 1 kg of sediment near our soil pit to conduct a microcosm experiment to track the release of greenhouse gasses by the microbial community.
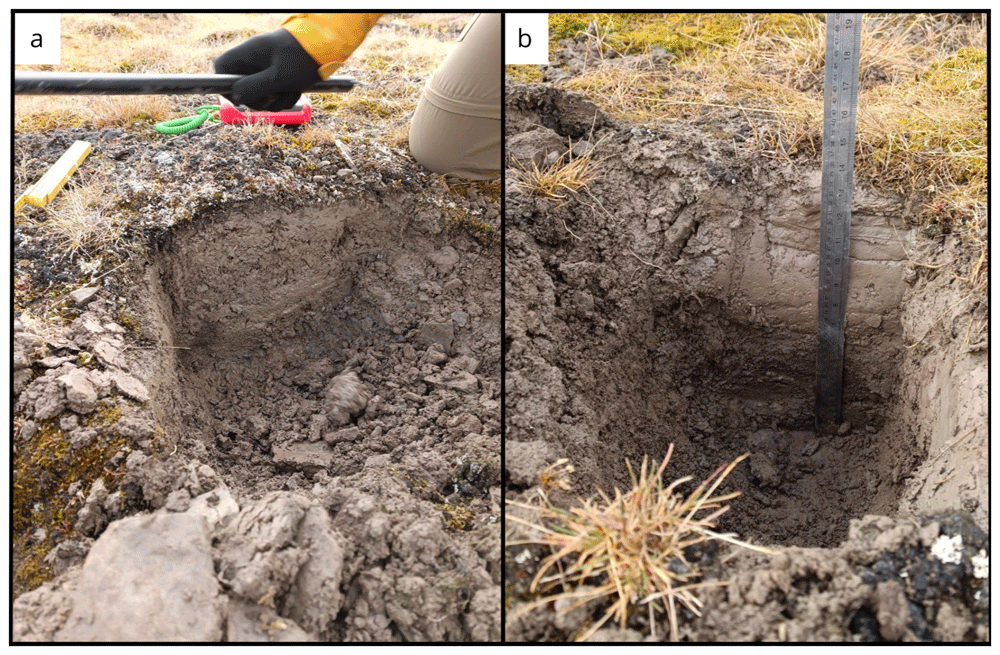
Figure 7.
Site BY1 (a) in June, after digging 30 cm of soil. In (b) September we reach 35 cm of depth. Obviously without snow it was an easier sampling. Photographs taken by a member of the second expedition FM for this publication.
The third and last sampling was performed on the 30th of September 2022. At this time, there was no liquid water in the area and the tundra was mostly dry. We collected soil samples at three depths (Table 5). The soil was still thawed, and we proceeded as the second sampling, avoiding the use of the drill. Soil gas samples were collected using the stainless steel probe inserted into the soil next to the sediment sampling point. Soil CO2 and CH4 flux measurements were measured at several locations in the area of the sampling point. At several locations, gas samples from the accumulation chamber were also collected.
Site 2 - Bayelva 2 (BY2)
The Bayelva 2 site (78.92315 °N, 11.83403 °E) is located 232 m northward from Bayelva 1 site, and it is the second site of a transect that follows the Bayelva river and goes from the main river watershed to the sea. The site is located on a flat area on the right bank of the Bayelva river and is surrounded by two main moraine hills (Kolhaugen and Leirhaugen) (Figure 8a). At the time of sampling, the site was covered by 80–90 cm of snow containing a few frozen layers on the top half of the snow cover. On February 27th 2022 a snow pit of 2×2 m was dug, and a total of 3 boreholes were drilled (Table 3). The obtained cores were mainly composed of fine-grained particles (silt and small rock debris), with recoveries ranging from 71 % to 145 %. Soil gasses were sampled from boreholes a and b inserting the probe up to the hole bottom. The surface CO2 and CH4 fluxes were measured as described before inside the pit and at one location gas samples from the accumulation chamber were sampled. CO2 and CH4 fluxes measurements from the snow surface were performed on March 5th 2022.
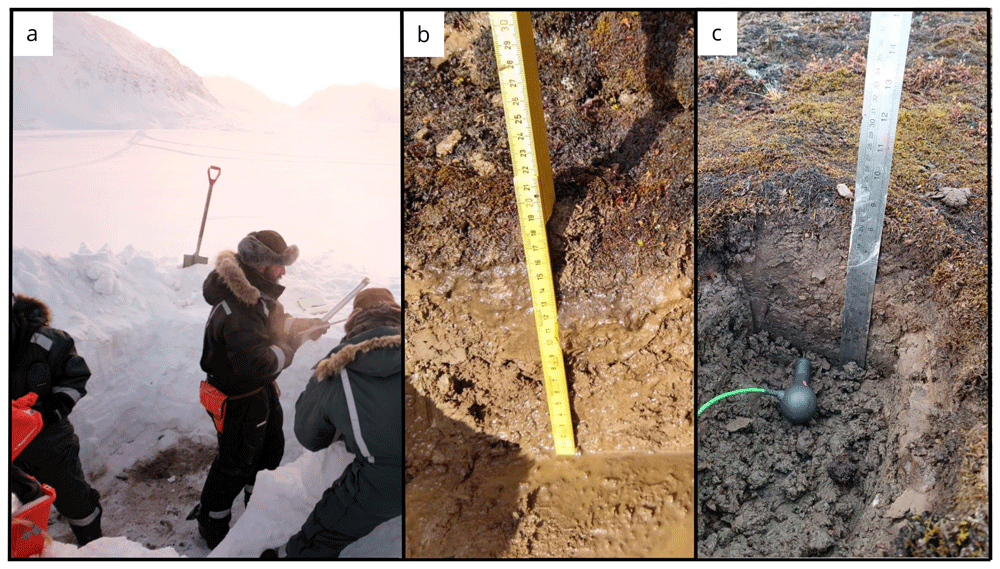
Figure 8.
(a) Midday at the site Bayelva BY2 before starting the gas flux measurements during the first expedition. (b) In the second expedition we observed that the area of our site was covered with rocks, and the terrain was saturated with water. (c) In September, there was significantly less water and we were able to excavate to a greater depth. Photographs taken by members of the first expedition JP and FM for this publication.
We sampled the BY2 site for the second time on June 14th 2022 (Table 2). We made a 35×40 cm pit that had a surface temperature of 5.8 °C and was 25 cm in depth (Figure 8b). We collected samples at three depths (Table 4). During this time of the year, we did not find snow and the sediment we collected was gravelly.
On 30th September 2022 during the third expedition we took the same number of samples in this site (Figure 8c, Table 3 and Table 5). The surface temperature was 4.9 °C.
In both the second and third expedition soil gas samples were collected using the stainless steel probe inserted into the soil in the proximity to the soil pit, and soil CO2 and CH4 flux measurements were performed in the area of the pit and gas samples from the accumulation chamber were collected at several flux measuring points (Table 6, Table 7 and Table 8)
Site 3 - Bayelva 3 (BY3)
The Bayelva 3 site (78.92743 °N, 11.82908 °E) is located 492 m northward from the previous site, Bayelva 2, following the transect direction towards the sea. The site is located in the floodplain area of the Bayelva river (Figure 9a). At the time of sampling, the site was covered by 100–105 cm of snow containing a few frozen layers on the top half of the snow cover. A 2×2 m snow pit was dug on February 27th 2022. Three boreholes were drilled (Table 2), with recoveries ranging from 46 % to 175 %. The obtained cores were mainly composed of fine-grained particles (silt and small rock debris).
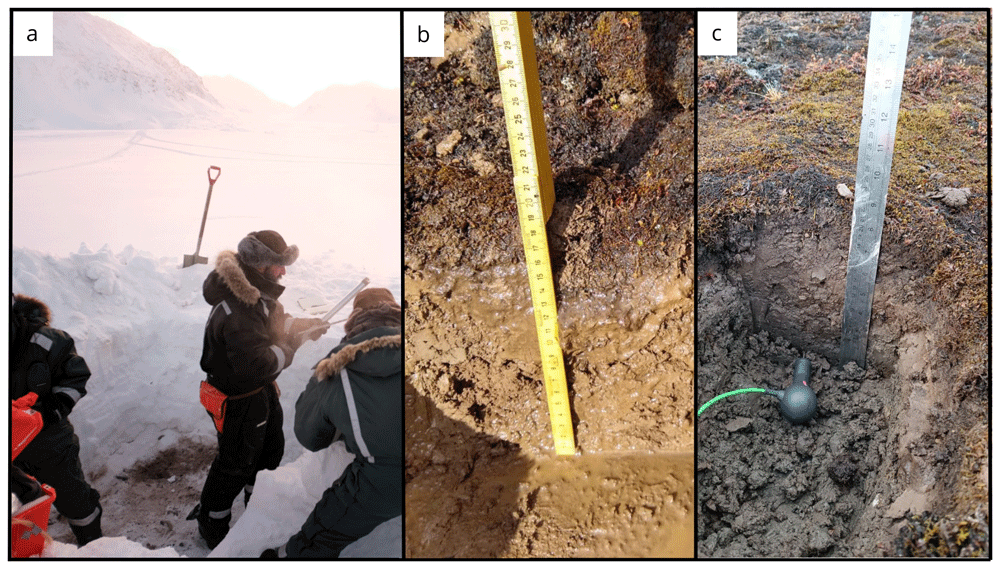
Figure 9.
(a) Core extrusion operations at site Bayelva BY3 in February. (b) In June, the site BY3 was located close to the river banks and, as a result, the soil was filled with sand and water. To address this issue, we relocated BY3 (BY3A) to sample the soil. In September (c) samples were collected from both sites (BY3 and BY3A). Photographs taken by members of the first expedition JP and FM for this publication.
Soil gasses were sampled from the borehole a bottom. The surface CO2 and CH4 fluxes were measured as described before leaving the permafrost undisturbed and at one location gas samples from the accumulation chamber were collected. The surface CO2 and CH4 fluxes measurements from the snow surface were performed on March 5th 2022.
We sampled this site for the second time on 14th June 2022. Once on site, we observed that the melt river flowed very close to the original BY3 location and the soil was rich in water. We sampled a single depth at this location characterized by silt and sand and relocated for sampling on the river embankment where we made a second pit BY3A (78.926336 °N, 11.826033 °E) (Figure 9b). From this 40×45 cm pit we took samples from three depths. We also sampled river waters for microbiological and geochemical analyses. Near the BY3A site, we also collected approximately 1 kg of sediment during the second expedition, as we did near BY1 during the same expedition.
On 30th September 2022 we repeated the sampling for the third time (Figure 9c). We took soil samples at one depth in BY3 and at three depths in BY3A, and we also collected fluid samples from the river. We also took three sterivex filters (0.22 μm) after having filtered 360 mL of water for each one of them.
In June and September 2022 soil gas sampling, CO2 flux and CH4 flux measurements were performed at BY3A and its surrounding. Soil gas samples were collected using the stainless steel probe inserted into the soil. Gas samples from the accumulation chamber were collected at several flux measuring points.
Site 4 - Bayelva 4 (BY4)
The Bayelva 4 site (78.93435 °N, 11.84205 °E) is located 825 m NNE from the previous site, Bayelva 3, and it is located on the riverbank of the Bayelva, close to the river’s delta. This site was sampled on February 28th 2022. At the time of sampling, the site was covered by 19 cm of snow, without any frozen layer, and a 2×2 m snow pit was dug. Before reaching this site, two other sites were inspected, but rock and ice layers did not allow for drilling. Moving closer to the riverbank allowed us to find a better spot for the drilling. The surface CO2 and CH4 fluxes were measured as described before leaving the permafrost undisturbed. Three boreholes were drilled (Table 3), with recoveries ranging from 54 % to 87 %. Soil gasses were sampled from borehole a to assess both composition and isotopic signature. The obtained cores were mainly composed of fine grained particles (silt and small rock debris). The surface CO2 and CH4 fluxes measurements from the snow surface were performed on March 5th 2022.
The second sampling of this site, during the summer campaign, was programmed on the 16th June 2022. The presence of polar bears nearby the site made us postpone the sampling up to the 19th June 2022. The surface soil temperature was 9.2 °C and we took three soil samples from the 40×40 cm soil pit. During the third expedition, we collected three soil samples from different depths on October 3th 2022 (Figure 10). River water at this site was sampled during the September expedition for microbiological and geochemical analyses. River water temperature was 1.7 °C. We took three sterivex filters (0.22 μm) after having filtered 180 mL of water for each one of them.
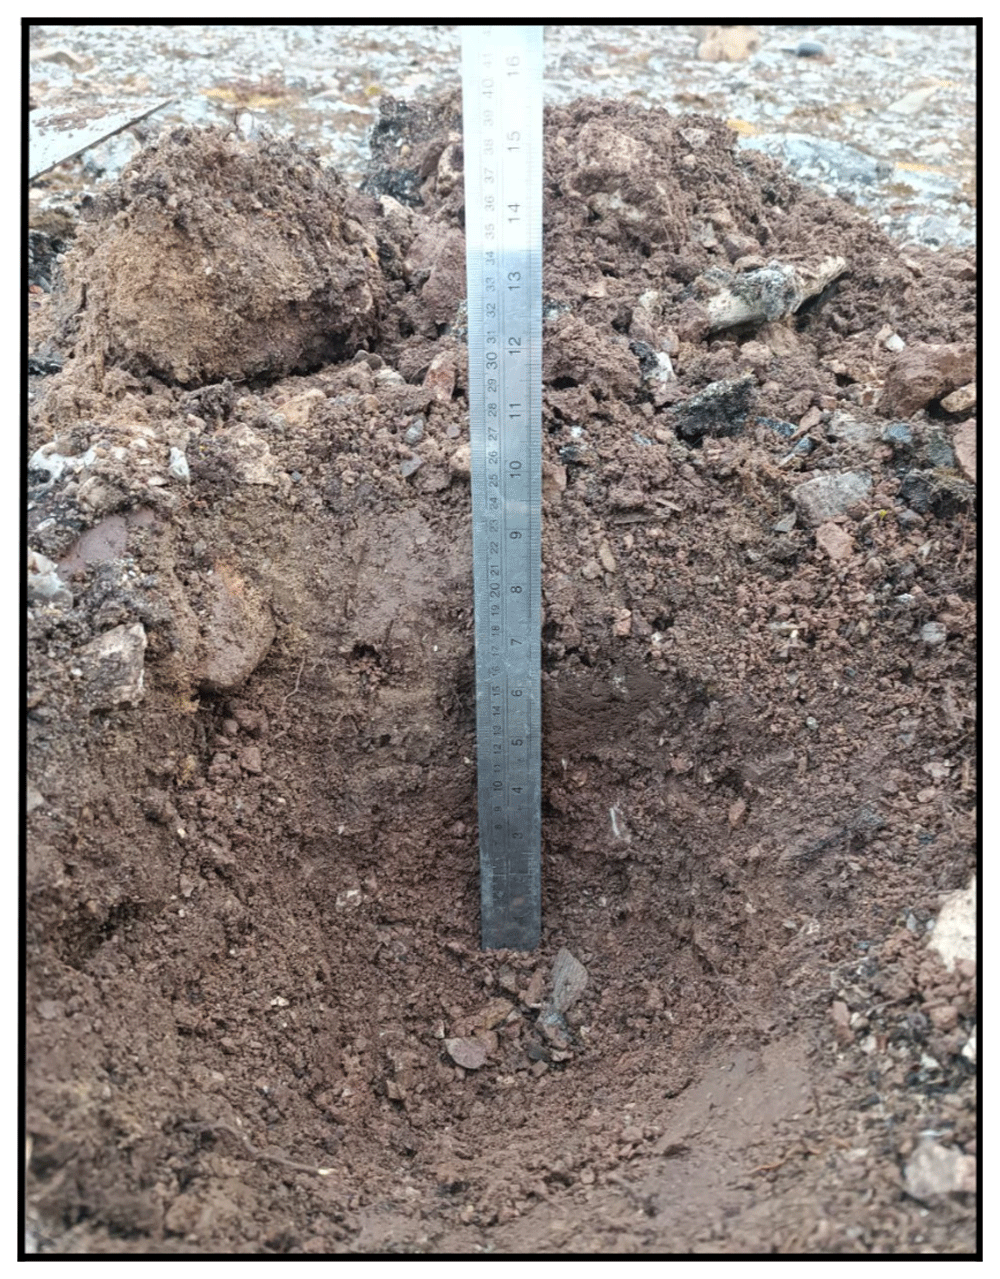
Figure 10. The BY4 site during the last expedition, 27 cm of depth was reached (Table 4).
Photograph taken by members of the third expedition FM for this publication.
In June and October 2022 campaigns soil gas samples were collected using the stainless steel probe inserted into the soil, CO2 flux and CH4 flux measurements were performed at several points and gas samples from the accumulation chamber were collected at several flux measuring points.
Site 5 - Bayelva 5 (BY5)
The Bayelva 5 site (78.93613 °N, 11.85982 °E) is located 434 m ENE from the previous site, Bayelva 4, and it is located in the Bayelva river’s delta. At the time of sampling, the site was covered by 48.5 cm of snow and 20 cm of ice. The site was sampled on February 28th 2022, and a 1×1 m snow pit was dug. The surface CO2 and CH4 fluxes were measured as described before, leaving the permafrost undisturbed. In this site, because of the large amount of rocks and ice, we were able to drill a single borehole (Table 3), with a recovery of 111 %. Soil gasses were sampled from the borehole to assess both composition and isotopic signature. The obtained core was mainly composed of fine grained particles (silt and small rock debris). The snow surface CO2 and CH4 flux measurements were repeated on March 5th 2022.
In the summer BY5 was sampled on June 19th 2022 in a location closest to the sea and in close proximity with the winter site. We collected soil samples at two depths and sampled water in the proximity of the soil pit. Soil surface temperature was 7.7 °C.
On the third expedition in September 2022 we sampled four different depths in the BY5 site and we also sampled the water river that had a temperature of 1.7 °C. The sampled location was approximately 30 m away from the previous location due to a change in the river course compared to June 2022 (Figure 11).
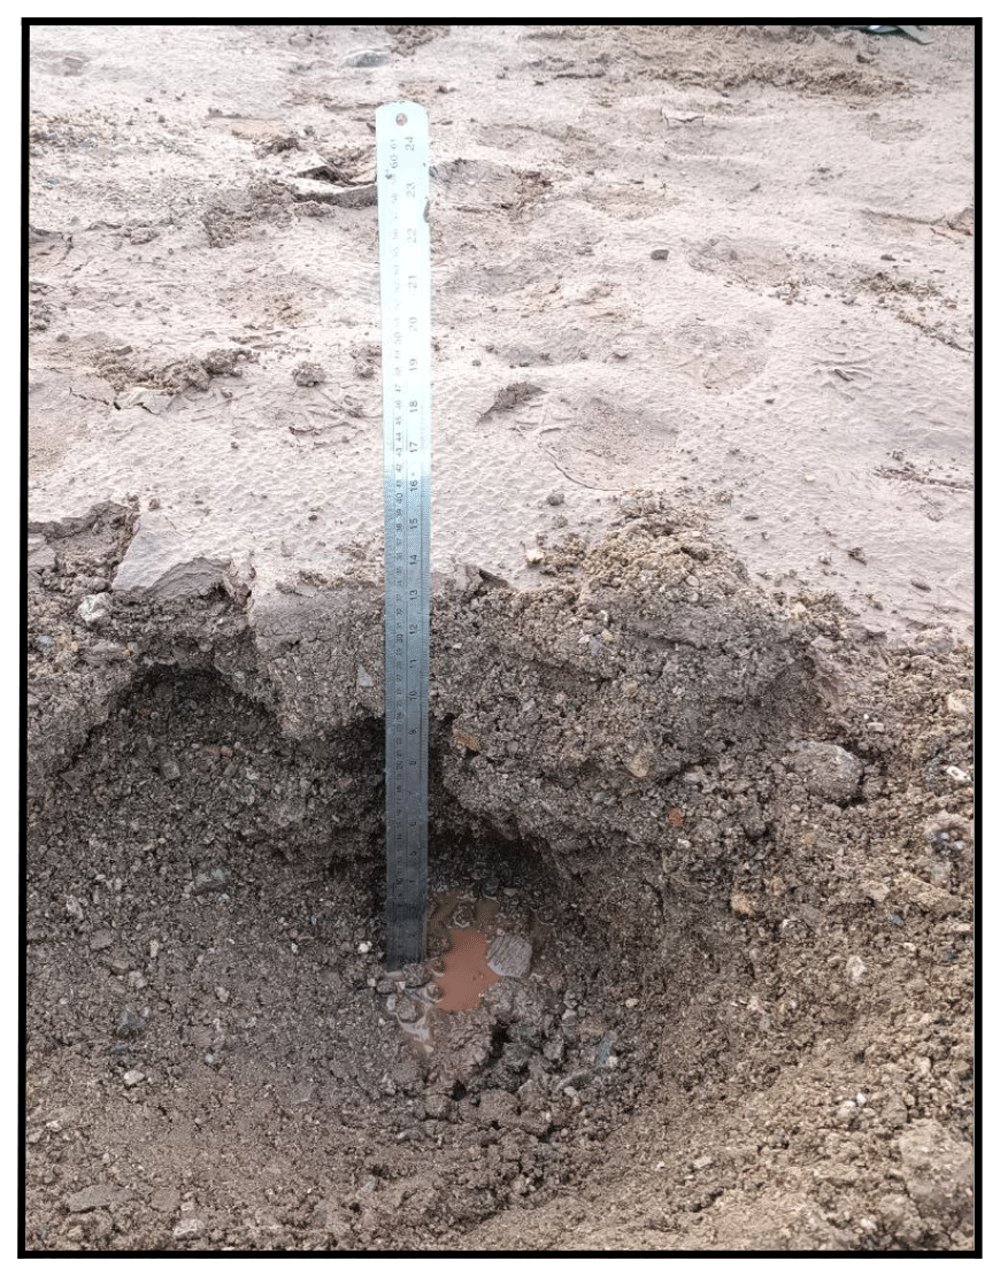
Figure 11. The BY5 site during the September expedition (Table 4).
Photograph taken by members of the third expedition FM for this publication.
In June and September 2022 sampling campaigns soil gas samples were collected using the stainless steel probe inserted into the soil, CO2 flux and CH4 flux measurements were performed at several points and gas samples from the accumulation chamber were collected at several flux measuring points.
Site 6 - Midtre Lovénbreen 1 (ML1)
The Midtre Lovénbreen 1 site (78.90833 °N, 12.08157 °E) is located in a plain in front of the glacier Midtre Lovénbreen between the two main melt channels. This site was chosen as more representative of tundra soils and devoid of moraine deposits, unlike previous sites where rocks were often found. The ML1 site was sampled two times in the first expedition, the first on March 1st 2022 and the second on March 3rd 2022. On the first day of sampling a 2×2 m snow pit was dug and three boreholes were drilled (Table 3), with recoveries ranging from 130 % to 157 %. The obtained cores were mainly composed of fine grained particles (silt and small rock debris). Soil gasses were sampled from borehole a to assess both composition and isotopic signature. During the first day, radio silence imposed for the Ny-Ålesund area due to ongoing radiometric measurements at the local station did not allow for the use of the bluetooth device for the measurement of CO2, CH4 and H2S fluxes. On the second sampling, two 1×1 m snow pits were dug to measure the surface CO2, CH4 and H2S fluxes leaving the permafrost undisturbed.
During the second expedition in June we sampled soil at four different depths and sampled water from a pool near our site (Figure 12a). The soil surface temperature was 8 °C.
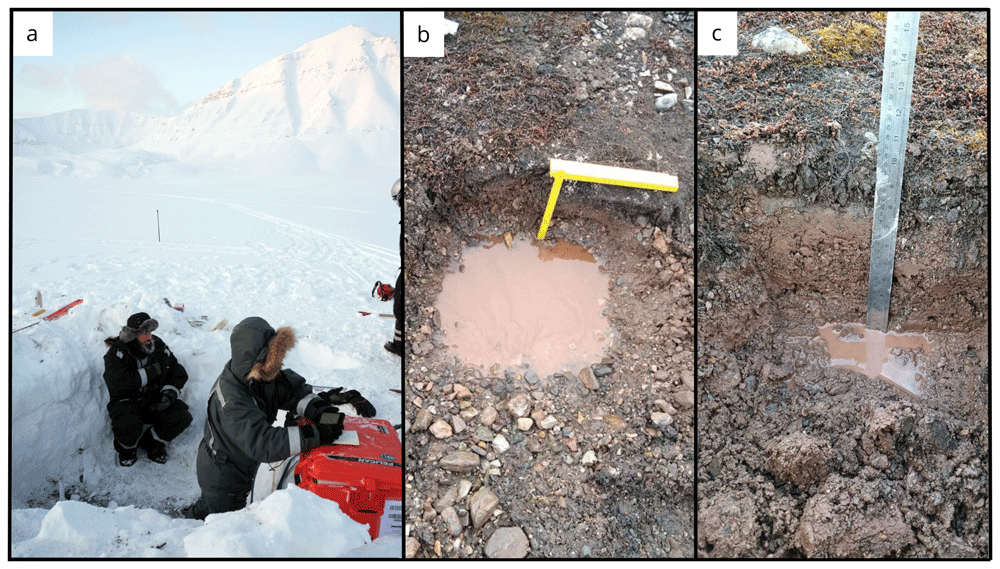
Figure 12.
(a) In June, the soil exhibited a high moisture content, as evidenced by the imagery from site ML1. (b) However, by September, the water content had significantly decreased. (c) During our most recent expedition, we were able to locate the boreholes created using the drilling equipment during the winter season. Flare gun used for scale. Photographs taken by a member of the second and third expedition FM for this publication.
Water was absent during the third expedition and soil samples were collected at five different depths (Figure 12b). The soil surface temperature was 4.3 °C.
In June and September 2022 sampling campaigns soil gas samples were collected using the stainless steel probe inserted into the soil, CO2 flux and CH4 flux measurements were performed at several points and gas samples from the accumulation chamber were collected at several flux measuring points.
Site 7 - Climate Change Tower (CCT)
The CCT site (78.921367 °N 11.865867 °E) is in close proximity to the Climate Change Tower (CCT). The location is on the top of a moraine hill, overlooking the Bayelva river valley and the Bayelva permafrost observatory. This site was added during the June expedition due to the presence of polar bears near Bayelva sites BY4 and BY5. In the first sampling activity of this site, during the June expedition, we made a hole of 35 cm depth (Figure 13a). We took samples from four different depths. In the third expedition instead, we reached 33 cm of depth (Figure 13b) and collected samples at four different depths.
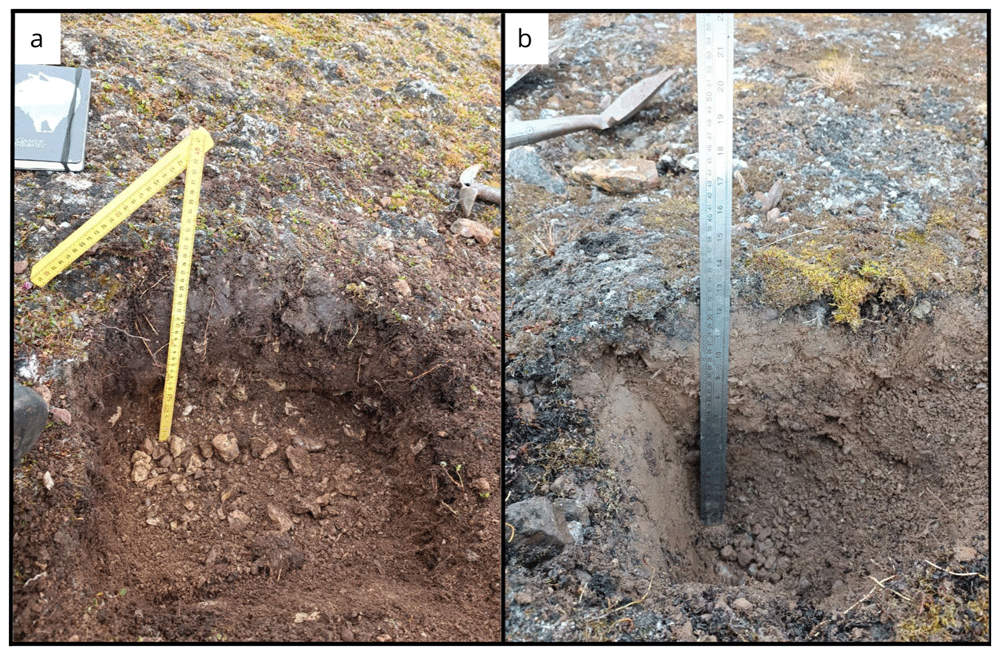
Figure 13.
Site CCT near the Climate Change Tower in (a) October and (b) June. Photographs taken by a member of the second and third expedition FM for this publication.
Conclusion
The three expeditions collected coupled gas geochemistry, soil geochemistry and microbiological samples from 7 sites representative of the different conditions found in the area around Ny-Ålesund, Svalbard. The data obtained will present a clear picture of the coupling between microbiological and gas geochemistry during the seasonal melting cycle of the active layer. These data, coupled with the results of the incubation experiments carried out during the second expedition, represent a significant opportunity to characterize in detail the geo-microbiological response to active layer thaw in the high arctic.









