Introduction
The Maltese Islands, situated in the heart of the Central Mediterranean, are characterised by a distinct climate with hot, dry summers and mild, wet winters. The climate of the Maltese Islands, shaped by its geographic location and proximity to the North African coast, has a history of scientific investigation (England et al., 2010; Jahan et al., 2022; Wadsworth, 1928). Notably, local research (Azzopardi, 2016; Galdies, 2010; Galdies, 2011; Galdies, 2012; Galdies, 2022; Hyde, 1955) has shed light on various aspects of Maltese climate. These studies contribute to a foundation of knowledge and understanding of the Maltese climate.
According to data collected between 1961 and 1990 from the Malta International Airport in Luqa, Malta (Galdies, 2010; Galdies, 2022), the seasonal cycle is defined by monthly averages of approximately 12 °C in January and February, and peak annual temperatures between July and August with averages above 25 °C. At their most extreme, temperatures have varied between 1.4 °C and above 43 °C (Galdies, 2011; Galdies, 2022). Over recent decades, the average temperature has been steadily increasing, reaching an anomaly of 1.5 °C higher than averages in 1952 (Galdies, 2022). Relative humidity (RH) also varies seasonally, with an average of ~79% in winter, and ~69% in summer (Galdies, 2011; Galdies, 2022). Furthermore, a recent report (Galdies, 2022) has noted a gradual decrease in average RH on the island of 0.8% per decade, a phenomenon that can be attributed to the observed warming, and also potentially to the aridification of the region (Doblas-Reyes et al., 2021; Gutiérrez et al., 2021; Ranasinghe et al., 2021). The near-surface winds (measured at 10 m above ground) being predominantly north-westerly (centred at 315°), vary with a winter average of 5.25 m s-1 (10.2 knots) in winter to 3.54 m s-1 (6.9 knots) in summer (Galdies, 2022; Wadsworth, 1928). These studies also reveal that the Maltese islands may still be undergoing terrestrial stilling (McVicar et al., 2012; Vautard et al., 2010), a phenomenon which may be in the process of reversal (Zeng et al., 2019).
However, there remains a need for continuous monitoring and analysis of climate variability, particularly in the face of ongoing global rapid climate change. The Giordan Lighthouse Background Monitoring Station (henceforth referred to as GL), established in 2000 and accredited as a Global Atmosphere Watch (GAW) station in 2005 (Ellul & Saliba, 2005), serves as a crucial site for this purpose. The station's suite of instruments, specifically chosen for their accuracy in harsh coastal environments, has been collecting high-resolution meteorological data for over two decades.
This study utilises the dataset from the GL to assess climate variability within this background monitoring station by comparing it with findings of existing research within the Maltese islands. While past research with GL data was primarily focused on wind and air quality (Azzopardi, 2016; Ellul & Saliba, 2005; Matasović et al., 2023), we aim to provide a more comprehensive analysis of climate variability at the GL by:
reporting on any missing data gaps and outliers within the time series;
delving into meteorological parameters in addition to winds, allowing for a more holistic understanding of the climate system in the region;
assessing climate variability within annual and diurnal cycles;
exploring the variation of extreme indices derived from these parameters, providing insights into the frequency and intensity of extreme weather events at the GL.
The giordan lighthouse background monitoring station
History
The GL was constructed when the Maltese Archipelago was a British Colony. It started operating on 15 March 1853 (D’Amico et al., 2024). The purpose of the GL was to act as a reference point for vessels crossing the Strait of Sicily and those approaching the Maltese islands, thus becoming an important landmark for navigation. As vessels were equipped with transponders and navigation devices, the physical presence of the GL was no longer significant for navigation.
After this time, the purpose of the GL shifted to provide a local and international scientific contribution. A joint Maltese-German atmospheric pollution research programme was launched on 7 December 1996 to monitor atmospheric pollution over the Maltese islands and in the Central Mediterranean (D’Amico et al., 2024; Ellul & Saliba, 2005). Since the establishment of this research programme, several meteorological parameters have been continuously measured and recorded, including wind speed and direction, air temperature, relative humidity, and atmospheric pressure. The resulting long-term dataset contributed to numerous air quality studies (Azzopardi et al., 2013; Cristofanelli et al., 2015; Kalabokas et al., 2008; Nolle et al., 2002; Saliba et al., 2008; Saliba et al., 2021; Sofen et al., 2016; Tenkanen et al., 2021; Tsuruta et al., 2017), while the meteorological dataset forms the core of the study being reported here.
Instrument and data collection
The GL is located on Ġurdan Hill overlooking the village of Għasri on the northwest coast of the island of Gozo (Figure 1). Its base is 163 m above mean sea level and approximately setback by 800 m from the coastline. The Lighthouse is 21 m in height and has geographic coordinates 36° 04’ 24” N and 14° 13’ 08” E. The instruments used at the GL include a cup and vane anemometer (Lambrecht model 14512, replaced by Lufft model WS200 on 28th July 2021, installed at the top of the lighthouse) to measure wind speed and direction, a Vaisala HMP60 probe (installed approximately 4 m above the base level) to measure relative humidity and air temperature, and briefly, between 2002 and 2008, the Vaisala PTB110 was installed at approximately 167 m above mean sea level, to measure air pressure. This study provides an analysis of the meteorological data (variables are summarised in Table 1) collected from this station over a 26-year period, ranging from 1997 to 2022, with an hourly temporal resolution.
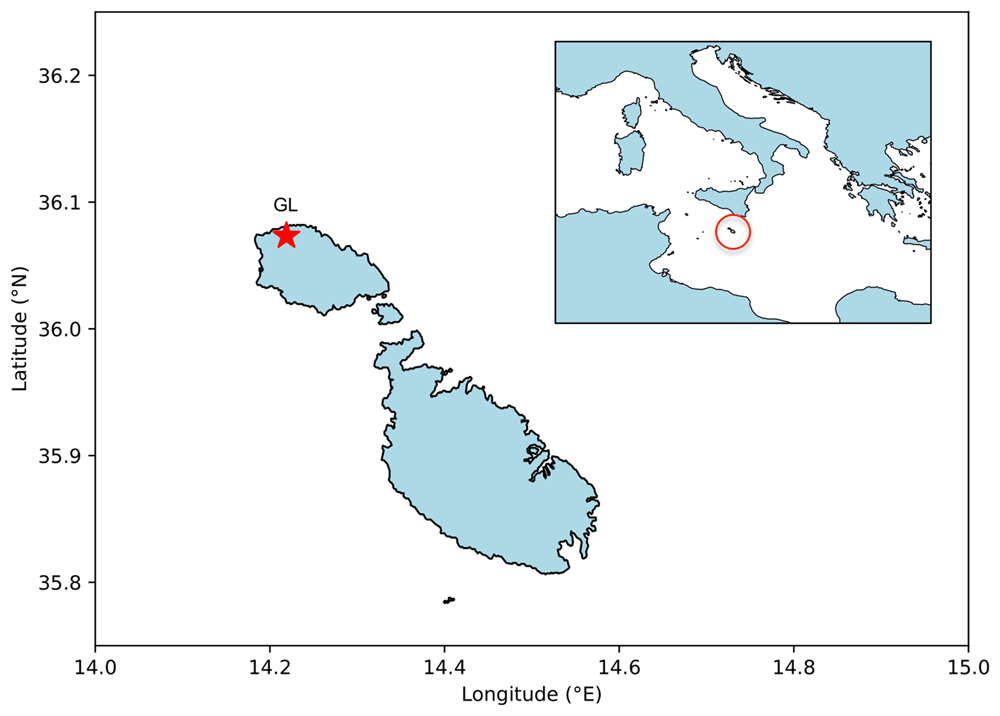
Figure 1. Coastline of Malta and Gozo with GL monitoring station, inset showing Mediterranean context.
Table 1. Abbreviations and descriptions of meteorological variables measured at the Giordan Lighthouse Background Monitoring Station.
| Abbreviation | Full Name | Units |
|---|
| WS | Wind Speed | m s-1 |
| WD | Wind Direction | ° |
| RH | Relative Humidity | % |
| AT | Air Temperature | °C |
| DT | Dew Point Temperature | °C |
| AP | Air Pressure | hPa |
The long-term nature of data collection inevitably leads to occasional technical issues. In this section, we discuss specific instances where data points were removed due to problems identified with the instruments. Notably, a filter was applied to remove AP readings that were exceedingly low, specifically those smaller than 950 hPa. Additionally, a data gap occurred between September 2003 and December 2004 because the probe was not operational during that time.
A WS data gap is present between 26th September 2017, and 31st December 2020, which originated due to a malfunction in the original cup and vane anemometer (Lambrecht model 14512). To restore reliable data collection, the instrument was replaced with a Lufft model WS200 anemometer. Additionally, a separate period from 21:00 on 13th April 2017 to 06:00 on 5th July 2017 was excluded, as the values remained constant at 6.4 m s-1, due to a sensor malfunction, which was later resolved.
Although the Vaisala HMP60 probe is designed to measure RH within a 0–100% range, certain readings in this dataset fell outside this operational window. Notably, a value of 1766% was recorded at 01:00 of 13th April 2000 and a value of -462% recorded at 07:00 of 7th December 1999. All outliers exceeding the sensor's range were removed from the dataset. Additionally, instances where RH suddenly dropped to 0% (or close to it), such as at 04:00 on 3rd June 2019 and between 03:00 and 05:00 on 19th June 2019, were also excluded.
Similarly, AT readings were excluded from the dataset when they exceeded the range of 0°C to 50°C. These outliers were characterised by large and sudden deviations in temperature compared to the nearest recorded values. The specific instances of these outliers included: 10:00 on 1st August 2016; 07:00 on 2nd August 2016; 09:00 to 18:00 on 15th June 2018; 21:00 on 2nd May to 01:00 on 16th May 2019; 16:00 on 24th May to 11:00 on 25th May 2019; 08:00 to 10:00 on 2nd June 2019; 05:00 to 07:00 on 3rd June 2019; 03:00 on 6th June 2019; and 08:00 on 11th June 2019.
Data coverage
In this study, we begin by assessing the completeness of the dataset over the 25-year period. Specifically, we calculate the percentage of data available for each month across all six variables. This preliminary analysis is crucial for identifying periods of missing data, which could impact the validity of subsequent analyses and interpretations. The results of this initial assessment are visualised in Figure 2, which provide a clear overview of the data availability across different months and years.
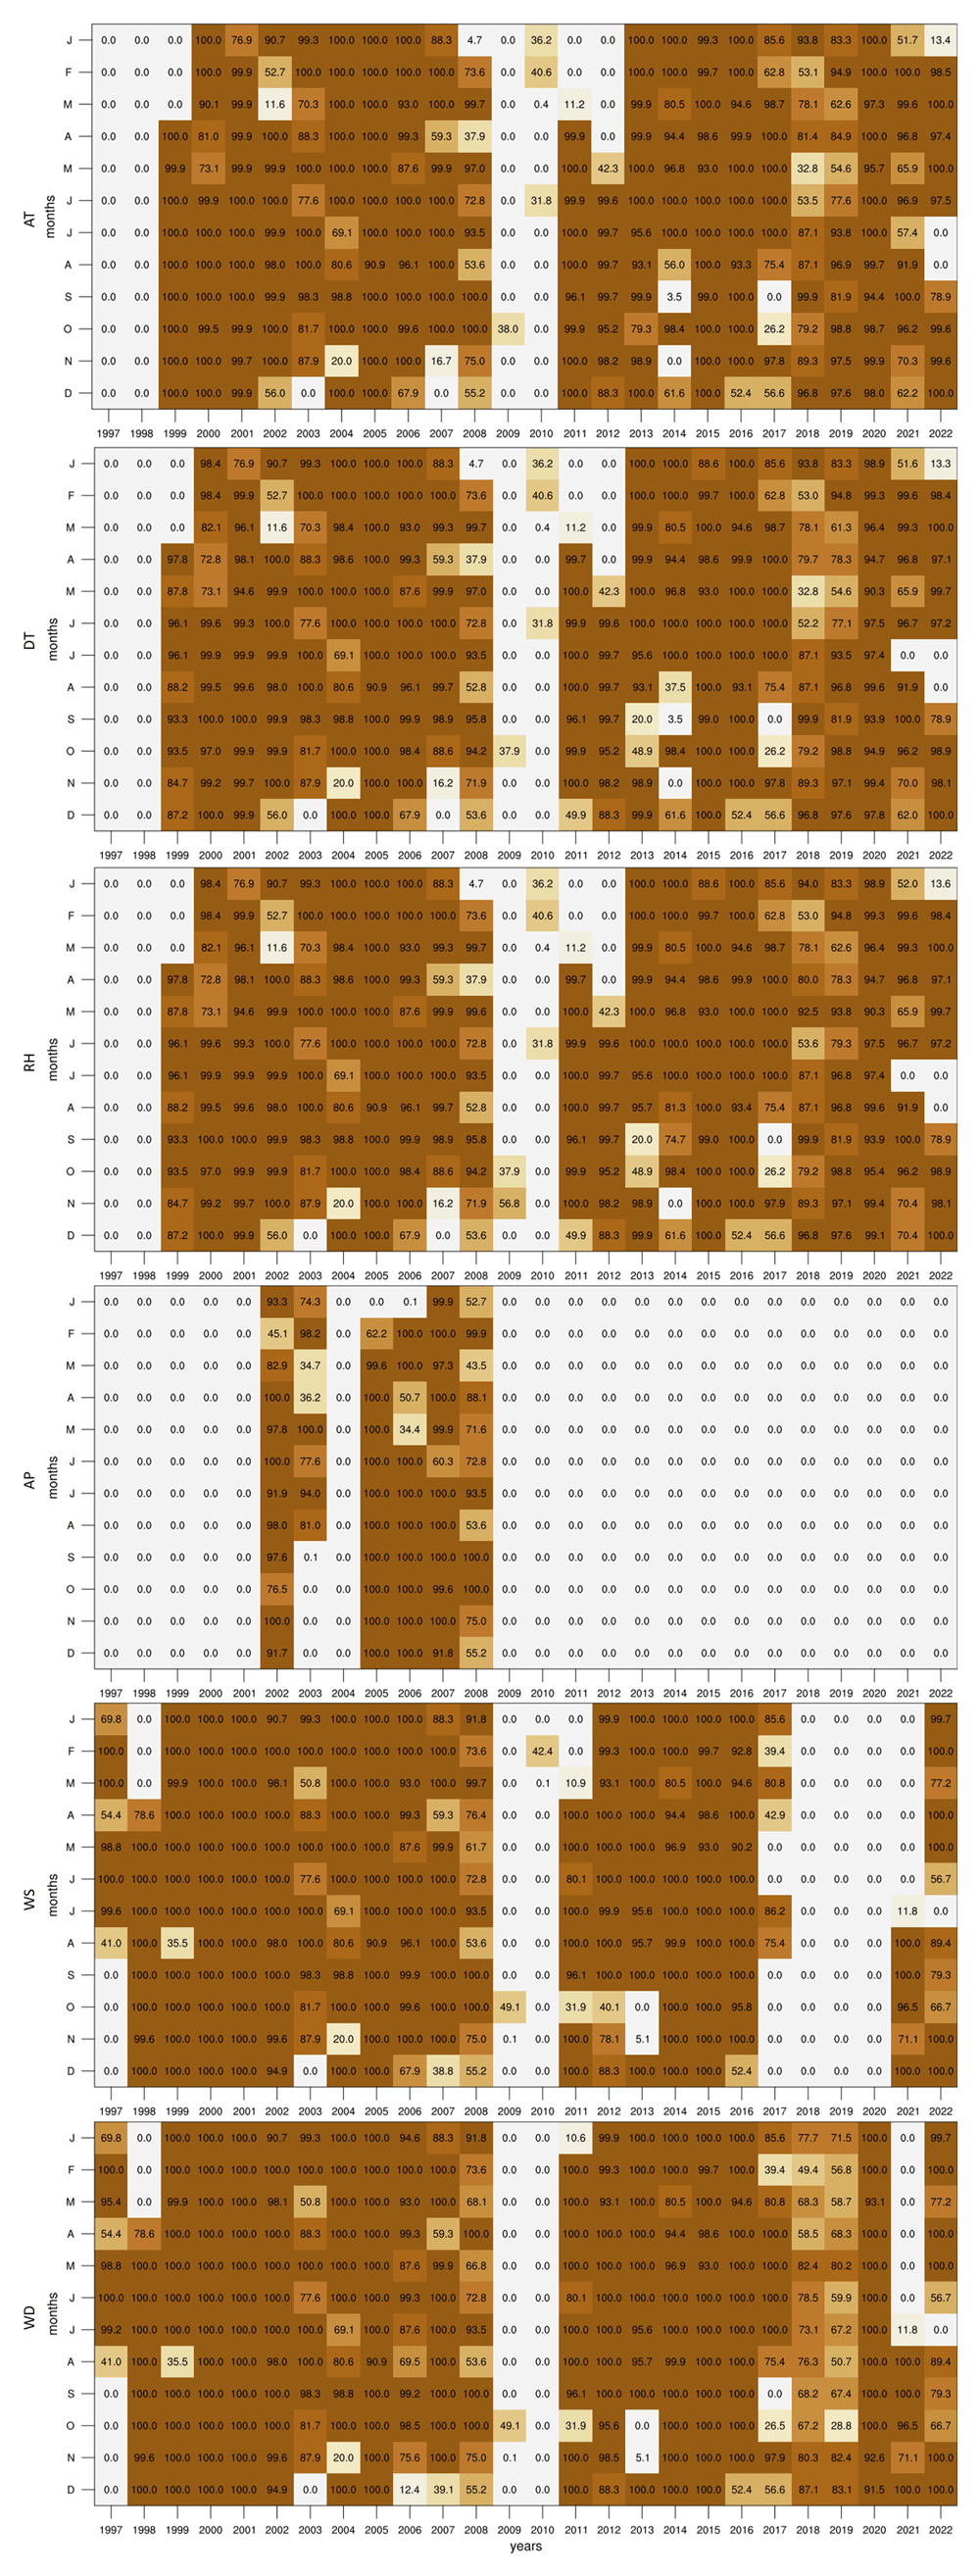
Figure 2. Percentage of valid data points for each month and variable in the dataset.
Although the dataset starts in 1997, only WS and WD contain data within the first two years, as the GL station was still in the early stages of setup. All variables are missing data in 2009 and 2010 as the instruments room at GL was being restored in preparation for the arrival of new equipment funded by the European Regional Development Fund (ERDF 078 - Upgrading of Giordan Lighthouse GAW Research Station). When compared to the other variables, the AP records are available only for the span between 2002 and 2008 when the 21X logger was operating. Following the installation of the new equipment, the AP data was no longer recorded due to the limited analogue channel of the logger provided by the supplier. Taking into account measurement errors and system interruptions, each variable contains the following fractions of the 26-year dataset: 72.3% for AT; 70.86% for DT; 71.8% for RH; 18.5% for AP; 67.4% for WS; and 78.3% for WD. Given the small AP dataset, we have not explored the climatology of this parameter within the context of this study, however, analogous plots with this variable can be found together with the scripts (see Supplementary Images and Software availability).
Methods
The climate assessment of this meteorological dataset involves a comprehensive analysis using various tools and indices to capture the characteristics of the recorded variables. This section details the methodologies and indices employed to evaluate the climate conditions over the 26-year period.
To thoroughly analyse the dataset, a range of analytical tools was applied. Probability Distribution Functions (PDFs) were constructed from the hourly data to understand the distribution and variability of each meteorological variable. The means, standard deviation, maxima and minima for each of the daily 24-hours were used to construct diurnal cycles. The same statistics were obtained for every day of the year to create annual cycles, illustrating the seasonal trends and long-term variations throughout the year. These cycles are essential for identifying recurring patterns and potential anomalies in the data.
Seasonal Wind Roses were created to visualise the predominant wind patterns and variations across different seasons, aiding in understanding the local wind climatology. Finally, colour tables were generated to represent the monthly means of each variable across the entire dataset. These visualisations facilitate the identification of trends and anomalies in the data over extended periods, making it easier to spot changes in climate conditions.
To further describe the climatic conditions, we employed three climate indices (Dunn et al., 2020; Yu & Zhong, 2019) that provide a deeper understanding of specific weather patterns:
Summer Days (SU), which accounts for the number of days in a month when the daily maximum temperature (TX) exceeds 25°C;
Tropical Nights (TR), which measures the number of days in a month when the daily minimum temperature (TN) exceeds 20°C;
Windy Days (WI), which is a count of the number of days in a month when the mean WS is equal to or greater than Beaufort scale 6 (10.8 m/s or 22 knots).
The SU and TR are indicative of warm weather periods and are useful for assessing the frequency and distribution of hot days and nights over the years, which can have significant implications for energy consumption, human comfort, and local ecosystems. The frequency of WI is crucial for understanding wind patterns and their potential impacts on local weather, infrastructure, and activities. To construct the annual cycles for these indices, a 30-day running average was used to obtain a “daily” frequency comparable to other annual cycles.
These tools and indices provide a robust framework for assessing the climate conditions represented in the dataset. The subsequent sections will present detailed analyses based on these methodologies, offering insights into the temporal and spatial variations in the recorded meteorological variables.
Climate assessment
In this section, we present a detailed analysis of the climate conditions captured in our meteorological dataset. The assessment focuses primarily on temperature, humidity, and winds. By examining these key variables separately, we aim to provide a comprehensive understanding of the climate described by the recorded data.
Similar plots and detailed analyses for all other variables, including AP, are available in the data repository alongside the dataset. These additional resources provide a more extensive view of the climate conditions at the station and support the findings discussed in this section.
Temperature
Temperature is a fundamental climate variable, influencing many aspects of the environment and human activities. Figure 3 illustrates this variable at the Giordan Lighthouse in Gozo through a PDF, diurnal cycle, and annual cycle. The PDF (Figure 3a) shows a clear bimodal distribution for temperature, peaking at around 10 °C and 25 °C, which suggests that the climate in the region fluctuates predominantly between two states: a cool period and a warmer period. This can be seen in more detail when assessing the PDFs of each season separately (Figure 3b), where DJF and MAM contribute to the low-temperature peak, while JJA and SON contribute to the warmer peak. This does not suggest that the local climate is made up of only two-seasons, as precipitation plays an important role in each season, and the GL data does not include this variable. The annual cycle (Figure 3d) also describes a typical Mediterranean seasonal cycle, with hot summers peaking in July and August, and cool winters around January and February. Furthermore, both the annual and diurnal cycles (Figure 3c) show that the minimum temperatures often come close to 0 °C but never reach it, while the most extreme warm temperatures can approach 40 °C in summer and on rare occasions exceed it.
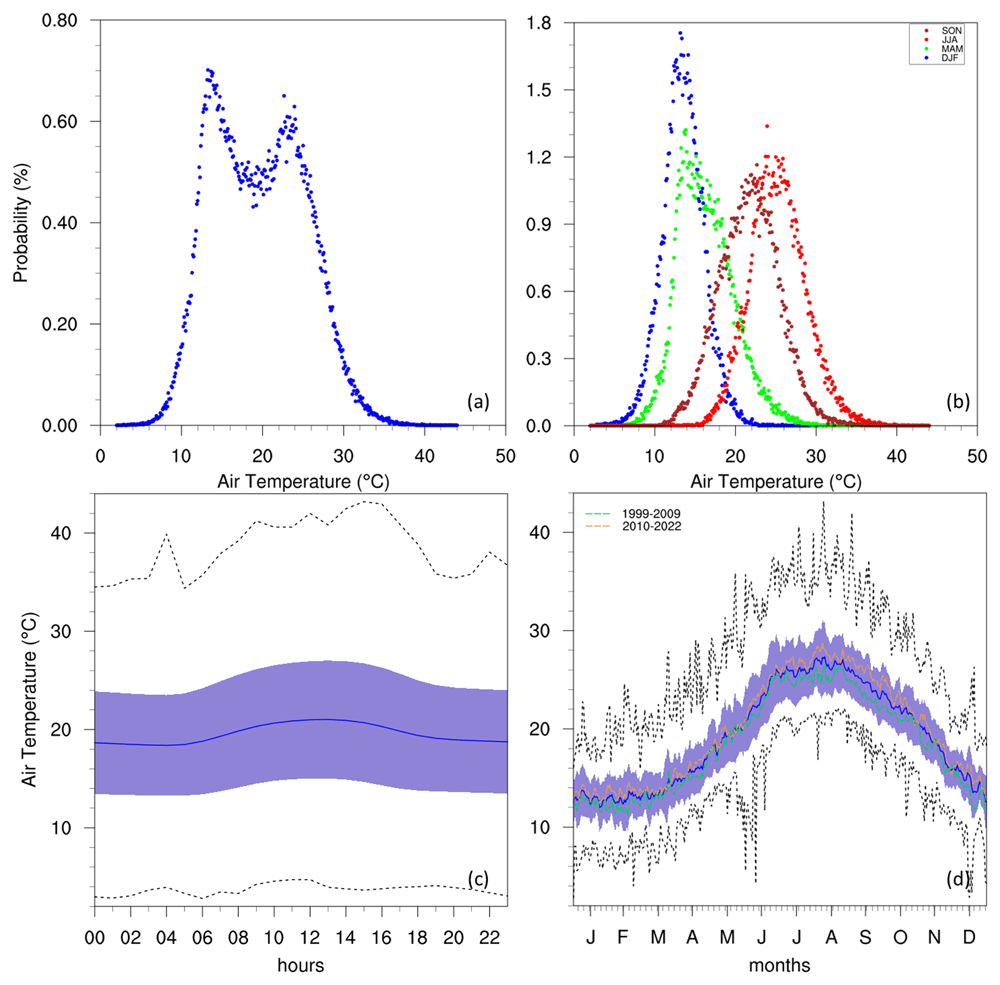
Figure 3.
(a/b) Annual/seasonal PDFs, (c) diurnal and (d) annual cycles with data distribution for AT. For the seasonal PDFs (b), blue, green, red, brown-red dots represent DJF, MAM, JJA, SON respectively. For the diurnal (c) and annual cycles (d), the solid blue line represents the mean, the shaded area describes one standard deviation above and below the mean (2 sigma), and the dotted black line shows the upper and lower limits. The dashed lines in green and orange (d) represent the means for 1999-2009 and 2010-2022 respectively.
The frequency of warm events during the summer period is shown to be very high when looking at the annual cycle of SU and TR (Figure 4). As the images shown are making use of a 30-day running window for total events, the maximum possible value in these cases is 30 days. This maximal value is found within 1 standard deviation of the mean between July and August for SU, and between June and September for TR. This broader peak for TR could explain the rapid rise in temperature prior to the summer months and the slower rate of cooling after. Furthermore, between the end of July and beginning of August, TR is always maximal, indicating this as the most intense warming period of the year.
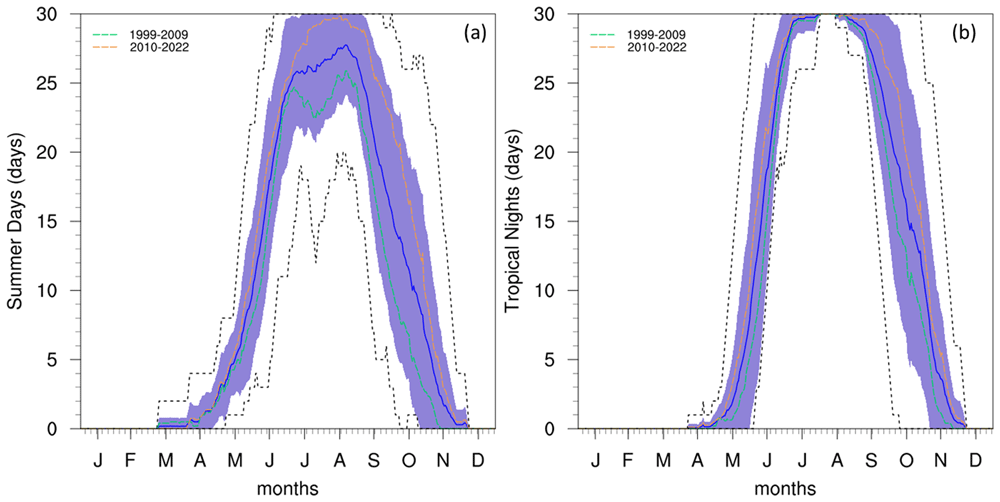
Figure 4.
Annual cycle for (a) SU and (b) TR at the Giordan Lighthouse in Gozo. The solid blue line represents the mean, the shaded area describes one standard deviation above and below the mean (2 sigma), and the dotted black line shows the upper and lower limits. The dashed lines in green and orange (d) represent the means for 1999-2009 and 2010-2022 respectively.
Considering the gaps in the dataset, plotting annual means to follow the rate of warming detected by the station could be misleading. However, this can be circumvented with the use of colour tables describing monthly means (Figure 5). This reveals a clear difference between the two decades portrayed, as temperatures (especially summer) in the 2010s become visibly warmer than those in the 2000s. This can also be observed in the annual cycles (Figure 3 and Figure 4) which show the means for these two time periods. A similar rise in temperature can be seen in the time series of the data measured at the Malta International Airport Meteorological Office (Galdies, 2022), which shows a gradual rise in the 2000s, with more consistently high annual means after 2010.
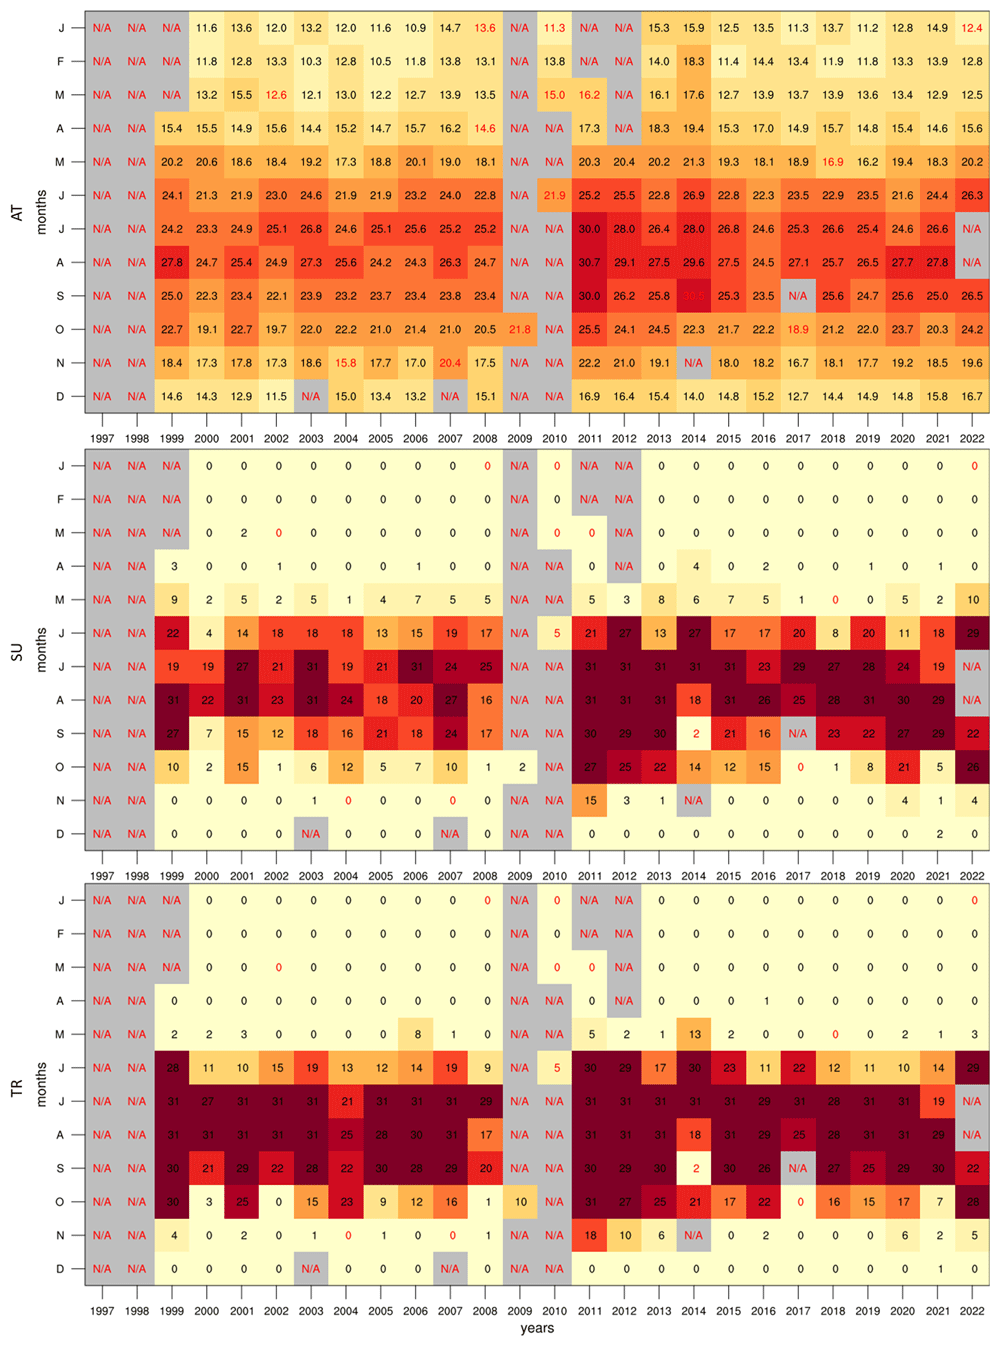
Figure 5. Monthly mean colour tables for AT, SU, TR.
The red text describes months with under 40% valid values.
Humidity
According to past studies (Galdies, 2011; Galdies, 2022), the RH of the Maltese islands is typically between 70 and 80%. The data from the Giordan Lighthouse (Figure 6) is in agreement with these past studies, as the PDF of hourly RH peaks just below the 80%, and dips during the warmest times of the day (as described in Galdies, 2011) as the capacity of air parcels to hold water increases. A notable dip in average RH in summer can also be observed, however, the standard deviation and limits of RH during this time also broaden, reaching an absolute minimum smaller than 10%. This is possibly linked to the reduced precipitation of these months (noted by Galdies, 2011; Galdies, 2022). Although evaporation rates would theoretically increase during these periods, this likely does not compensate for the reduction in ambient moisture due to the lack of rainfall.
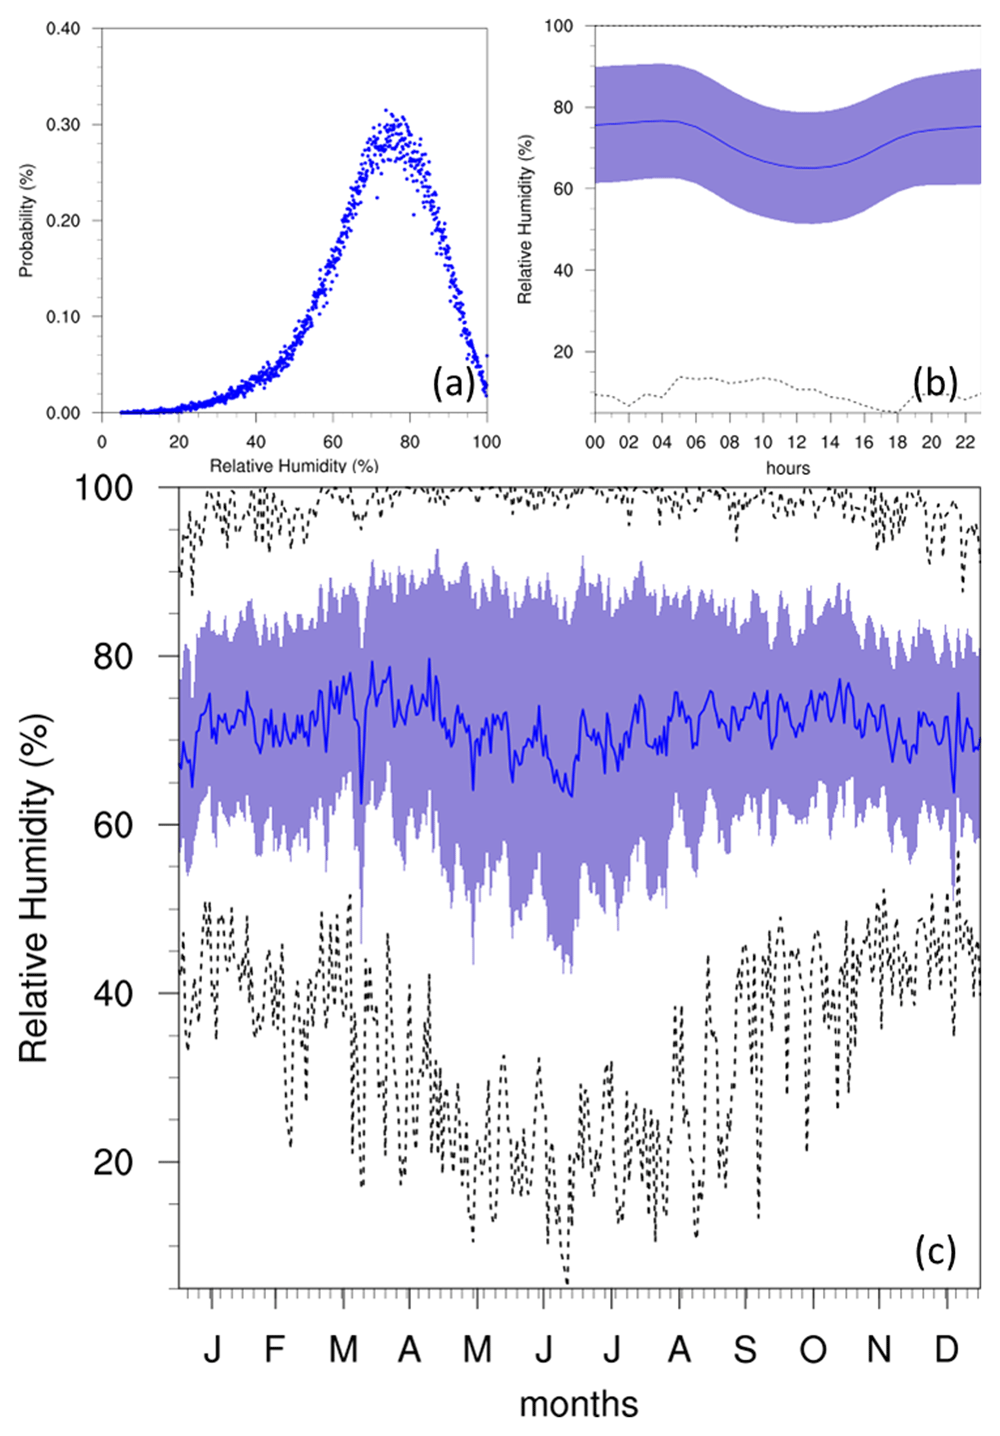
Figure 6.
(a) Annual PDF, (b) diurnal and (c) annual cycles for RH at GL. For the diurnal (b) and annual cycles (c), the solid blue line represents the mean, the shaded area describes one standard deviation above and below the mean (2 sigma), and the dotted black line shows the upper and lower limits.
Winds
The WS of the Maltese islands is documented (Galdies, 2011; Galdies, 2022) at an average of 5.14 m/s (10 knots), corresponding to the most frequent wind conditions at 5 m/s (Figure 7). The average however, noted more prominently in the diurnal and annual cycles, is shown to be closer to 7 m/s, even reaching 10 m/s during the winter seasons. This could be attributed to the position of the GL at the NW edge of the Maltese islands, combined with the direction of the prevailing winds (discussed below), and the anabatic conditions as winds travel upslope. Although the diurnal cycle shows no major variation in WS, a slight peak between 12:00–14:00 may also be attributed to anabatic winds that occur during the daytime, given the position of the station on a high hill. The annual cycle reveals the lowest WS during summer months, with the highest values in winter. This corresponds to the peak of WI (Figure 8) at approximately 13 days/month in winter, which shows no notable changes in trend throughout the time-period of the project. This high intensity of winds is also notable in the seasonal wind roses (Figure 9), where the strongest winds occur in the winter months, and the prevailing winds come from the W-NW direction.
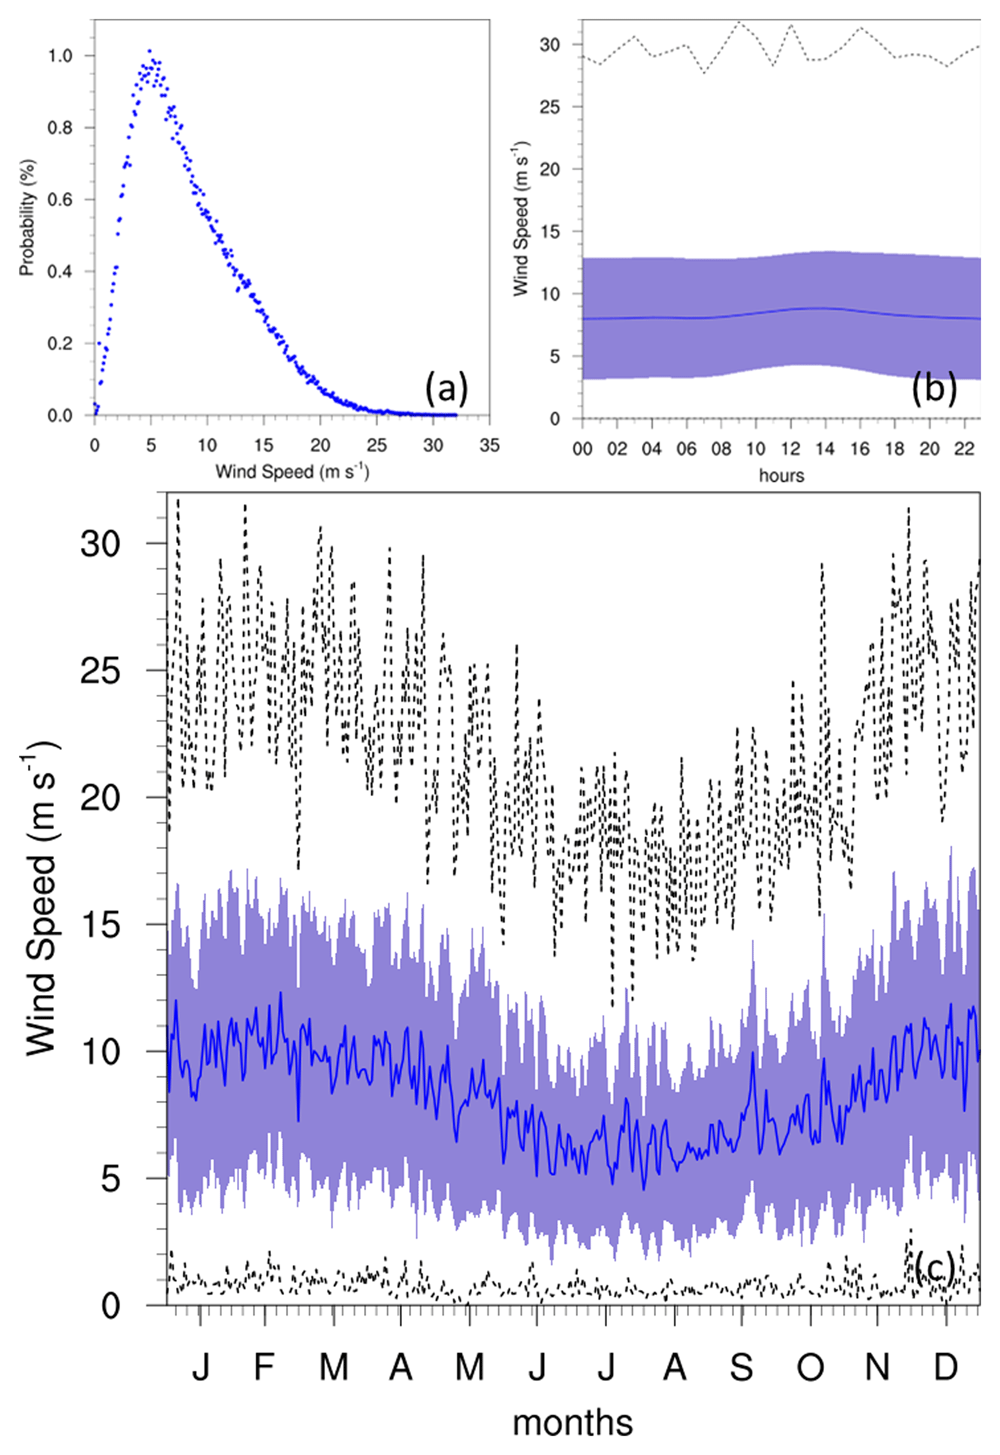
Figure 7.
(a) Annual PDF, (b) diurnal and (c) annual cycles for WS at GL. For the diurnal (b) and annual cycles (c), the solid blue line represents the mean, the shaded area describes one standard deviation above and below the mean (2 sigma), and the dotted black line shows the upper and lower limits.
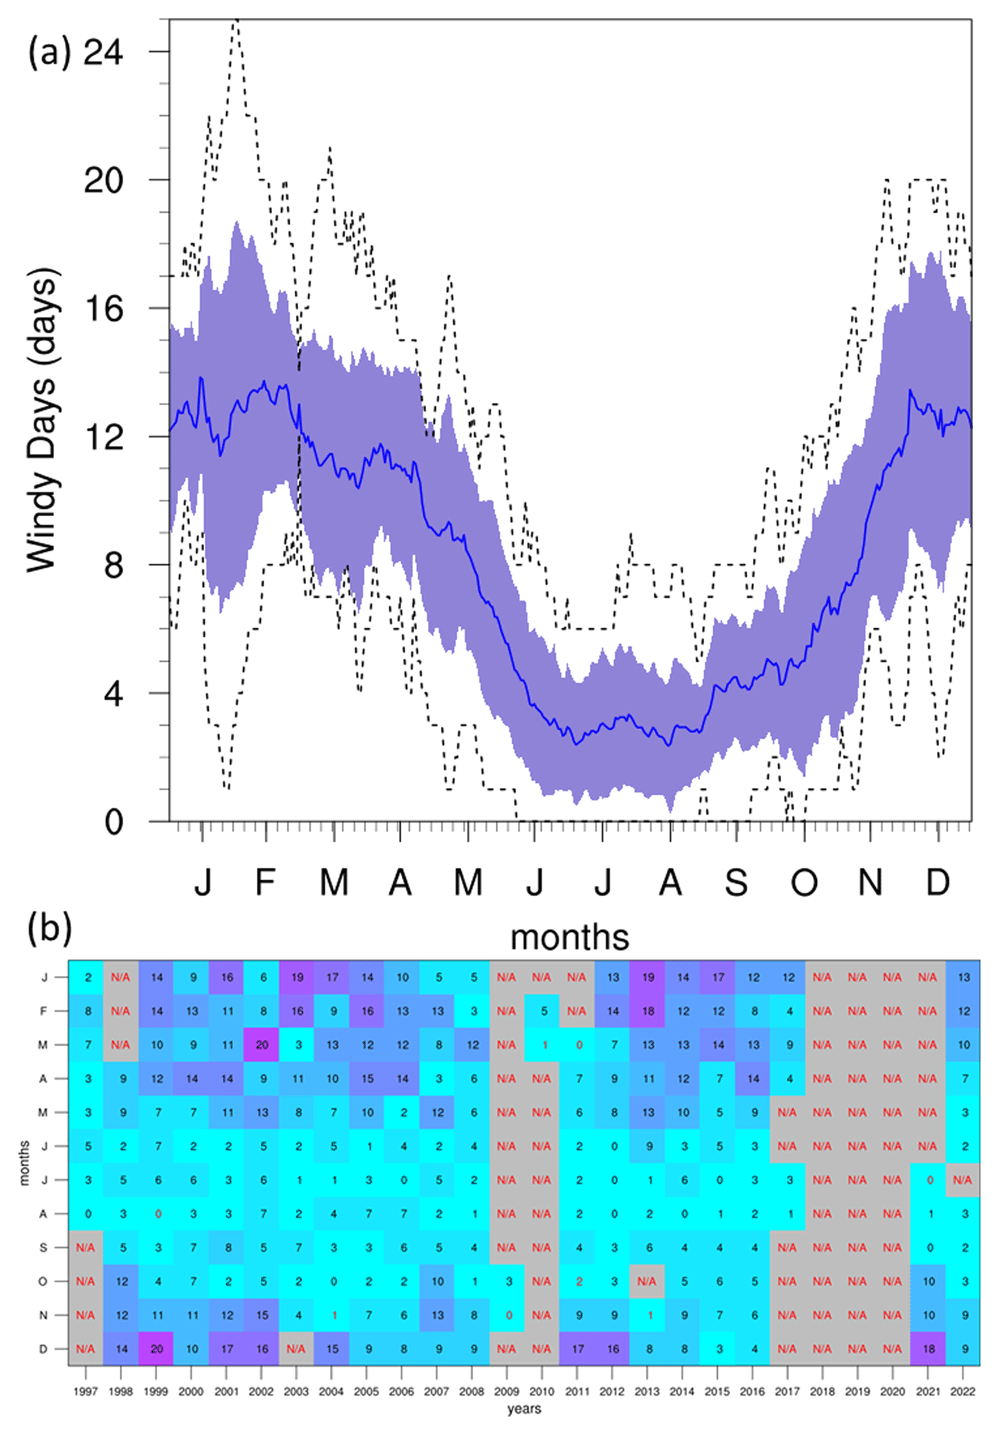
Figure 8.
(a) Annual cycle and (b) monthly colour table for WI at GL. For the annual cycle (a), the solid blue line represents the mean, the shaded area describes one standard deviation above and below the mean (2 sigma), and the dotted black line shows the upper and lower limits. The red text in the mean colour table (b) describes months with under 40% valid values.
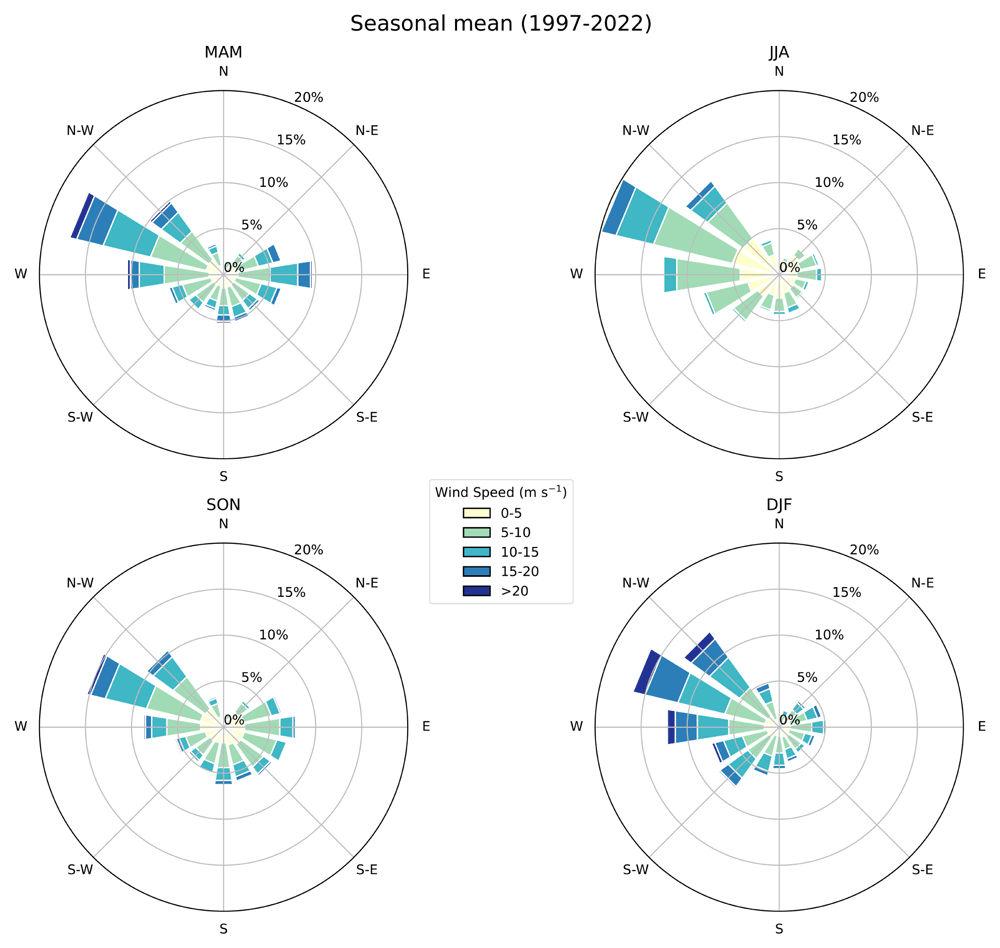
Figure 9. Seasonal wind rose showing WS distribution (m s-1) and frequency (%) at GL.
The radial spokes indicate direction, while the length of each spoke corresponds to the frequency of winds coming from that direction. Different colours along the spokes represent varying WS ranges. Labels indicate the seasons: MAM, JJA, SON, DJF.
Summary
This study provides a detailed analysis of the meteorological data collected from the GL in Gozo over a 26-year period from 1997 to 2022. The data includes six key variables: AT, DT, RH, AP, WS, and WD, all recorded with hourly resolution. The analysis aimed to assess the climate variability of the Maltese Islands, emphasising the completeness of the dataset, the characteristics of each variable, and the implications of observed trends.
Initially, the dataset's completeness was evaluated, revealing gaps and outliers primarily due to technical issues with the instruments. Notably, AP and WS data had significant gaps, and some anomalies were detected which were subsequently excluded from the analysis.
The analysis of temperature data indicated a clear bimodal distribution with peaks corresponding to winter and summer seasons. The annual cycle displayed a typical Mediterranean pattern with hot summers and mild winters. The frequency of warm events, as indicated by the SU and TR indices, showed a high occurrence during summer months, especially in the 2010s, suggesting a warming trend over the study period.
RH data aligned with previous studies, showing typical values between 70% and 80%, with notable dips during summer months. The variability in humidity was attributed to seasonal changes in temperature and precipitation.
WS analysis revealed that the most frequent wind conditions were around 5 m/s, with a slight peak during midday possibly due to local topographical influences. The annual cycle showed higher WS during winter, consistent with the peak in the WI index. Seasonal wind roses highlighted the predominant wind direction from the W-NW and stronger winds in winter.
This comprehensive assessment of the GL meteorological dataset underscores the importance of long-term monitoring for understanding climate variability. The findings indicate significant seasonal patterns and trends in temperature, humidity, and wind characteristics over the 26-year period. Notably, the warming trend observed in the frequency of hot days and nights during the summer months aligns with broader global climate change patterns.
This study highlights the need for continuous and accurate meteorological data collection to monitor and predict climatic changes. The insights gained from the GL dataset contribute to the broader understanding of the Maltese Islands' climate and underscore the value of background monitoring stations in climate research.
Future work should focus on improving instrument reliability (and hence reduce the occurrence of new data gaps), and expanding the analysis to compare to other datasets within the Maltese islands. This will enhance the robustness of climate assessments and support more effective climate adaptation and mitigation strategies for the region.
Ethics and consent
Ethical approval and consent were not required.
Data availability
Underlying data
Zenodo: Giordan Climate Assessment Data & SI, 10.5281/zenodo.14415659 (Ciarlo` et al., 2024).
This project contains the following underlying data:
Giordan_data_hr.csv
The data is available under Creative Commons Zero v1.0 Universal.
Extended data
Zenodo: Giordan Climate Assessment Data & SI, 10.5281/zenodo.14415659 (Ciarlo` et al., 2024).
This project contains the following underlying data:
Figure Legends - For diurnal and annual cycles the solid blue line represents the mean, the shaded area describes one standard deviation above and below the mean (2 sigma), and the dotted black line shows the upper and lower limits. Dashed lines in green and orange represent the means for 1999–2009 and 2010–2022 respectively.
For seasonal PDFs, blue, green, red, brown-red dots represent DJF, MAM, JJA, SON respectively.
Monthly mean colour tables use red text for months with under 40% valid values.
For wind rose, radial spokes indicate direction, while the length of each spoke corresponds to the frequency of winds coming from that direction. Different colours along the spokes represent varying WS ranges. Labels indicate the seasons: MAM, JJA, SON, DJF.
The data is available under Creative Commons Zero v1.0 Universal.
Software availability statement
Faculty Opinions recommendedReferences
- Azzopardi F:
Regional dispersion of pollutants with special reference to Etna emissions as measured at Giordan Lighthouse GAW station. PhD Thesis (University of Malta), 2016. Reference Source
- Azzopardi F, Ellul R, Prestifilippo M, et al.:
The effect of Etna volcanic ash clouds on the Maltese Islands.
J Volcanol Geotherm Res.
2013; 260: 13–26. Publisher Full Text
- Ciarlo JM, Vella R, Saliba M, et al.:
Giordan climate assessment data & SI (v1.0.0).
Zenodo.
2024. http://www.doi.org/10.5281/zenodo.14415659
- Cristofanelli P, Scheel HE, Steinbacher M, et al.:
Long-term surface Ozone variability at Mt. Cimone WMO/GAW global station (2165 m a.s.l., Italy).
Atmos Environ.
2015; 101: 23–33. Publisher Full Text
- D’Amico SD, Micallef A, Gauci A, et al.:
Science meets cultural heritage at the Giordan Lighthouse. Gozo: Interweaving Science and History, for the Citizen IEEE International Conference on Metrology for Archaeology and Cultural Heritage (MetroArchaeo 2024) (Valletta), 2024; 1–11.
- Doblas-Reyes FJ, Sörensson AA, Almazroui M, et al.:
Linking Global to regional climate change. Climate change 2021 – The Physical Science Basis. ed V Masson-Delmotte, P Zhai, A Pirani, S L Connors, C Péan, S Berger, N Caud, Y Chen, L Goldfarb, M I Gomis, M Huang, K Leitzell, E Lonnoy, J B R Matthews, T K Maycock, T Waterfield, O Yelekçi, R Yu and B Zhou (Cambridge University Press), 2021; 1363–1512. Publisher Full Text
- Dunn RJH, Alexander LV, Donat MG, et al.:
Development of an updated global land In Situ-based data set of temperature and precipitation extremes: HadEX3.
J Geophys Res: Atmos.
2020; 125(16): e2019JD032263. Publisher Full Text
- Ellul R, Saliba M:
The University of Malta Giordan Lighthouse – background trace gas monitoring station on Gozo.
Gozo Observ.
2005; 13: 14–23. Reference Source
- England K, Camilleri L, Calleja N, et al.:
The relationship of ambient temperature and humidity with mortality on the Maltese Islands 1992–2005. Health Effects of Climate Change in the Maltese Islands, 2010; 37–44. Reference Source
- Galdies C:
Observed trends in the Maltese climate. Health effects of climate change in the Maltese islands, 2010; 4–15. Reference Source
- Galdies C:
The Climate of Malta: statistics, trends and analysis 1951–2010. 2011. Reference Source
- Galdies C:
Temperature trends in Malta (central Mediterranean) from 1951 to 2010.
Meteorol Atmos Phys.
2012; 117: 135–143. Publisher Full Text
- Galdies C:
The State of the Climate 2022. A multidecadal report & assessment of Malta’s Climate. 2022. Reference Source
- Gutiérrez JM, Jones RG, Narisma GT, et al.:
Atlas. Climate Change 2021 – The Physical Science Basis. ed V Masson-Delmotte, P Zhai, A Pirani, S L Connors, C Péan, S Berger, N Caud, Y Chen, L Goldfarb, M I Gomis, M Huang, K Leitzell, E Lonnoy, J B R Matthews, T K Maycock, T Waterfield, O Yelekçi, R Yu and B Zhou (Cambridge University Press), 2021; 1927–2058. Publisher Full Text
- Hyde H:
Geology of the Maltese Islands. Malta: De La Salle Brothers Publications, 1955.
- Jahan S, Cauchi JP, Galdies C, et al.:
Effects of ambient temperatures and extreme weather events on circulatory mortality in a high population density area: exploring mortality data from Malta.
Clim Risk Manag.
2022; 38: 100463. Publisher Full Text
- Kalabokas PD, Mihalopoulos N, Ellul R, et al.:
An investigation of the meteorological and photochemical factors influencing the background rural and marine surface Ozone levels in the Central and Eastern Mediterranean.
Atmos Environ.
2008; 42(34): 7894–906. Publisher Full Text
- Matasović B, Saliba M, Muscat R, et al.:
Long-term tropospheric Ozone data analysis 1997-2019 at Giordan Lighthouse, Gozo, Malta.
Atmosphere (Basel).
2023; 14(9): 1446. Publisher Full Text
- McVicar TR, Roderick ML, Donohue RJ, et al.:
Global review and synthesis of trends in observed terrestrial near-surface wind speeds: implications for evaporation.
J Hydrol (Amst).
2012; 416–417: 182–205. Publisher Full Text
- Nolle M, Ellul R, Heinrich G, et al.:
A long-term study of background Ozone concentrations in the central Mediterranean—diurnal and seasonal variations on the Island of Gozo.
Atmos Environ.
2002; 36(8): 1391–402. Publisher Full Text
- Ranasinghe R, Ruane AC, Vautard R, et al.:
Climate Change Information for Regional Impact and for Risk Assessment. Climate Change 2021 - The Physical Science Basis. Contribution of Working Group I to the Sixth Assessment Report of the Intergovernmental Panel on Climate Change ed V Masson- Delmotte, P Zhai, A Pirani, S L Connors, C Péan, S Berger, N Caud, Y Chen, L Goldfarb, M I Gomis, M Huang, K Leitzell, E Lonnoy, J B R Matthews, T K Maycock, T Waterfield, O Yelekçi, R Yu and B Zhou (Cambridge University Press), 2021; 1767–926. Reference Source
- Saliba M, Azzopardi F, Muscat R, et al.:
Trends in vessel atmospheric emissions in the Central Mediterranean over the last 10 years and during the COVID-19 outbreak.
J Mar Sci Eng.
2021; 9(7): 762. Publisher Full Text
- Saliba M, Ellul R, Camilleri L, et al.:
A 10-year study of background surface ozone concentrations on the Island of Gozo in the Central Mediterranean.
J Atmos Chem.
2008; 60: 117–35. Publisher Full Text
- Sofen ED, Bowdalo D, Evans MJ, et al.:
Gridded global surface ozone metrics for atmospheric chemistry model evaluation.
Earth Syst Sci Data.
2016; 8(1): 41–59. Publisher Full Text
- Tenkanen M, Tsuruta A, Rautiainen K, et al.:
Utilizing earth observations of soil freeze/thaw data and atmospheric concentrations to estimate cold season methane emissions in the northern high latitudes.
Remote Sens (Basel).
2021; 13(24): 5059. Publisher Full Text
- Tsuruta A, Aalto T, Backman L, et al.:
Global methane emission estimates for 2000-2012 from CarbonTracker Europe-CH4 v1.0.
Geosci Model Dev.
2017; 10(3): 1261–89. Publisher Full Text
- Vautard R, Cattiaux J, Yiou P, et al.:
Northern Hemisphere atmospheric stilling partly attributed to an increase in surface roughness.
Nat Geosci.
2010; 3: 756–61. Publisher Full Text
- Wadsworth J:
Studiesa of Wind and Cloud at Malta Geophysical Memoirs No. 37 IV. 1928.
- Yu L, Zhong S:
Strong wind speed events over Antarctica and its surrounding Oceans.
J Clim.
2019; 32(12): 3451–70. Publisher Full Text
- Zeng Z, Ziegler AD, Searchinger T, et al.:
A reversal in global terrestrial stilling and its implications for wind energy production.
Nat Clim Chang.
2019; 9: 979–85. Publisher Full Text









