Introduction
A nanocomposite is a solid material formed by two or more phases in which at least one of the phases shows dimensions in the nanometer range (Roy et al., 1986). Mechanical stress can release nanomaterials or nano-containing fragments from nanocomposites. Typical processes considering occupational exposure are sanding, drilling, sawing, and cutting. Abrasion is associated with product use, and shredding can be a relevant process at the end of the life cycle. Relevant particle number emissions occur both in high and low-energy mechanical stresses; emissions from sanding and drilling were up to 1010 #/s (# denotes particle number) and 108 #/s, respectively, while emissions from wind erosion, dynamic friction, and abrasion varied from below the lower limit of quantification to 30×104 #/s (Koivisto et al., 2017). Released fragments consisted mainly of pristine matrix fragments, matrix fragments with embedded or protruding nanomaterials, and occasionally free nanomaterials. Release assessment should consider both new and aged nanocomposites that bring challenges to the exposure assessment (Wohlleben et al., 2024).
The hazard of fragments released from nano-enabled products by mechanical treatment is shown to be determined primarily by the identity of the matrix and potentially modulated by embedded or protruding nanomaterials. Toxicity modulation by nanomaterials is shown to be limited or not detectable for epoxy, cement, polyoxymethylene, polyacrylic, and polyurethane matrices containing various nanomaterials (Wohlleben et al., 2024). A more realistic risk assessment can be conducted if the fraction of free and protruding nanomaterials is assessed, as, e.g., Kang et al. (2017) performed for ABS containing CNTs. Environmental degradation of the matrix can liberate embedded and protruding nanomaterials from the matrix, which should also be considered in the risk assessment (Wohlleben et al., 2024). For particle-lung interactions, inhaled fragments' dissolution rates are highly relevant to estimating the liberation of nanomaterials in the lungs (Brown & Diamond, 2023). Particle characterization is highly relevant for justifying the use of relevant limit values rather than worst-case limit values for the pristine matrix and the nanofiller. Wohlleben et al. (2024) provides a list of commonly applied characterization techniques for assessing the properties of nanocomposite fragments. In registration, evaluation, authorisation and restriction of chemicals (REACH) Regulation (EC) No 1907/2006 registrant are required to assess the safety of nanomaterials separately. In risk assessment, quantitative exposure estimates need to be done for all exposure scenarios where hazardous emissions occur to support the risk characterization (ECHA, 2016a). Regulation (EC) No 1907/2006 - Annex I §5.2.1 specifies that “The exposure estimation entails three elements: (1) emission estimation; (2) assessment of chemical fate and pathways; and (3) estimation of exposure levels”. Considering various processes and use scenarios for nanocomposites, the safety assessment requires a systematic approach where documentation of emissions is a key factor; the emission source is a point-of-departure for exposure and health effects. A proper understanding of emission potentials can be used to estimate the upper limit for exposure during the nanocomposite life cycle by using mechanistic exposure models (WHO/IPCS, 2005). This can be used to quantify broadly applicable Conditions of Use (CoU) where the exposure is considered adequately controlled.
Identification of relevant exposure determinants and quantification of CoU was introduced by Koivisto et al. (2021). CoU describes the operational conditions and risk management measures that are needed to maintain exposure at a well-controlled level and is mandatory in chemical safety reporting (ECHA, 2016a). Koivisto et al. (2025a) presented how to optimize CoU so that the operational conditions are broadly applicable. However, the assessment requires quantitative information on emissions, emphasizing the need to understand emissions better.
Emission/release tests by mechanical treatment are systematically conducted in material durability tests (e.g. ASTM D4060-19; ASTM D1044-19; Bossa et al., 2021; Witkowski et al., 2024), particle collection for toxicological studies (Aznar Mollá et al., 2022; Mantecca et al., 2017; Moreno-Martín et al., 2025; Netkueakul et al., 2020), and characterizing properties of released particles and exposure potential (e.g. Bott & Franz, 2019a; Bott & Franz, 2019b; Fransman et al., 2016; Kuijpers et al., 2020; Wang & Qi, 2022). These experiments are generally conducted for material development and to understand the potential hazards of released particles, especially for nanocomposites. However, these studies rarely report emissions or emission factors, as Koivisto et al. (2017) recommended, that are needed for quantitative exposure assessment.
In this study, we 1) update the emission library related to mechanical treatment, 2) provide recommendations for emission/release measurement requirements to produce quantitative and useful information for generic exposure and risk assessment, 3) demonstrate CoU assessment, and 4) how well mechanistic models can predict exposure levels in a real work environment. Emission scaling is applied to demonstrate extrapolation of the emissions for different process parameters. These examples should bring motivation to systematic emission reporting instead of concentrations.
Methods
Emission library update for mechanical treatment
A literature review on emissions by mechanical treatment processes was performed using PubMed for years ≥2016 (a search was conducted in Nov 2024). The search string was (sanding OR abrasion OR drilling OR sawing OR cutting OR grinding OR milling OR shredding) AND nano* AND (emission OR concentration OR release) NOT drug NOT food).
Exposure modelling
Exposure modelling was conducted using Task Exposure Assessment Simulator (TEAS; version 1.05, Exposure Assessment Solutions, Inc., Missouri, U.S., www.easinc.co) well-mixed air model 1Box.CE.Gv (Hewett & Ganser, 2017). A well-mixed air model assumes that air in the room is always thoroughly mixed and that there are no other losses for concentrations than general ventilation exhaust. TEAS is a similar exposure model to the free software IH-MOD 2.0 provided by the American Industrial Hygiene Association (https://ihmod.org/). A primary difference between the two models is that TEAS explicitly addresses local exhaust ventilation while IH-MOD 2.0 does not.
Results and discussion
Literature review
The literature review resulted in 1337 results, and based on the title and abstract, 32 studies were considered to provide information on emission or release or sufficient information to calculate emissions. Bossa et al. (2021) was the only study reporting emission rates. Other studies did not provide information about emission rates (e.g., mg/min) or release rates (e.g., mg/(min × per treated surface area) or mg/(per treated surface area)). However, 10 of the 31 studies allowed for calculating emission rates, which are reported here (Underlying data 1, sheet “Review”).
Emission rates were obtained for sanding (Bossa et al., 2021; Cooper et al., 2017; Kang et al., 2017; Lee et al., 2020; Neubauer et al., 2017; Singh et al., 2022), drilling (Blazquez et al., 2020; Ding et al., 2017; Starost et al., 2017a; Starost et al., 2017b), sawing (Ding et al., 2017), milling (Blazquez et al., 2020), and abrasion (Bressot et al., 2017). Grinding or shredding studies were not found.
Measurements were mainly reported as number concentrations and/or mass concentrations. Concentrations were used to calculate the emissions by using dilution volume and process duration (Koivisto et al., 2017). Emission calculations are given in Underlying data 1, sheet “Emission calculations”.
Typically reported process parameters were matrix material and concentration of potential additives, tool speed (m/s or RPM; rounds per minute), tool properties (e.g., sander/abrader grade and area, drill tip diameter), perpendicular force, and process speed (e.g., mm/min for milling). Underlying data 1, sheet “Emissions,” gives contextual information and emissions for each study, such as underlying assumptions in calculations, composition of released particles, or particle measurement size range.
Tangential force, specific power input, or friction coefficients were reported only by Bossa et al. (2021). Without specific power input, the results apply only to the particular material and process (Bossa et al., 2021; Koivisto et al., 2017; Le Bihan et al., 2013).
Sanding
Particle number concentrations were reported for belt sanders and rotary sanders. Calculated particle number emissions varied from 104 to 108 #/s (Figure 1). Sanding experiments with different sandpaper grades suggest that fine-grade sandpaper (higher P-value) reduced the particle number emissions as compared to coarse-grade sandpaper (Figure 1; Kang et al., 2017; Lee et al., 2020).
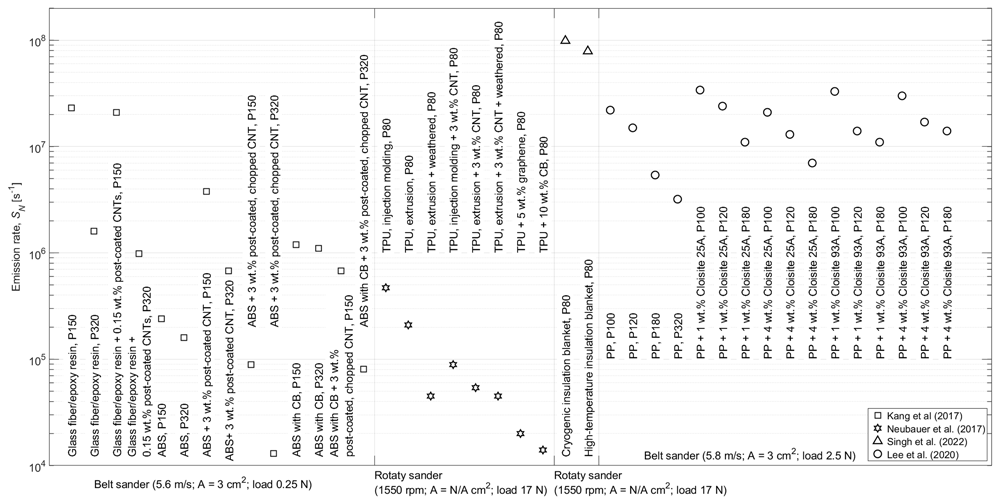
Figure 1. Particle number emissions for belt sanding.
Abbreviations: ABS acrylonitrile butadiene styrene; TPU thermoplastic polyurethane; PP polypropylene.
Mass concentrations for the sanding process were reported for belt sanders and random orbital sander processes (Cooper et al., 2017; Kang et al., 2017; Lee et al., 2020). Calculated emissions for glass fiber coated with epoxy resin varied from ca. 0.2 to 0.3 µg/s, ABS from 0.01 to 0.05 µg/s, PP from 0.004 to 0.03 µg/s, and plywood from <153 to 929 µg/s (Figure 2). Higher mass emission rates for plywood can be partially explained by the sanding surface area that was 42 times higher than in belt sanding experiments (Figure 2). Mass emissions were similar for glass fiber coated with epoxy resin and ABS for sandpaper grades P150 and P320 (Figure 2). During PP sanding, mass emission rates were reduced when the sandpaper grade was changed from P150 to P180 (Figure 2).
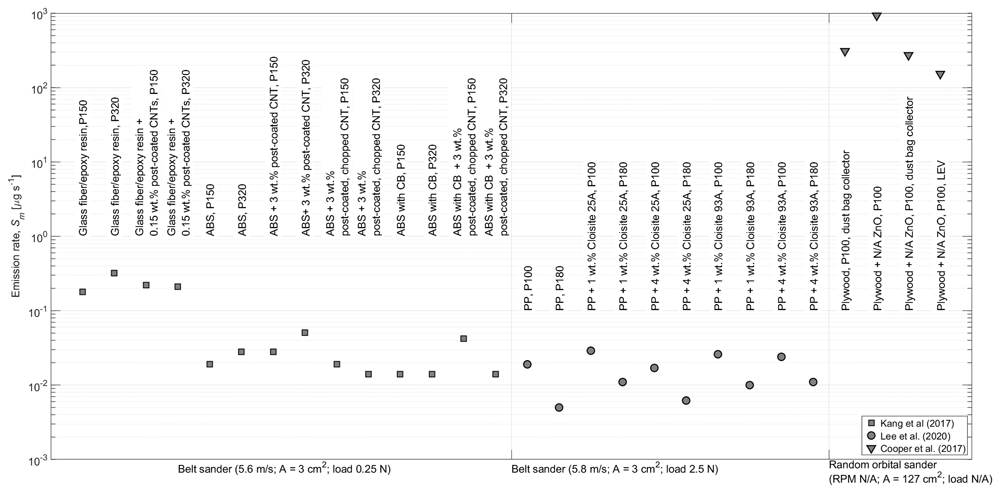
Figure 2. Particle mass emissions for belt sanding.
Abbreviations: ABS acrylonitrile butadiene styrene; PP polypropylene.
Drilling
Drilling experiments were conducted using drill bits with 3.5-, 4-, and 8-mm diameters, rotation speeds of 10000, 1880, and 1550 rpm, and drilling velocities of 78 mm/min and 13 mm/min (Figure 3). Calculated emissions for polyester and epoxy drilling were in the range of 4×10⁹ to 1010 #/s, while polypropylene emissions were in the range of 2×10⁵ to 8×10⁵ #/s even though the drilling parameters were the same (Figure 3). Polyurethane drilling emissions ranged from 9×10⁵ to 5×10⁶ #/s depending on the nanomaterial filler type, bit diameter, and rotation speed. Mass emission rates were not reported for drilling.
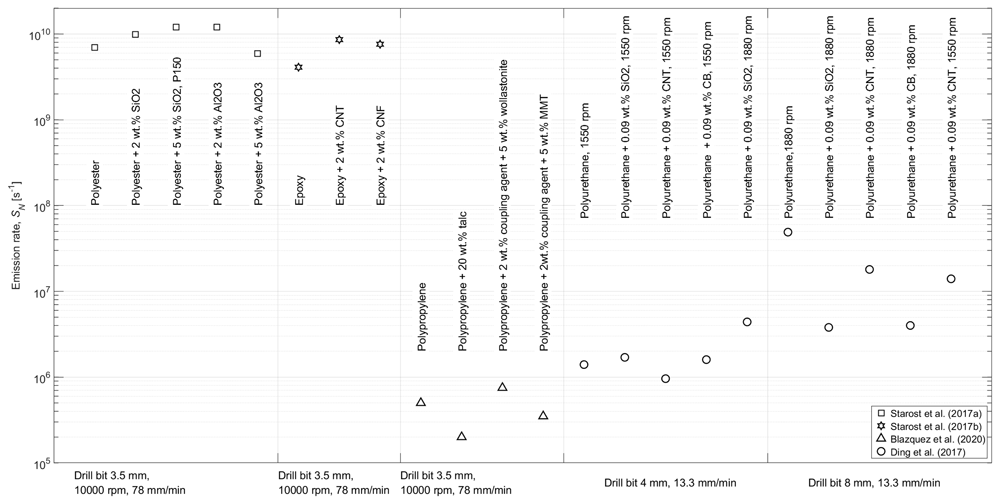
Figure 3. Particle number emissions for drilling.
Sawing, milling, and abrasion
Particle number concentrations were reported for sawing, milling, and abrasion experiments (Figure 4). Sawing was conducted with a polyurethane matrix by using a hand-held saw with a blade recommended for stainless steel cutting. For sawing, calculated emissions ranged from ca. 370 to 4300 #/s with an increasing trend when CNTs or carbon black were embedded in the matrix. Calculated emissions for Computer Numerical Control milling emitted from 5600 to 2×10⁴ #/s (Blazquez et al., 2020). The abrasion experiment was conducted with commercial tiles without and with TiO2 coating, for which the calculated emissions were 6×10⁶ #/s and 4×10⁴ #/s, respectively.
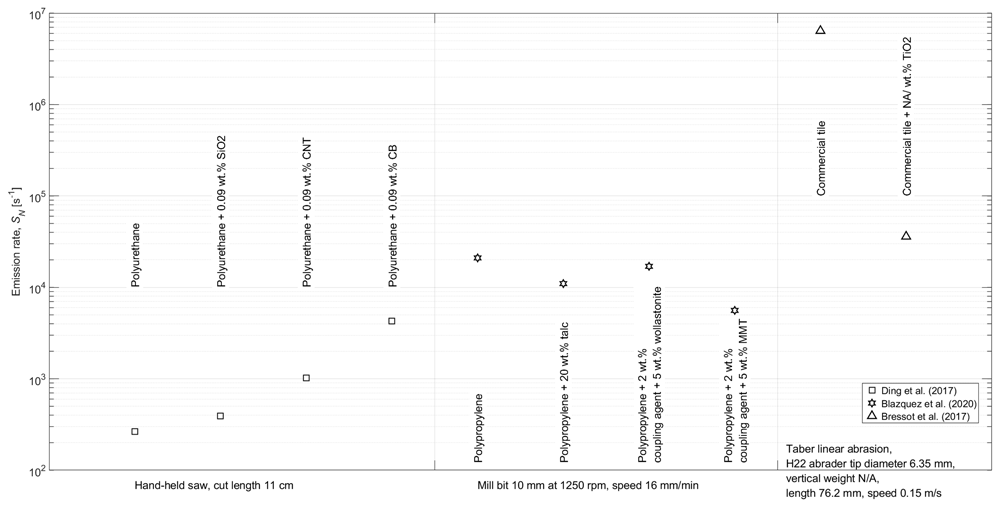
Figure 4. Particle number emissions for sawing, milling, and abrasion.
Statistical evaluation of the emissions
Emissions can be extrapolated for different process conditions when sufficient information is available. However, because the effects of process parameters and materials on the emissions and specific power input are not reported, the evaluation can be made only for measurements where one variable is changed at a time. Most of the studies were performed under specific conditions, and statistical relations cannot be calculated because of few measurements, even though clear trends can be seen between process parameters and emissions.
Lee et al. (2020) conducted PP sanding by using a belt sander (belt velocity 5.8 m/s, contact area 3 cm2, and load 0.25 N) and P100, P120, P180, and P320 sandpapers. Emissions showed a limited correlation for linear fit (R2 =0.72; Sn (#/s) = -75850 × Pvalue + 3 × 10⁷) and good correlation for power fit (R2 =0.98; Sn (#/s) = 5.0 × 10¹⁰ × Pvalue–1.70 (Underlying data 1, sheet “emissions”, Figure S1). The relation can be used to estimate emissions for other sandpaper grades. For example, based on an exponential fit, emissions for P1000-grade sandpaper would be 4×10⁵ #/s. However, emission extrapolation is uncertain because the specific power input may change significantly and may not follow the relation specified for the measurement range. Interpolation is expected to be reliable based on the correlation coefficient.
Lee et al. (2020) sanding experiments with PP showed a decreasing trend in particle number emissions when the sandpaper grade was changed from P100 to P180 (Figure 1). Similarly, Lee et al. (2020) showed that PP mass emissions were decreased when P100 was changed to P180 (Figure 2).
If the specific power input is known, more generic rules for mechanical machining emissions for specific materials can be made. Bossa et al. (2021) quantified the mass removed as a function of specific input power for polyethylene terephthalate glycol (PETG) containing 0, 0.5, and 2 wt.% CNTs. They calculated a relation for material removal rate (RMM, g/m2/s) and specific input power (P, J/s) as MRR = a × A × P, where a is a linear fit parameter and A (m2) is the abrasion surface area. The correlation (R2) between MMR and P was good ranging from 0.96 to 0.996. They applied this empirical relationship to estimate how much PETG is removed by adults chewing the plastic (Bossa et al., 2021). They also measured the fraction of airborne particles released by sanding for cut sizes of 10, 50, and 90 µm. This relation can be used to calculate air emissions for the respective PETG materials for various mechanical processes.
Recommendations for emission measurements
Koivisto et al. (2017) provided generic recommendations for emission/release measurement reporting. Here, more specific contextual information requirements for mechanical process emission reporting were identified (Table 1). For reporting, we provide an MS Excel data collection sheet that is recommended to provide easy access to the results and make the results applicable for exposure assessment (Underlying data 1, sheet “emissions”).
Table 1. Recommendations for reporting mechanical treatment emission measurements.
| Parameter | Reporting requirement | Recommendation |
|---|
| Material | Manufacturer and type of material and a
generic description of materials. | Provide a simple description of the treated material (e.g., glass fiber/
epoxy composite (70/30 wt.%). |
For layered materials, provide a description
of which layers were treated. |
Measurement
method | Measurement technique, calculation
methods, and assumptions (e.g., the
density of particles was assumed to be
matrix density). | Measurement of inhalable mass concentration by gravimetric
method is a standard requirement for risk assessment. Currently,
number or surface area concentrations are not used for risk
assessment. |
Uncertainty related to the measurements.
For example, uncertainties in unit
conversions and how well emissions were
captured by instruments (air mixing,
sampler capturing efficiency). | Log normal fit values if particle size distribution is measured. |
| Process | Process machine/tool manufacturer and
model. | Provide a short description of the process with key properties
(e.g., sanding, P120 sandpaper, rotation velocity/belt velocity, local
controls, automated/manual, power delivery (e.g., pneumatic/
electric), power input or torque, friction coefficient, material removal
rate, contact force/pressure, and process duration. |
Additional
requirements for
specific processes | Sanding | Contact area |
| Drilling | Drill bit diameter and type, and drilling velocity. |
| Cutting/sawing | Blade dimensions, blade type, cutting velocity, and cutting depth. |
| Milling | Mill bit diameter, type, milling velocity, and milling depth. |
| Abrasion | Abrader type and abrader velocity. |
Considering emission measurements, it is recommended that tool developers/manufacturers include them in their testbench emission measurements and reporting. The measurement conditions and reporting can be standardized to obtain harmonized emission measurements. This can be beneficial for a tooltip because the emissions would be measured for the materials that the tool is designed to be used, and CoUs can be specified and communicated in the tool use specifications.
Exposure and risk assessment under Reasonable Worst-Case Conditions
A worker exposure assessment was performed for an 8-h work shift under a reasonable worst-case condition (RWC). The room volume is assumed to be 20 m3, and air exchange rate (AER) is 0.6 1/h, as specified in ECHA (2016b). Deposition losses were assumed to be negligible favoring higher inhalation exposure, room air was considered to be thoroughly mixed, and the process was assumed to be continuous through the work shift. Exposure potential was calculated by using a well-mixed air model (TEAS, Model 1Box.CE.Gv; Hewett & Ganser, 2017). Exposure assessment was performed using different process parameters to demonstrate the emission scaling (Table 2). Modelling reports are given in Underlying data 2, and the calculated exposure levels are given in Table 2.
Table 2. Exposure assessment for selected processes.
Operational conditions: continuous process for 8-h, room volume 20 m3, air exchange ratio 0.6 1/h, emission controls are not applied. See scaling calculations from Underlying data 1, sheet “Emission scaling”.
| Scenario | Emission measurement | Sanding scenario | Emission scaling | Comments | Exposure level |
|---|
1. Belt sanding: Glass
fiber laminated with
epoxy resin + 0.15 wt.%
post-coated CNTs (Kang
et al., 2017) | 0.22 µg/s for P150
sandpaper, a 3 cm2
contact surface area, belt
speed of 5.6 m/s, and load
of 0.25 N | P150 sandpaper,
contact surface
area 12 cm2, belt
speed 5 m/s and
load of 0.25 N | Contact surface area
12/3= 4
Belt speed 5/5.6 = 0.89
Expected emission is 0.78
µg/s | Emission scaling
by contact
area is likely
overestimated
due to limited
particle escape | 186 µg/m3 |
2. Belt sanding: PP + 4
wt.% Cloisite 93A (Lee et al., 2020) | 0.024 µg/s for P100
sandpaper and 0.011 µg/s
for P180 sandpaper, a 3
cm2 contact surface area,
belt speed of 5.8 m/s, and
load of 2.5 N | P150 sandpaper,
contact surface
area 12 cm2, belt
speed 6 m/s and
load of 2.5 N | Sandpaper P150 by
using a liner regression
(-0.0001625*150+0.0403
= 0.016 µg/s)
Contact surface area 12/3
= 4
Belt speed 6/5.8 = 1.03
Expected emission is
0.067 µg/s | Emission scaling
by contact
area is likely
overestimated
due to limited
particle escape | 16 µg/m3 |
3. Drilling: Polyurethane
+ 0.09 wt.% SiO2 (Ding et al., 2017) | 3.8×10⁶ #/s for bit 8 mm,
1880 rpm, 13.3 mm/min | Bit 8 mm, 1880
rpm, 76 mm/min | Drilling speed 76 /13.3
= 5.7
Expected emission is
2.2×10⁷ #/s | Higher drilling
speed may not
increase linearly
particle number
emissions | 5.1×10³
#/cm3 |
4. Sawing: Polyurethane
+ 0.09 wt.% SiO2
(Ding et al., 2017) | 265 #/s for cut length 11
cm | Cut length 20 cm | Cut length 20/11 = 1.8
Expected emission is 482
#/s | Blade velocity
is assumed to
remain the same. | 0.11 #/cm3 |
5. Milling: Polypropylene
+ 2 wt.% coupling agent
+ 5 wt.% MMT (Blazquez et al., 2020) | 5.6×10³ #/s or bit 10 mm
at 1250 rpm, speed 16
mm/min | Bit 20 mm at
1250 rpm, speed
32 mm/min | Bit 20/10 = 2
Milling speed 32 /16 = 2
Expected emission is
2.2×10⁴ #/s | The drill bit cone
surface area is
not scaled | 5.3 #/cm3 |
6. Abrasion: Commercial
tile + NA/ wt.% TiO2
(Bressot et al., 2017) | 3.6×10⁴ #/s Taber linear
abrasion apparatus
Model 5750, H22 abrader
tip (diameter 6.35 mm;
vertical weight N/A),
abrasion speed 0.15 m/s | Abrasion with 10
mm tip, abrasion
speed 0.3 m/s | Abrasion area
Abrasion speed 0.3/0.15
= 2
Expected emission is
1.8×10⁵ #/s | Abrasion vertical
force is not
considered; tip
material is the
same as at the
H22 tip. | 430 #/cm3 |
Particle number concentrations varied from 0.11 #/cm3 (sawing) to 5100 #/cm3 (drilling) (Table 2). There are no health-based exposure limit values for particle number concentrations except for fibers (Pietroiusti et al., 2018), so a risk assessment cannot be conducted.
The exposure level for belt sanding glass fiber laminated with epoxy resin + 0.15 wt.% post-coated CNTs was 186 µg/m3 (Table 2). Kang et al. (2017) did not observe CNT protrusions in the particles collected from the air at a CNT concentration of 0.15 wt.%. However, protrusions were detected at higher concentrations, but individual CNT fibres were not detected. For fibrous nanomaterials, such as carbon nanotubes, the proposed OEL value is 0.01 fibers/cm3 (Mihalache et al., 2017). Detecting nanofibers at the concentration level of 0.01 fibers/cm3 would require evaluation of >105 micrograph images and is not currently feasible to conduct (Koivisto et al., 2018). Thus, a risk assessment is not possible for potential CNT exposure, and exposure level compliance cannot be declared for the proposed OEL for nanofibers.
For belt sanding PP + 4 wt.% Cloisite 93A scenario, the exposure level was 16 µg/m3 (0.64 µg-nanoclay/m3) (Table 2). Nanoclay protrusions were detected in 59% of the particles (Lee et al., 2020). For nanoclay, the proposed OEL value is 300 µg/m3 for respirable fraction and 4000 µg/m3 for inhalable fraction (Mihalache et al., 2017). As a worst-case assumption, all nanoclay can become bioavailable. Nanoclay concentration of 0.64 µg/m3 results in risk characterization ratios (RCRs; predicted concentration divided with the limit value) of 0.002 and 0.0002 for respirable and inhalable dusts, respectively. This is well below the proposed RCR of 1, and the nanoclay exposure can be considered adequately controlled. The results can be applied to the sanding scenario with the same process parameters and matrix as specified by Lee et al. (2020) and any room condition that favors lower exposure as specified here.
Emission scaling reliability testing by modelling exposure against workplace measurements
High-quality workplace measurement data with sufficient contextual information for predictive modelling was acquired from (OECD, 2021). One mechanical reworking emission scenario was found by Jensen et al. (2015) while other scenarios were mainly related to powder handling, synthesis, or spraying (Underlying data 1, sheet “Jensen et al.”).
Workplace measurements
Jensen et al. (2015) reported respirable mass concentrations during sanding of glass fiber/epoxy composite (70/30 wt.%, respectively) in an enclosed tent (12 m3; no ventilation). Sanding was performed using a pneumatic-driven angle grinder (GTG21 8500 RPM, Atlas Copco, Nacka, Sweden) without local exhaust ventilation. Sanding disk diameter or sandpaper type was not reported. We assumed that a maximum sanding disk diameter of 18 cm was used. Pneumatic angle grinders use pressurized air for power delivery that is considered not to emit particles. The airflow ranges from 600 to 1810 LPM, resulting in the average tent ventilation volume flow of 72.3 m3/h (range 36 to 109 m3/h). In a 12 m3 tent, this corresponds to an average ventilation rate of 6 1/h (range 3 to 9 1/h). Natural ventilation across the tent shell is assumed to be insignificant. The average sanding duration was 20 min per task. Jensen et al. (2015) mentions sanding papers P36 and P60 for another case performed in the facility for a similar sanding scenario. One of the sandpaper types is expected to be used in this sanding scenario because of task similarities.
Emission scaling
Emission rates for sanding of glass fiber/epoxy mixture was not found (PubMed [(glass AND (fiber OR fibre) AND epoxy) sanding]). Thus, emission scaling was performed by using emissions measured by Kang et al. (2017) during belt sanding of glass fiber laminated with epoxy resin. Uncertainties in emissions extrapolation from Kang et al. (2017) to Jensen et al. (2015) are summarized in Table 3. Kang et al. (2017) sanding scenario represents more sanding of epoxy rather than glass fiber/epoxy mixture as performed in Jensen et al. (2015). Emission scaling for material differences is impossible because of the lack of emission measurements.
Table 3. Assumptions and unknown uncertainties in the emission assessment.
| Uncertainty factor | Description | Unknown uncertainty |
|---|
| Material | Glass fiber/epoxy composite is like glass fiber laminated with epoxy resin. | Kang et al. (2017) did not report the detection of glass fiber particles, and the materials are representative only of the epoxy part. It is assumed that the friction between sandpaper and material. |
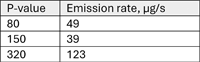
| Sandpaper | Epoxy sanding emission extrapolation from P150 and P320 sandpapers to glass fiber/epoxy composite emissions sanded by P36 to P60. | Emission extrapolation from fine to coarse grades is not expected to be linear (Table 3.1). Thus, emissions are assumed to be between 0.18 and 0.32 µg/s (uniform distribution) as measured for P150 and P320 sandpapers. Scaled emissions by sanding surface area result in an emission range of 15.3 to 27.1 µg/s.
Table 3.1. Sandpaper grade effect on emissions for Epoxy composites (Huang et al., 2012).
 |
| Sanding area | The sanding area was 3 cm2 at Kang et al. (2017) and 254 cm2 at Jensen et al. (2015). This results in a scaling factor of 84.8. Scaled emissions. | Sanding emissions may not increase linearly to the surface area because increased surface area limits the emissions to air. The contact area may vary during hand-held sanding. |
| Contact pressure | Contact pressure was 833 Pa in Kang et al. (2017). In Jensen et al. (2015), pressure based on a sanding machine weight of 1.6 kg was 624 Pa. | The effect of contact pressure on sanding emissions is not studied. |
| Sandpaper contact speed | The sanding belt speed was 5.6 m/s, while the pneumatic angle grinder sanding disk speed was at a 4.5 cm radius of 40 m/s (8500 RPM). | Huang et al. (2012) showed that mass emission rates were increased from 25 to 71 µg/s when sanding disk speed was increased from 586 RPM to 2167 RPM during sanding of Epoxy +2 wt.% CNTs (Koivisto et al., 2017). This was not considered here. |
| Measurement methods | Kang et al. (2017) calculated mass concentration from CPC and OPC (<30 µm particles) measurements, while Jensen et al. (2015) performed a gravimetric analysis of respirable samples (<4 µm particles). | Kang et al. (2017) used base material density and optical diameter, which depends on particle refractive index (e.g., Pinnick et al., 2000). Uncertainty related to size measurement was not considered. Sanding-generated airborne particles range up to tens of micrometers with mass size distribution mode around 10 µm (Huang et al., 2012; Kang et al., 2017). Ca. 20% of the released mass is in the respirable size range based on visual estimation from figures in Huang et al. (2012) and Kang et al. (2017). |
| Particle deposition | Particle deposition rate by gravitational settling is not considered at the model. | Particle mass size distribution was in the range of 2 to 30 µm based on OPC measurements (Kang et al., 2017). The deposition rate by gravitational settling is 1 and 7 1/h for 4 and 10 µm particles, respectively (Hussein et al., 2006). Compared to the tent average ACH of 6 1/h, the model overestimates the mass concentration of particles > 1 µm. |
| Other emission sources | Emission measurements consist of particles released from substrate and sandpaper. Engine emissions are separated from sanding emissions and ventilation air is filtered. | Sandpaper particle emissions were assumed to be outside of the respirable particle sampling range. |
Emissions measured by Kang et al. (2017) for P150 and P320, sandpaper grades were 0.18 and 0.32 µg/s. Extrapolation of Kang et al. (2017) emission measurements to P36 and P60 sandpaper grades are not expected to be linear for epoxy composites, as shown by Huang et al. (2012) (Table 3.1). Here, emissions are assumed to be between 0.18 and 0.32 µg/s (uniform distribution). The emission scaling of the sanding area was assumed to be linear (254 cm2/3 cm2), resulting in a scaling factor of 84.8. Huang et al. (2012) showed that sanding velocity increases emissions. The maximum velocity without load for the pneumatic angle grinder is 8500 RPM. Rotation speed with load is unknown, and the sanding velocity scaling was not performed. The effect of contact pressure on emissions is not studied, and the contact pressure during handheld sanding is not known why it was not applied here. Sanding emissions with the scaling factor from surface area results in 15.3 to 27.1 µg/s used in the calculations.
Exposure modelling
Exposure assessment was performed by a single-compartment model, which assumes that concentrations are always fully mixed (TEAS, Model 1Box.CE.Gv; Hewett & Ganser, 2017). Modelling was conducted by using Table 4 parametrization for a single task (20 min). Ventilation air caused by the pneumatic angle grinder was assumed to be a triangular distribution with minimum, average, and maximum values corresponding to the pneumatic angle grinder's minimum, average, and maximum flow rates. Modelling results for 10000 random days show that the geometric mean exposure level is 581 µg/m3, and the exposure distribution 95th percentile (P95) is 797 µg/m3 (see Underlying data 2 for the modeling report). The average respirable mass concentration measured inside the tent was 0.240 mg/m3 during the process (near-field concentration in Jensen et al., 2015).
Table 4. Model parametrization.
| Parameter | Value | Comment |
|---|
| Emission rate | Uniform distribution: range 15.3 to 27.1 µg/s | Surrogate for sandpaper grades between P36 and P60 |
| Tent volume | 12 m3 | Worker and process equipment volume is assumed to be insignificant compared to the tent volume. |
| Air changes per hour | Triangular distribution: mode 6, minimum 3, and maximum 9 1/h | Based on average, minimum, and maximum pneumatic angle grinder volume flows and the tent volume of 12 m3. Angle grinder power was assumed to be used mainly at average power. |
| Process duration | 20 min | Average sanding time at Jensen et al. (2015) |
| Emission time | 20 min | Continuous process |
Model reliability
Model reliability is related to the selected model construct and parameterization. Here, the emissions were likely to be well mixed, tent dimensions were well known, and process time was well known. Thus, the single-compartment model can be considered a reliable model to describe the concentrations inside the tent when the deposition of coarse particles is not considered. However, there are numerous uncertain factors that affect the emissions that are not studied, such as using epoxy as a surrogate for glass fiber/epoxy composite, scaling the emissions for smaller sandpaper grit sizes (smaller grit size refers to larger particle size of the abrasive media), and calculating mass concentration from OPC measurements (Table 3). It is likely that some of these unknown factors were underestimated, and others overestimated the emissions (e.g., sanding speed).
The calculated geometric mean exposure (581 µg/m3) level was 2.4 times higher than the measured respirable mass concentration in situ (240 µg/m3). However, modelling was performed for emissions in the particle size range up to 32 µm, and in situ, measurement was performed for respirable particles (4 µm particle size corresponding to the cumulative frequency of 50%) (Table 3). Uncertainty of mass concentration calculated from OPC number concentration measurement is not known because the light scattering signal depends on the particle properties (Pinnick et al., 2000). Thus, the uncertainty in comparing the measured respirable mass concentration with the mass concentration calculated from OPC measurements is unknown.
The assessment shows promising results considering the predicted and measured concentration ratio. However, emission rates can vary by several orders of magnitude depending on materials, tools, and tooltips (Figure 2). Without further emission measurements, assessing uncertainties or minimum-maximum ranges related to sanding emission extrapolation is challenging. Without proper uncertainty assessment, these modeling results provide subjective exposure estimates for the Jensen et al. (2015) scenario.
Comparison with modelling results reported in OECD (2021)
OECD (2021) applied Jensen et al. (2015) (scenario K5 in OECD (2021) Underlying data 1, sheet “Jensen et al.”) for performance testing as a part of the evaluation of tools and models for assessing occupational and consumer exposure to manufactured nanomaterials. Model testing was conducted for the Advanced REACH Tool (ART), MEASE, and Stoffenmanager (StM). Instead of using near-field concentration, they applied personal exposure measurement for comparison, which was 260 µg/m3. It is good to note that there is an error in unit conversion and OECD (2021) reports concentrations as 0.00026 µg/m3, which was used to calculate modelled and measured concentration ratios. Corrected model/measurement ratios were for ART, MEASE, and StM 3.6 (P90, inhalable fraction), 17.6 (respirable fraction), and 10.6 (inhalable fraction), respectively. However, modelling was performed for >1000 m3 of naturally ventilated rooms. This scenario does not reflect the work conditions described in Jensen et al. (2015) and should not be used for model evaluation or exposure assessment. ART and StM are qualitative models that are challenging to associate with a real work environment (Koivisto et al., 2022). MEASE theoretical background is like ART and StM and has similar challenges. It is also good to address that it is questionable to classify glass fiber/epoxy composite without nanomaterial additives as a nanomaterial, as classified in OECD (2021).
Interpretation of modelling results
The ECHA Guidance R14 (ECHA, 2016c) recommends using the P90 exposure level as a critical percentile to reflect all operational conditions described in a particular contributing scenario. The exposure is considered as adequately controlled if the P90 is below the OEL value. This accepts that 10% of the workers can have overexposure, which is not very convenient considering modelling uncertainties, variability in operational conditions, and uncertainties in modelling approaches, as demonstrated here.
A more convenient approach is the American Industrial Hygiene Association (AIHA) exposure category scheme that classifies exposure based on P95 as: 1. non-existent (P95 ≤ 0.01×OEL), 2. highly controlled (0.01×OEL ≤ P95 ≤ 0.1×OEL), 3. well controlled (0.1×OEL ≤ P95 ≤ 0.5×OEL), 4. controlled (0.5×OEL ≤ P95 ≤ OEL), and 5. poorly controlled (P95 > OEL) (Hewett et al., 2006; Torres et al., 2014). Based on the exposure rating there is an action list that needs to be conducted in order to minimize the overexposure (Hewett et al., 2006).
OECD (2021) reported 10 mg/m3 occupational exposure limit value as respirable dust for the Jensen et al. (2015) sanding dust emissions. The P95 concentration was calculated by using scaled emissions from Kang et al. (2017) was 797 µg/m3, which results in an RCR of 0.08. According to AIHA's human exposure categorization scheme, this limit corresponds to “highly controlled” exposure category 2, where “Exposures infrequently exceed 10% of the OEL” (Hewett et al., 2006). Typical safety actions for the “well controlled” category are “Chemical specific hazard communication” (Hewett et al., 2006).
Recommendations
We repeat the recommendations given by Koivisto et al. (2017) for emission/release measurements. We emphasize that particulate matter losses in the emission chamber and sampling should be evaluated in a systematic manner. It is recommended to develop emission chamber measurement standards for particulate emissions, such as volatile organic compounds (see, e.g., ISO 12219 series or ASTM D5116-17 guide). Specific reporting recommendations for mechanical treatment emissions are given in Table 1. REACH regulation (Regulation (EC) No 1907/2006) does not request specific surface area or particle number concentration measurements, but it is recommended to measure if legislation changes. Recently, particle number concentration was significantly associated with all-cause and cancer mortality (Pond et al., 2022), and surface area is associated with the acute influx of polymorphonuclear neutrophils in the lungs (Schmid & Stoeger, 2016). For manufacturers, it is recommended that they include emission measurements in their test benches. It would provide valuable information considering the tool tip efficiency and optimize the process considering emissions.
Conclusions
In REACH legislation, emission estimation is a mandatory part of exposure assessment. Process emission is the key parameter in predictive exposure assessment and setting Conditions of Use (CoU) for processes.
In this study, we updated the emission library compiled by Koivisto et al. (2017) for mechanical treatment of nanocomposites. From 32 emission studies, one reported emission rates, and for 12 studies, it was possible to calculate emissions. With a small effort, other studies could have reported emissions or provided sufficient contextual information to calculate the emissions. Thus, we provided emission reporting guidelines and an emission registry to help researchers and process developers report the emissions. For motivation, we presented examples of how to scale the emissions and assess CoUs for different processes. Nanomaterials hazard profiles are assessed in mass dose/concentration, which is why CoU assessment is not possible to perform for particle number emissions.
Exposure model performance was tested by reproducing concentration levels measured in a real industrial sanding scenario. Predicted concentration levels were 2.4 times higher than measured concentration levels suggesting sufficient predictive accuracy for regulatory chemical safety decision-making. Unfortunately, the assessment uncertainties were not possible to quantify due to differences in composite materials and measurement techniques. Currently, there are no statistical databases to evaluate the reliability of the emission extrapolation, and thus, the model result was considered a qualitative estimate for representing the workplace exposure scenario.
Ethic and consent
Ethical approval and consent were not required







