1. Introduction
For decades, photomultiplier tubes (PMTs) were the primary choice for light detection in various applications. However, advancements in semiconductor technology have given rise to silicon photomultipliers (SiPMs), which have transformed the landscape of photodetector technology. Since their inception in the 1990s, SiPMs give the possibility as a photon detector, displacing PMTs in many experiments due to their photon detection capabilities. SiPMs possess several advantages, including high photon detection efficiency (PDE), gain, linearity, compact size, low operating voltage, and insensitivity to magnetic fields1–5. These attributes have made them highly attractive for applications spanning nuclear physics, detector physics, medicine, industry, and cosmology4–9. Initially, their small sensitive area limited their applications to compact detectors or systems requiring fine-grain scintillators and fiber readouts. However, recent developments have expanded their sensitive area using single element arrays and produce large area devices (limited up to 36 mm2), enabling the use of SiPMs as replacements for PMTs, particularly in spectroscopy applications where large sensitive areas are required. Despite their advantages, large-area SiPMs face challenges, such as higher dark count rates (DCR), increased readout complexity, slower response times, and higher optical crosstalk (OCT). Moreover, a critical limitation is the increase in capacitance with the sensitive area, which affects detector performance. The capacitance of SiPMs directly affects their recovery time, gain, and noise characteristics. Larger SiPMs exhibit higher capacitance, which slows signal recovery, reduces gain stability, and increases noise levels. Additionally, at constant bias voltage large pixel capacitance worsens temperature dependence, making the detectors more sensitive to temperature variations10,11. Addressing this issue is essential for the development of large-area SiPMs, especially for applications requiring high performance and reliability.
SiPMs are mainly categorized into two main structural types: deeply buried and surface pixel structured photodiodes1,12. By comprehensively characterizing and comparing these two designs, this study aims to show the role of capacitance in SiPM development.
Furthermore, this work provides valuable insights into optimizing SiPM performance for diverse applications. Through a series of experimental studies, we demonstrate that the deeply buried pixel structure presents a promising solution to the capacitance challenge, paving the way for the development of next-generation SiPMs with enhanced performance.
2. Methods
This section describes the methodologies employed to evaluate the key parameters of SiPMs under investigation. The methods include breakdown voltage determination using three distinct techniques-current-voltage (I-V) characteristics, the Miller method, and the single photoelectron method-as well as capacitance-voltage (C-V) measurements and temperature dependence analysis of breakdown voltage.
2.1. I-V characteristics
The breakdown voltage (Ubd) is a key parameter for SiPM operation and must be accurately defined. This was achieved by calculating the derivative of the current with respect to voltage, normalized by the current itself, as expressed by the following expression 13–16. The breakdown voltage was defined as the voltage corresponding to the maximum value of the rate of change of the current.
The effect of temperature on the breakdown voltage was also investigated by these characteristics in a temperature range of 23°C to 43°C.
2.2. Miller method
The Miller method provides an alternative approach for determining the breakdown voltage. The Miller method involves measuring the luminous flux and subsequently determining the breakdown voltage by extrapolating the linear section of the inverse photocurrent versus voltage plot to the abscissa axis. The following formula was used for determining Ubr:
Here, Ubr is the breakdown voltage, Jt is total current, Jph is photocurrent, k is an empirical parameter that depends on the structure of the device and the wavelength of the light. The light currents were calculated from the difference between the total current and the dark currents.
2.3. Single photoelectron method
In this approach, the breakdown voltage is determined by measuring the dependence of pixel gain on overvoltage. The gain of a SiPM (M) is proportional to the applied overvoltage and it was determined by following equation17:
where Cpixel - pixel capacitance, Uapp.v - the applied voltage (Uapp.v⩾Ubreak.v), Ubreak.v - the breakdown voltage, m - coefficient which may change from 1 to 2 depending on the values of resistance of the depletion layer and the capacitance of the pixel, Kam - the amplification coefficient of the amplifier or preamplifier, q - electron charge and Aaverage- the corresponding ADC channel number to the amplitude of a single photoelectron.
The breakdown voltage is determined by applying a linear approximation to this relationship.
2.4. A method for measuring capacitance
Capacitance measurements were performed using an alternating sinusoidal signal with a constant amplitude and frequency. The SiPM capacitance was analyzed through a comparative assessment of the output signal amplitudes from the SiPM and a calibrated reference capacitance. The capacitance of the SiPMs was determined by comparing the output signal amplitudes from the SiPMs and the reference capacitor18. The measurements were conducted under reverse bias conditions, and the capacitance was calculated using the ratio of the sinusoidal signal amplitudes. The capacitance values of the SiPMs were defined by the following equation:
where Ad is the amplitude of the sinusoidal on SiPM, Aet is the amplitude of the sinusoidal on reference capacity and Cet is the nominal of the reference capacitance.
3. Experiment
This section details the experimental procedures employed to evaluate key parameters of SiPM devices. The following subsections describe information about studied samples, the experimental setups for each method and present the obtained results.
3.1. Samples
In this study, we investigate two SiPM designs: a deeply buried pixel structure (MAPD-3NM-II by Zecotek Photonics) and a surface pixel structure (MPPC S12572-010P by Hamamatsu Photonics). The first sample is a MAPD-3NM-II with deeply buried pixel structure from Zecotek Photonics. Its photosensitive area is 3.7×3.7 mm2, pixel pitch 15 μm, the total number of pixels – 6650019–22. The second sample was MPPC S12572-010P with surface pixel structure. Its photosensitive area is 3×3 mm2, pixel pitch 10 μm, the total number of pixels – 9000023,24. Figure 1 presents schematic drawings of both structure.
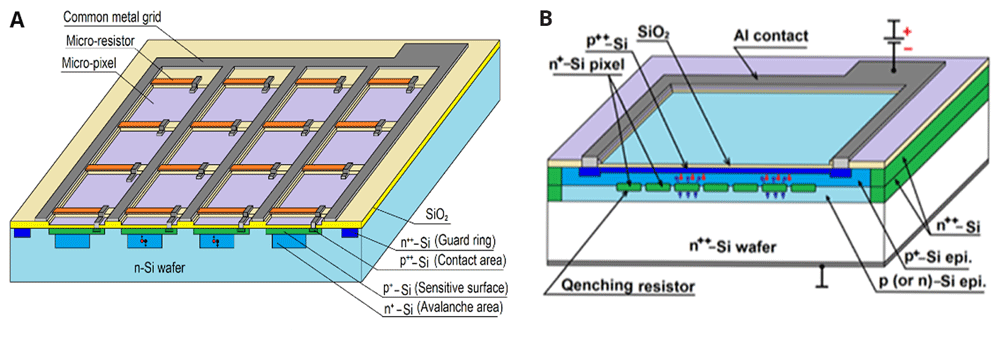
Figure 1.
Schematic drawings of surface (a) and deeply burned (b) SiPM. This pictures has been reproduced with permission from 12.
Incident photons are absorbed in the epi layer or substrate, generating electron-hole pairs. In the reverse-biased p-n junctions, the high electric field accelerates carriers, triggering an avalanche process, resulting in a detectable current pulse. The quenching resistor stops the avalanche by reducing the local voltage across the microcell, allowing it to reset for the next photon detection. Quenching resistors (micro-resistors) in surface-structured SiPMs regulate the avalanche process, whereas in deeply burned structures, this control is achieved through the charge accumulated in the micro-wells12.
3.2. Breakdown voltage determination by I-V characteristics
Figure 2 presents a schematic diagram of experimental setup for I-V measurement. To minimize the influence of ambient light, the samples were placed in a light isolated box and additionally insulated with a black dense material. The samples were biased by a Keithley 6487 picoammeter voltage source (Keithley Instruments, USA)25. Temperature monitoring of the samples was performed using a highly sensitive platinum temperature sensor (PT100) capable of measuring with an accuracy of ±0.1 °C, ensuring precise thermal readings throughout the experiment26. In addition, Mastech MY62 multimeter (Mastech, Taiwan) was employed to monitor the internal temperature of the box. The Hantek DSO5202P oscilloscope (Hantek, China) with a 50 Ω input was used to visualize any potential changes in the setup. Its 50 Ω input was used as a ground.
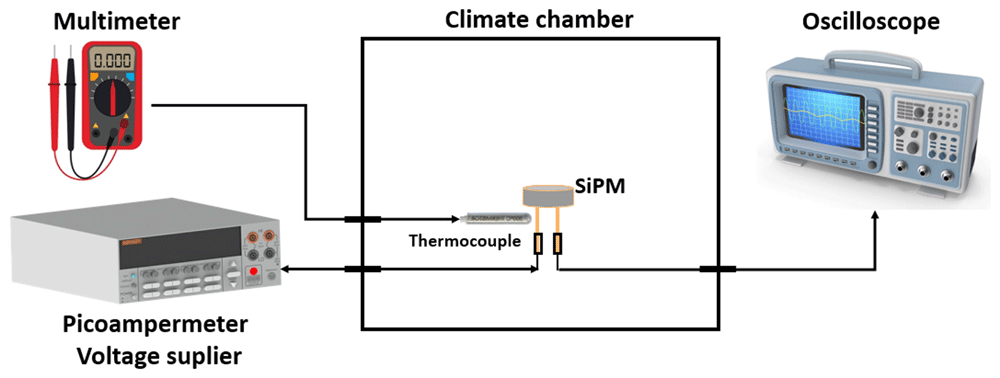
Figure 2. Schematic diagram of the experimental setup for measuring I–V characteristics at different temperatures.
Figure 3 shows reversed I-V characteristics on a logarithmic scale for both samples at room temperature. By analyzing the current-voltage (I–V) characteristics, using indicated expression in the subsection 2.1., the operating voltage and breakdown voltage of the photodiodes were determined as shown in Figure 4.
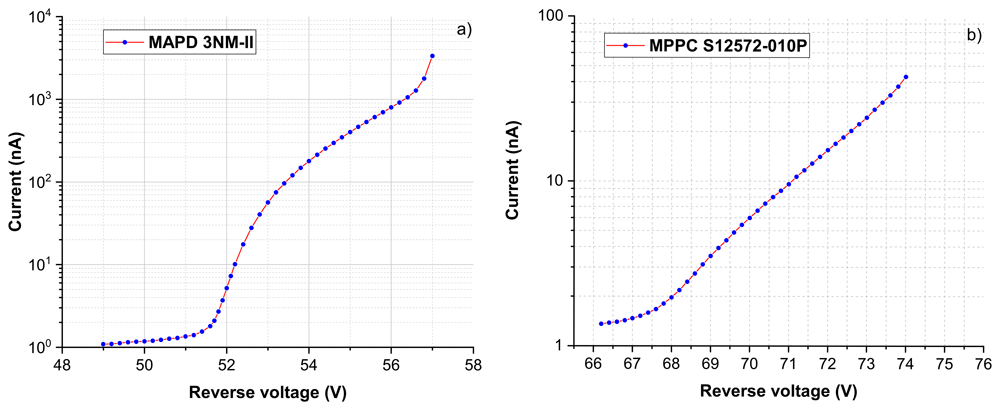
Figure 3. I-V curves for SiPMs at room temperature (T=23 ºC).
MAPD 3NM-II (a) and MPPC-S12572-010P (b).
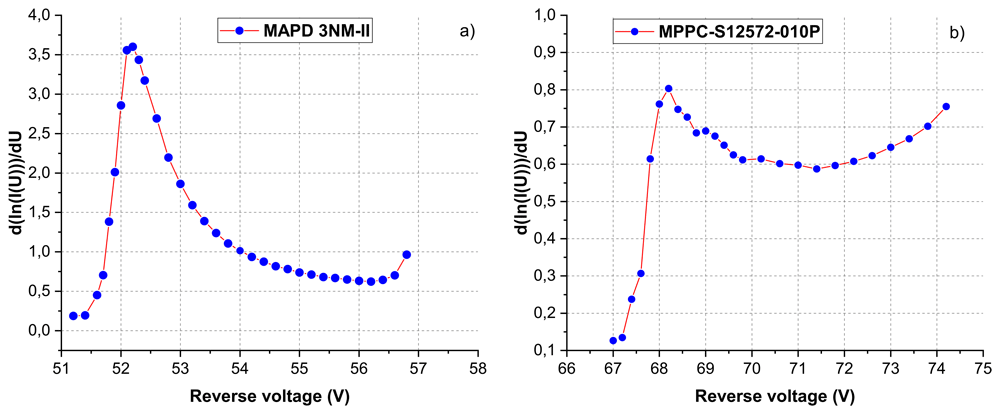
Figure 4. Determination of breakdown voltages from I–V characteristics at T=23 ºC using the differentiation method.
Ubr was determined to be 52.16±0.07 V for the MAPD-3NM-II and 68.17±0.11 V for the MPPC S12572-010P at room temperature using the differentiation method. The optimal operating voltage for the MAPD-3NM-II was determined to be Ubr+4 V, while it was found to be Ubr+4.5 V for the MPPC S12572-010P.
3.3. Breakdown voltage determination by Miller method
Schematic diagram of the experimental setup for Miller method was shown in Figure 5. The light power was chosen in such a way that the light current was equal to 20–50% of the dark current of the photodiode at a low voltage across it (5–10 volts). In our case, the pulse with a frequency of 10 kHz and a pulse length of 30 ns was supplied from the Tektronix AFG3101 generator (Tektronix Inc., USA) to the LED, which emits photons with 450 nm wavelength. The amplitude of the supplied signal was different and depended on the type of sample being studied since each of them had a different dark current.
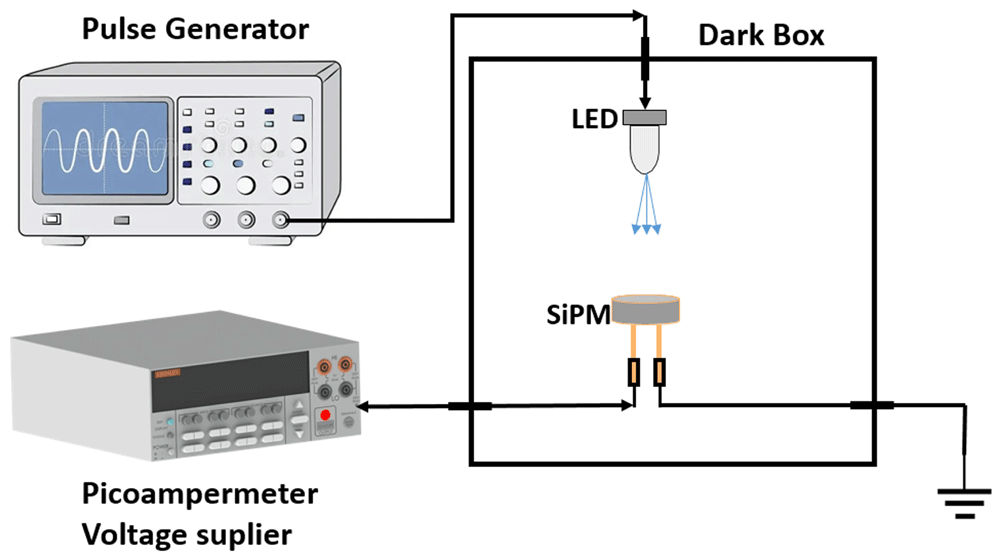
Figure 5. Schematic diagram of the experimental setups for measuring breakdown voltage using Miller method.
The reverse photocurrent 1/Jph dependence on the applied voltage was plotted in Figure 6 for each sample.
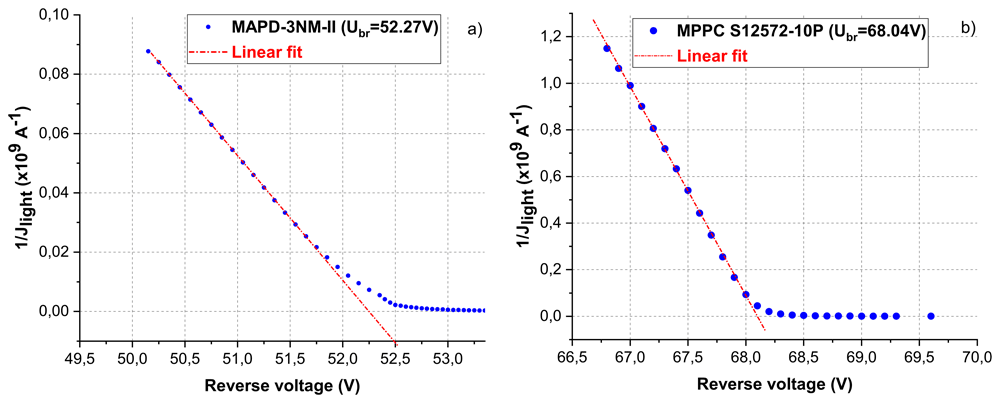
Figure 6. The dependence of the inverse value of the photocurrent on the reverse voltage for MAPD-3NM-II (left) and MPPC S12572-010P (right).
The approximation of the linear sections (before the inflection) was the point of intersection of the line with the abscissa axis and matches with the breakdown voltage in Figure 6. Using Miller method, breakdown voltages for MAPD-3NM-II and MPPC were determined to be 52.25±0.11 V and 68.09±0.13 V, respectively.
3.4. Breakdown voltage determination by the single photoelectron method
The experimental scheme is shown in Figure 7. Since the output amplitude of the registered photons from a photomultiplier is small, a preamplifier was used to amplify the signal. The signal from the output of the preamplifier (a preamplifier with a gain of 40) is directed to the input of an analog-to-digital converter (ADC) CAEN DT5720 (12 bit 250 MS/s) (CAEN, Italy). Same pulse generator and picoammeter voltage source indicated above was used in this setup. Simultaneously, the digitizer was synchronized with the pulse generator to minimize noise.
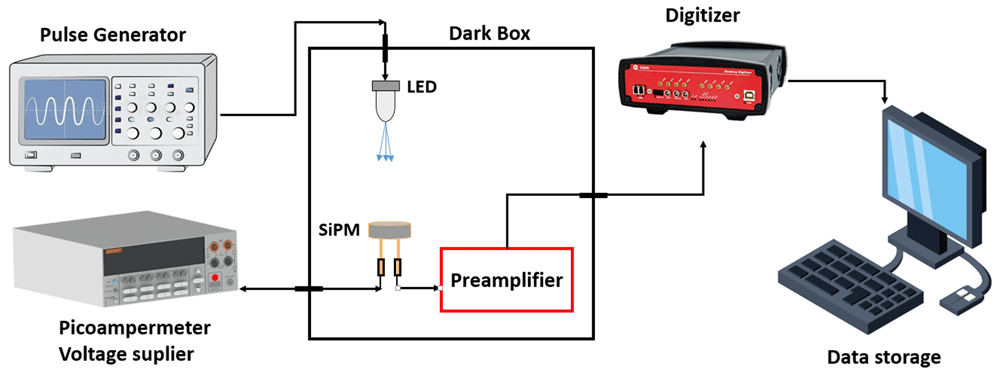
Figure 7. Schematic diagram of the experimental setup for measuring the single-photoelectron spectrum.
Figure 8 provides a detailed single photoelectron spectrum for the MAPD-3NM-II. The presence of distinct peaks confirms the successful detection and amplification of single-photon events. The separation between peaks allows for precise measurement of SiPM gain and, ultimately, the determination of the breakdown voltage.
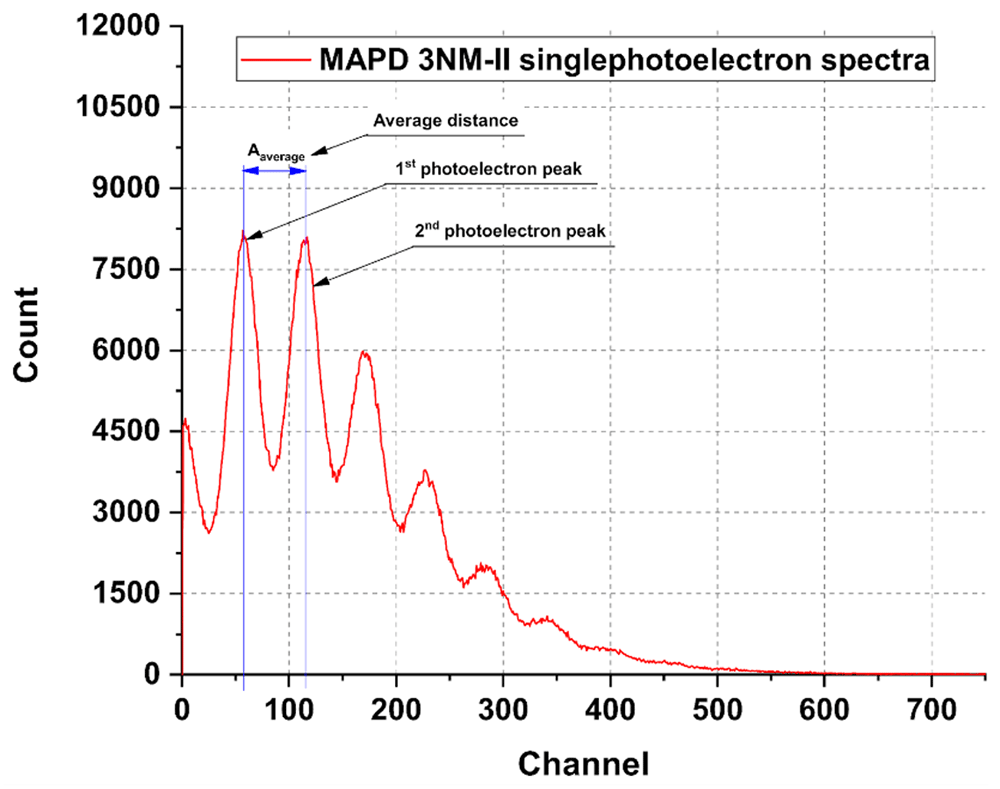
Figure 8. Single photoelectron spectrum for MAPD-3NM-II.
The internal gain (M) at different reverse voltage was calculated considering related parameters (Kam=40, q=1.602*10-19 C, the charge per channel of the CAEN digitizer = 40 fC) in Equation 2. For both sample, the internal gain dependence on voltage was presented in Figure 9. Notably, the internal gain exhibits a linear dependence on the operating voltage. As the voltage increases, the internal gain proportionally grows up, and the intersection of the approximation of the experimentally obtained points, where equal approximately to zero, was taken as a breakdown voltage (Uapp.v≈ Ubreak.v). The values obtained using gain are very close: 52.29±0.06 V for MAPD-3NM-II and 67.98±0.09 V for MPPC S12572-010P.
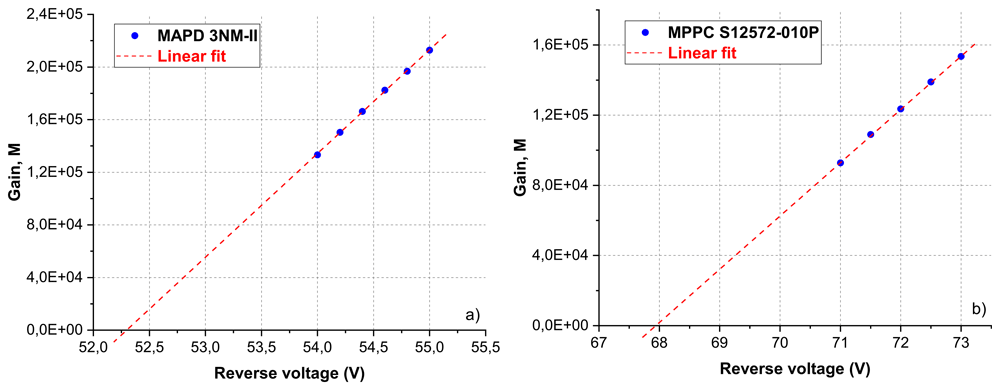
Figure 9. The dependence of the gain on the applied voltage for MAPD 3NM-II (left) and MPPC-S12572-010P (right) at T=23 ºC.
The IV breakdown determination gives in general slightly larger values of maximum 0.5 V higher as compared to the method determining the breakdown by extrapolating the gain to zero. The IV method is more correct, because in reality the gain at Vbd is not really zero since the SiPM already has a small avalanche gain before the Geiger mode starts (avalanche photodiode regime). An additional advantage of the IV method is that it can be easily obtained, and in general, measurement of the I-V characteristic is fast and applicable for device monitoring.
3.5. Dependence of breakdown voltage on temperature
To determine the temperature coefficient of the breakdown voltage and investigate its temperature dependence, I-V characteristics were measured using the experimental setup shown in Figure 2 in the a temperature range of 23°C to 43°C, with increments of 5°C. The temperature of the samples was monitored using a highly sensitive platinum temperature sensor (PT100), which provides an accuracy of ±0.1°C, ensuring precise thermal readings throughout the experiment. The results in Figure 10 (a) (MAPD-3NM-II) and Figure 11(a) (MPPC-S12572-010P) show the breakdown voltages measured at different temperatures for both devices. These data were used to plot the dependence shown in Figure 10 (b) and Figure 11 (b), which presents the determination of the temperature coefficient of the breakdown voltage.
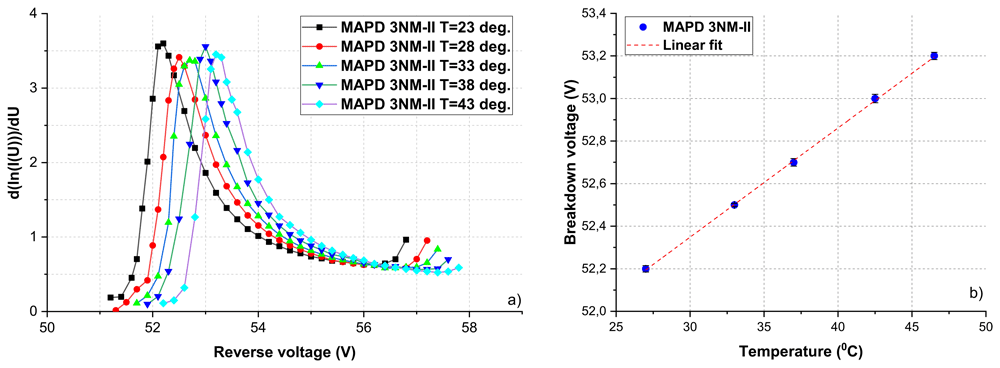
Figure 10. Temperature dependence of the breakdown voltage for MAPD-3NM-II within the 23ºС÷43ºС range.
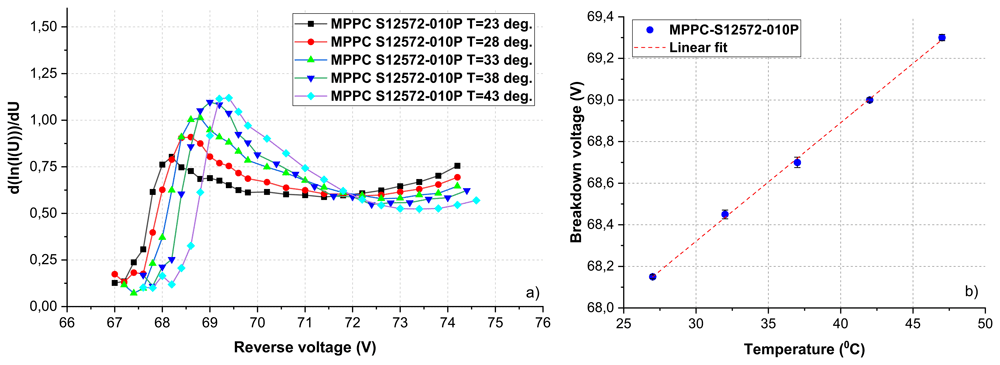
Figure 11. Temperature dependence of the breakdown voltage for MPPC-S12572-010P within the 27ºС÷47ºС range.
The breakdown voltage Ubr as a function of temperature can be approximated using a linear fit, represented by Equation (4). This approach allows for the determination of the temperature coefficient, denoted as a, which characterizes the rate of change of the breakdown voltage with respect to temperature:
where Ubr is breakdown voltage at fixed temperature. The linear fit results for MAPD-3NM-II and MPPC S12572-010P are presented below:
As shown in Equation (5) and Equation (6), the temperature coefficients of the breakdown voltage were determined to be 57.01±0.56 mV/°C for the MPPC S12572-010P and 51.32±0.44 mV/°C for the MAPD-3NM-II27. The increase in breakdown voltage with temperature can be attributed to phonon scattering. As temperature increases, lattice vibrations intensify, scattering carriers more frequently and reducing their mean free path. This makes it harder for carriers to gain enough energy for impact ionization, leading to a higher voltage requirement for breakdown. This temperature dependence can be reduced by increasing the doping concentration in the low-doped region of the photodiode. However, this approach also leads to a decrease in the breakdown voltage itself.
3.6. Capacitance determination by C-V characteristics
Figure 12 shows a setup for measuring C–V characteristics. The capacitance measurement was carried out through a comparative analysis of the output signal amplitudes derived from SiPM and the reference capacitance. In this experimental setup, the capacitor with a capacitance of 200 pF with 5% error is used as a reference. A reversed-bias voltage is applied to the common contacts (located in a dark box) from the voltage source.
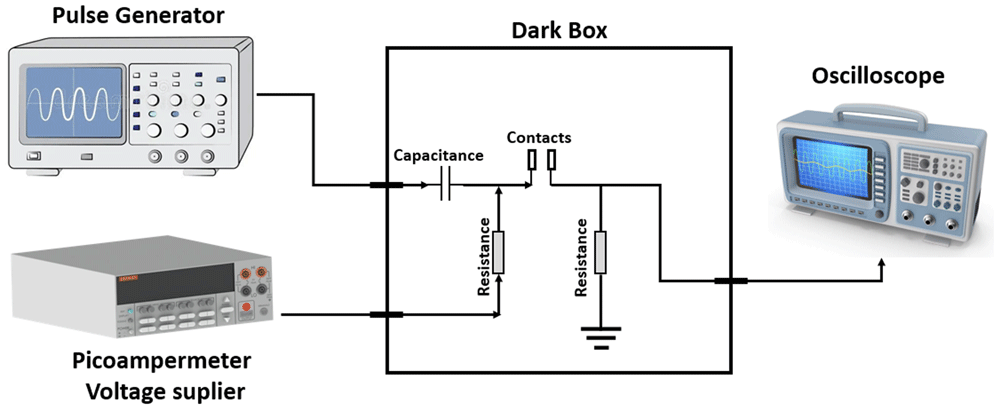
Figure 12. Schematic diagram of the experimental setup for measuring C–V characteristics.
At the same time, a sinusoidal input signal with an amplitude of 500 mV and a frequency of 1 MHz is supplied from the generator to the SiPM contact (either anode or cathode, depending on the source polarity). The output signal is captured using the oscilloscope. Subsequently, the capacitance values of the reference are recalculated to determine the capacitance of the SiPM. The ratio of sinusoidal signal amplitudes leads to obtaining the ratio of the capacitances of the reference and our samples. The capacitance values of the SiPMs were defined by Equation 3. C-V characteristics measured at 23ºC are presented in Figure 13.
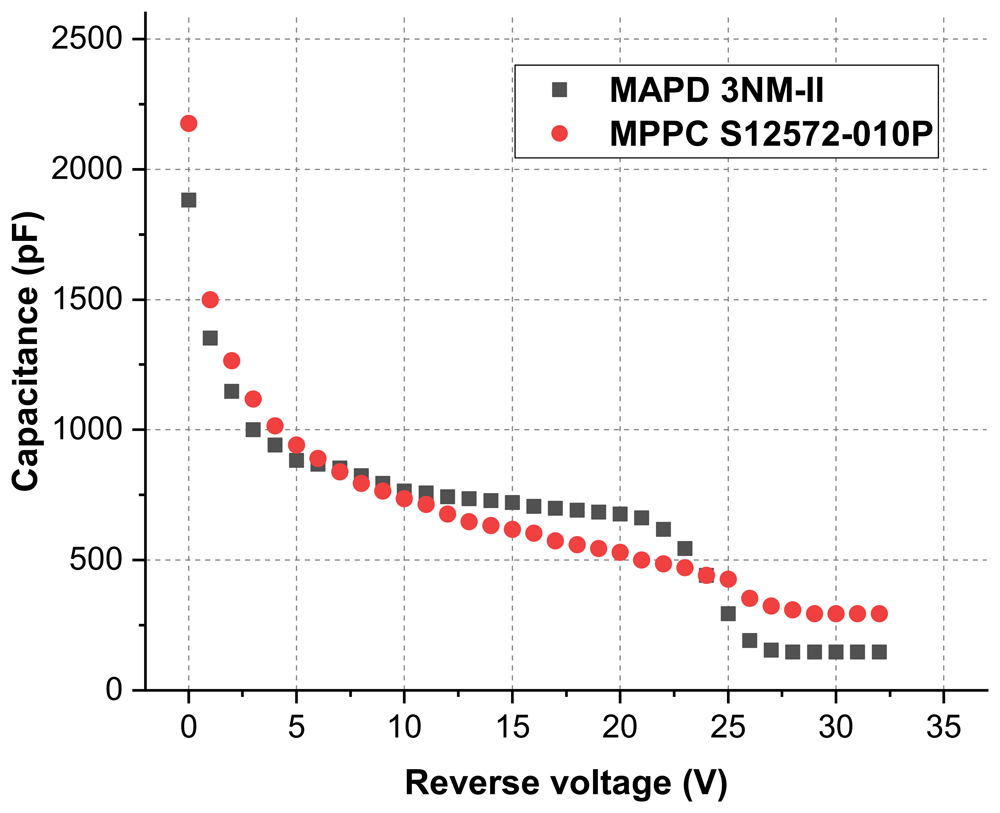
Figure 13. C-V characteristics at T=23ºC.
As the potential difference across the photodiode increases, the p-n junction becomes depleted and when the applied voltage equals 28 V, the active volume of SiPM is fully depleted. The subsequent increase in voltage causes only an increase in the electric field in the active volume and in this case, the capacitance of SiPM is constant28. The capacitance of the MAPD-3NM-II was determined to be 155±12 pF, while the MPPC S12572-010P exhibited a significantly higher capacitance of 294±26 pF - nearly twice that of the MAPD-3NM-II18.
3. Conclusion
In this study, the performance of MAPD-3NM-II and MPPC S12572-010P silicon photomultipliers was investigated, focusing on key parameters such as breakdown voltage, capacitance, internal gain, and temperature dependence. Breakdown voltage was determined using three distinct methods: the I-V characteristics method, the Miller method, and the single photoelectron method. The results from all three methods were consistent, yielding a breakdown voltage of 52.22±0.07 V for MAPD-3NM-II and 68.08±0.10 V for MPPC S12572-010P, within experimental errors. The overvoltage for the two diodes was determined to be Ubr+4 V for MAPD-3NM-II and Ubr+4.5 V for MPPC S12572-010P.
The temperature dependence of breakdown voltage was also investigated using I-V characteristics, providing insights into the thermal stability of both devices. The study revealed a lower temperature coefficient of breakdown voltage for the MAPD-3NM-II (51.32±0.44 mV/°C) compared to the MPPC S12572-010P (57.01±0.56 mV/°C). Capacitance measurements were performed using a sinusoidal signal with constant amplitude and frequency, with reference capacitance utilized for calibration. The MAPD-3NM-II exhibited a capacitance of 155±12 pF, significantly lower than 294±26 pF observed for MPPC S12572-010P, highlighting the advantage of the deeply buried pixel structure in reducing capacitance. The obtained results contribute to a better understanding of SiPM performance and offer insights into optimizing their design for various scientific and industrial applications, including medical imaging, particle physics, and environmental monitoring.
Data availability
Open Science Framework: Characterization of silicon photomultipliers with different structures.
https://doi.org/10.17605/OSF.IO/VDA5G29
This project contains the following data:
Fig 3a vs 3b.xlsx (Current - Voltage curves for MAPD-3NM-II and MPPC-S12572.)
Fig 4a vs 4b.xlsx (Determination of breakdown voltages from I–V characteristics using the differentiation method.)
Fig 6a.xlsx (The dependence of the inverse value of the photocurrent on the reverse voltage for MAPD-3NM-II)
Fig 6bxlsx (The dependence of the inverse value of the photocurrent on the reverse voltage for MPPC S12572-010P.)
Fig 8.xlsx (Single photoelectron spectrum)
Fig 9a vs 9bxlsx (The dependence of the gain on the applied voltage for MAPD 3NM-II and MPPC-S12572-010P.)
Fig 10a.xlsx (Temperature dependence of the breakdown voltage for MAPD-3NM-II within the 23ºC÷43ºC range).
Fig 10b_vs_ Fig11b.xlsx (determination of the temperature coefficient of the breakdown voltage)
Fig 11a.xlsx (Temperature dependence of the breakdown voltage for MPPC-S12572-010P within the 23ºC÷43ºC range)
Fig 13.xlsx (Capacitance-Voltage characteristics)
Data are available under the terms of the Creative Commons Zero "No rights reserved" data waiver (CC0 1.0 Public domain dedication).
Extended data
Open Science Framework: Characterization of silicon photomultipliers with different structures.
https://doi.org/10.17605/OSF.IO/VDA5G 29
This project contains the following data:
Figure 1a.tiff (Schematic drawings of surface pixel structure)
Figure 1b.tiff (Schematic drawings of deeply buried pixel structure)
Figure 2 (Schematic diagram of the experimental setup for measuring I–V characteristics at different temperatures.)
Figure 3a.tiff (I-V curves for MAPD 3NM-II)
Figure 3b.tiff (I-V curves for MPPC-S12572-010P)
Figure 4a.tiff (Determination of breakdown voltages from I–V characteristics for MAPD-3NM-II)
Figure 4b.tiff (Determination of breakdown voltages from I–V characteristics for MPPC-S12572-010P)
Figure 5.tiff (Schematic diagram of the experimental setups for measuring breakdown voltage using Miller method.)
Figure 6a.tiff (The dependence of the inverse value of the photocurrent on the reverse voltage for MAPD-3NM-II)
Figure 6b.tiff (The dependence of the inverse value of the photocurrent on the reverse voltage for MPPC S12572-010P).
Figure 7.tiff (Schematic diagram of the experimental setup for measuring the single-photoelectron spectrum)
Figure 8.tiff Single photoelectron spectrum
Figure 9a.tiff (The dependence of the gain on the applied voltage for MAPD 3NM-II)
Figure 9b, Gain_M_MPPC_S12572.tiff (The dependence of the gain on the applied voltage for MPPC-S12572-010P)
Figure 10a.tiff (Temperature dependence of the breakdown voltage for MAPD-3NM-II within the 23ºC÷43ºC range)
Figure 10b.tiff (Determination of the temperature coefficient of the breakdown voltage for MAPD-3NM-II)
Figure 11a.tiff (Temperature dependence of the breakdown voltage for MPPC-S12572-010P within the 27ºC÷47ºC range)
Figure 11b.tiff (Determination of the temperature coefficient of the breakdown voltage for MPPC-S12572-010P )
Figure 12.tiff (Schematic diagram of the experimental setup for measuring C–V characteristics)
Figure 13.tiff (C-V characteristics at T=23ºC)
Data are available under the terms of the Creative Commons Zero “No rights reserved” data waiver (CC0 1.0 Public domain dedication)
Acknowledgments
We would like to thank Zecotek Photonics Inc. for providing MAPD samples.
Faculty Opinions recommendedReferences
- 1.
Renker D, Lorenz E:
Advances in solid state photon detectors.
J Instrum.
2009; 4: P04004. Publisher Full Text
- 2.
Ponento A, Martoff CJ, Jones D, et al.:
The Silicon Photomultiplier as a modern solid-state replacement of the vacuum photomultiplier tube.
J Instrum.
2019; 14: T08003. Publisher Full Text
- 3.
Holik M, Ahmadov F, Ahmadov G, et al.:
Miniaturized read-out interface “Spectrig MAPD” dedicated for Silicon Photomultipliers.
Nucl Instrum Methods Phys Res A.
2020; 978: 164440. Publisher Full Text
- 4.
Akbarov RA, Ahmadov GS, Ahmadov FI, et al.:
Fast neutron detectors with Silicon Photomultiplier readouts.
Nucl Instrum Methods Phys Res A.
2019; 936: 549–551. Publisher Full Text
- 5.
Sadigov A, Ahmadov F, Ahmadov G, et al.:
Performance of styrene polymerized plastic scintillator with micropixel avalanche photodiode.
Radiat Meas.
2024; 171: 107061. Publisher Full Text
- 6.
Ahmadov F, Ahmadov G, Guliyev E, et al.:
New gamma detector modules based on micropixel avalanche photodiode.
J Instrum.
2017; 12: C01003. Publisher Full Text
- 7.
Ahmadov F, Anfimov N, Krumshtein Z, et al.:
New alpha particle counter based on micro-pixel avalanche photodiode.
Journal of Radiation Researches.
2014; 1(1): 32–35. Reference Source
- 8.
Sadigov A, Suleymanov S, Ahmadov F, et al.:
Performance of a new photo detector for ionizing radiation.
Journal of Radiation Researches.
2014; 77(2): 5. Reference Source
- 9.
Garutti E:
Silicon Photomultipliers. Handbook of Particle Detection and Imaging. Springer, Cham, 2021; 495–514. Publisher Full Text
- 10.
Nuriyev S, Ahmadov F, Sadygov Z, et al.:
Performance of a new generation of micropixel avalanche photodiodes with high pixel density and high photon detection efficiency.
Nucl Instrum Methods Phys Res A.
2018; 912: 320–322. Publisher Full Text
- 11.
Sun Y, Choi K, Maricic J, et al.:
Silicon Photomultiplier low temperature characterization for future neutrino detectors.
J Phys Conf Ser.
2017; 888: 012068. Publisher Full Text
- 12.
Sadygov Z, Olshevski A, Chirikov I, et al.:
Three advanced designs of micro-pixel avalanche photodiodes: their present status, maximum possibilities and limitations.
Nucl Instrum Methods Phys Res A.
2006; 567(1): 70–73. Publisher Full Text
- 13.
Nagy F, Hegyesi G, Kalinka G, et al.:
A model based DC analysis of SiPM breakdown voltages.
Nucl Instrum Methods Phys Res A.
2017; 849: 55–59. Publisher Full Text
- 14.
Akbarov RA, Nuruyev SM, Ahmadov GS, et al.:
Scintillation readout with MAPD array for gamma spectrometer.
J Instrum.
2020; 15: C01001. Publisher Full Text
- 15.
Ahmadov G, Ahmadov F, Holik M, et al.:
Gamma-ray spectroscopy with MAPD array in the readout of LaBr3 scintillator.
J Instrum.
2021; 16: P07020. Publisher Full Text
- 16.
Gundacker S, Heering A:
The Silicon Photomultiplier: fundamentals and applications of a modern solid-state photon detector.
Phys Med Biol.
2020; 65(17): 17TR01. PubMed Abstract
| Publisher Full Text
- 17.
Nuruyev S, Ahmadov G, Sadigov A, et al.:
Performance of Silicon Photomultipliers at low temperature.
J Instrum.
2020; 15: C03003. Publisher Full Text
- 18.
Ahmadov F, Ahmadov G, Akbarov R, et al.:
Investigation of parameters of new MAPD-3NM-II Silicon Photomultipliers.
J Instrum.
2022; 17: C01001. Publisher Full Text
- 19.
Holik M, Ahmadov F, Sadygov A, et al.:
Investigation of the possibility of a new detector based on SiPM in nuclear forensics.
J Instrum.
2023; 18: C01015. Publisher Full Text
- 20.
Holik M, Ahmadov F, Sadigov A, et al.:
Gamma ray detection performance of newly developed MAPD-3NM-II photosensor with LaBr3(Ce) crystal.
Sci Rep.
2022; 12(1): 15855. PubMed Abstract
| Publisher Full Text
| Free Full Text
- 21.
Nuruyev S, Berikov D, Akbarov R, et al.:
Neutron/gamma scintillation detector for status monitoring of accelerator-driven neutron source IREN.
Nucl Eng Technol.
2024; 56(5): 1667–1671. Publisher Full Text
- 22.
https://zecotek.com/
- 23.
https://www.hamamatsu.com/eu/en.html
- 24.
Akbarov R, Nuruyev S, Ahmadov FI, et al.:
Scintillation light detection with MAPD-3NK and MPPC-S12572-010P readout.
KnE Energy.
2018; 3(1): 357–362. Publisher Full Text
- 25.
https://thekeithley.com/
- 26.
https://www.picotech.com/library/application-note/pt100-platinum-resistance-thermometers
- 27.
Sadigov AZ, Ahmadov FI, Sadygov ZY, et al.:
Improvement of parameters of micro-pixel avalanche photodiodes.
J Instrum.
2022; 17: P07021. Publisher Full Text
- 28.
Ahmadov F, Abdullayev F, Akberov R, et al.:
On iterative model of performance of micropixel avalanche photodiodes.
Nucl Instrum Methods Phys Res A.
2018; 912: 287–289. Publisher Full Text
- 29.
Nuruyev S:
Characterization of Silicon Photomultipliers with different structures. 2025. http://www.doi.org/10.17605/OSF.IO/VDA5G