The burial sites of the cathedral and its first location to the south-east of the square show a constant reuse of space, a situation also observed in other funerary contexts of the colonial period. Such practices meant that several burials were altered in order to house new corpses, which explains the amount of mixed skeletal remains throughout the excavation, and the fact that several of the individuals do not have all of their bone structures. The analysis of the sample excavated during the 2017 field season in the nave and atrium of Panama Viejo’s cathedral included recording 159 individuals, of which 66 correspond to complete or partially complete individuals, in addition to 93 crania, which, given the information obtained from this bone structure, were also considered individuals. Meanwhile, 16 individuals were recovered in the interventions carried out to the south-east of the main square in 2018, of which 14 are complete or partially complete individuals and two are crania (Table 1).
With regard to the chronological distribution of the sample, analysis of the stratigraphic sequence shows that about 9.14% of the individuals are associated with stratigraphic units situated between 1519 and 1541, all associated with inhumation events carried out to the south-east of the main square, corresponding to the temple's first location. Subsequently, 88 individuals (50.29%) identified as buried between 1542 and 1626, associated with the relocation of the cathedral and its first decades of use. Due to the insertion of stonework bases for the timber columns that supported the church's roof in 1626, 63 individuals excavated were identified as having been deposited between 1627 and 1671 (36%), and, finally, 8 individuals who were buried in the atrium of the cathedral, all of them linked to the 17th century, made up 4.57% of the sample (Table 2 and Figure 2).
Paleodemographic analysis
Distribution by sex. Analysis of the sample yielded data that does not match that previously seen for the colonial occupation of other sectors of Panamá Viejo, where a relatively symmetrical distribution between the number of male and female individuals had been observed (Martín et al., 2009; Rojas-Sepúlveda et al., 2011). For the whole sample analyses, it is observed that 55.43% correspond to female or probably female individuals, which is considerably higher than the figure of 28.57% for male and possibly male individuals. There was a low representation of individuals with unknown sex (5.14%), which correspond to infant individuals who had not yet developed dimorphic sexual characteristics. Finally, in about 10.86% of the sample it was not possible to estimate sex due to the fragmentation or absence of the anatomical diagnostic parts for analysis (Table 7 and Figure 7).
Table 7. Distribution of sample by sex.
| N (Individuals) | % |
|---|
| Female | 80 | 45.71 |
| Probably Female | 17 | 9.71 |
| Male | 23 | 13.14 |
| Probably Male | 27 | 15.43 |
| Unknown sex | 9 | 5.14 |
| Unobservable | 19 | 10.86 |
| Total | 175 | 100.00 |
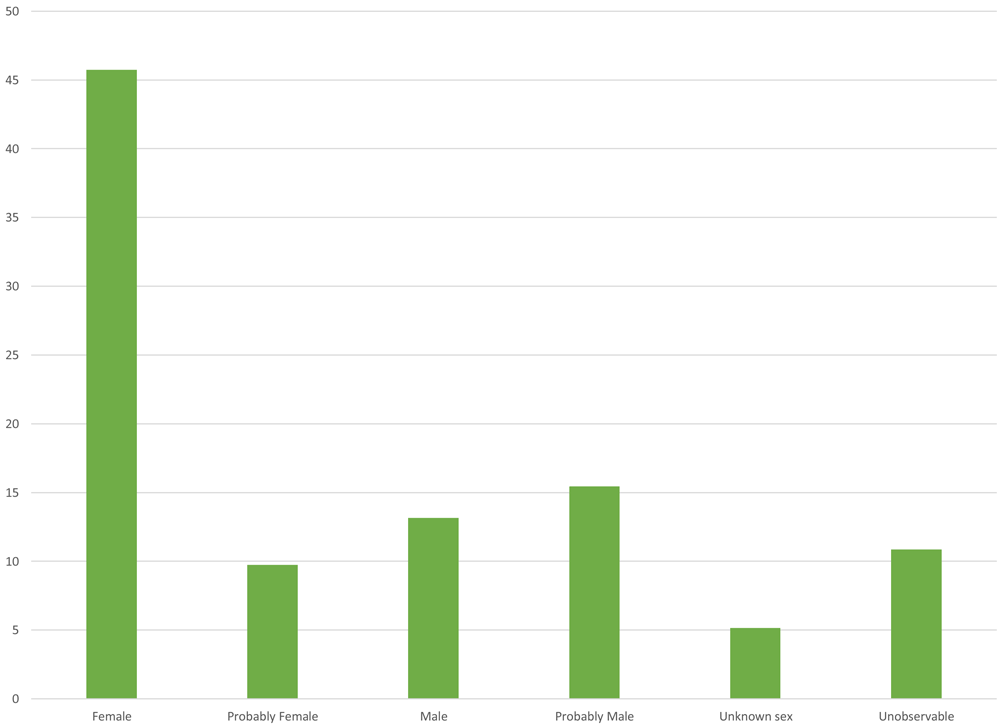
Figure 7. Distribution of sample excavated in the cathedral by sex.
The high percentage of female individuals has strong implications at a paleodemographic level, as it tends to skew the information. However, these figures can perhaps be explained by the particularities of the funerary context, inhumation patterns and the demographic situation at the time. First, although ecclesiastical sepulchres were generally distributed according to economic and social considerations rather than sexual differences during the colonial period, in some cases activities linked to death involved the confraternities, namely corporate institutions that, among other things, organised the funerals and burial of their members, even helping to finance inhumations (Rodríguez González, 1999). However, the historical documentation for Panama Viejo does not clarify the role women played in these types of organisations.
In the archaeological literature, it is possible to identify colonial sites with an apparent segregation of burial sites based on gender. For example, Stojanowski (2013), based on his analysis of burials in the church of the Spanish mission of San Pedro and San Pablo de Patale in Florida, a site that was active for two decades in the early 17th century, finds that there is a tendency to bury male individuals in the left nave of the temple or church, although he points out that the sample may be somewhat limited (Stojanowski, 2013: 43). Secondly, a relatively high proportion of female individuals is found in the central part of the church of the mission Santa Catalina de Guale de Santa María, a circumstance that fails to fit into a specific interpretation but which is notable for the distribution by sex in the burial space (Stojanowski, 2013: 134).
We must also consider the itinerant life of many of the men in Panamá who, due to the activities of the port, had to be away from the city for long periods of time, leaving the women behind. This could explain the large number of female individuals found in the sample, which in turn could be associated with information that will be presented below when discussing other criteria of the bioanthropological analysis.
If we consider the information from the sample according to its chronological distribution, as proposed in the stratigraphic analysis of the two excavated spaces, it can be seen that for the period 1519–1541, 43.75% corresponds to individuals with unobservable sex estimation, followed by probably male individuals (31.25%), those with undetermined sex (18.75%), and, finally, women, represented with just one individual (6.25%). The low incidence of the female population is striking compared to that reported for the area excavated in 2017, but this could be due to the particularities of the representativeness and conservation of the sample, which may skew the results. It is also possible that these figures are due to the low female presence in the first decades of life in the city, a time when most of the women present were indigenous, as is the case of the individual identified in the sample.
This result contrasts with that recorded in the subsequent Cathedral site, which, between 1542 and 1626 provides 56.82% of the sample for female and probably female individuals, while males account for 28.41%. Individuals with undetermined (5.68%) and unobservable (9.09%) sex appear in smaller proportion.
The figures are slightly more accentuated for the period 1627–1671, where women total 65.08% and men 28.57%, with only 4.76% of individuals who could not be estimated due to a lack of diagnostic structures. Finally, the trend is maintained for the individuals excavated in the atrium of the cathedral (1600–1671), where women represent 62.5% and men 25% of the sample in this sector, although it should be noted that they are only represented by five and two individuals, respectively (Table 8 and Figure 8).
Table 8. Distribution of sample by sex according to chronological period.
| 1519-1541 | 1542-1626 | 1627-1671 | 1600-1671 | Total |
|---|
| N | % | N | % | N | % | N | % | N | % |
|---|
| Female | 1 | 6.25 | 41 | 46.59 | 35 | 55.56 | 3 | 37.5 | 80 | 45.71 |
| Probably Female | 0 | 0 | 9 | 10.23 | 6 | 9.52 | 2 | 25 | 17 | 9.71 |
| Male | 0 | 0 | 15 | 17.05 | 6 | 9.52 | 2 | 25 | 23 | 13.14 |
| Probably Male | 5 | 31.25 | 10 | 11.36 | 12 | 19.05 | 0 | 0 | 27 | 15.43 |
| Unknown sex | 3 | 18.75 | 5 | 5.68 | 1 | 1.59 | 0 | 0 | 9 | 5.14 |
| Unobservable | 7 | 43.75 | 8 | 9.09 | 3 | 4.76 | 1 | 12.5 | 19 | 10.86 |
| Total | 16 | 100 | 88 | 100 | 63 | 100 | 8 | 100 | 175 | 100 |
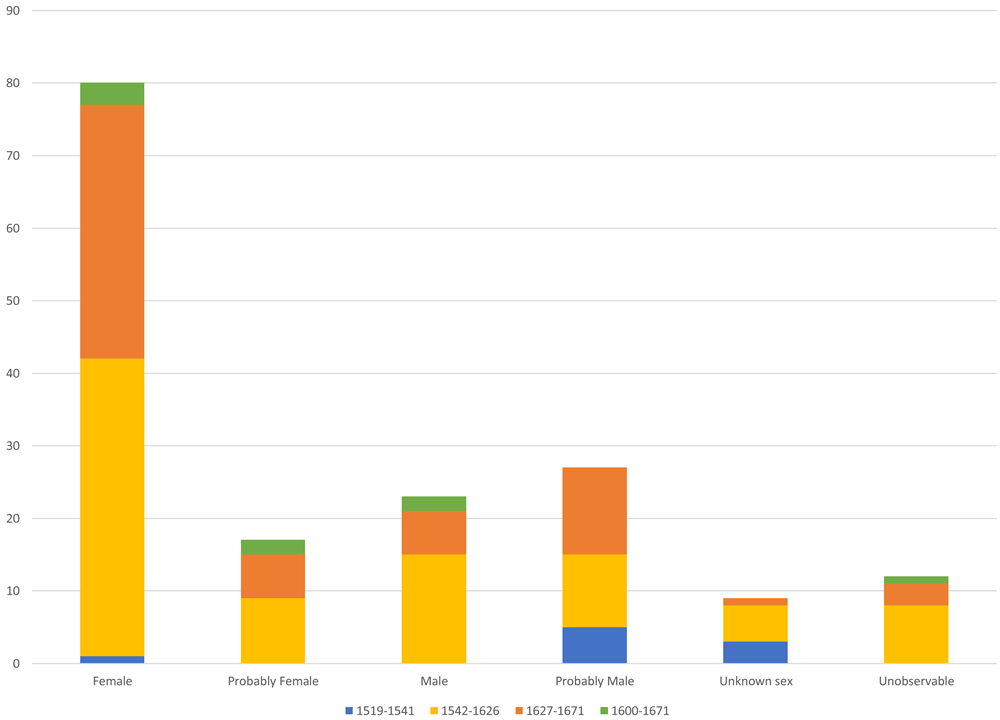
Figure 8. Distribution of sample by sex according to timing.
Distribution by age range. When analysing the data in terms of age distribution, it can be seen that the cathedral sample shows a very low proportion of subadult individuals, representing 9.14% of the analysed sample, with individuals aged 0 to 6 (2.86%), 7 to 12 (2.29%) and 13 to 17 (4%). This situation is most likely due to the preservation conditions of the skeletal remains in this type of population and to burial patterns of the time, when some temples had sectors specifically for children. A good example is the church of the Patale mission, where most subadult individual burials are concentrated in the area near the temple's façade while those located in other sectors of the nave were associated with females, suggesting kinship between the individuals (Stojanowski, 2013: 43–50). In the case of Panama Viejo, five of the 16 subadult individuals were excavated south-east of the main square (1519–1541), associated with 31.25% of individuals for this site. If we consider the earliest time of occupation in the cathedral (1542–1626), the figure drops considerably to 9.09% of individuals, increasing slightly to 12.5% between 1627 and 1671, although in this case related to a single juvenile individual. Finally, two subadult individuals were recorded in the atrium area (1600–1671), one aged 7 to 12 and the other 13 to 17, which add up to 25% for those individuals excavated in the atrium. This would seem to suggest, firstly, that there was initially no age distinction when burying subadult individuals in the temple space, although over time this changed towards having a special sector for the inhumation of these individuals. Secondly, we should consider the high rates of infant mortality that may have occurred in the first years following the foundation of the city, caused by both epidemiological factors and changes in living conditions as the population had to adjust to new dynamics.
Regarding adult individuals, it can be observed that young adults (52.57%) are found in a greater proportion than middle adults (12.57%), and the absence of older adults in the sample is particularly striking. There were also cases of individuals whose age range could not be determined due to the lack of representativeness or conservation of the diagnostic structures required for estimation, which meant they were grouped in the adult category, making up 25.71% of the whole sample (Table 9 and Figure 9). These figures follow the trend observed in other colonial skeletal series of Panamá Viejo (Martín et al., 2009; Rojas-Sepúlveda et al., 2011).
Table 9. Distribution of sample by age group.
| Age | N (Individuals) | % |
|---|
| Neonatal | 0 | 0.00 |
| Infant I (0–6) | 5 | 2.86 |
| Infant II (7–12) | 4 | 2.29 |
| Juvenile (13–17) | 7 | 4.00 |
| Total Non-adults | 16 | 9.14 |
| Young Adult (18–34) | 92 | 52.57 |
| Middle Adult (35–55) | 22 | 12.57 |
| Old Adult (+55) | 0 | 0.00 |
| Adult (+18) | 45 | 25.71 |
| Total adults | 159 | 90.86 |
| TOTAL | 175 | 100 |
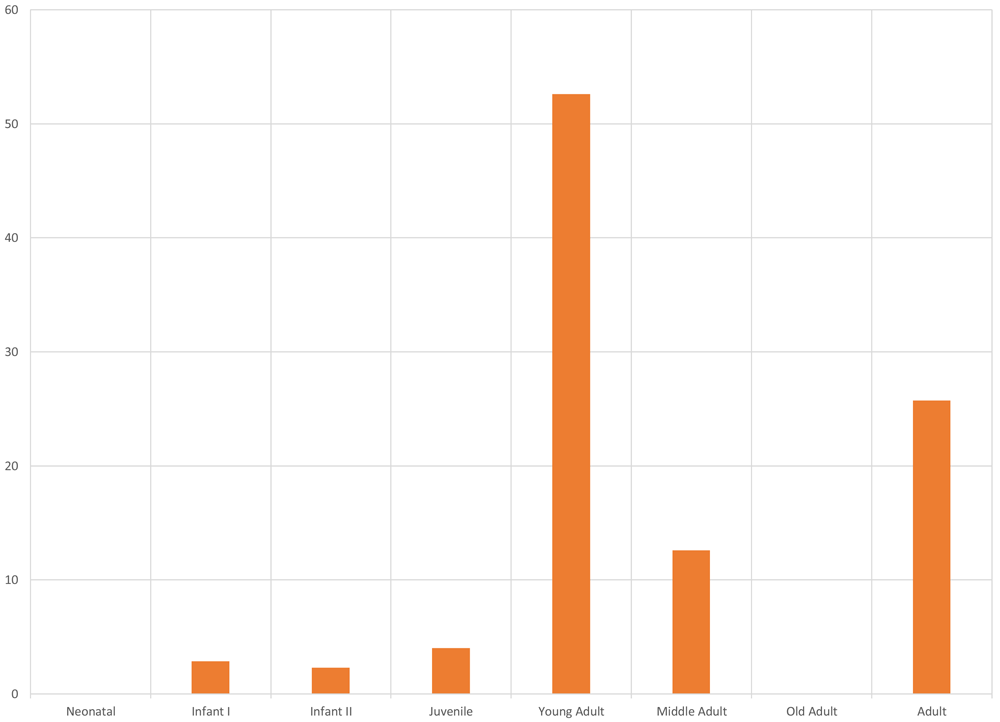
Figure 9. Age distribution of sample excavated in the cathedral and south-east of the square.
These data may be a result of the difficult conditions faced by the European, indigenous and African population during the contact period and in subsequent decades, which led to stressful situations (nutritional, environmental, social, health, etc.) that differentially affected certain sectors, including young adults (18–34 years of age).
This situation also influences the survival rates of individuals, producing low life expectancy, which perhaps explains the lack of older adults. In addition to the information previously obtained in PanamaViejo, where a similar trend is seen when analysing the ages of the adult population (Martín et al., 2009 and Rojas-Sepúlveda et al., 2011), this high proportion of young individuals can be found in other colonial sites, followed by middle adults, such as in the temple of Nuestra Señora de la Concepción in Campeche, Mexico. The researcher explains that this situation is due to the precarious living conditions the Campeche population endured because of living in a port, where the constant arrival and circulation of different human groups led to the proliferation of diseases, epidemics, and famines, producing high mortality rates in the young population (Rodríguez Pérez, 2010: 107).
If we cross-reference the information on age with sex, young adult female individuals are the best represented in the whole sample (33.14%), followed by males in the same age range (17.71%). In the other age categories, in contrast, the distance between male and female individuals tends to decrease considerably, although female individuals are always better represented (Table 10 and Figure 10).
Table 10. Distribution of sample by age group according to sex.
| Age | Unobservable | Unknown sex | Male | Female |
|---|
| N | % | N | % | N | % | N | % |
|---|
| Neonatal | 0 | 0.00 | 0 | 0.00 | 0 | 0.00 | 0 | 0.00 |
| Infant I (0–6) | 0 | 0.00 | 5 | 2.86 | 0 | 0.00 | 0 | 0.00 |
| Infant II (7–12) | 0 | 0.00 | 4 | 2.29 | 0 | 0.00 | 0 | 0.00 |
| Juvenile (13–17) | 2 | 1.14 | 0 | 0.00 | 2 | 1.14 | 3 | 1.71 |
| Young Adult (18–34) | 3 | 1.71 | 0 | 0.00 | 31 | 17.71 | 58 | 33.14 |
| Middle Adult (35–55) | 0 | 0.00 | 0 | 0.00 | 8 | 4.57 | 14 | 8.00 |
| Old Adult (+55) | 0 | 0.00 | 0 | 0.00 | 0 | 0.00 | 0 | 0.00 |
| Adult (+18) | 14 | 8.00 | 0 | 0.00 | 9 | 5.14 | 22 | 12.57 |
| Total | 19 | 10.86 | 9 | 5.14 | 50 | 28.57 | 97 | 55.43 |
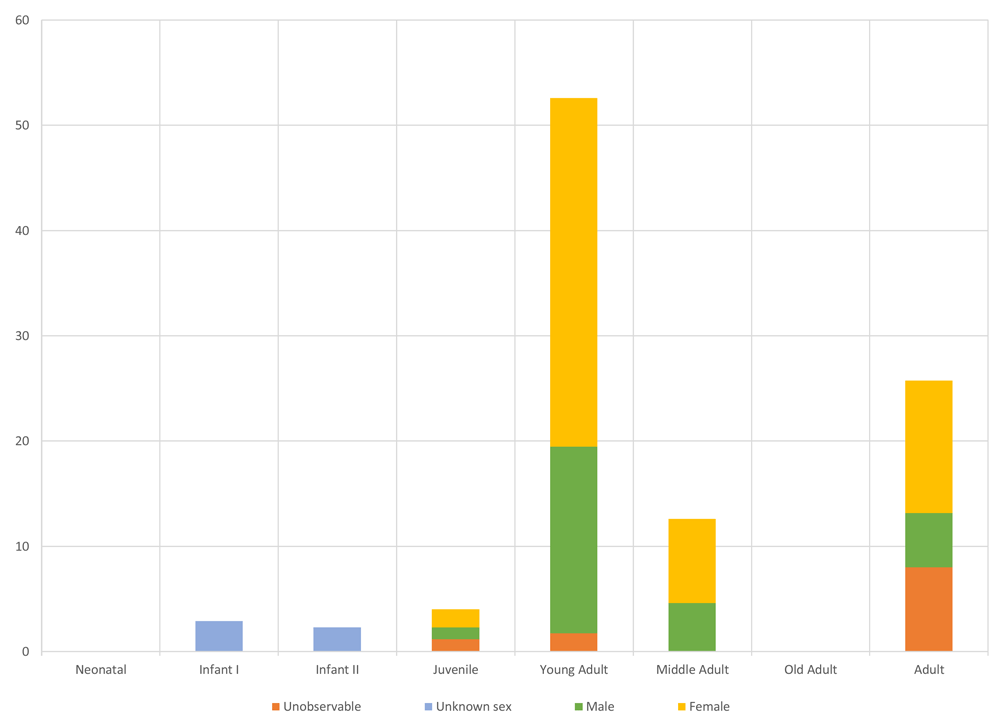
Figure 10. Age distribution of individuals by sex.
Analysing the data according to chronology, we can see that young adults are also the best represented after the relocation of the Cathedral in 1542, decreasing slightly from 56.82% for 1542–1626, to 52.38% for 1627–1671. Moreover, young adults appear most frequently (62.5%) in the atrium area (1600–1671), despite there being few individuals in this sector. The proportion of individuals aged between 35 and 55 increases from 12.5% in years 1542–1626 to 15.87% in the period between 1627 and 1671, although no individual is reported in this age range in the temple's first site (Table 11 and Figure 11).
Table 11. Distribution of sample by age groups according to chronological period.
| Age | 1519-1541 | 1542-1626 | 1627-1671 | 1600-1671 | Total |
|---|
| N | % | N | % | N | % | N | % | N | % |
|---|
| Neonatal | 0 | 0 | 0 | 0 | 0 | 0.00 | 0 | 0 | 0 | 0.00 |
| Infant I (0–6) | 1 | 6.25 | 4 | 4.55 | 0 | 0.00 | 0 | 0 | 5 | 2.86 |
| Infant II (7–12) | 2 | 12.5 | 1 | 1.14 | 1 | 1.59 | 0 | 0 | 4 | 2.29 |
| Juvenile (13–17) | 2 | 12.5 | 3 | 3.41 | 1 | 1.59 | 1 | 12.50 | 7 | 4.00 |
| Young Adult (18–34) | 4 | 25 | 50 | 56.82 | 33 | 52.38 | 5 | 62.50 | 92 | 52.57 |
| Middle Adult (35–55) | 0 | 0 | 11 | 12.50 | 10 | 15.87 | 1 | 12.50 | 22 | 12.57 |
| Old Adult (+55) | 0 | 0 | 0 | 0.00 | 0 | 0.00 | 0 | 0 | 0 | 0.00 |
| Adult (+18) | 7 | 43.75 | 19 | 21.59 | 18 | 28.57 | 1 | 12.50 | 45 | 25.71 |
| Total | 16 | 100 | 88 | 100 | 63 | 100 | 8 | 100 | 175 | 100 |
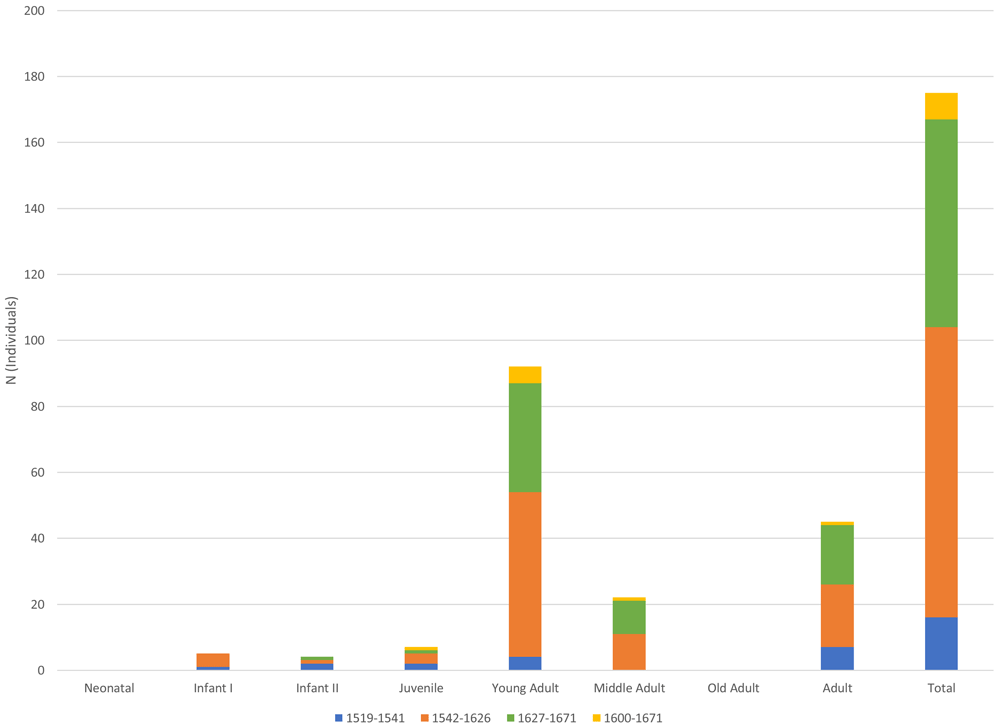
Figure 11. Distribution of sample by age according to timing.
Population affiliation or phenotypic variation. Observations were made on 54.85% of the sample, despite its complexity in terms of conservation and representation of teeth and skeletal remains of the cranium and facial skeleton, as used to estimate ancestry or phenotypic variation. The craniometric, morphological and dental information was used to group the sample into one of the three population groups linked to phenotypic variation, namely European, Amerindian or African, although in some cases individuals with characteristics of two population affiliations were found, albeit with one of them always predominating. Nine groups were identified when taking these considerations into account.
Table 12 and Figure 12 show that the best represented population groups are African and European, each with 14.86% of the whole sample. In smaller proportions are the groups predominantly European with African traits and predominantly African with European traits, each with 5.71%, followed by the Amerindian population (5.14%). Of the four remaining groups, 2.86% are predominantly Amerindian individuals with European traits, the same as for predominantly African with Amerindian traits, while predominantly Amerindian with African traits (1.71%) and predominantly European with Amerindian traits (1.14%) are the least represented in the sample.
Table 12. Distribution of sample by population affiliation.
| Population Affiliation | N (Individuals) | % |
|---|
| European | 26 | 14.86 |
| European/Amerindian | 2 | 1.14 |
| European/African | 10 | 5.71 |
| Amerindian | 9 | 5.14 |
| Amerindian/European | 5 | 2.86 |
| Amerindian/African | 3 | 1.71 |
| African | 26 | 14.86 |
| African/European | 10 | 5.71 |
| African/Amerindian | 5 | 2.86 |
| Unobservable | 79 | 45.14 |
| TOTAL | 175 | 100.00 |
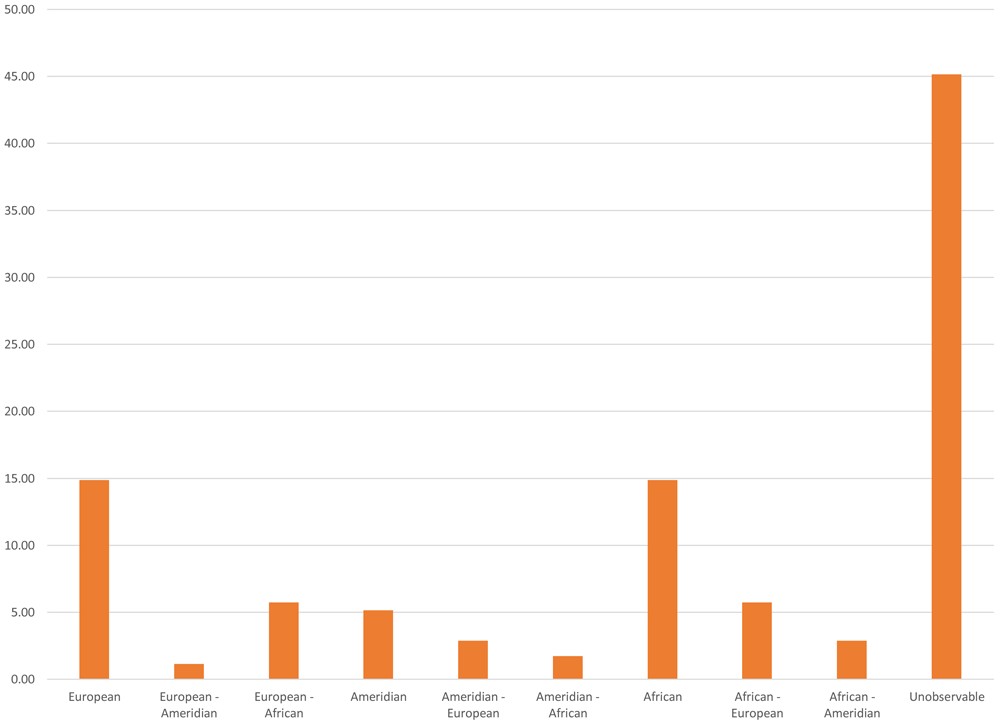
Figure 12. Distribution of sample analysed by population affiliation.
It is striking that adding the individuals associated with African and predominantly African groups brings a total of 23.43%, slightly higher than those represented with European and predominantly European populations (21.71%). In contrast to what happened in other temples, where the cost of inhumation depended on the deceased's socioeconomic capacity and preference to be located close to the altar (Rivera-Sandoval, 2006), it seems that Panama Viejo’s Cathedral was the best option for those wishing to have an ecclesiastical burial at a moderate cost (Aram et al., 2020: 506). This would allow access for a wide diversity of social and ethnic sectors that were living or passing through in Panamá, including the population of African and indigenous descent, a situation corroborated by documentary information (Aram et al., 2020).
The exploration of historical documentation also clarifies that it was quite frequent to receive "the solemnly poor" in the Cathedral and for the slave population to be buried there, while sectors in a more privileged economic position might choose one of the churches of the city's convents for their interment (Aram et al., 2020: 506). This situation also responded to the need to bury the bulk of the Panamanian population that had become predominantly of African ancestry during the 16th and 17th centuries.
Furthermore, there is a low proportion of individuals of Amerindian descent (9.71%, also adding those predominantly Amerindians with traits of other phenotypes) compared to the other population groups. This may be due to the epidemiological shock suffered by the indigenous groups after coming into contact with the Europeans, a situation described in the written documentation, and which decimated the population. In this regard, Jaén Suárez (1986) estimates that 225,000 people died on the isthmus during the contact period. For Panama Viejo alone, the author comments that, while in 1533 there was a record of approximately 500 indigenous people, the figure drops drastically in subsequent years, totalling just 22 in 1607 (Jaén Suárez, 1986:52). The chronicler of the Indies Fernández de Oviedo even states that around two million indigenous people had already disappeared in Castilla de Oro alone by 1542 (Cooke & Sánchez Herrera, 2004:48), which, beyond evaluating the accuracy of the figure, indicates a reality in terms of perceptions of the death of Panaman’s indigenous people.
This situation is also related to the processes of population mixture that began very early on, representing a significant part of the sample analysed (around 20% for the whole sample). The particularities of biological mixture in Panamá are linked, to some degree, to the low number of white women, and particularly single ones, which encouraged relations with indigenous women in the early years of the conquest. Despite being a punishable practice, unmarried co-habitation was nevertheless commonplace in America. Indeed, authors such as Mena García (1984:93) state that the medieval figure known as "barraganía" (concubine) constituted an important element in the legitimacy of free cohabitation between men and women, which, despite not having the same significance as marriage, helped regulate and extend relations between Spaniards and indigenous women, and possibly also between Europeans and Africans. This gave rise to terms such as zambaigos and mulatos, who were already a well-represented population group in Panamanian society by the 17th century (Jopling, 1994; Mena García, 1984).
In this regard, Table 13 and Figure 13 show that female individuals with African traits are the best represented in the sample (12%). This trend is maintained in those individuals of African descent with Amerindian or European traits, suggesting an important role of women of African affiliation in the demographic structure of the population buried in the Cathedral. The proportion of male and female individuals in groups with European and Amerindian phenotypic variation, including combinations that do not include African components, tends to be much more balanced, except in individuals with European traits, where females represent 8% of the whole sample and males 5.14%.
Table 13. Distribution of sample by population affiliation according to sex.
Population
Affiliation | Unobservable
/ Unknown sex | Male | Female |
|---|
| N | % | N | % | N | % |
|---|
| European | 3 | 1.71 | 9 | 5.14 | 14 | 8.00 |
| European/Amerindian | 0 | 0.00 | 1 | 0.57 | 1 | 0.57 |
| European/African | 0 | 0.00 | 4 | 2.29 | 6 | 3.43 |
| Amerindian | 1 | 0.57 | 3 | 1.71 | 5 | 2.86 |
| Amerindian/European | 0 | 0.00 | 3 | 1.71 | 2 | 1.14 |
| Amerindian/African | 0 | 0.00 | 0 | 0.00 | 3 | 1.71 |
| African | 0 | 0.00 | 5 | 2.86 | 21 | 12.00 |
| African/European | 1 | 0.57 | 2 | 1.14 | 7 | 4.00 |
| African/Amerindian | 1 | 0.57 | 0 | 0.00 | 4 | 2.29 |
| Unobservable | 22 | 12.57 | 23 | 13.14 | 34 | 19.43 |
| Total | 28 | 16.00 | 50 | 28.57 | 97 | 55.43 |
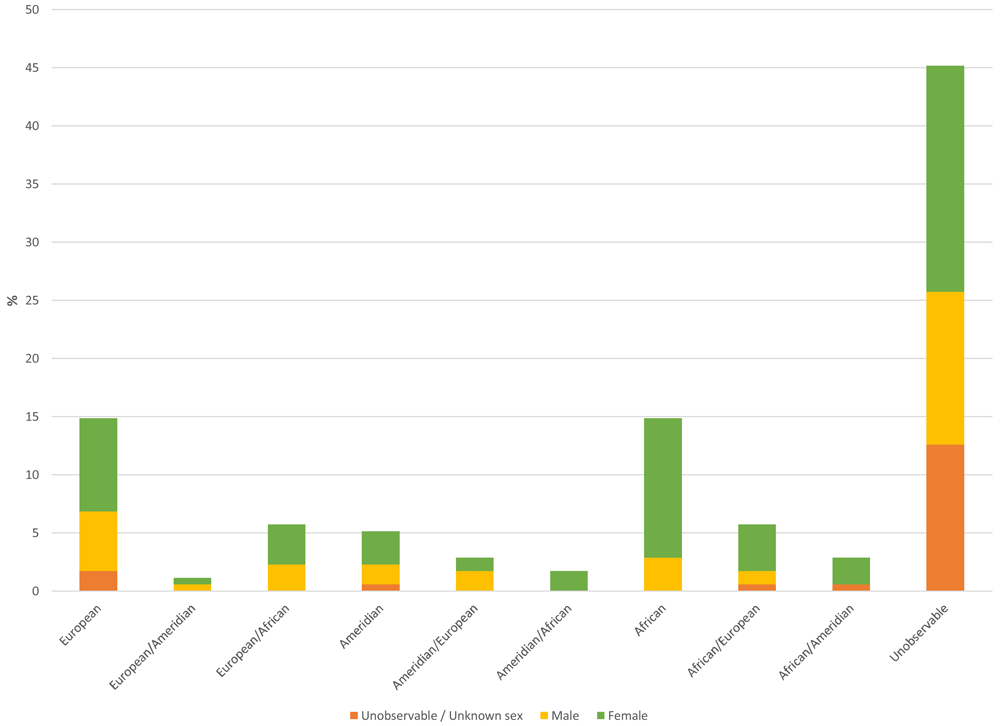
Figure 13. Distribution by population affiliation of sample, discriminated by sex.
Comparing the data according to the chronological distribution of the sample, we find that between 1519 and 1541 there is an apparent proportionality between several of the identified population groups, although this may be due to the small size of the sample excavated in the sector located to the south-east of the main square. The population of African (12.5%) and European (10.23%) descent is most represented for the period 1542–1626, followed by predominantly African individuals with European traits (5.68%) and predominantly European individuals with African traits (4.55%).
The situation is slightly reversed when looking at the data for 1627–1671, where Europeans are the best represented (23.81%), followed by Africans (20.63%). However, when adding these individuals with the subgroups in which there is a presence of traits from other populations, we find that Africans and predominantly Africans represent 31.75% in this period, while Europeans and predominantly Europeans amount to 30.16%. Moreover, it is noteworthy that in this same period there is an increase in the proportion of the indigenous population compared to the previous period (1542–1626), from a moderate 2.27% to 9.52%.
In the atrium (1600–1671), the most represented group is predominantly European with African traits (37.5%), followed by those of African descent (25%), and, with 12.5% each, Europeans and predominantly Amerindians with African traits; however, as in the south-east of the square, caution must be exercised due to the size of the sample (Table 14 and Figure 14).
Table 14. Distribution of sample by population affiliation according to the chronological period.
| Population Affiliation | 1519-1541 | 1542-1626 | 1627-1671 | 1600-1671 | Total |
|---|
| N | % | N | % | N | % | N | % | N | % |
|---|
| European | 1 | 6.25 | 9 | 10.23 | 15 | 23.81 | 1 | 12.5 | 26 | 14.86 |
| European/Amerindian | 1 | 6.25 | 0 | 0.00 | 1 | 1.59 | 0 | 0 | 2 | 1.14 |
| European/African | 0 | 0 | 4 | 4.55 | 3 | 4.76 | 3 | 37.5 | 10 | 5.71 |
| Amerindian | 1 | 6.25 | 2 | 2.27 | 6 | 9.52 | 0 | 0 | 9 | 5.14 |
| Amerindian/European | 1 | 6.25 | 2 | 2.27 | 2 | 3.17 | 0 | 0 | 5 | 2.86 |
| Amerindian/African | 0 | 0 | 2 | 2.27 | 0 | 0.00 | 1 | 12.5 | 3 | 1.71 |
| African | 0 | 0 | 11 | 12.50 | 13 | 20.63 | 2 | 25 | 26 | 14.86 |
| African/European | 0 | 0 | 5 | 5.68 | 5 | 7.94 | 0 | 0 | 10 | 5.71 |
| African/Amerindian | 1 | 6.25 | 2 | 2.27 | 2 | 3.17 | 0 | 0 | 5 | 2.86 |
| Unobservable | 11 | 68.75 | 51 | 57.95 | 16 | 25.40 | 1 | 12.5 | 79 | 45.14 |
| Total | 16 | 100 | 88 | 100 | 63 | 100 | 8 | 100 | 175 | 100 |
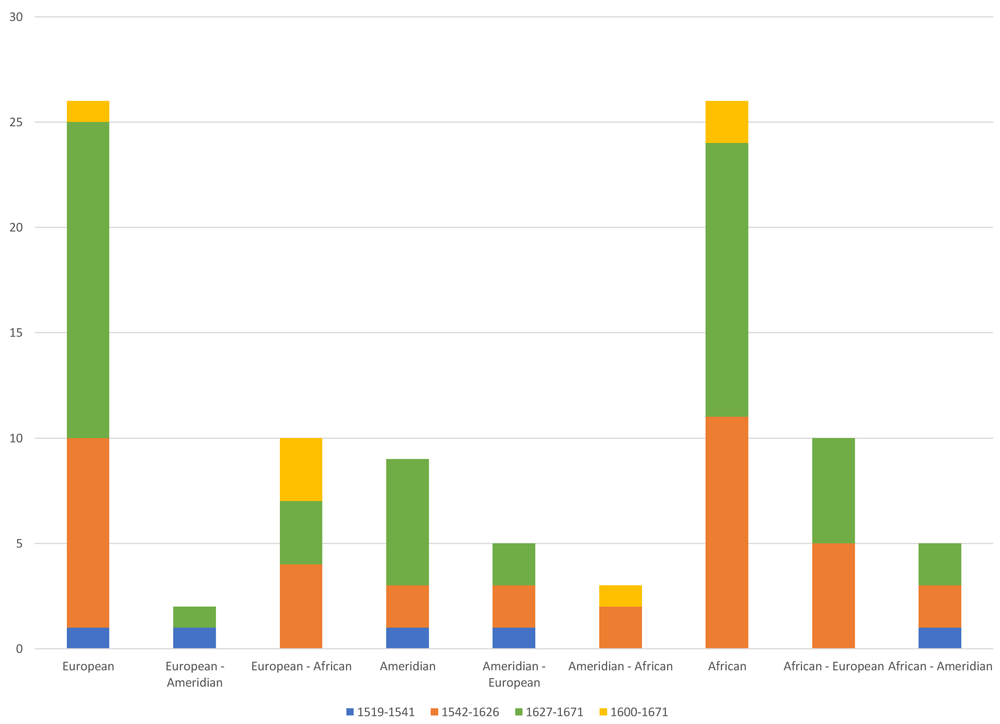
Figure 14. Distribution of sample by population affiliation according to timing.
Estimating stature. The state of preservation and completeness of the bone structures meant that height could only be estimated in 53 individuals in the sample (30.28%). Table 15 includes the number of observations of individuals discriminated by sex, showing that the male individuals reached an average height of 168.14 cm with a standard deviation of 6.54 cm. The tallest individuals reached 181.25 cm, while the shortest were around 152.57 cm. A mean of 161.04 cm and a standard deviation of 4.43 cm was obtained for female individuals, where the tallest women did not exceed 170.55 cm and the shortest 152.24 cm (Table 15 and Figure 15).
Table 15. Estimation of height of individuals by sex.
| Sex | Average | Standard deviation | Observations |
|---|
| Female | 161.04 | 4.43 | 26 |
| Male | 168.14 | 6.54 | 26 |
| Unobservable | 165.53 | 5.13 | 1 |
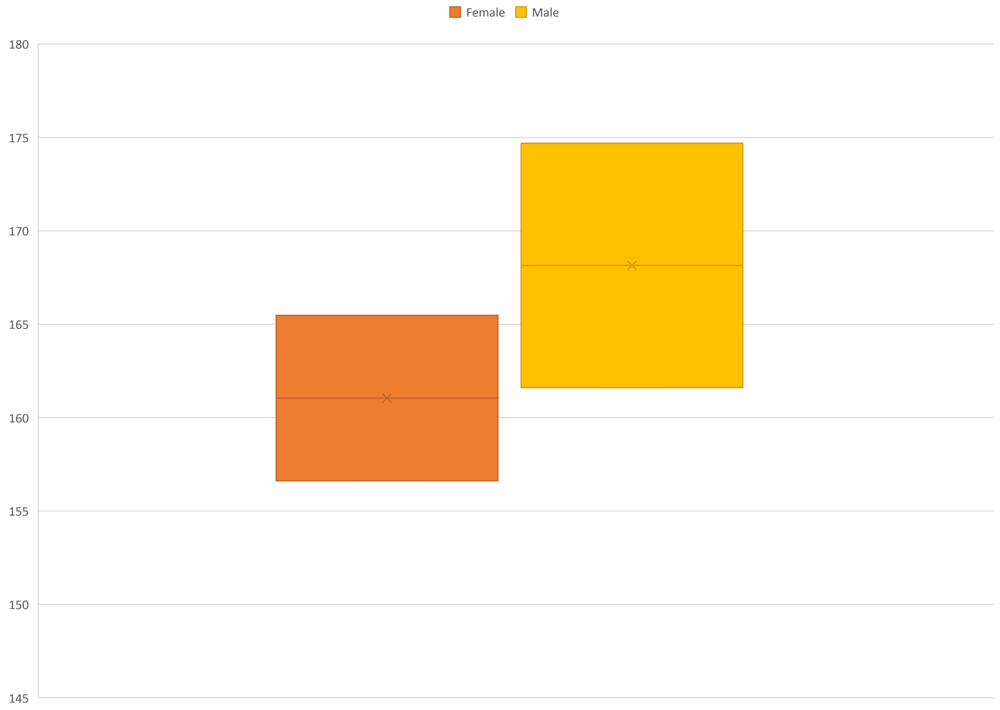
Figure 15. Estimated height ranges in Panamá Viejo Cathedral sample, discriminated by sex.
The small number of samples within each of the groups identified by population variation does not allow more detailed analysis of population growth characteristics. However, this trend corresponds to the figures presented for other collections of the colonial period, which show relatively low heights in all ancestral groups; in this regard, it is mentioned that populations on the Iberian Peninsula were not very tall, although Amerindians were generally shorter than those of European or African origin (Ubelaker, 1989b). Moreover, the phenotypic characteristics of Amerindian populations are also related to a coarse build, due to their physical activities and to their processes of adaptation to the environmental conditions (Rodríguez González, 1999).
Paleoepidemiology
In human ecology, the appearance of diseases in a group depends on a series of factors that interrelate individuals with the ecological environment in which populations develop, considering them dependent on and subject to changes that subsequently translate into processes of evolution and adaption.
Taking this interpretative model, disease is seen as an indicator of stress, understood as an imbalance in the process of homoeostasis, i.e. the energy balance between the environment (input) and human consumption (output), which allows the survival of a population and is conditioned by environmental and cultural variables (Rodríguez González, 1999; Rodríguez Cuenca, 2006). It is therefore necessary to measure the degree of adaptability of the population through aspects such as quality of diet, state of health and disease, and the effectiveness of the mechanisms regulating population growth.
Understanding the processes associated with disease in past populations requires a clear understanding of the context in which the skeletal remains were found to develop a more reliable interpretation. This type of observation makes it possible to explain processes extending over time, and also how these groups generated responses to the action of a range of factors that led to lesions or disease. However, some problems limit the reconstruction of a paleopathological and paleoepidemiological profile of past populations, including the absence of soft tissue that would provide insight into disease symptomatology, and limitations in establishing an accurate diagnosis based on just a few bone fragments.
Overall frequency of bone anomalies for the whole sample. As mentioned in the methodology, the paleoepidemiological analysis must consider unobservable aspects of both the individual and the overall sample. The information presented therefore includes those data that could not be collected and were coded as "Unobservable" due to the state of preservation of the elements, particularly in the case of the crania. Furthermore, the percentage of the whole sample is presented, as well as the percentage associated with the number of possible observations made, which is called the effective percentage.
Table 16 shows the proportion of individuals who present some bone anomaly, and those who do not present any. With regard to individuals excavated in the Cathedral and at the south-east site of the square, this percentage stands at 22.86% of individuals without anomalies, while those with some type of anomaly represent 66.86%; this figure is high in comparison to that analysed from other sites of Panama Viejo’s monumental complex, where an effective prevalence of 50% had been obtained for individuals from the colonial period with anomalies (Martín et al., 2009; Rojas-Sepúlveda et al., 2011).
Table 16. Proportion of individuals with bone anomalies in the sample analysed.
| Frequency | % Total | % Effective |
|---|
| Unobservable | 18 | 10.29 | |
| No anomalies | 40 | 22.86 | 25.48 |
| Anomaly | 117 | 66.86 | 74.52 |
| Total | 175 | 100.00 | |
| Total Effective | 157 | 89.71 | 100.00 |
Specific frequency of bone anomalies for the whole sample. In accordance with the bone changes observed in the sample (in which diseases, lesions or biocultural practices can be identified), Table 17 and Figure 22 present the frequency and percentage of those individuals for which some of these elements were diagnosed, as related to the paleopathological profile of the population buried in the two sites of Panama Viejo’s cathedral. These aspects are associated with stress activities as a consequence of adaptive expressions, but they are not all necessarily related to pathological processes (Mendonça de Souza, 1999:4). Among the lesions, those related to infectious processes (30.57%) (Figure 16), porotic hyperostosis (27.39%) (Figure 17), and degenerative joint disease (DJD) (24.20%) (Figure 21) are particularly worthy of note. Meanwhile, although it is not a specific lesion, entheseal changes (Figure 18 and Figure 19) are found with an effective prevalence of 29.30%. To a lesser degree, some cases of traumatic lesions (14.65%) (Figure 20), cribra orbitalia and neoplastic formations are reported, each with 8.97%, as well as the presence of hyperostosis frontalis interna and inflammatory processes, with 3.45% each. Finally, there are some cases of developmental anomalies (4.83%), heterotopic ossification (1.38%), one case of unintentional cranial flattening (0.69%), and one case of trepanation (0.69%).
Table 17. Proportion of bone anomalies identified in the cathedral sample.
| Bone lesions or anomalies | Frequency | % Effective | % Total |
|---|
| Periostosis | 48 | 30.57 | 27.43 |
| Entheseal changes | 46 | 29.30 | 26.29 |
| Degenerative Joint Disease | 38 | 24.20 | 21.71 |
| Trauma | 28 | 17.83 | 16.00 |
| Porotic hyperostosis | 43 | 27.39 | 24.57 |
| Cribra orbitalia | 13 | 8.28 | 7.43 |
| Neoplastic Lesions | 14 | 8.92 | 8.00 |
| Hyperostosis frontalis interna | 5 | 3.18 | 2.86 |
| Inflammatory processes | 5 | 3.18 | 2.86 |
| Spondylolysis | 4 | 2.55 | 2.29 |
| Developmental anomalies | 1 | 0.64 | 0.57 |
| Heterotopic ossification | 2 | 1.27 | 1.14 |
| Trepanation | 1 | 0.64 | 0.57 |
| Cranial flattening | 1 | 0.64 | 0.57 |
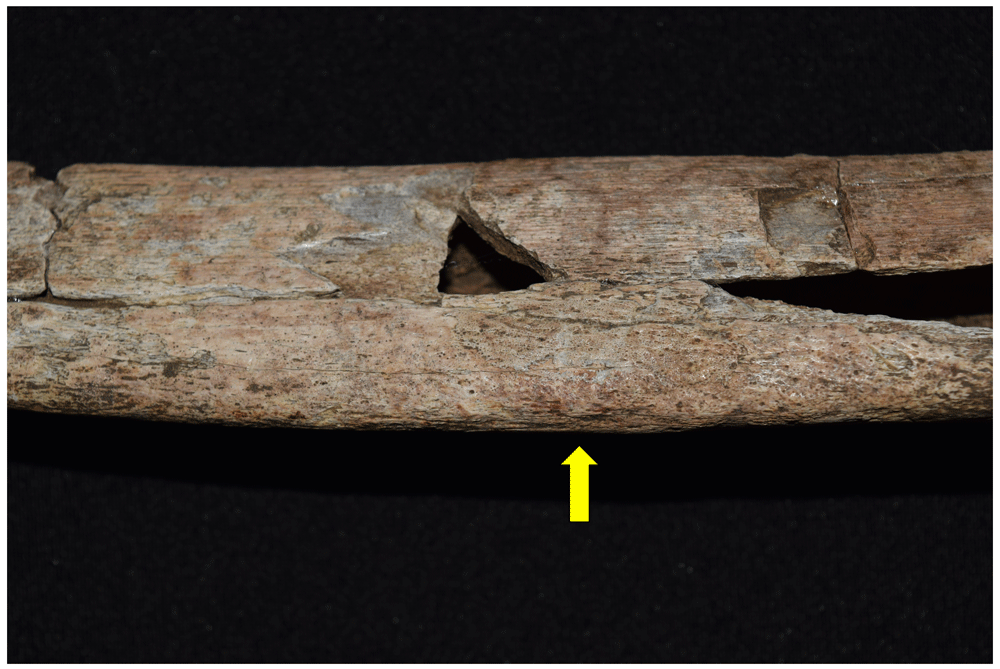
Figure 16. Periostosis associated with infectious process in left tibia of 1174.
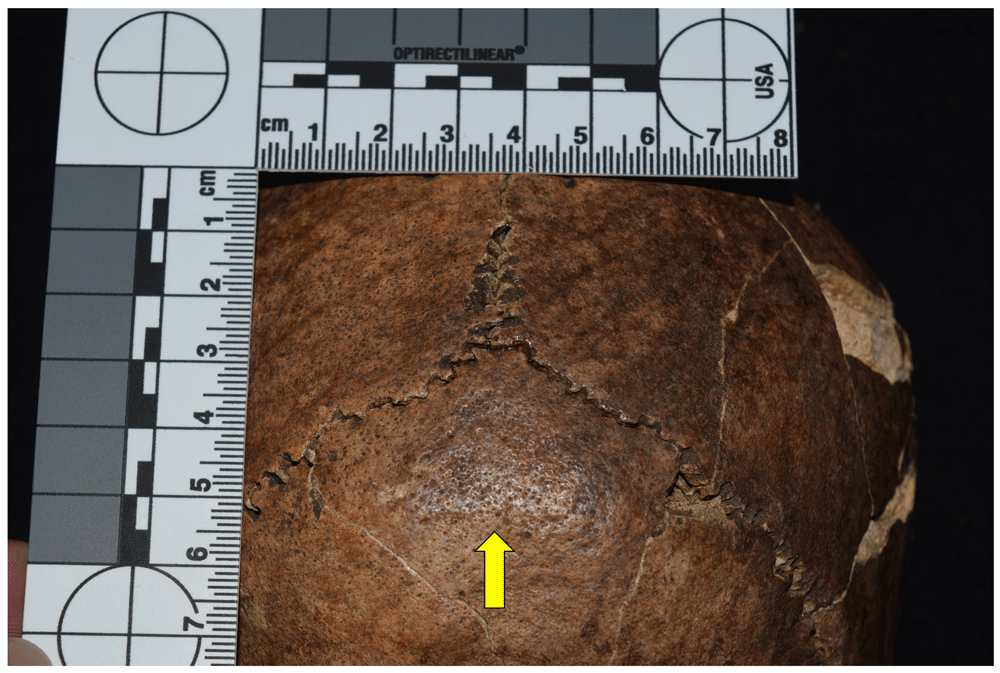
Figure 17. Porotic hyperostosis in occipital of 1030.
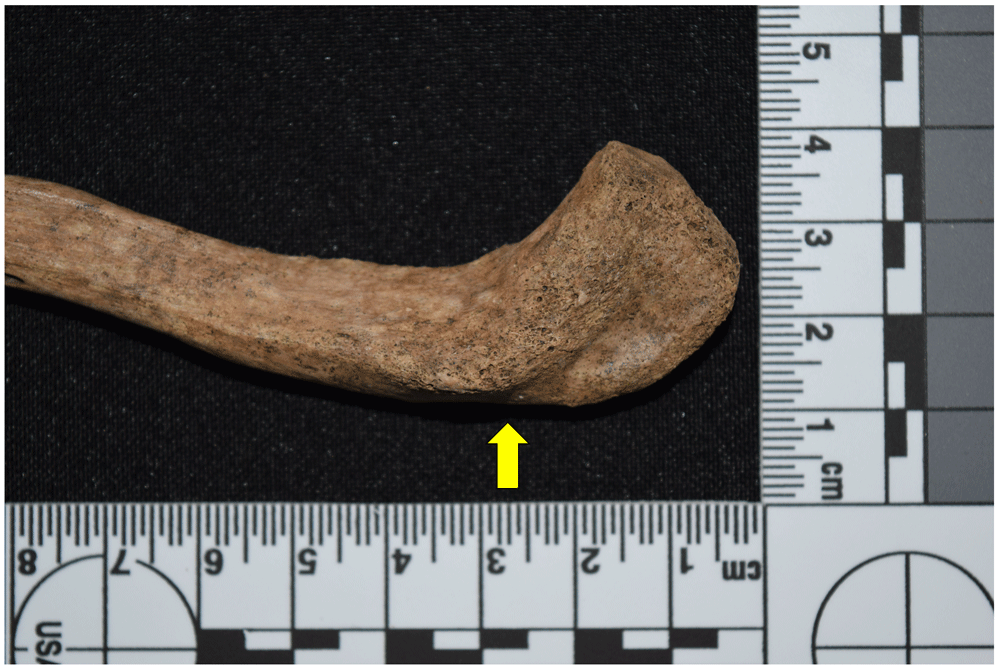
Figure 18. Entheseal change in right clavicle of 1087.
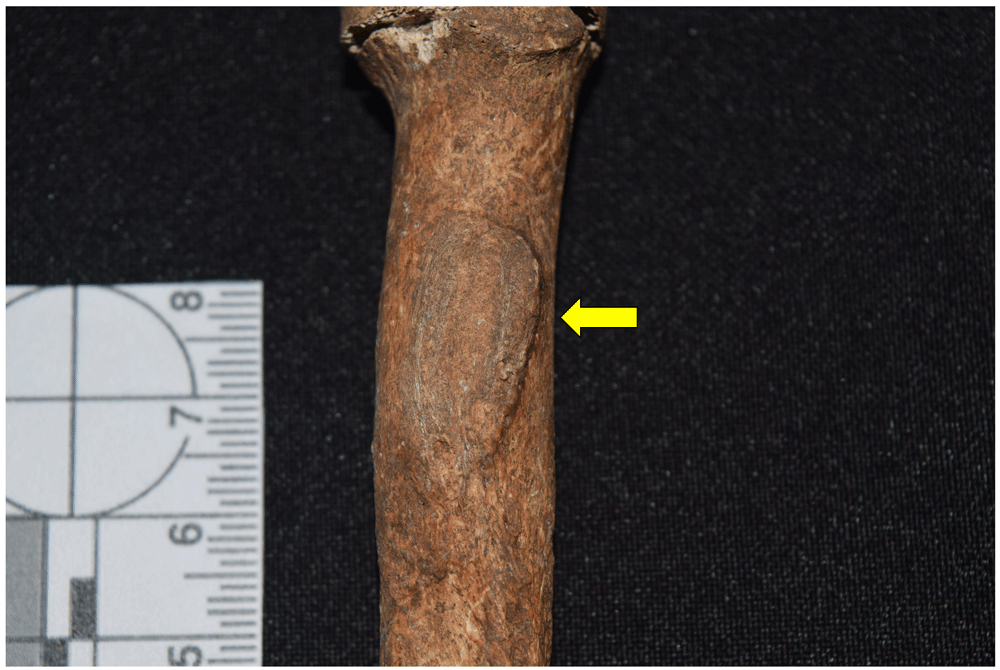
Figure 19. Entheseal change in right radial tuberosity of 4007.
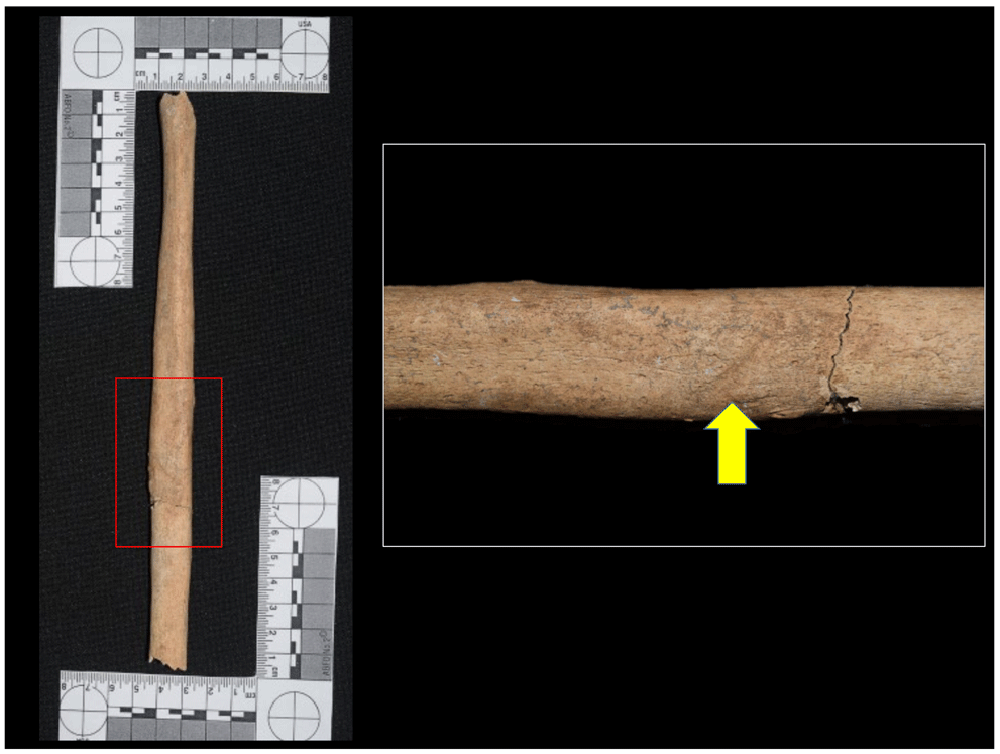
Figure 20. Traumatic lesion in left fibula of 5006.
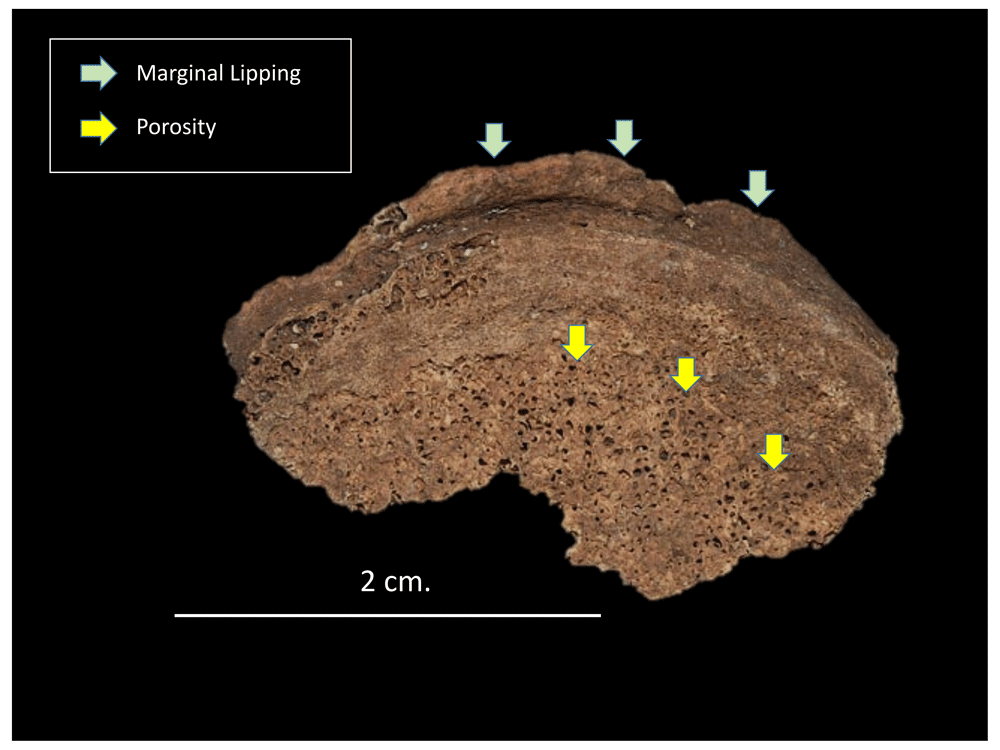
Figure 21. Degenerative joint disease processes in vertebral body of 4007.
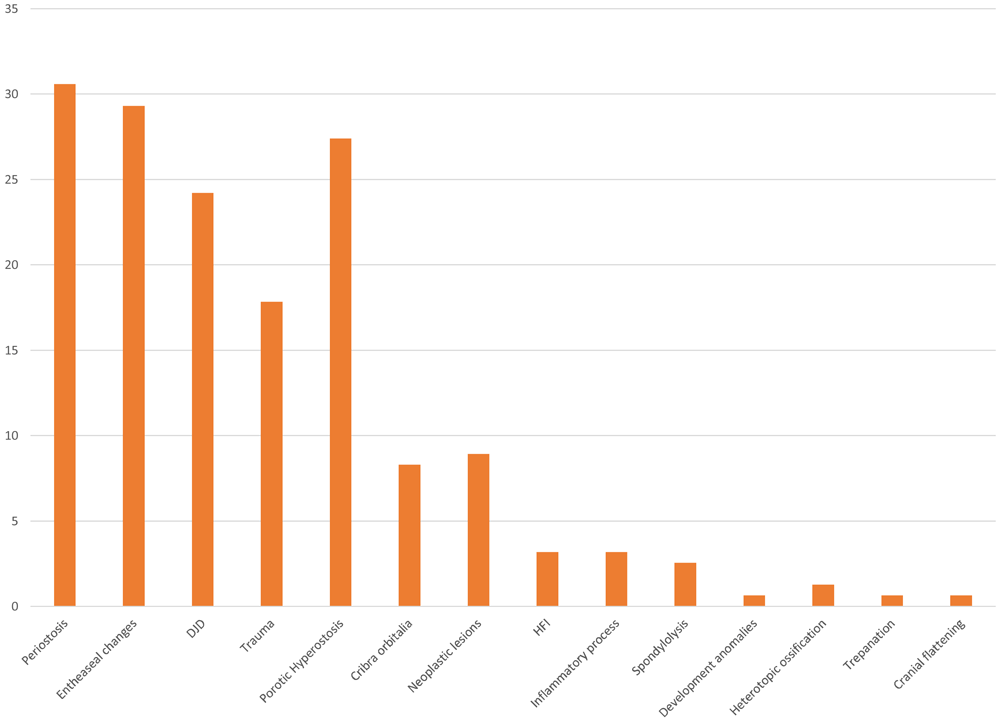
Figure 22. Effective percentage of bone anomalies identified in sample.
These figures suggest a significant impact on the living conditions of the population during the 16th and 17th centuries, in which changes that include type of diet, exposure to pathogens, and the effect of labour activities on the state of health of these human groups are all evident. The indigenous people, for example, had designed a structure to harness resources based on adaptation processes developed according to the particularities of their environment, and invested their energy mainly in producing and consuming food, although they also set aside time for other activities, such as those associated with rituals (Rodríguez Cuenca, 1999; Rodríguez Cuenca, 2006). In this regard, the most frequent lesions in these populations were related to DJD, porotic hyperostosis, and trauma. However, the presence of infectious diseases such as treponematosis and tuberculosis in the New World also had an impact on the health conditions of the indigenous population (Rodríguez Cuenca, 2006).
About bones, lesions related to infectious processes generally correspond to periostosis, which manifests itself in the outer layer of the bone, and osteomyelitis, which involves both the periosteum and the medullary cavity of the bone. These processes involve a response to some type of external pathogen such as staphylococci, streptococci and pneumococci, which cause diseases including leprosy, syphilis and tuberculosis.
In this regard, the sample analysed shows a high effective percentage (30.57%) of infectious lesions, all associated with periostosis, both localised and extended mainly in the lower limbs. In the first case, it is possible that this is related to traumatic lesions, but it may also be related to haemorrhagic, metabolic, congenital, and tumoral ailments. It should be noted that the lesion is much more likely to be due to infectious factors when extended in several anatomical regions. However, it is necessary to distinguish between specific and non-specific infections, since the same bone reaction may be due to different aetiologies, which makes diagnosis difficult if the complete skeleton has not been preserved, as was the case for the sample excavated from Panama Viejo’s Cathedral and to the south-east of its main square.
However, it was possible to identify that 37.5% of the individuals analysed with evidence of infectious lesions (10.28% of the whole sample) corresponded to lesions compatible with treponematosis, related to diseases such as yaws or framboesia, bejel, syphilis and pinta, the latter being the only one that does not affect the bone. With regard to bone response, it is difficult to macroscopically distinguish the type of treponematosis suffered by the individual, although in all cases the tibia is the most affected, while the fibulae and cranium may also be involved, and to a lesser extent the femur, forearm and fingers, depending on the aetiology of the disease (Aufderheide & Rodríguez-Martín, 1998; Fornaciari & Giuffra, 2009). The cases recorded in the sample analysed correspond to individuals affected bilaterally in the tibia and/or fibula, with different degrees of severity of the lesion, but involving a periosteal reaction in all cases (Figure 23 to Figure 28).
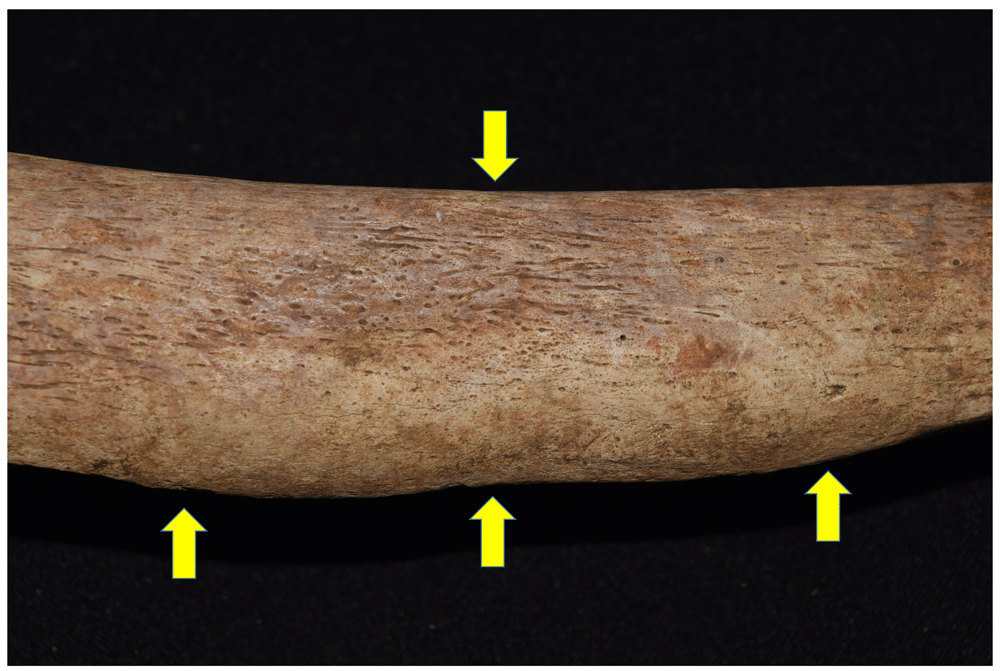
Figure 23. Periostosis compatible with infectious treponematosis process in right tibia of 1171.
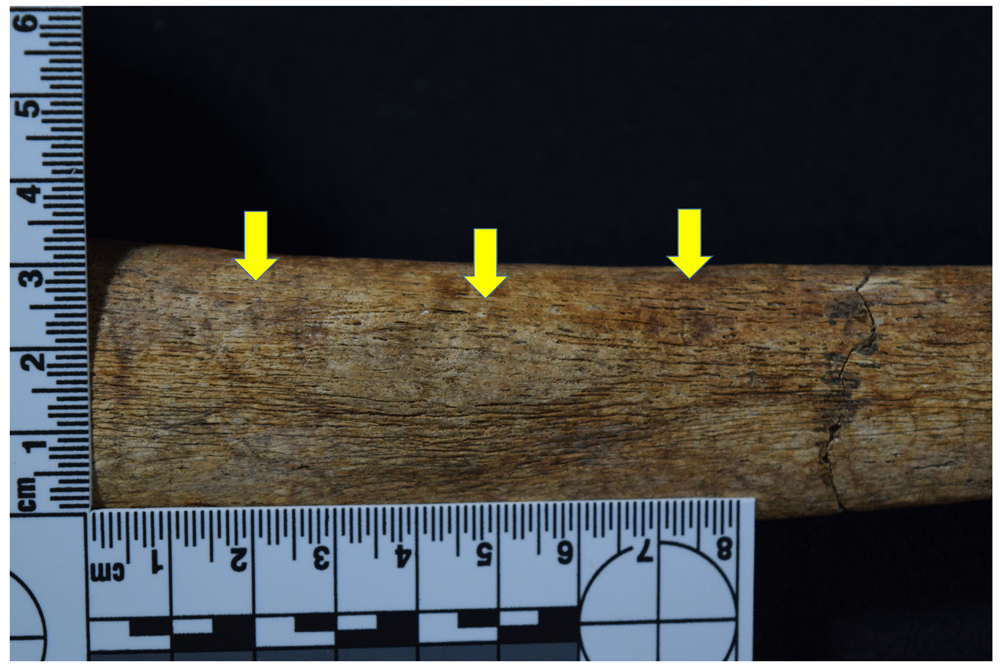
Figure 24. Periostosis in tibia compatible with treponematosis of 1053.
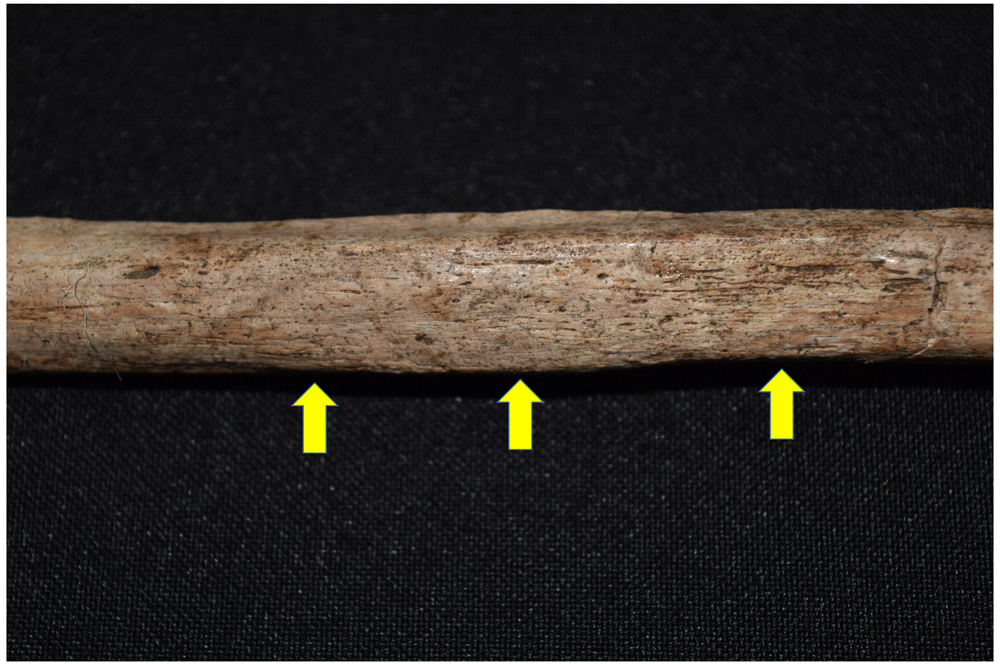
Figure 25. Periostosis in fibula compatible with treponematosis of 1096.
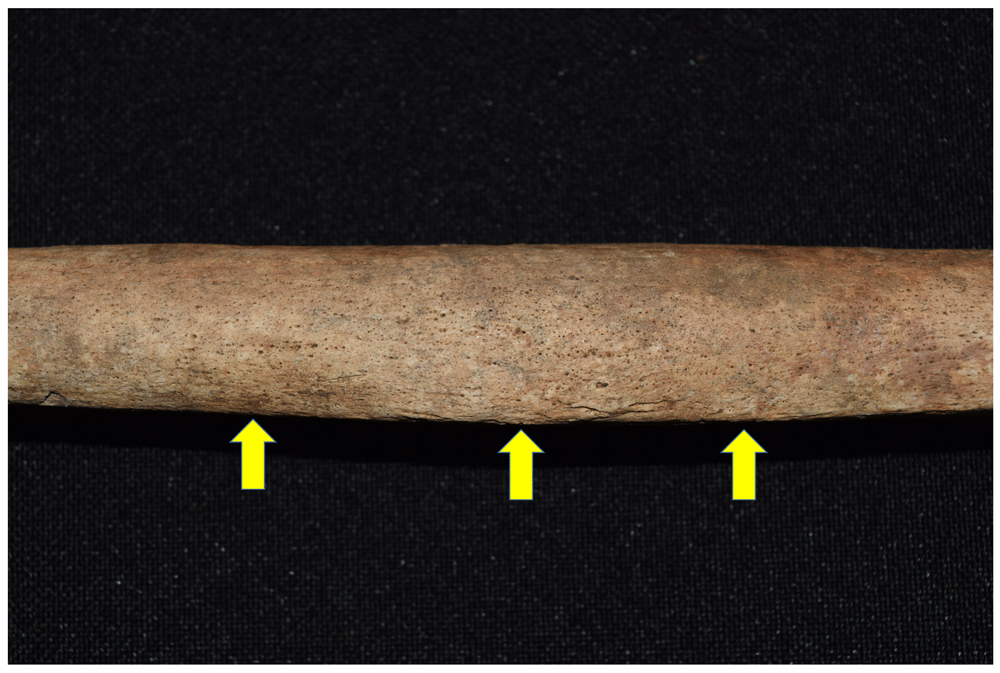
Figure 26. Periostosis in fibula compatible with treponematosis of 1126.
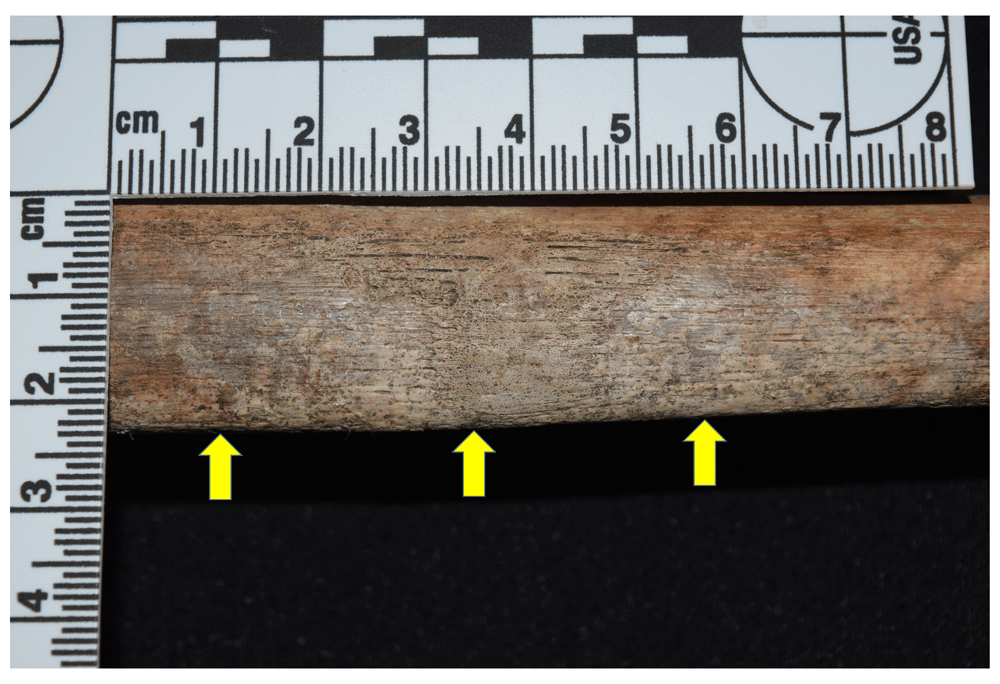
Figure 27. Periostosis in tibia compatible with treponematosis of 1122.
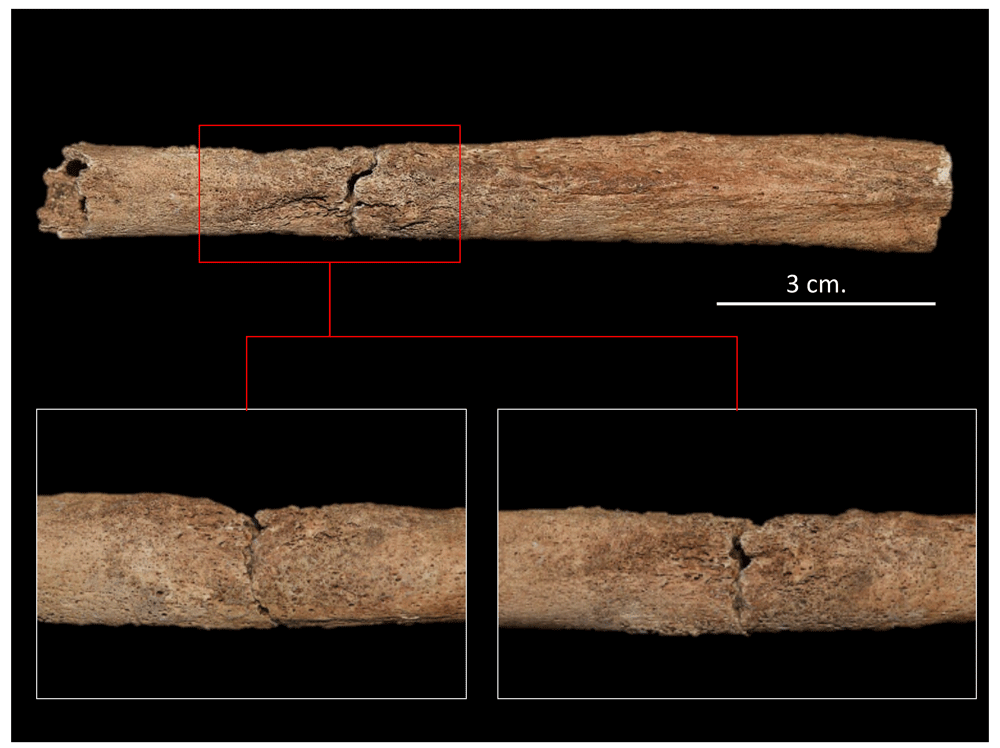
Figure 28. Widespread active periostitis in left fibula compatible with infectious process of 4017.
On the other hand, individual 1042 shows extended infectious processes at spine level, characterised by lytic lesions in the form of cavitations on vertebral bodies T8 to T11, concentrated in the anterior portion and on the lateral surfaces without affecting the upper and lower margins, with these lesions being compatible with tuberculosis (TB) or brucellosis.
In the case of TB, the presence of the disease could be underestimated in bioarchaeological contexts due to the low frequency of lesions present in the skeleton, given that it is estimated that between 1% and 7% of individuals suffering from the disease manifest bone reactions (Fornaciari & Giuffra, 2009: 63). The lesions are caused by the diffusion of bacilli through the bloodstream, affecting the portions rich in haematopoietic bone marrow, located basically in the metaphyseal sections of the long bones, vertebral bodies, and ribs. Paleopathological literature shows that over 40% of lesions associated with TB in the skeleton are concentrated in the spine, affecting the anterior region of bodies located in the lower portion of the thorax, as well as the intervertebral discs; although this frequently affects two or more vertebrae of the lower half of the dorsal and lumbar spine, it is in L1 where cavitations are most evident. In more severe cases, it generates a pathological fracture that causes so-called Pott's disease, along with marked kyphosis, while in other cases there may be fusion of the vertebrae (Aufderheide & Rodríguez-Martin, 1998; Campillo, 2001; Fornaciari & Giuffra, 2009; Waldron, 2009).
TB has another series of manifestations in the skeleton, for example periostosis can be observed on the pleura side of the rib arches, while articular tuberculosis can also develop, principally affecting the coxofemoral joint, followed by the sacroiliac, knee, tibio-astragalic and talocalcaneal (Fornaciari & Giuffra, 2009:72).
The individual 1042, despite having lytic lesions in the vertebral bodies without affecting the arches (one of the characteristics of TB), does not present the other lesions described above (Figure 29 to Figure 31). Moreover, brucellosis similarly affects the spine, and, although recurrence is found in the lumbar region, it can be found in other portions of the spine and, less frequently, can affect the long bones (Aufderheide & Rodríguez-Martín, 1998; Campillo, 2001). The differential diagnosis with TB considers that brucellosis lesions generally do not cause paravertebral abscesses, collapse of bodies or kyphosis, and tend to present destructive and reparative processes simultaneously (Aufderheide & Rodríguez-Martín, 1998: 193). It is also suggested that radiographic analysis could identify a sclerotic lesion typical of this disease that affects the anteroposterior angle of the body (Campillo, 2001:249–250).
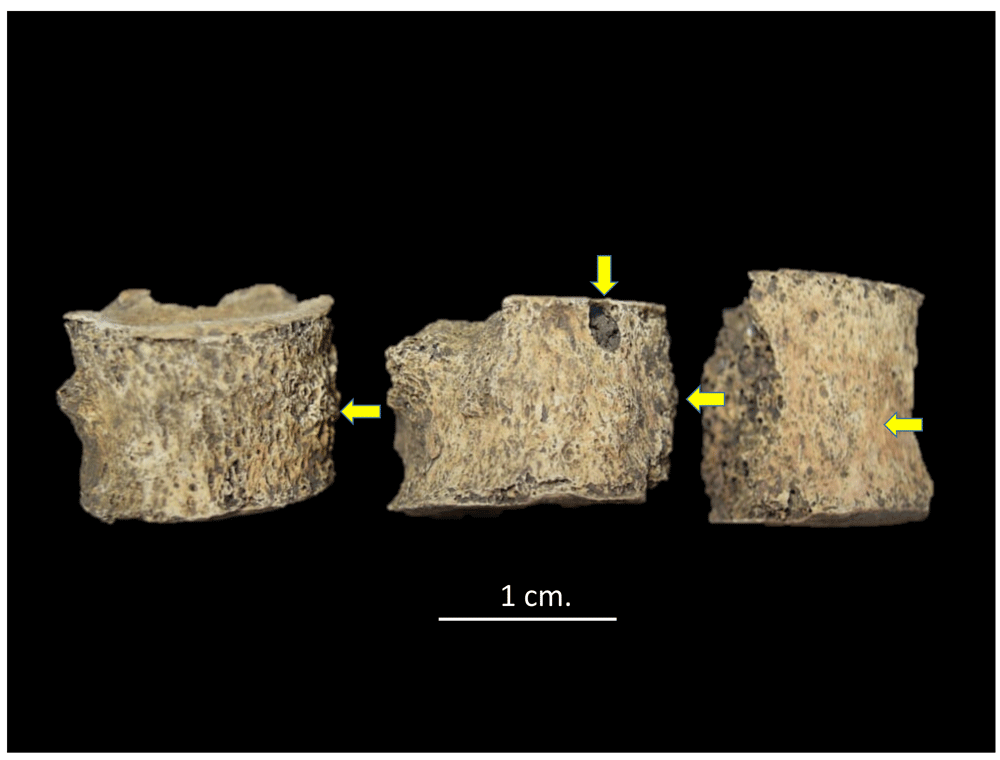
Figure 29. Lytic lesions and reparative processes in T8, 9 and 10 of 1042.
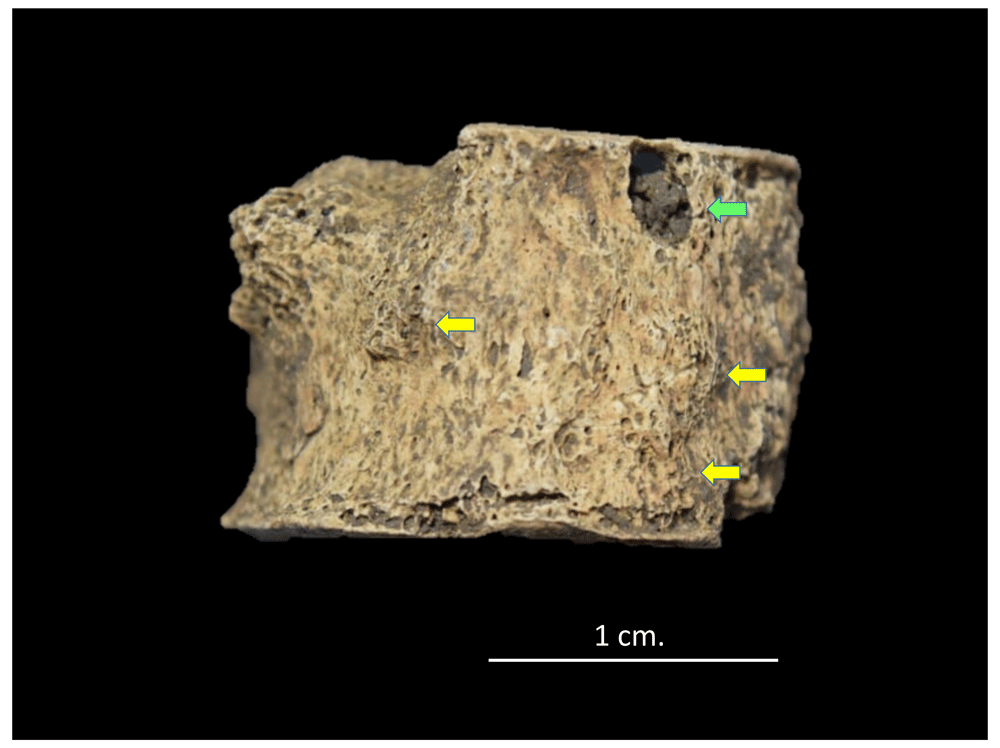
Figure 30. Lytic lesions (green) and reparative processes (yellow) in T10 of 1042.
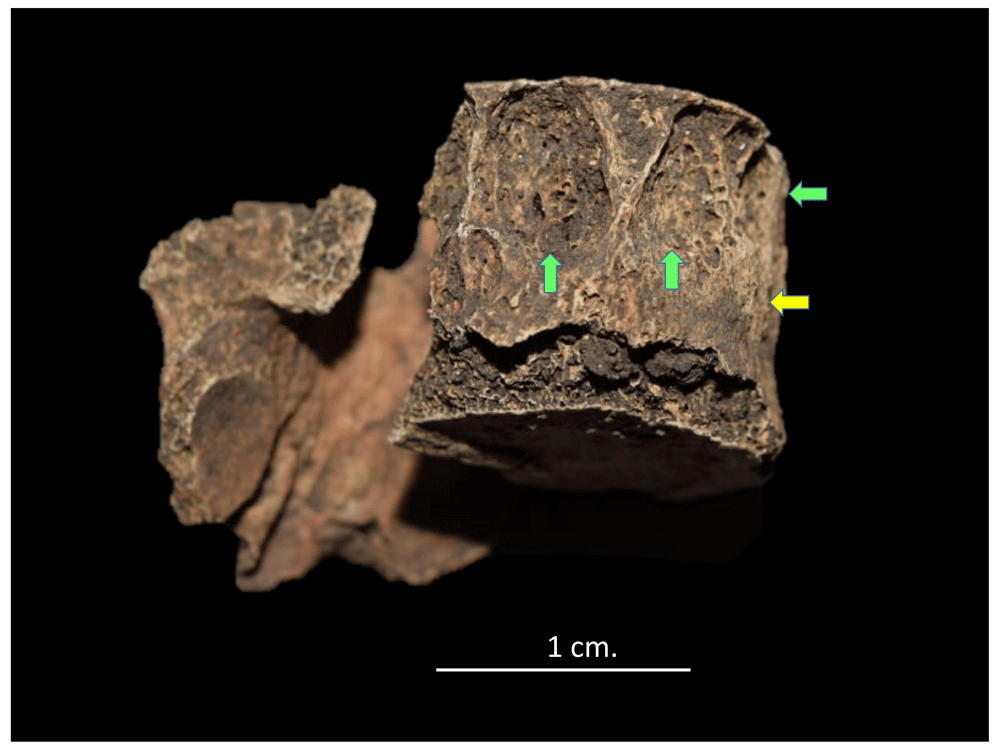
Figure 31. Lytic lesions (green) and reparative processes (yellow) in T11 of 1042.
Observing individual 1042 allows us to see the reparative processes alongside the lytic lesions, although a radiological evaluation could confirm the diagnosis. However, two individuals with cavitating lytic lesions similar to those described for individual 1042 from Panama Viejo’s cathedral were identified in an osteological sample from a medieval context in Albania, with the same region of the spine affected, but in this case it was possible to verify the diagnosis with molecular tests of the genetic markers of the bacterium Brucella spp. (Mutolo et al., 2012).
Another interesting case associated with infectious diseases is that of individual 1020, in which a process of severe inflammation is observed in the splanchnocranium, affecting the frontal, sphenoid, ethmoid, left palatine and both maxillae, generating nodular formations inside the paranasal and maxillary sinuses, together with inflammation of the dental alveoli and the consequent loss of some teeth (Figure 32 to Figure 38). Furthermore, the infection affects the interior of the pyriform aperture, and bone resorption is observed in the anterior nasal spine. There is also thickening of structures such as the crista galli of the ethmoid, as well as the body and greater wings of the sphenoid. These types of lesions are compatible with diseases such as leprosy, leishmaniasis and severe sinusitis.
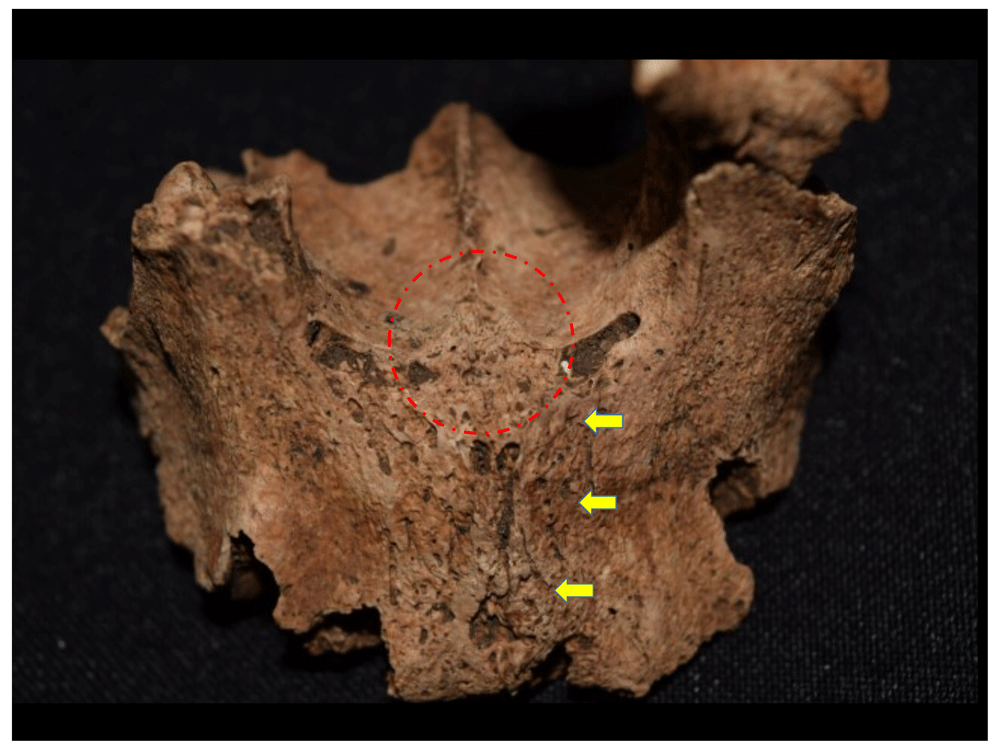
Figure 32. Reactive process in maxillary sinuses (yellow) and resorption of anterior nasal spine (red).
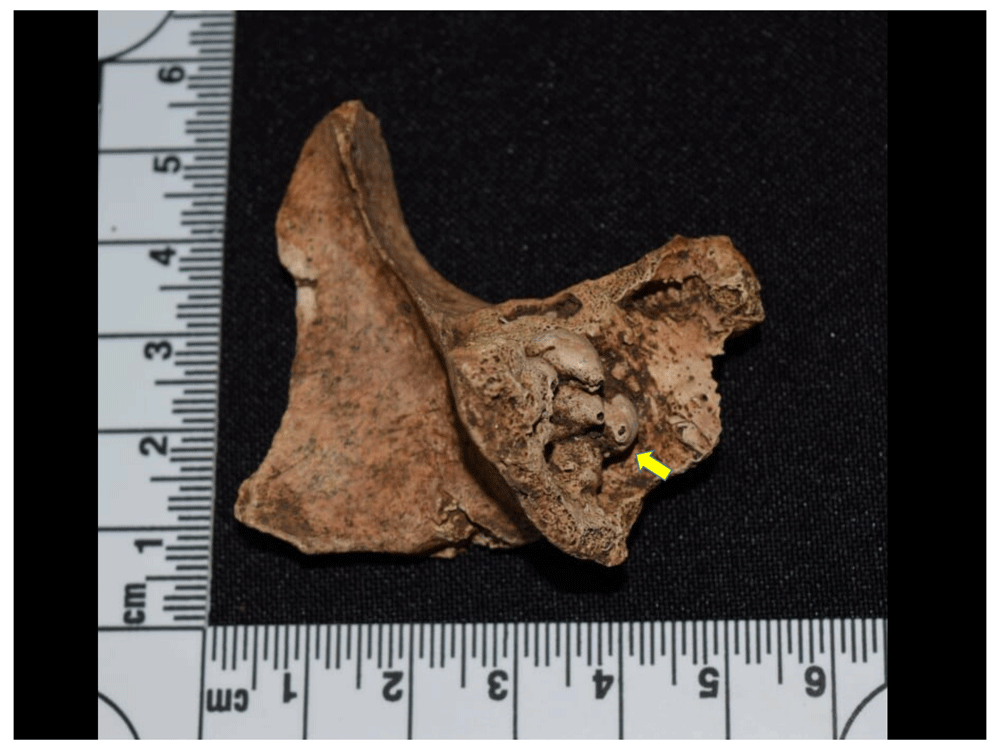
Figure 33. Nodular formations in maxillary sinus cavity, left zygomatic.
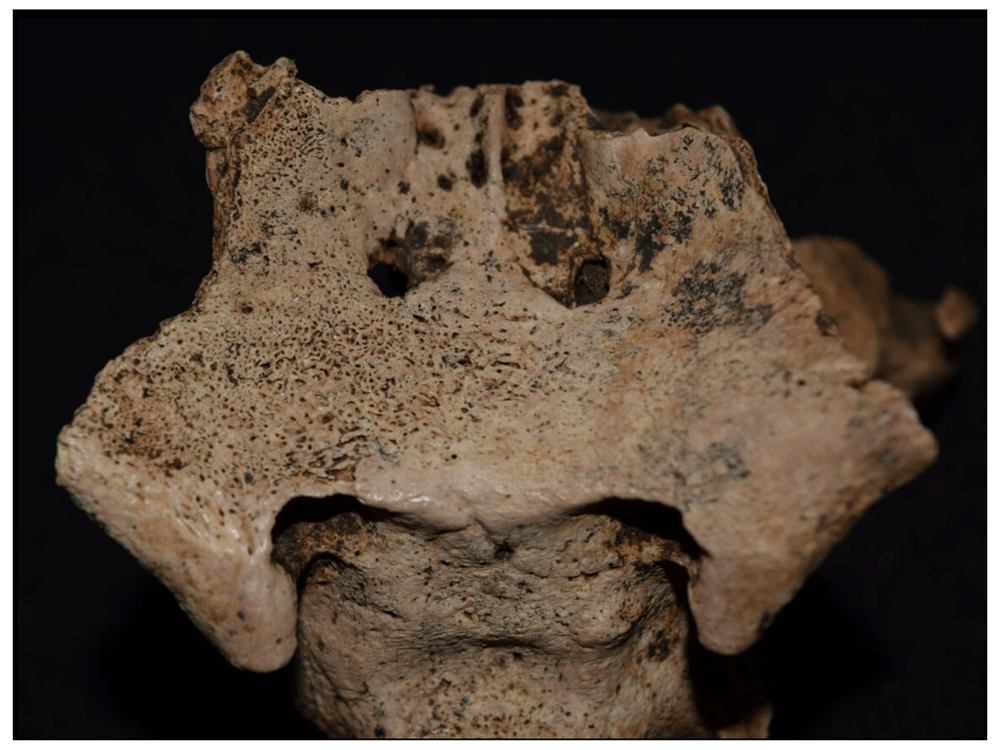
Figure 34. Reactive processes in body and lesser wings of the sphenoid.
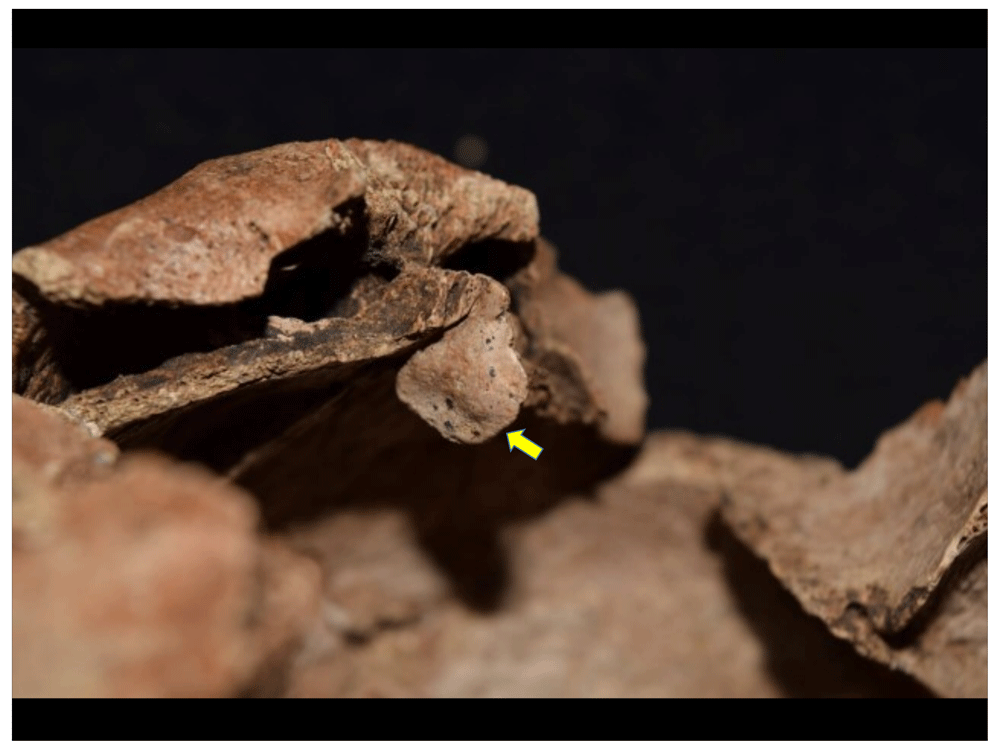
Figure 35. Inflammatory process in crista galli.
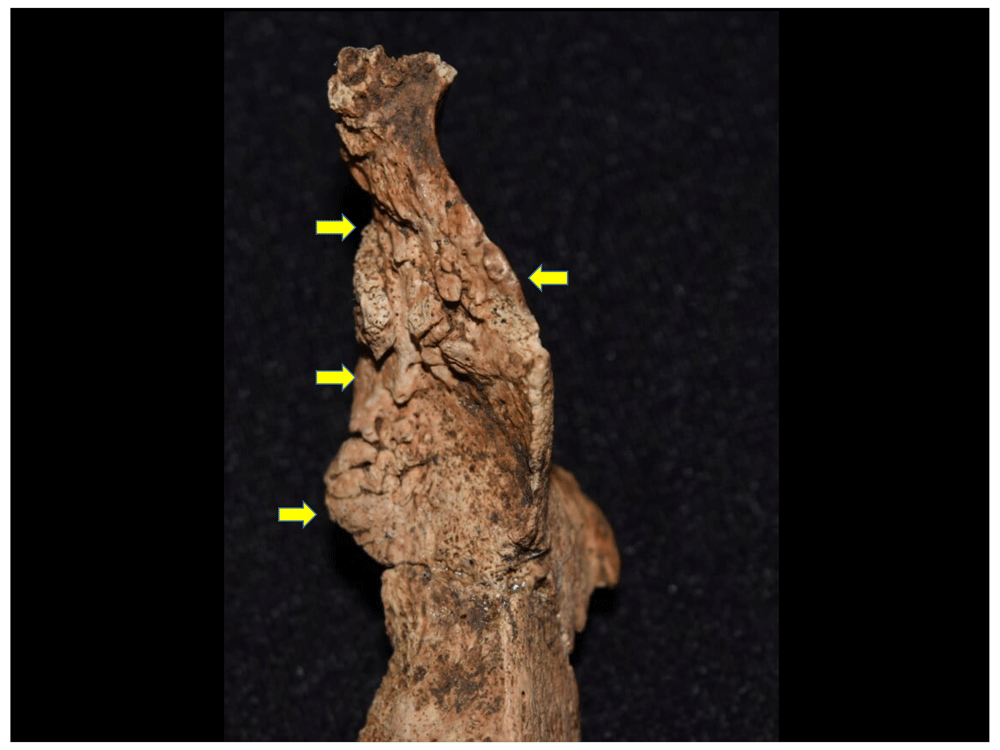
Figure 36. Lesions in pyriform aperture.
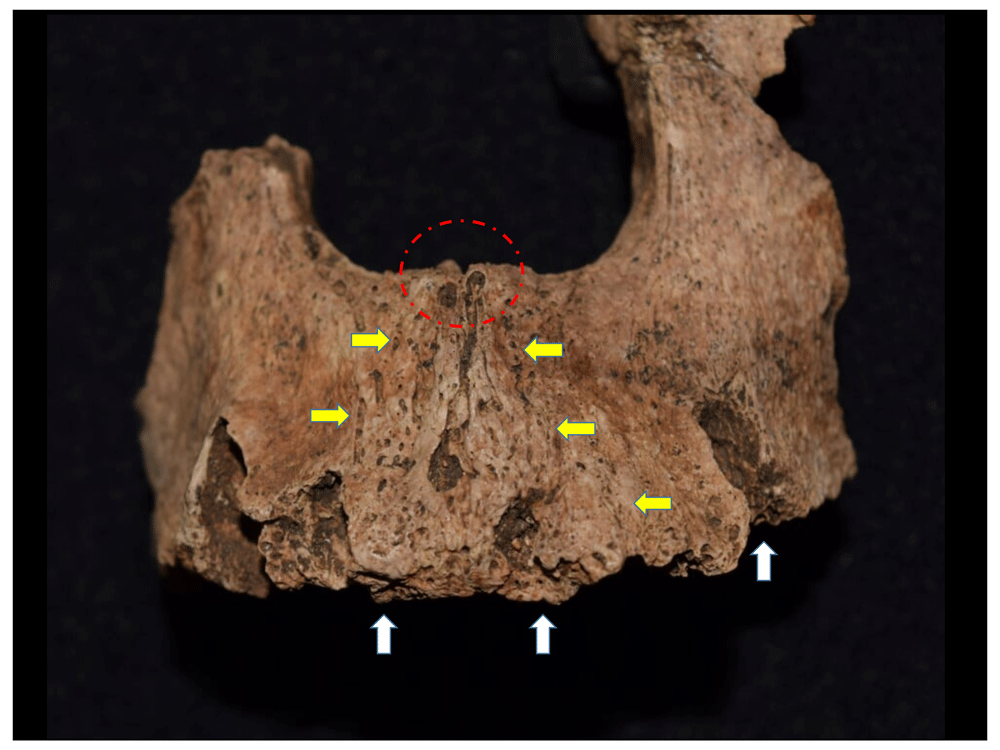
Figure 37. Lesions in maxilla and alveolar resorption in incisors.
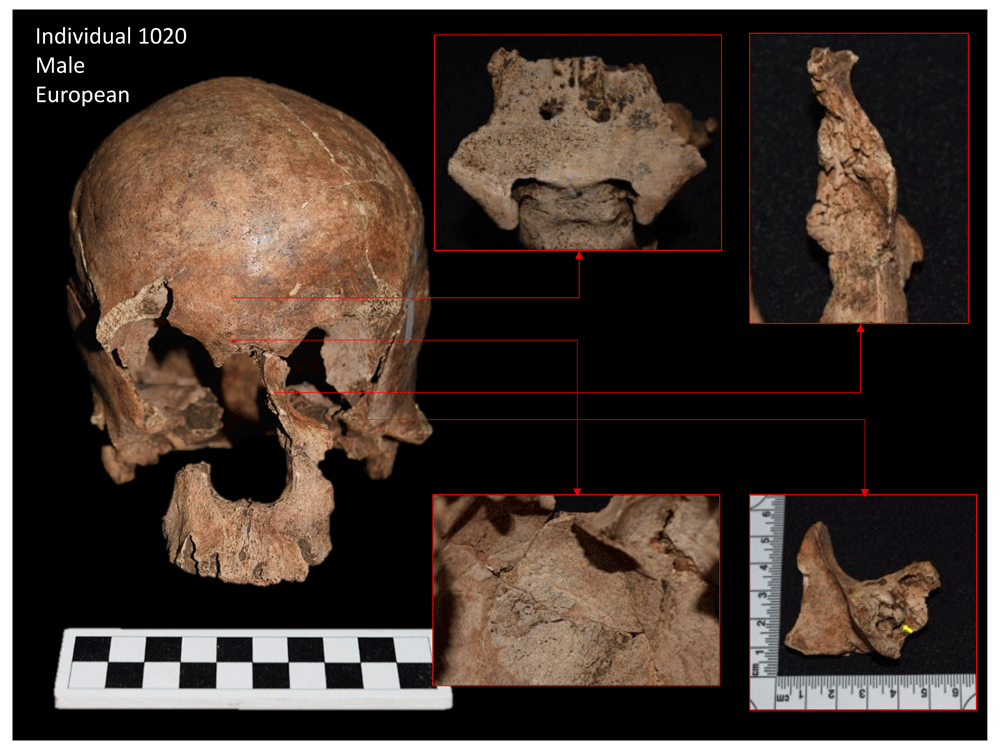
Figure 38. Some of the lesions identified in facial skeleton of 1020.
Leprosy is a mycobacterial disease that originated in East Africa and the Middle East, from where it spread to Europe and later reached the Americas during the conquest and colonisation (Waldron, 2009:97). Although this disease mainly affects the nervous system and the skin, it also generates bone responses in advanced stages of tuberculoid leprosy. However, not all individuals who suffer from leprosy manifest lesions in the bone, which explains why it is found with very low frequency in archaeological contexts (Aufderheide & Rodríguez-Martín, 1998; Fornaciari & Giuffra, 2009; Waldron, 2009). In the 1960s, Moller-Christensen identified the bone characteristics of the disease under the term "facies leprosa" or rhinomaxillary syndrome, which is characterised by chronic inflammation of the bones of the nose with consequent atrophy and resorption of the anterior nasal spine, remodelling of the margins and base of the pyriform aperture, and erosion of the nasal bones, the nasal pavement, and the palatine, which may be perforated. Finally, resorption of the alveolar processes in the maxilla is also observed with loss of central incisors (Aufderheide & Rodríguez-Martin, 1998; Fornaciari & Giuffra, 2009; Waldron, 2009).
All of these elements can be identified in individual 1020. However, the fact that this individual is only represented by the cranium makes it impossible to identify the characteristic lesions of this disease in the postcranial skeleton, including concentric erosion of bone at the feet and hand level, leading to the loss of phalanges, and significantly affecting the metatarsal phalangeal joint, giving the metatarsals the appearance of a pencil tip. It is also possible to find osteomyelitis in the bones of the foot or neuropathic changes in its joints. However, the fact that the aetiology of this disease is not so clear in paleopathology has led some to recommend mycobacterial DNA analysis (Waldron, 2009:101).
Individual 1020 also presents lesions compatible with chronic maxillary sinusitis due to the nodular formations observed in these cavities, together with the inflammatory processes of the bone; such lesions may be caused by the action of different infectious agents affecting the individual (Campillo, 2001; Waldron, 2009), among which leprosy or leishmaniasis cannot be ruled out. Leishmaniasis is a parasitic infection of the skin and mucous membranes that affects populations in humid regions of Central and South America. In an advanced stage, the disease affects the mucocutaneous cavities of the nose, involving the bone and generating destructive processes that can also affect the orbits and paranasal sinuses; however, in this case the disease is diagnosed using histologic (Aufderheide & Rodríguez-Martín, 1998: 257) or molecular methods (Costa et al., 2009).
After infectious type lesions, entheseal changes (Figure 39 to Figure 41) and DJD (Figure 42 to Figure 44) were the most frequent in the sample, with effective prevalences of 29.3% and 24.2%, respectively. As the Europeans arrived, people coming together to form the new cities of the New World became involved in a range of more physically demanding activities, as they faced the difficulties of adapting to a totally different environment and lifestyle. Along these lines, it would not seem strange that the population of Panama Viejo had to engage in arduous tasks that led to lesions associated with muscular hypertrophy or enthesis, as evinced in the marked insertions left on the bones or in the marked stress on the body's articular mechanisms, creating space for the formation of lesions associated with DJD.
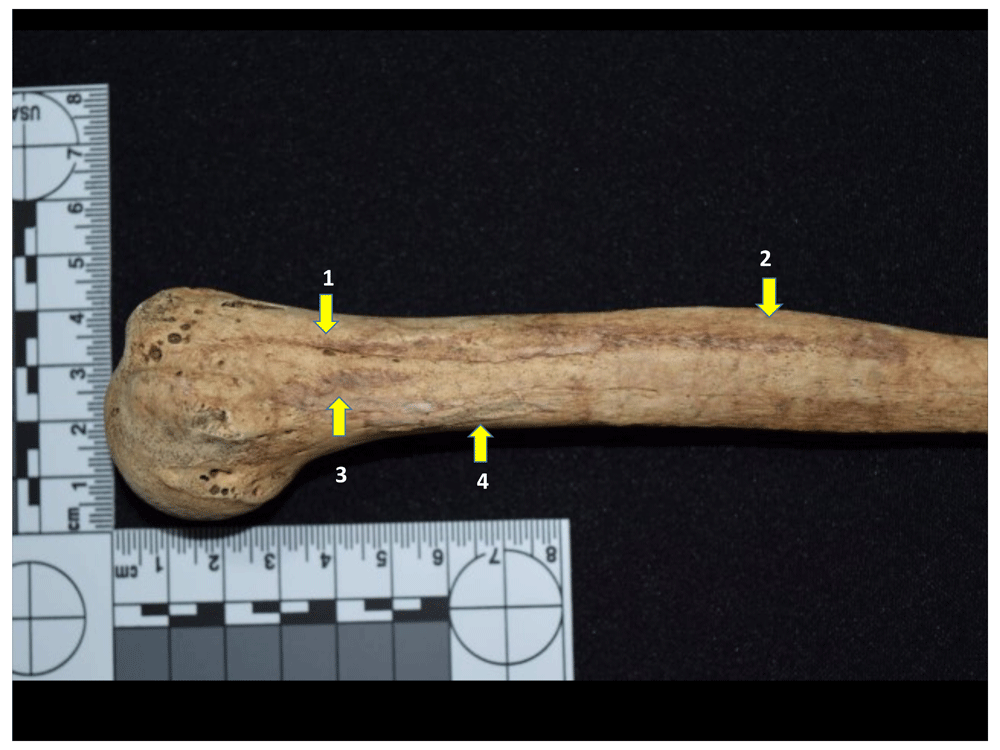
Figure 39. Entheseal changes for pectoralis major (1), deltoid (2), latissimus dorsi (3), teres major (4).
Left humerus of 1082.
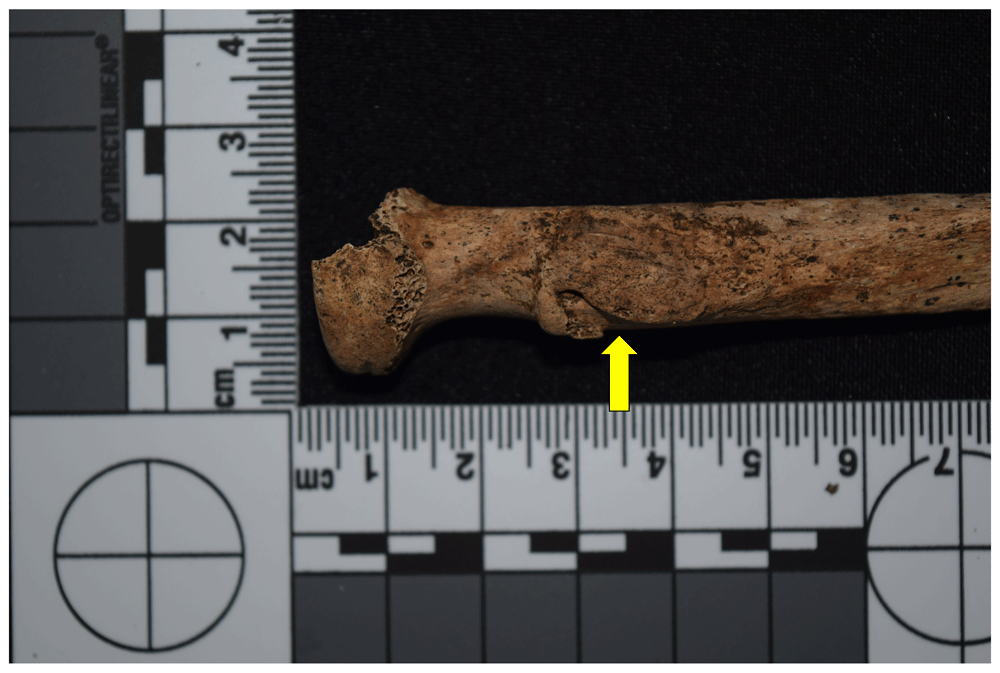
Figure 40. Development of enthesis for insertion of biceps brachii in right radius of 1048.
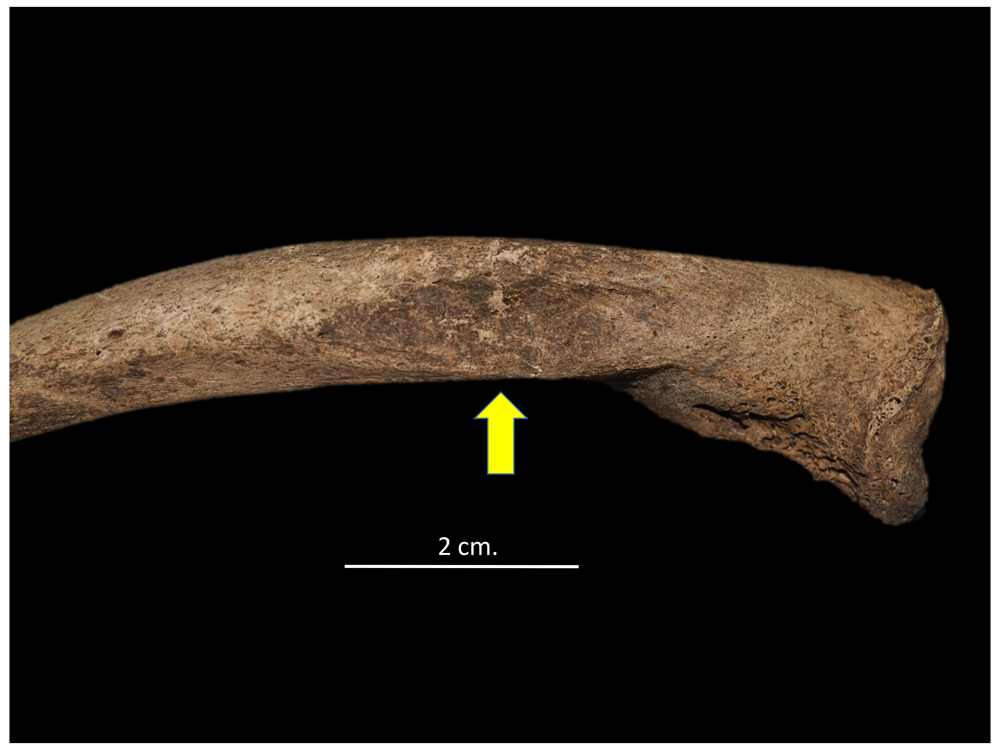
Figure 41. Entheseal change for insertion of pectoralis muscle in the right clavicle of 4023.
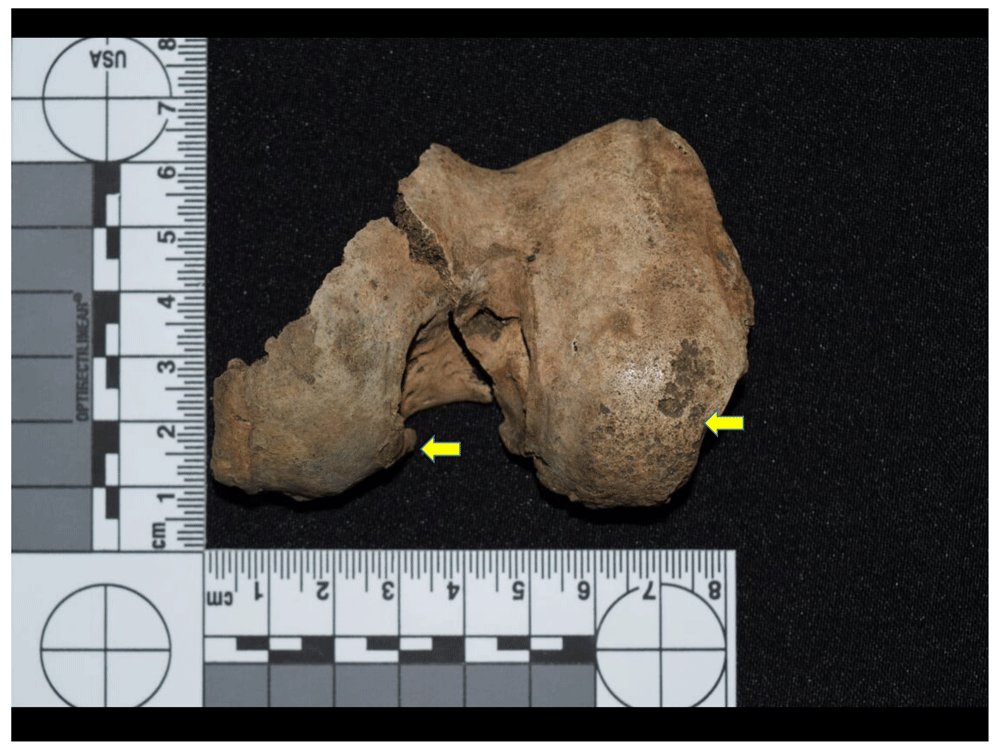
Figure 42. Condyles of right femur of 1153, evidence of eburnation and marginal lipping (degenerative joint disease).
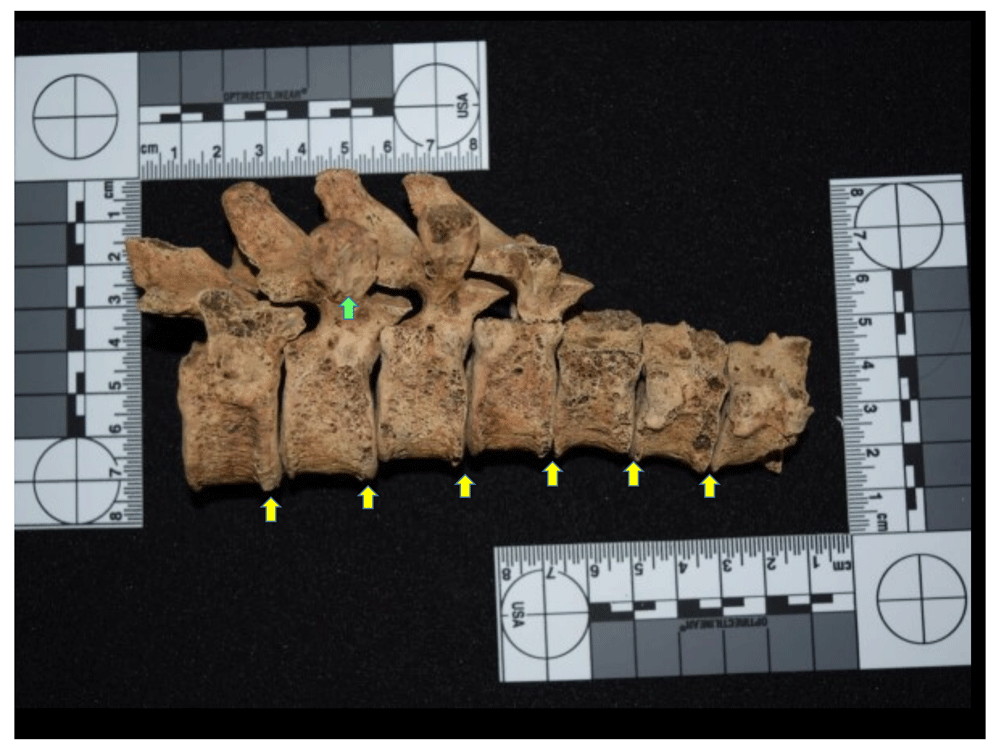
Figure 43. Spondyloarthrosis (degenerative joint disease) with osteophytosis (yellow) and marginal lipping (green) at T8 to T11 of 1139.
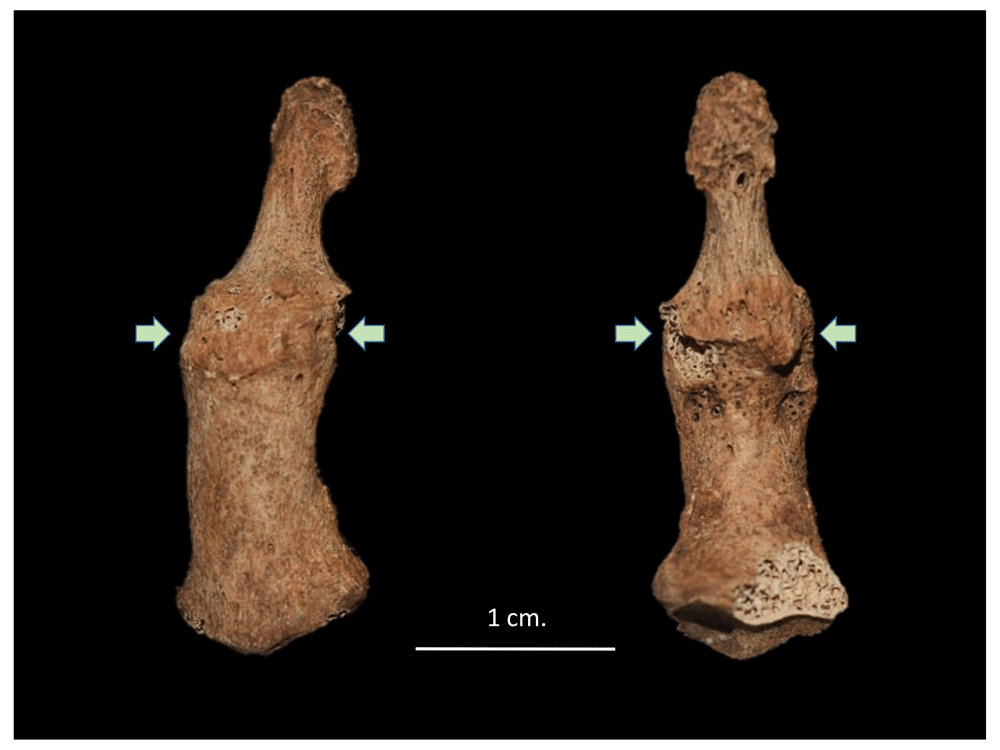
Figure 44. Ankylosis of distal and middle phalanges of fifth finger of left hand of 4013 generated by degenerative joint disease.
However, it should be noted that DJD is not always associated with mechanical stress due to physical activity, but is directly related to the ageing processes of individuals, with these lesions being more frequent in older persons. However, the characteristics of the Panama Viejo sample show the presence of mostly young or medium adults, suggesting a higher incidence of processes associated with physical activity. In other words, it is likely that the population for the colonial period was exposed to much more demanding work processes than those of the pre-Hispanic period, which directly or indirectly generated bone responses showing marked physical activity and lesions compatible with DJD.
Moreover, the high frequency of porotic hyperostosis in the sample (27.39%) suggests that the population was subjected to nutritional stress factors that caused this type of lesion in the bone (Figure 45), although it does not seem to match other characteristic traits of this type of condition, such as cribra orbitalia (8.28%) (Figure 46) and, as discussed below, nor does it correspond with linear enamel hypoplasias (LEH). In this case, it is necessary to consider not only aspects related to the diet of these populations, but also the incidence of other factors that can cause these lesions, such as parasitosis and intestinal problems; such factors tend to be much more frequent in lowlands such as Panamá, where the prevalence of these types of lesions is much higher than in mountainous regions (Rodríguez Cuenca, 2006: 178).
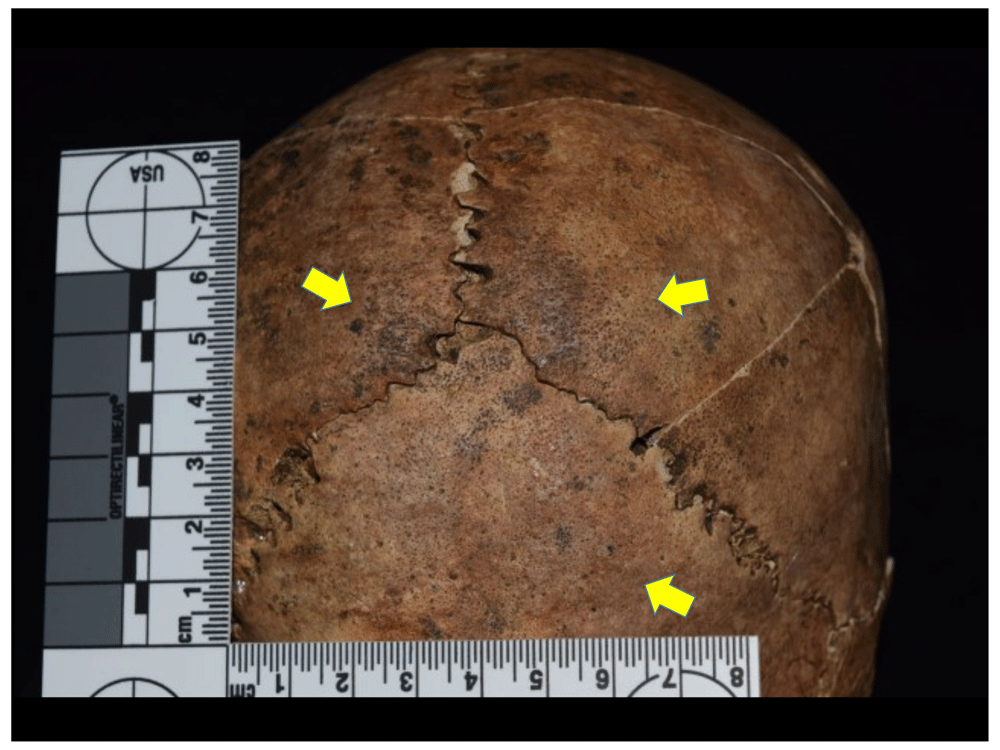
Figure 45. Porotic hyperostosis in parietals and occipital of 1022.
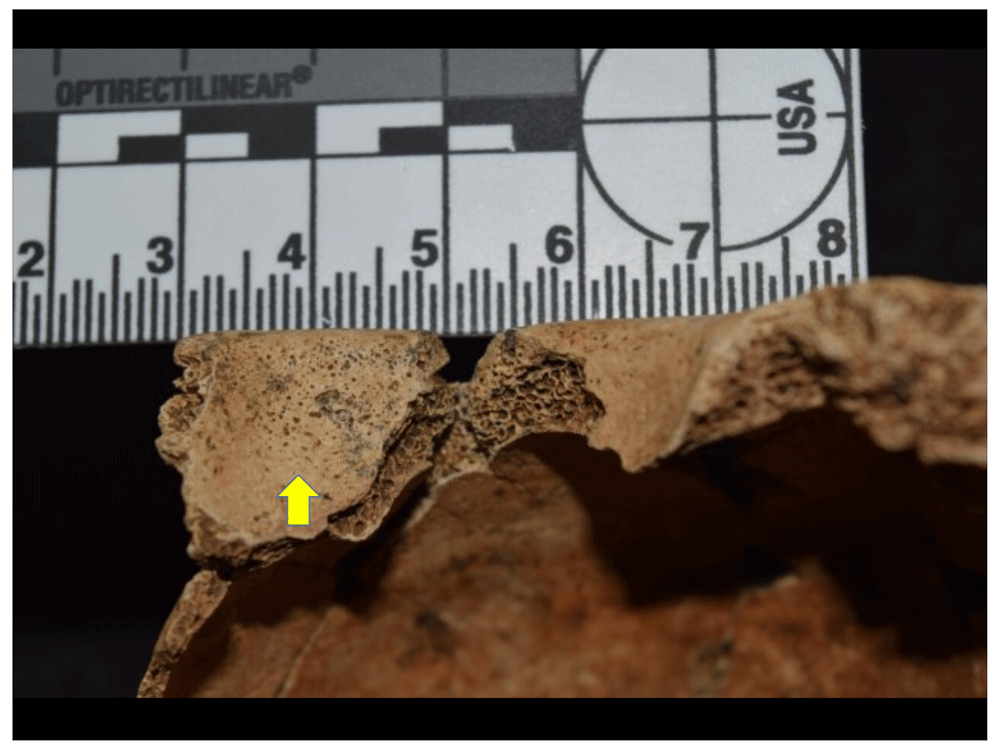
Figure 46. Cribra orbitalia on the right side in 1034.
However, if we take the hypothesis that porotic hyperostosis is related to nutritional stress events, it is important to relate the data to the type of population that makes up the sample excavated in the cathedral, which consists mostly of women and individuals with predominantly European and African traits, as will be addressed below. However, in this regard it should be noted that for many peoples the distribution of food tended to vary according to social position, with the largest portions and the most nutritious foods generally going to the group's authorities, leaving the rest for those at the bottom of the social pyramid. This type of practice evidently left in survivors a series of traces that show the nutritional stress they were subjected to, which is compatible with the indicators of porotic hyperostosis in the crania, cribra orbitalia in the roof of the ocular orbits, and linear enamel hypoplasias. Academic literature has associated these lesions mostly with anaemic events acquired due to nutritional deficiencies, as well as congenital factors such as thalassaemia, sickle cell anaemia and spherocytosis, among others (Fornaciari & Giuffra, 2009; Larsen, 2015; Walker et al., 2009). However, as they are non-specific indicators, other factors such as diarrhoea, chronic haemorrhages or parasitosis also play a role. Moreover, the association between porotic hyperostosis and cribra orbitalia is not always constant, which makes diagnosis and aetiology even more difficult.
Several discussions state that porotic hyperostosis and cribra orbitalia should not be used as pathognomonic markers of iron deficiency anaemia, which is perhaps the most frequent interpretation in the literature; indeed, according to some authors this condition in itself causes a decrease in red blood cells that does not allow bone reaction in the hypertrophic and porous processes of these lesions (Walker et al., 2009). However, subsequent works have come to demonstrate that the relationship between the manifestation of porous lesions and iron deficiency cannot be completely ruled out, since, according to the medical literature, this type of anaemia stimulates erythropoietic activity and, in turn, generates hyperostosis (McIlvaine, 2015; Oxenham & Cavil, 2010).
However, there are other types of anaemia that elevate red blood cell production and are thus compatible with the development of the lesions recorded in the porotic hyperostosis and the cribra orbitalia, e.g. ameloblastic anaemia and haemolytic anaemia (Walker et al., 2009). The former are associated with deficiency or malabsorption of vitamins B12 and B9 (folic acid), alongside iron deficiency (McIlvaine, 2015). The second comes about through the premature destruction of erythrocytes, which, by exceeding the production capacity of red blood cells, stimulates bone hyperostosis, a condition that will be observed in congenital anaemias such as thalassaemia and sickle cell disease (Walker et al., 2009: 112). Moreover, in some regions of the world, processes of adaptation to endemic diseases such as malaria may play a big role in the development of this type of hereditary haemolytic anaemias (Angel, 1966; Larsen, 2015; Smith-Guzmán, 2015; Walker et al., 2009).
Associated with other metabolic disorders, we found evidence of a series of lesions that systemically affected the internal table of the cranium in five of the excavated individuals, specifically in the frontal bone (Figure 47 to Figure 51). The anomalies are characterised by an inflammatory periosteal reaction in different degrees of development, observing a bone apposition of nodular appearance that affects the endocranial view of the frontal, with the lesion concentrated mainly in the frontal crest and, bilaterally and symmetrically, in the orbital portion. In only one case does the lesion extend into the superior sagittal sulcus. These traits are compatible with type-B hyperostosis frontalis interna (HFI), according to the scale proposed by Hershkovitz & Colleagues (1999), whose lesions affect less than 25% of the frontal surface. However, more severe lesion damage is only seen in one of the cases, which would be a type-C on the Hershkovitz scale (Figure 38).
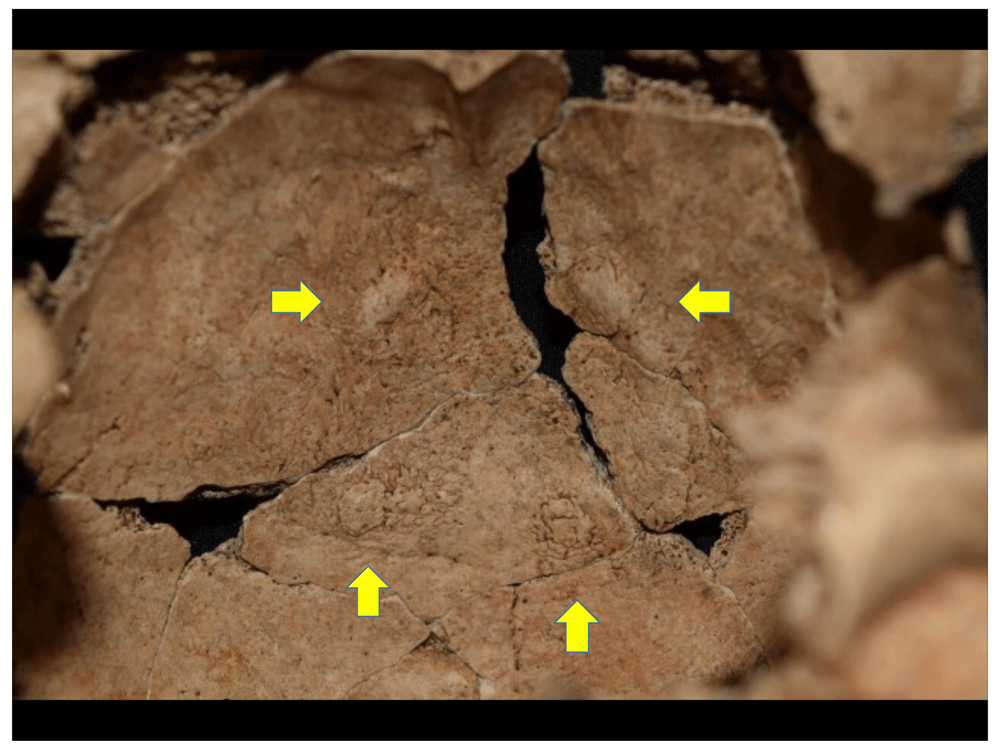
Figure 47. Lesions compatible with hyperostosis frontalis interna in 1022, female individual.
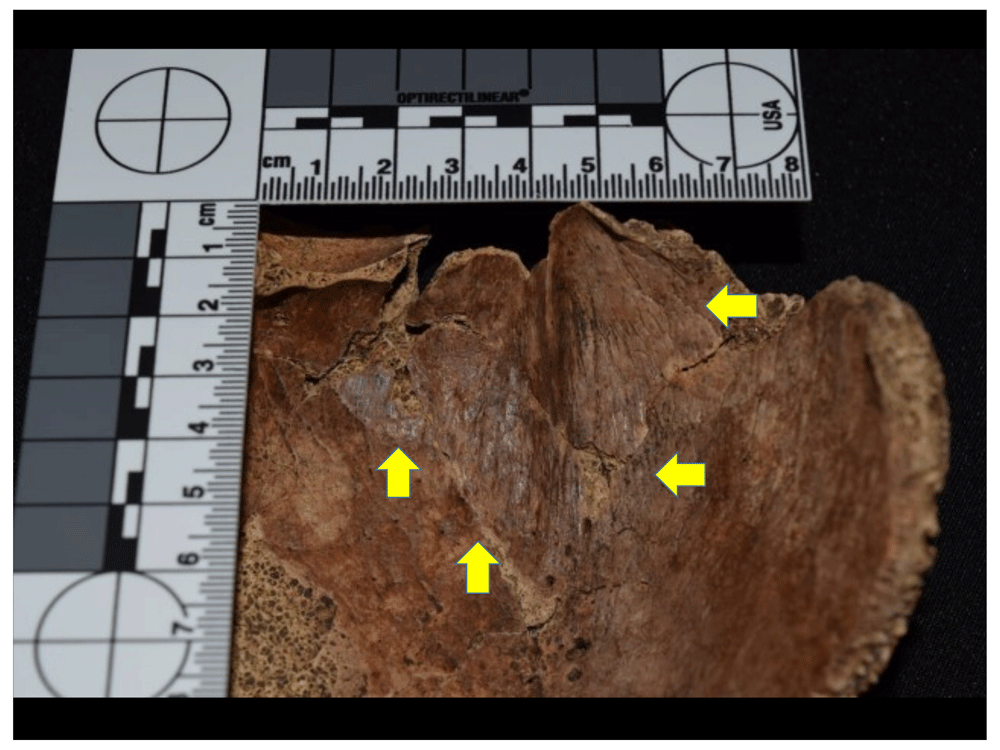
Figure 48. Lesions compatible with hyperostosis frontalis interna in 1029, male individual.
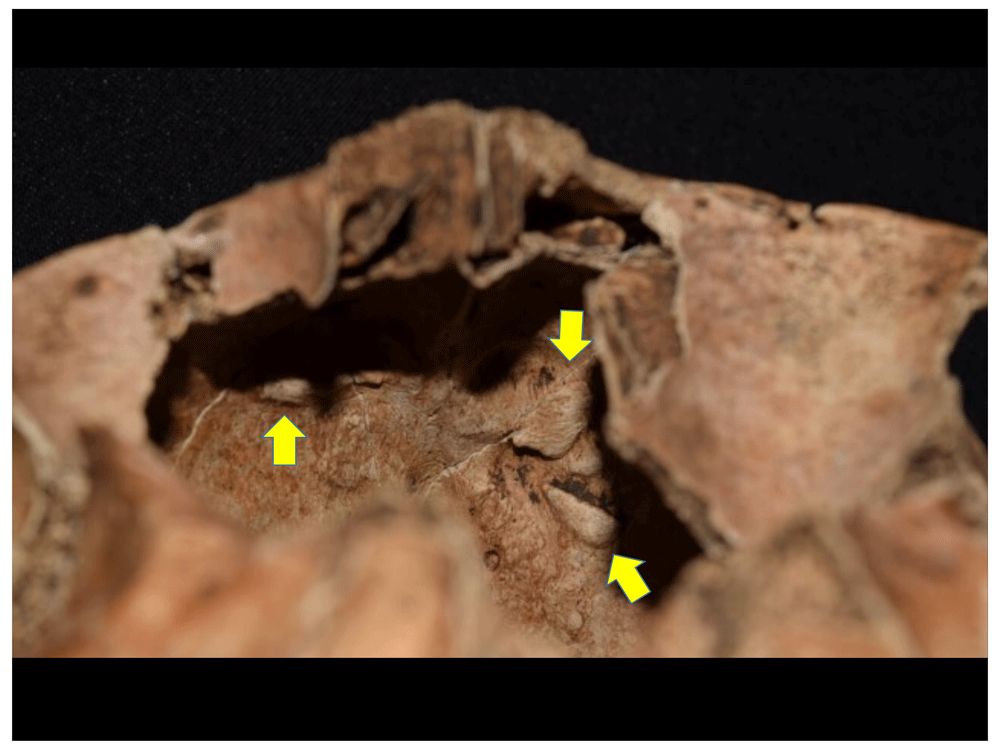
Figure 49. Lesions compatible with hyperostosis frontalis interna in 1030, male individual.
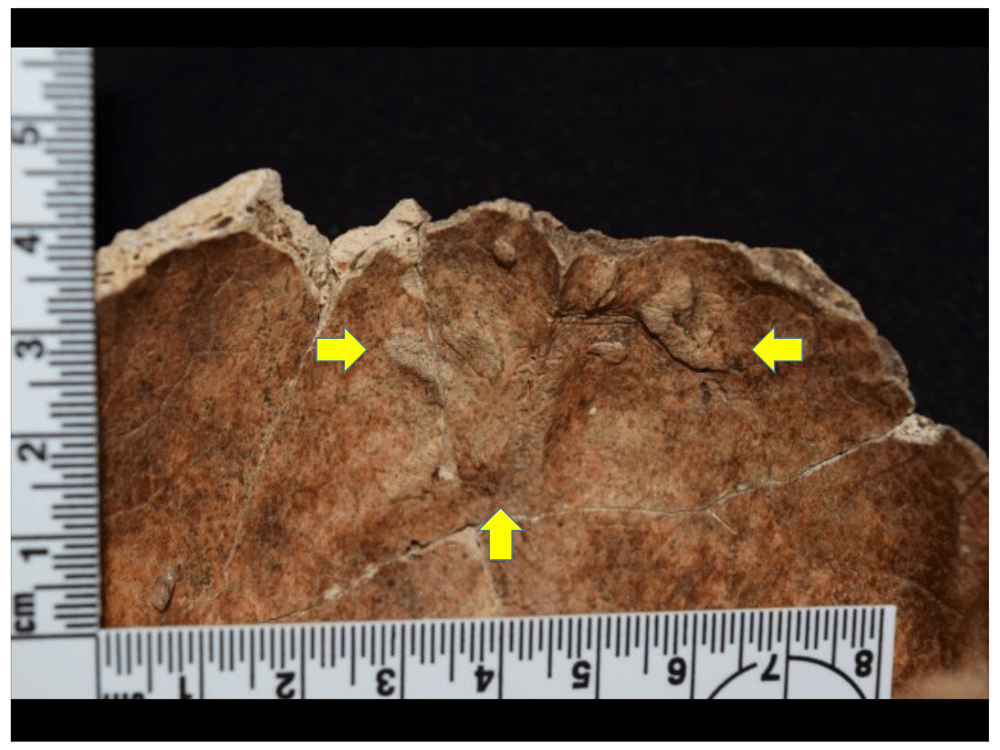
Figure 50. Lesions compatible with Hyperostosis frontalis interna in 1078, female individual.
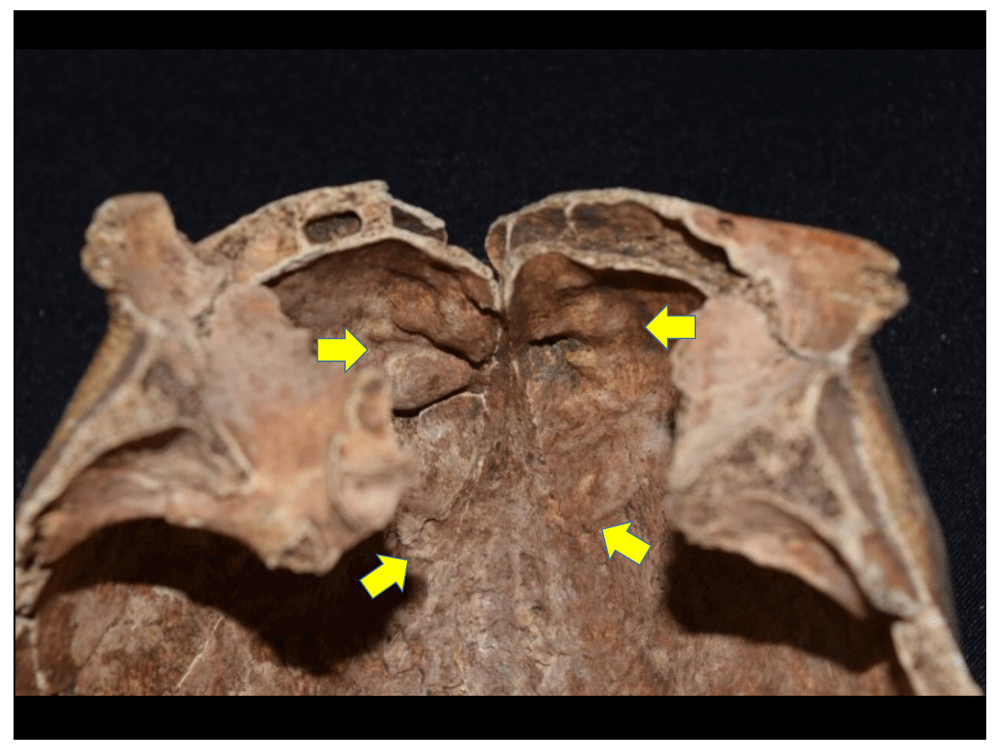
Figure 51. Lesions compatible with type-C hyperostosis frontalis interna in 1118, female individual.
The prevalence of this lesion in modern populations is still debated, although it is much more frequent in females (24%) than in males (5%), and its aetiology is still unclear. For example, it is reported that HFI is related to hormonal disorders, abnormal glucose regulation, arterial hypertension, obesity, and genetic factors (Belcastro et al., 2011). The crania identified with these lesions in the Cathedral correspond to three female individuals, two young adults and another middle adult, and two males, both identified as adults, but without specifying the age group. It is noteworthy that the increase in the severity and frequency of the lesion in women is related to age, and that moderate manifestations (types A and B) do not seem to have a significant relationship to ethnic groups, unlike in African populations, where a higher frequency and more severe manifestations have been detected (Hershkovitz et al., 1999: 310–311). In the case of male individuals, the mildest manifestation of the lesion (type A) is often present, but when type B is present it is usually in individuals over 50 years of age (Hershkovitz et al., 1999: 311). Despite the few cases reported in the literature, the aetiology in male individuals seems to correspond to disorders in sex hormones, associated with feminisation processes, testosterone reduction and testicular atrophy (Belcastro et al., 2011). However, it is difficult to identify the cause of the lesion in individuals from Panama Viejo’s Cathedral.
The number of traumatic lesions in the sample is also striking (Figure 52 to Figure 57), reaching an effective prevalence of 17.83%, of which 55.17% are concentrated in the cranium and the rest are fractures recorded in the upper limbs (13.79%), lower limbs (13.79%) and spine (17.24%). With regard to cranium fractures, it is evident that all except two healed during the lifetime of the individuals, and are linked to blows that may have been carried out with blunt instruments. In two of the cases, the lesion is observed to have an elastic appearance with colouration at the fracture margins consistent with a perimortem event. In one of them, it is also observed that the lesion left a regular, deep, elongated lanceolate-shaped margin which is consistent with a sharp weapon, but on the other side there is an irregular wall that may be due to the movement made to remove the blade of the instrument that caused the wound, leading to the fracture in this portion of the bone; such characteristics would suggest the use of a sharp heavy weapon. However, care must be taken in this type of observation, since the taphonomy of the site may have caused this fracture, although a microscopic analysis (SEM) could verify the timing of the lesion (peri or postmortem) and whether the weapon left any kind of trace in the bone.
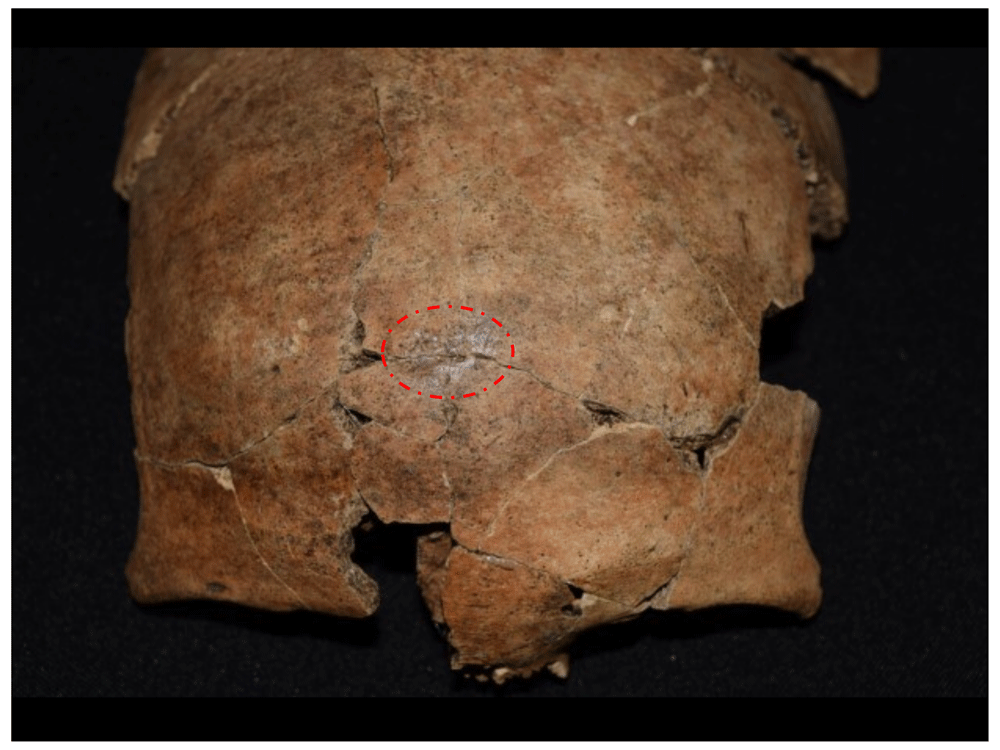
Figure 52. Healed traumatic lesion in frontal of 1056.
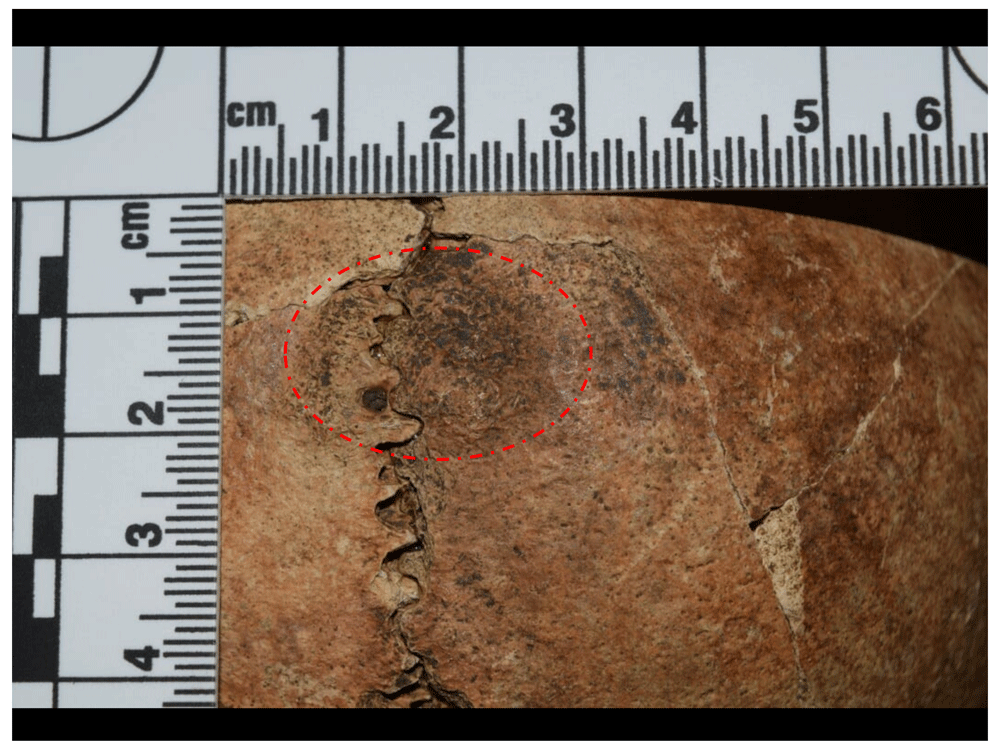
Figure 53. Healed traumatic lesion in parietals of 1066.
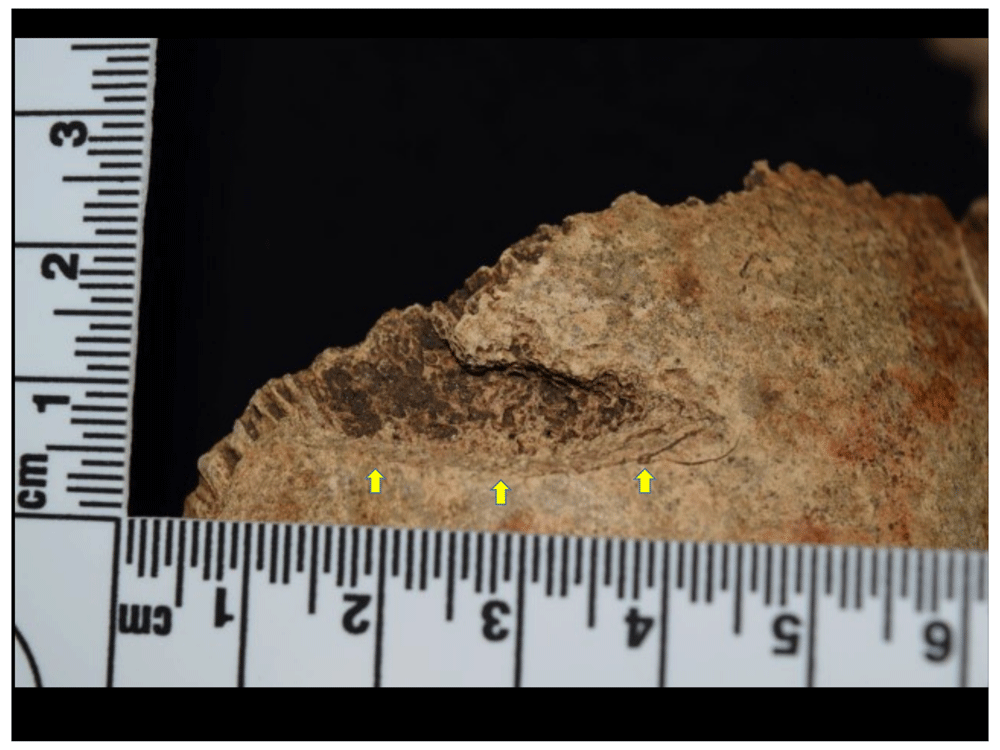
Figure 54. Perimortem lesion consistent with wound from blunt short weapon in 1015.
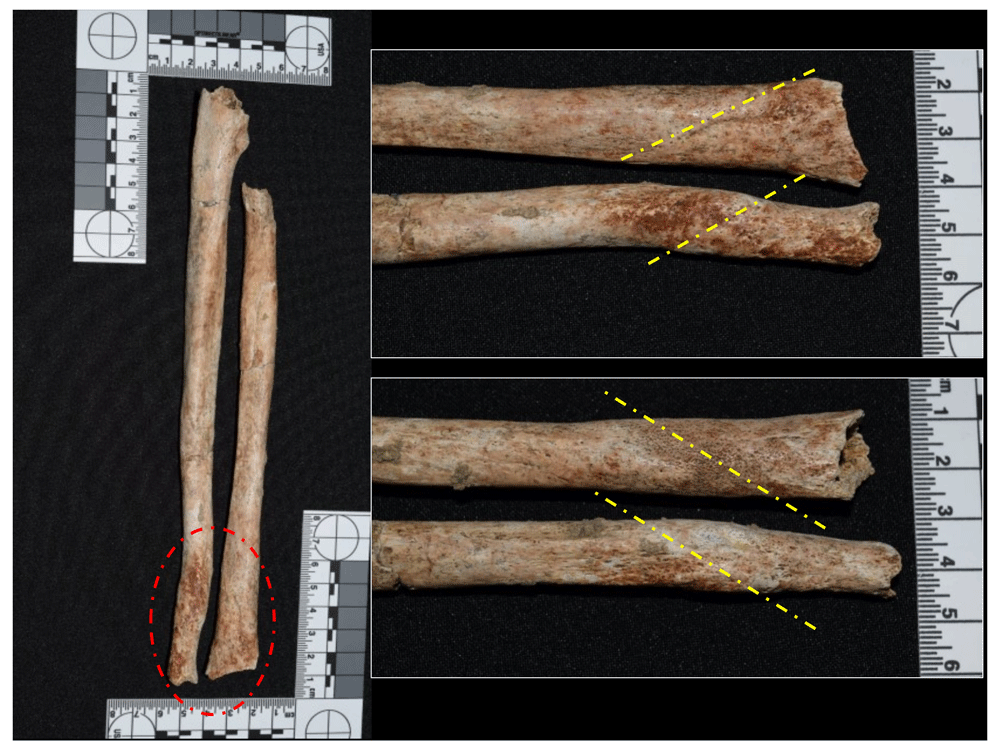
Figure 55. Healed fracture in distal third of left ulna and radius of 1180.
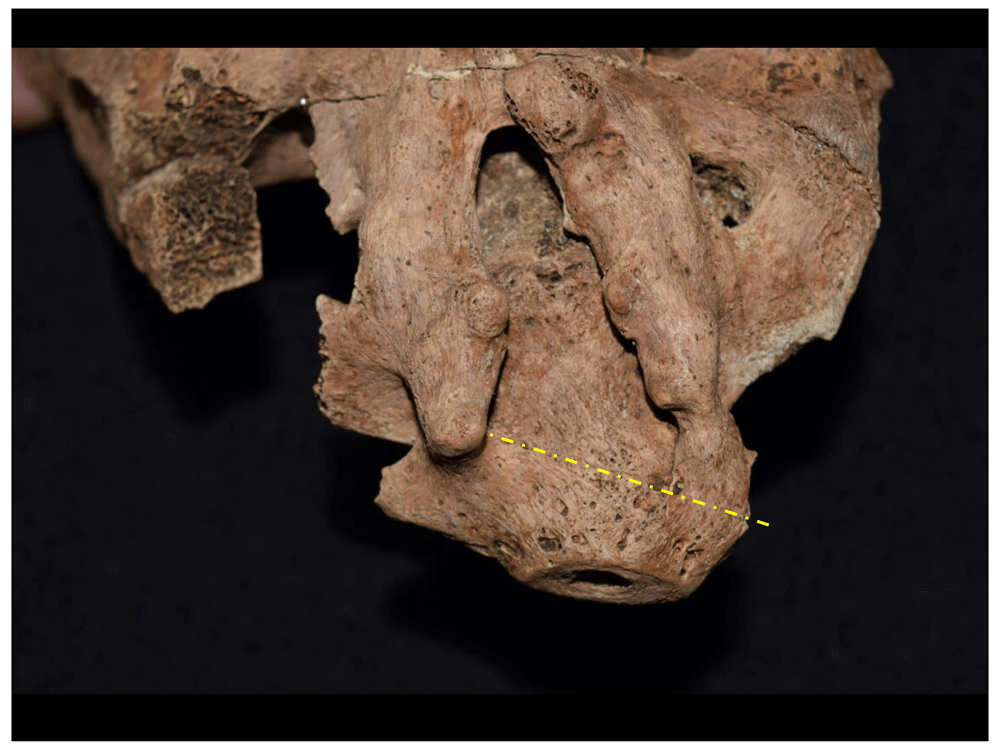
Figure 56. Healed fracture in the first coccygeal vertebra of 1167, and incomplete spina bifida.
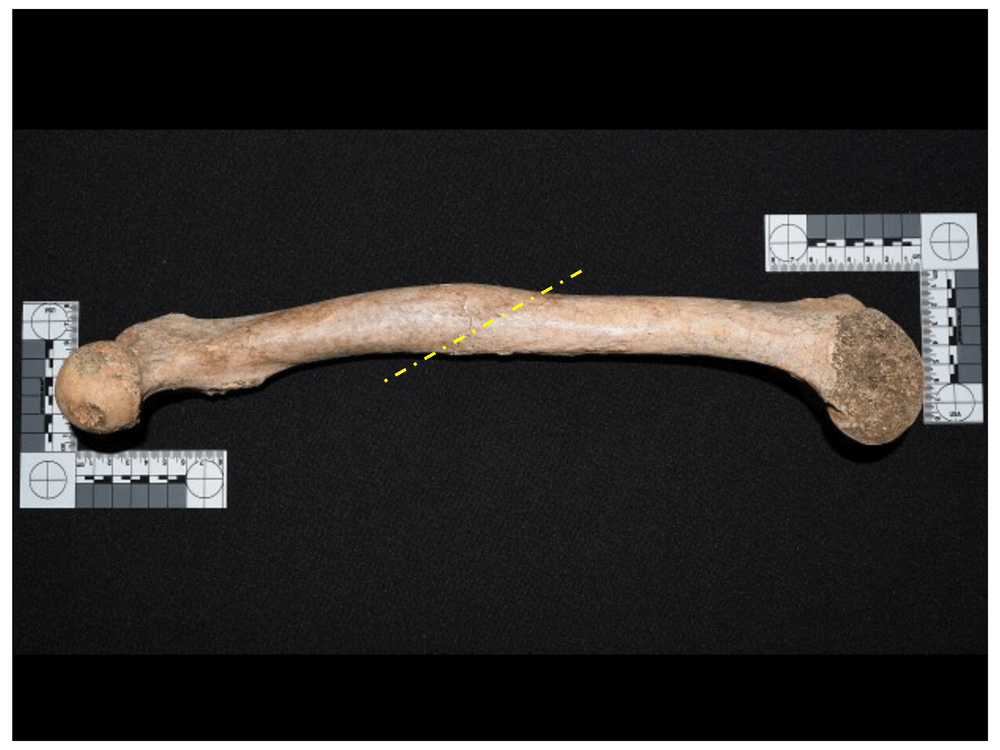
Figure 57. Healed fracture in left femur of 1171.
With an effective prevalence of 8.92% in the whole sample, neoplasms or tumours have a relatively high prevalence in which about 78.57% of individuals diagnosed with neoplasms have button osteoma in the cranium (Figure 58 and Figure 59). The remaining percentage corresponds to three individuals who present bone tumour formations, one in the pelvic region (Figure 60) and the other two with non-reactive compact bone neoplasias in the femoral diaphysis, both with well-delimited rims, although with different sizes (one of 20 mm approximately, and the other about 4 mm). These two individuals may be associated with cases of enostosis, also known as bone islands (Figure 61), which are benign tumours that have no sex or age difference in their prevalence (Waldron, 2009: 172). Moreover, osteomata have no clinical significance and are quite frequent, characterised by forming in the periosteum with well-delimited borders, compact bone and generally small (no larger than 10 mm in diameter), being more frequent in the frontal and parietals, and occurring in both sexes and in all ages (Fornaciari & Giuffra, 2009; Waldron, 2009). In the sample, it was possible to identify a case of multiple osteomata (Figure 62), which are not very frequent in the paleopathological context, but which are linked to secondary manifestations of diseases such as Gardner's syndrome, a hereditary disorder characterised by colon polyps (Aufderheide & Rodríguez-Martín, 1998: 375; Fornaciari & Giuffra, 2009: 306).
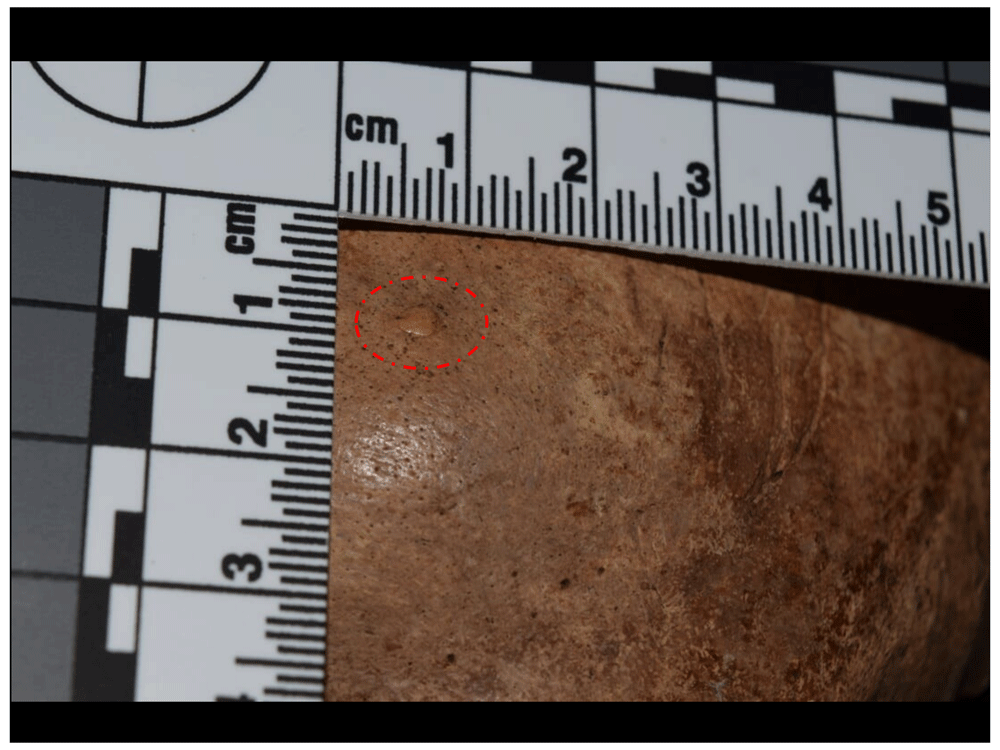
Figure 58. Osteoma identified in frontal of 1018.
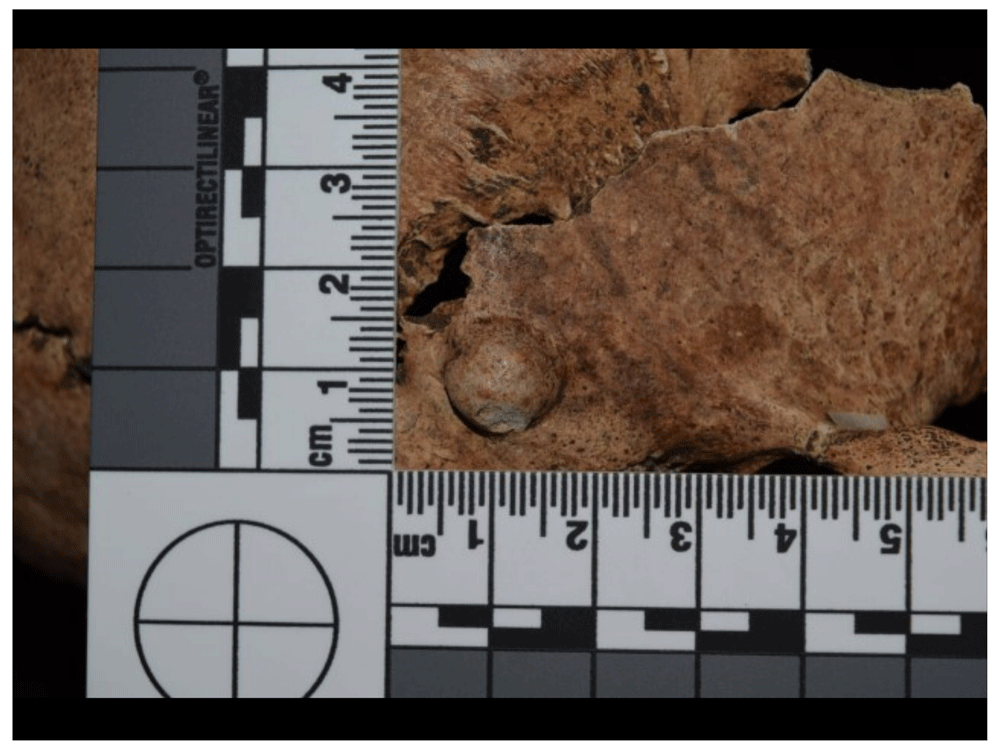
Figure 59. Osteoma identified in right temporalis of 1123.
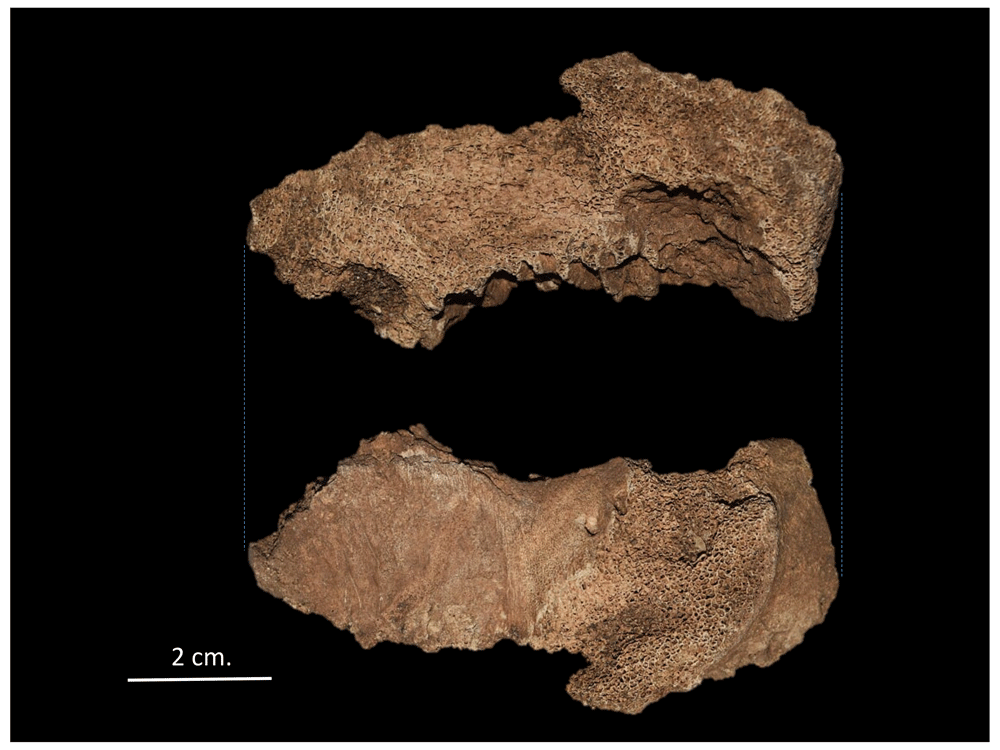
Figure 60. Neoplasm in left innominate bone of 4019.
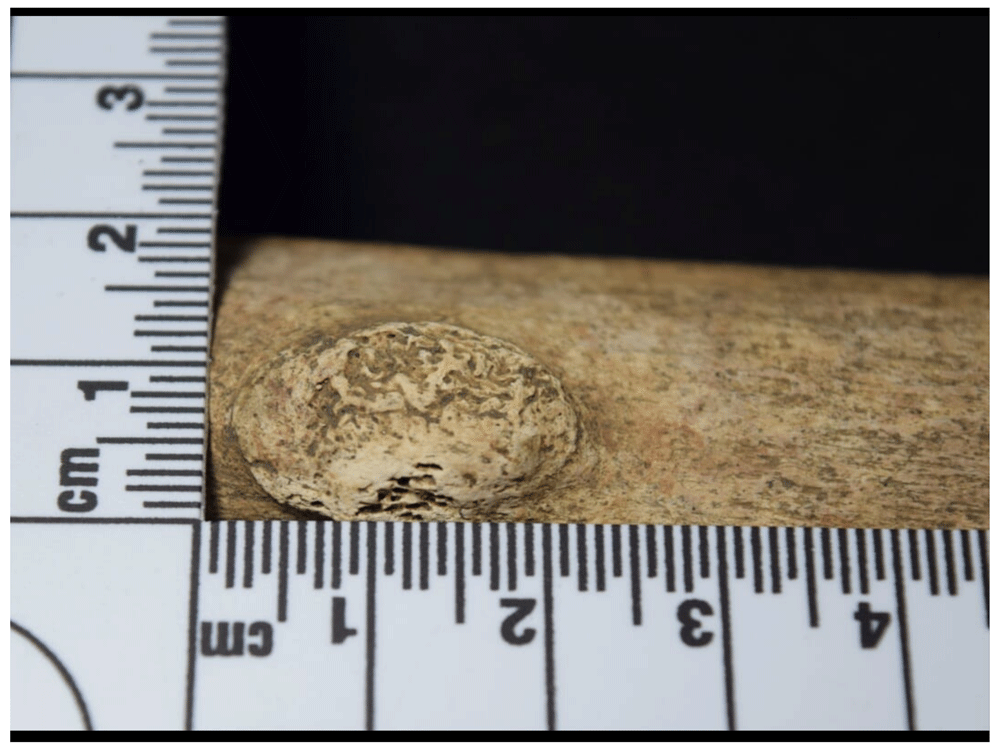
Figure 61. Enostosis in right tibia of 1042.
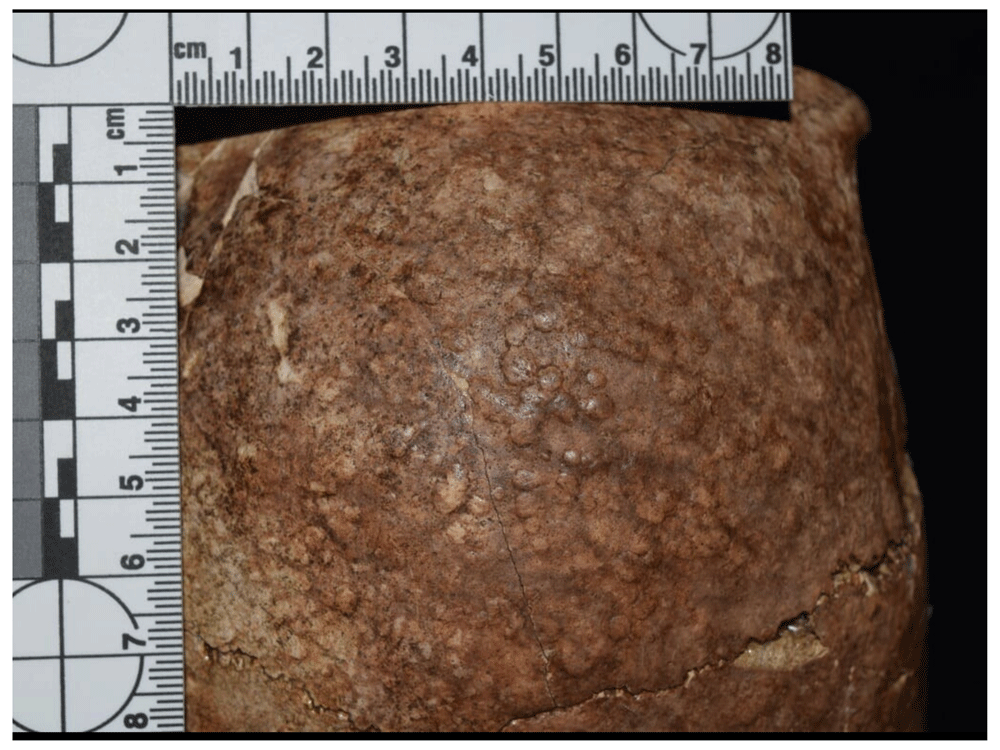
Figure 62. Multiple osteomata in cranium of 1125.
With regard to the bone development anomalies, it was identified that about 3.18% of the sample developed this type of lesion, with more than half of them (2.55%) corresponding to spondylolysis (Figure 63 to Figure 66). This anomaly occurs when the posterior arch separates from the vertebral body, subjecting the spine to continuous stress, and increases with the fragility of this bone element (Aufderheide & Rodríguez-Martín, 1998; Fornaciari & Giuffra, 2009; Ortner, 2003).
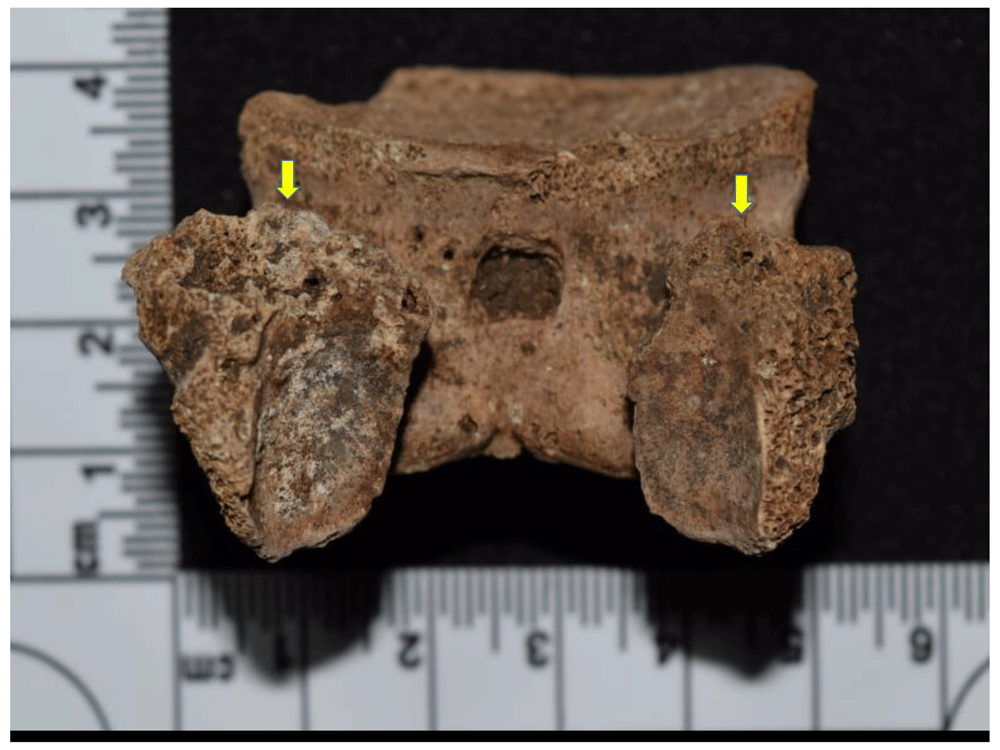
Figure 63. L4 with complete spondylolysis in 1159; in yellow, the remodelling of the fractured pedicle.
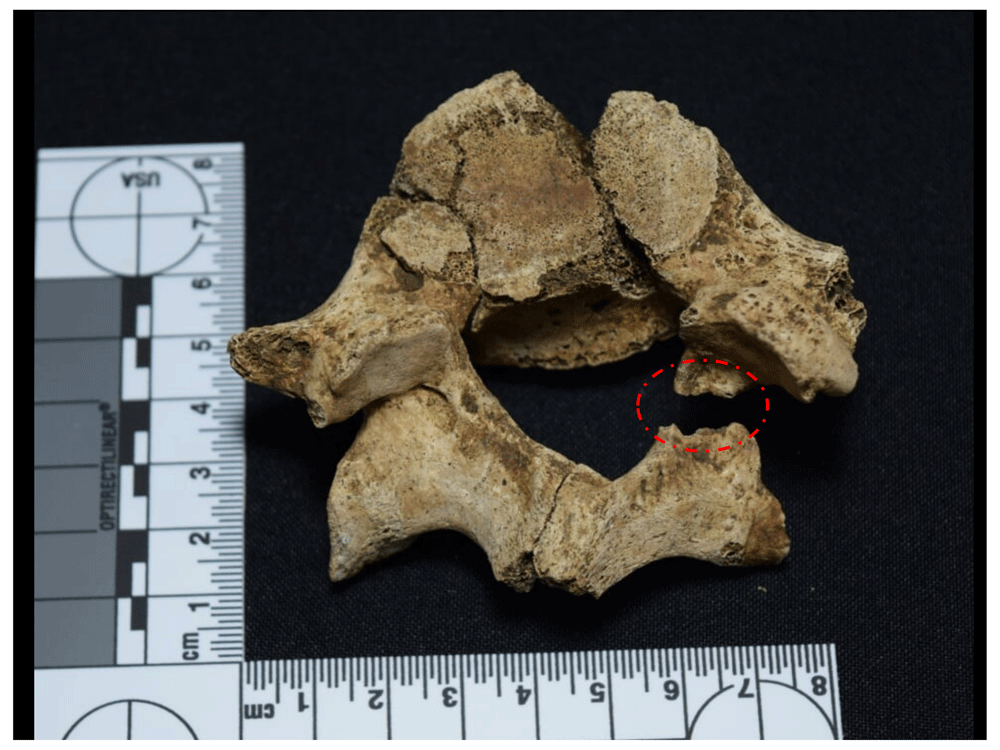
Figure 64. Incomplete spondylolysis in L5 of 1051.
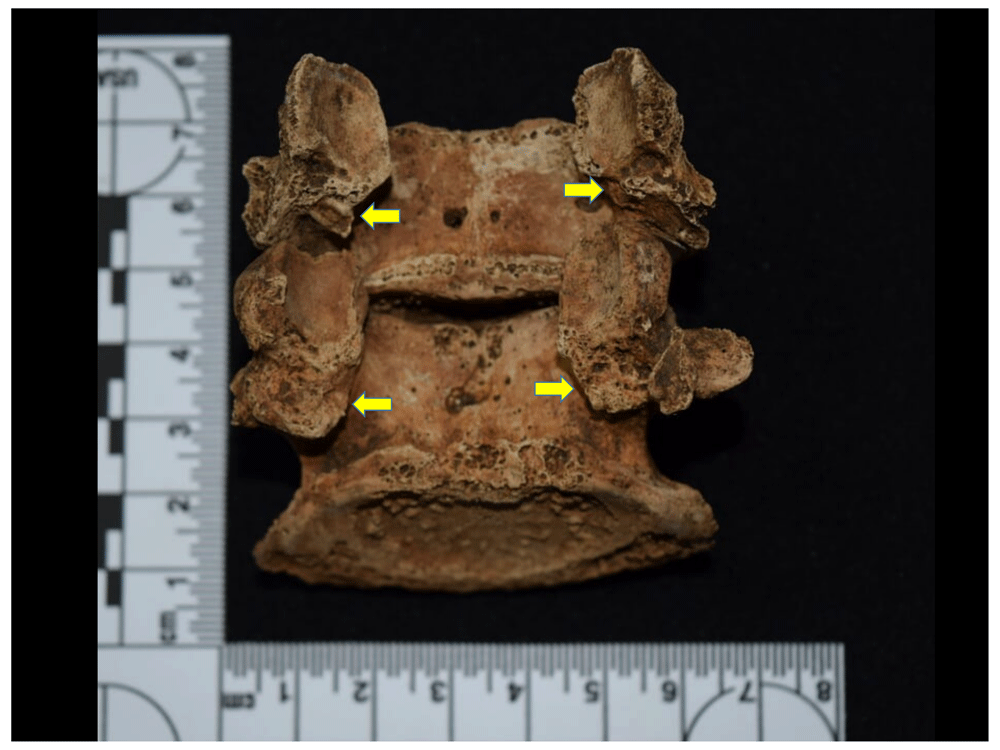
Figure 65. Complete spondylolysis in L4 and L5 of 1050.
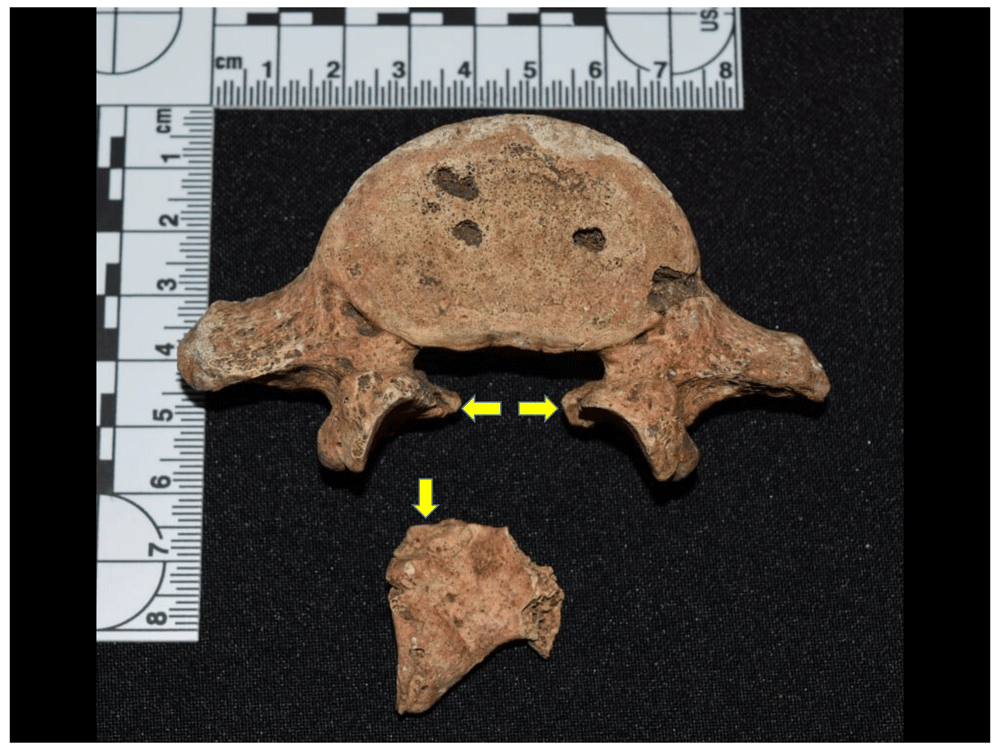
Figure 66. Complete spondylolysis in L5 of 1145.
The fracture in the vertebral arch can generally be complete or incomplete, occurs in the juvenile stage, and leads to the formation of a pseudoarticulation, where the arch remains attached to the body thanks to the ligaments and fibrous tissue in this region; it can therefore be symptomatic, although in some cases the lesion may be complicated by slippage, generating compression of the spinal cord, a condition known as spondylolisthesis (Fornaciari & Giuffra, 2009: 290–291).
The lesion is usually present in L5 and less frequently in L4; in the four cases reported, there was one case with complete spondylolysis of L4, one complete one in L5, one incomplete one in L5, and one individual showed complete spondylolysis of L4 and L5.
Other malformations observed in the sample are related to congenital anomalies such as spina bifida, present in one of the cases in incomplete form, meaning it is unlikely to have caused any mobility problem in the individual, but which is distinguished by incomplete closure of the posterior neural arches for sacral vertebrae 4 and 5. Moreover, a case with transitional vertebrae was recorded, specifically lumbarisation of the first sacral vertebra (Figure 67), which takes a shape similar to a lumbar vertebra and predominantly affects female individuals (Fornaciari & Giuffra, 2009: 292). Finally, a bone asymmetry between the semilunar bones of the hands of the individual was recorded, where the one on the left had an atrophy of the articular cartilage for the pyramidal bone, in this case smaller (Figure 68).
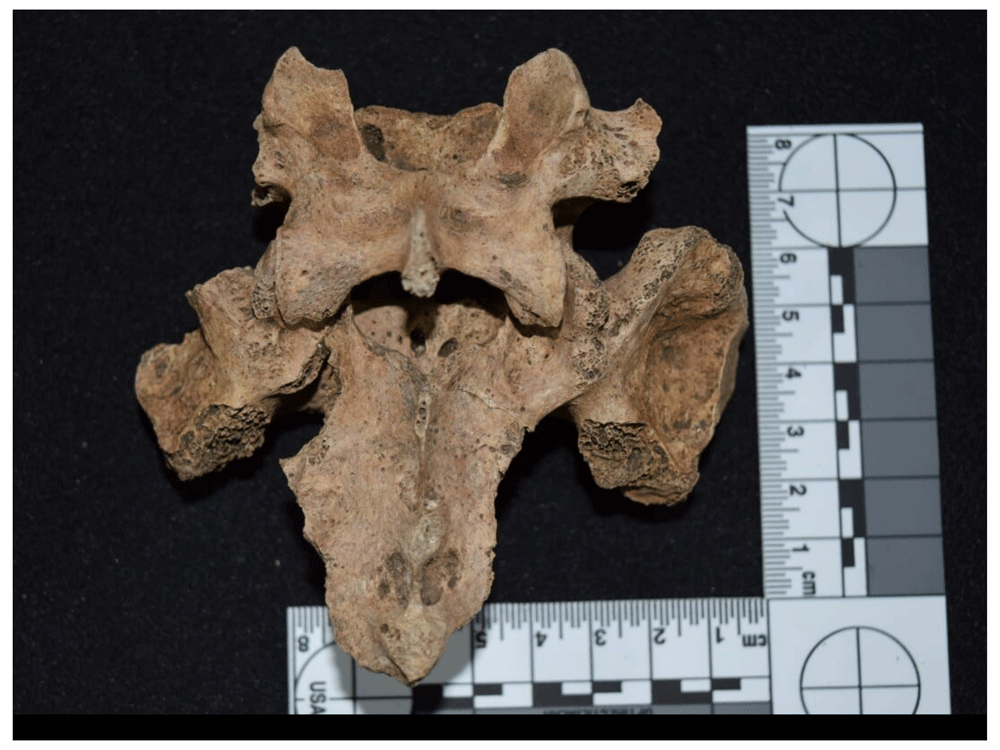
Figure 67. Lumbarisation of S1 in 1122.
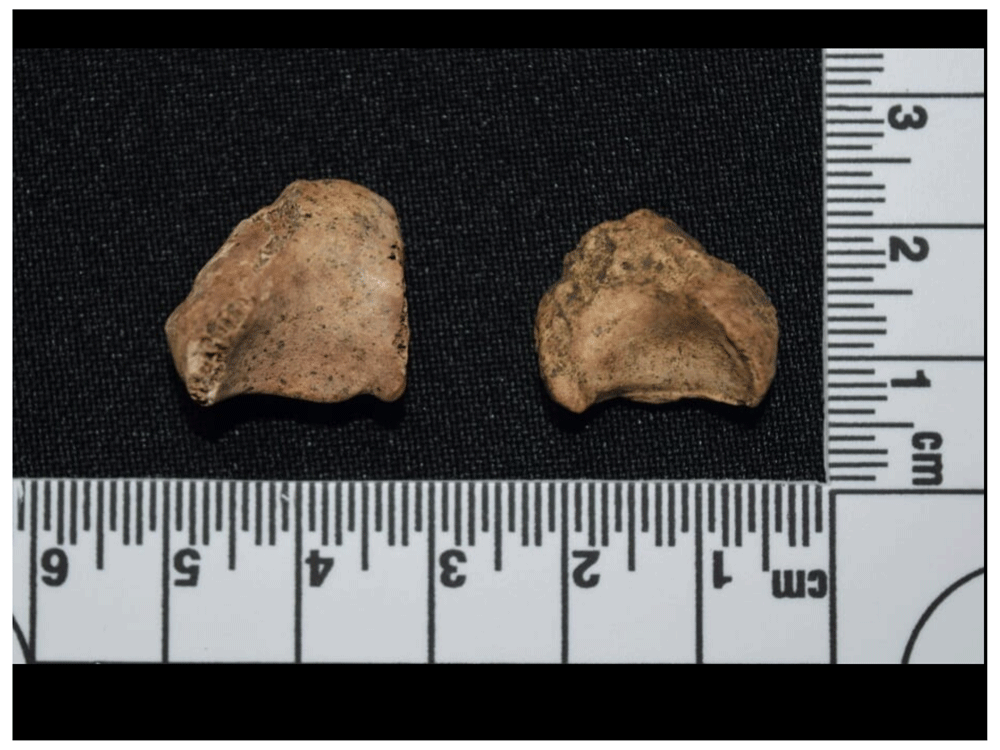
Figure 68. Asymmetry in semilunar bones of 1046.
Finally, there were three or four interesting cases from a paleopathological perspective, although statistically they are not significant since they are due to different lesions. Firstly, two cases of heterotopic ossification were recorded (Figure 69 and Figure 70), related to bone formation in soft tissue as a result of traumatic processes, surgery, burns, prolonged immobility or disorders of the central nervous system (Waldron, 2009: 79). In the literature it can also be found under the name myositis ossificans traumatica (Aufderheide & Rodríguez-Martin, 1998:26–27), although use of this term is not recommended as it may cause confusion with myositis ossificans progressiva, which has other aetiological implications. Heterotopic ossification is caused either by muscle trauma, that produces a haematoma that also involves the periosteum, or by avulsion of the tendons, where the muscle is attached to the bone (Aufderheide & Rodríguez-Martin, 1998; Waldron, 2009). The areas where this lesion most frequently manifests itself are the elbow, shoulder, pelvis, and the rough line of the femur (Aufderheide & Rodríguez-Martin, 1998:26). It is precisely the two cases recorded in the Cathedral that are associated with the insertion of the vastus medialis and vastus lateralis, whose origin and insertion are located in the posterior and medial part of the femur, respectively.
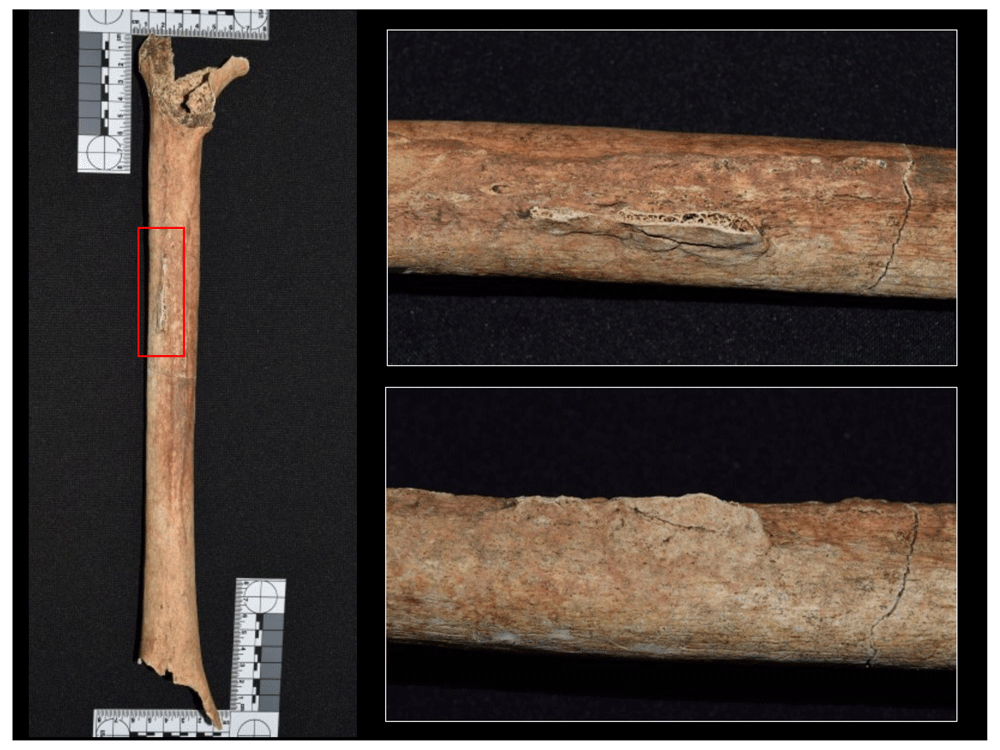
Figure 69. Heterotopic ossification of vastus lateralis in left femur of 1160.
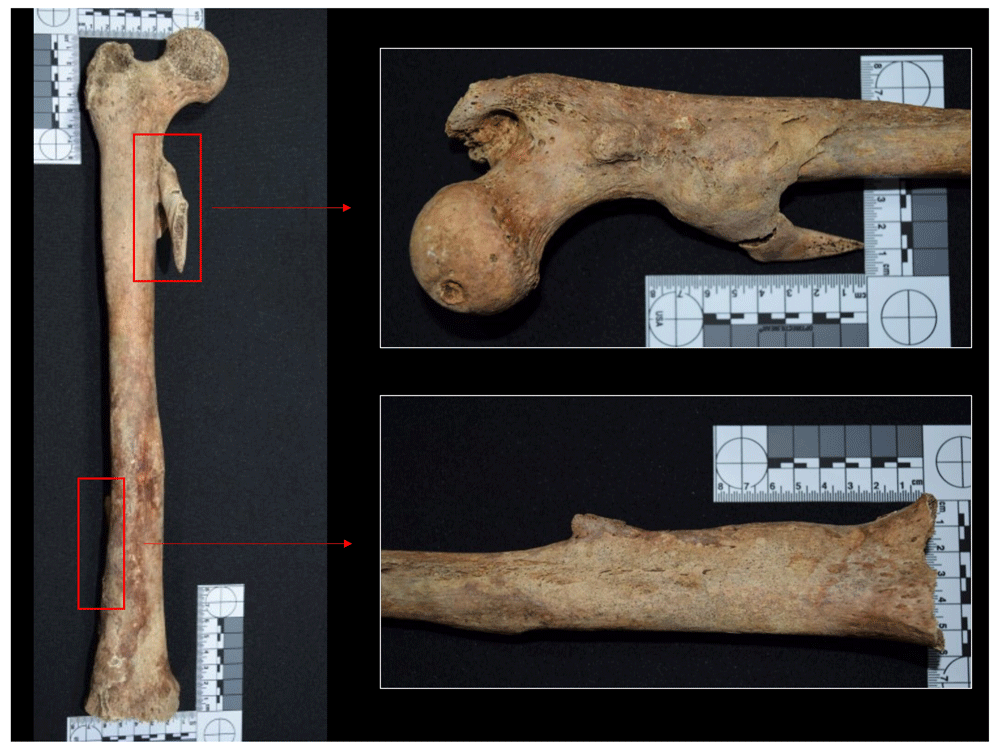
Figure 70. Heterotopic ossification of vastus lateralis and medialis in right femur of 1052.
Moreover, unintentional cranial flattening was recorded in one of the individuals at the level of the posterior portion of the parietal bones in articulation with the occipital; given the slightness of the deformation and the way in which it occurred, it is likely to be related to the fixed position that the head may have had during the individual's development and growth process (Figure 71). Finally, a case of trepanation was observed (Figure 72). This intervention was performed on the left parietal, it being possible to see that the individual survived, thanks to the remodelled bone that is evident in the diploe of the cranium. This type of intervention was frequent during the medieval and post-medieval period in Europe, involving several techniques and instruments (Fornaciari & Giuffra, 2009). In this case it could be due to an abrasive technique, given the ellipsoidal shape of the lesion, surrounded by the reduced thickness of the osseous table.
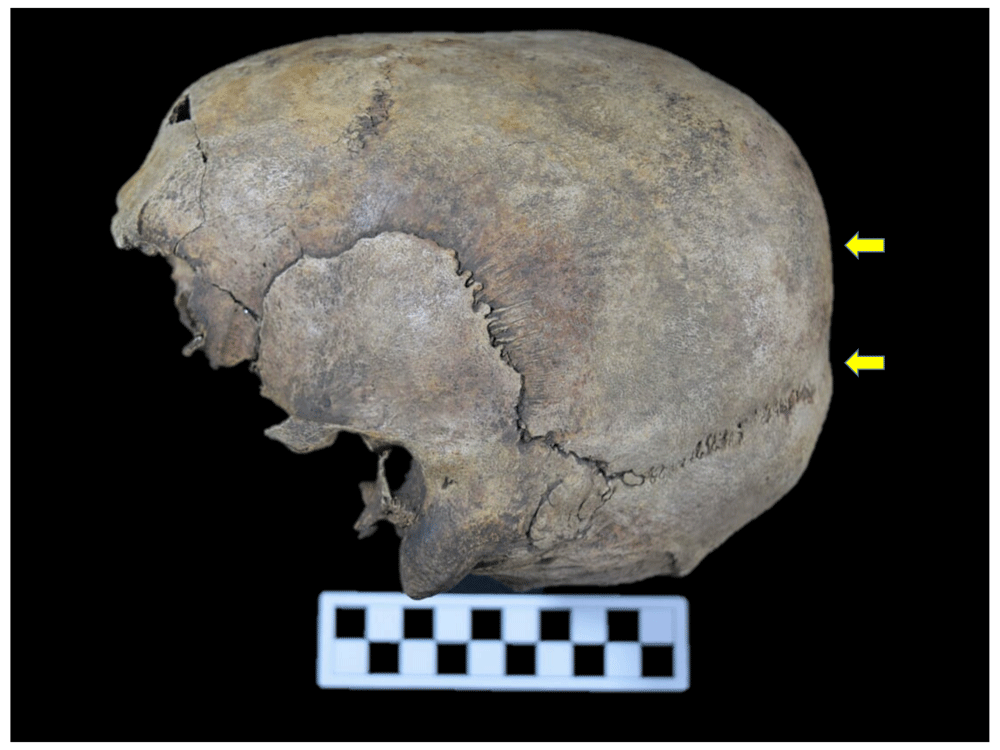
Figure 71. Unintentional flattening of cranium of 1043.
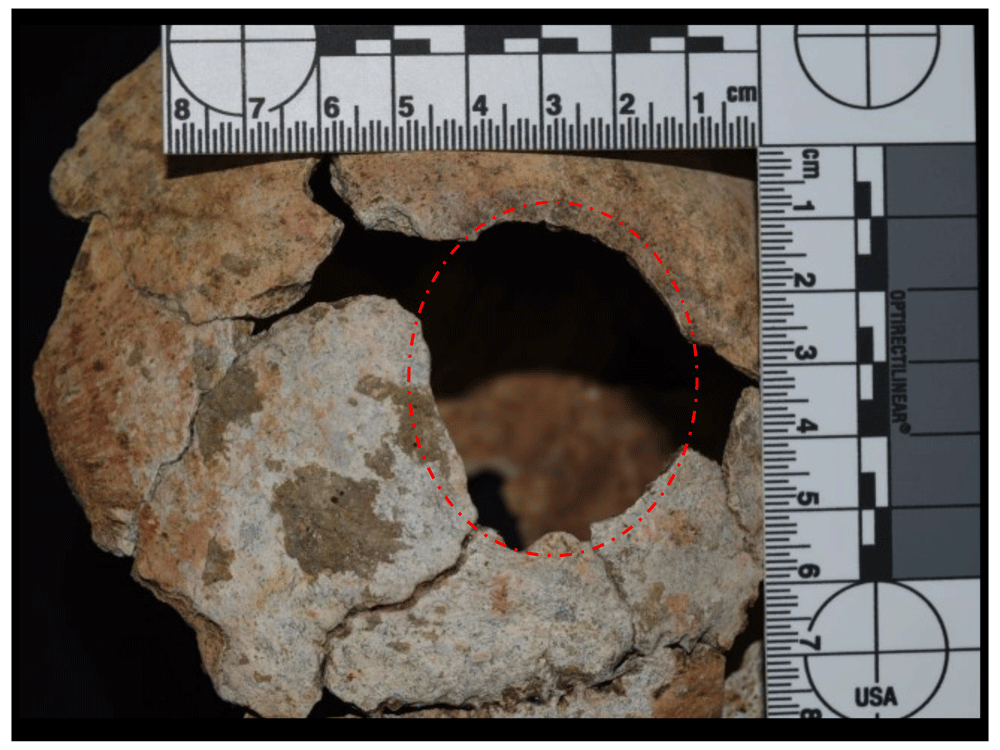
Figure 72. Evidence of trepanation in left parietal of 1202.
Overall frequency of dental anomalies for the whole sample. With regard to teeth, a good proportion of individuals revealed anomalies associated with dental morbidity, totalling 46.29% of the whole sample with an effective prevalence of 100% in the recording of dental lesions or anomalies (Table 18), where the number of unobservable cases in the sample was also considered. In this regard, the high numbers of unobservable cases are due to teeth representation or conservation factors, despite the fact they are the hardest and most resistant tissue in the human body and, in an archaeological context, are often better preserved than skeletal remains; however, several of these elements may have been lost or decontextualised due to reductions and alterations in the Cathedral site.
Table 18. Proportion of individuals with dental anomalies in the sample analysed.
| Frequency | % Total | % Effective |
|---|
| Unobservable | 94 | 53.71 | |
| No anomalies | 0 | 0.00 | 0.00 |
| Anomaly | 81 | 46.29 | 100.00 |
| Total | 175 | 100.00 | |
| Total Effective | 81 | 46.29 | 100.00 |
Specific frequency of dental anomalies for the whole sample. The information obtained from dental morbidity can help reconstruct some aspects of diet, episodes of nutritional stress or disease, and behavioural elements recorded in the teeth, which serve as indicators of the health conditions and quality of life of the population. These structures do not change during the course of life and, unlike bone, do not have reparative capacity, the only exception being dentin, whose processes have little functionality in terms of the health of the tooth.
With regard to dental anomalies or lesions recorded in the sample of the two sites of Panama Viejo’s Cathedral, the most frequent was dental wear due to masticatory processes, with an effective prevalence of 97.53%, followed closely by the presence of dental calculus, with 95.06%. Subsequently, there were cases of caries with 58.02%, alveolar retraction associated with periodontal disease with 54.32%, and enamel fractures or chipping with 51.85%. Enamel defects, including linear hypoplasias, are found in a smaller proportion with 22.22%, in addition to some cases of cultural modification with 12.35%, and, finally, cases of periapical abscesses and hypercementosis, with an effective prevalence of 3.7% for each lesion (Table 19 and Figure 73).
Table 19. Proportion of dental anomalies identified in sample.
Abnormality or
lesion | Frequency | % Effective | % Total |
|---|
| Caries | 47 | 58.02 | 26.86 |
| Calculus | 77 | 95.06 | 44.00 |
| Masticatory Wear | 79 | 97.53 | 45.14 |
| Enamel defect | 18 | 22.22 | 10.29 |
| Abscess | 3 | 3.70 | 1.71 |
| Alveolar retraction | 44 | 54.32 | 25.14 |
| Chipping | 42 | 51.85 | 24.00 |
Cultural
modification | 10 | 12.35 | 5.71 |
| Hypercementosis | 3 | 3.70 | 1.71 |
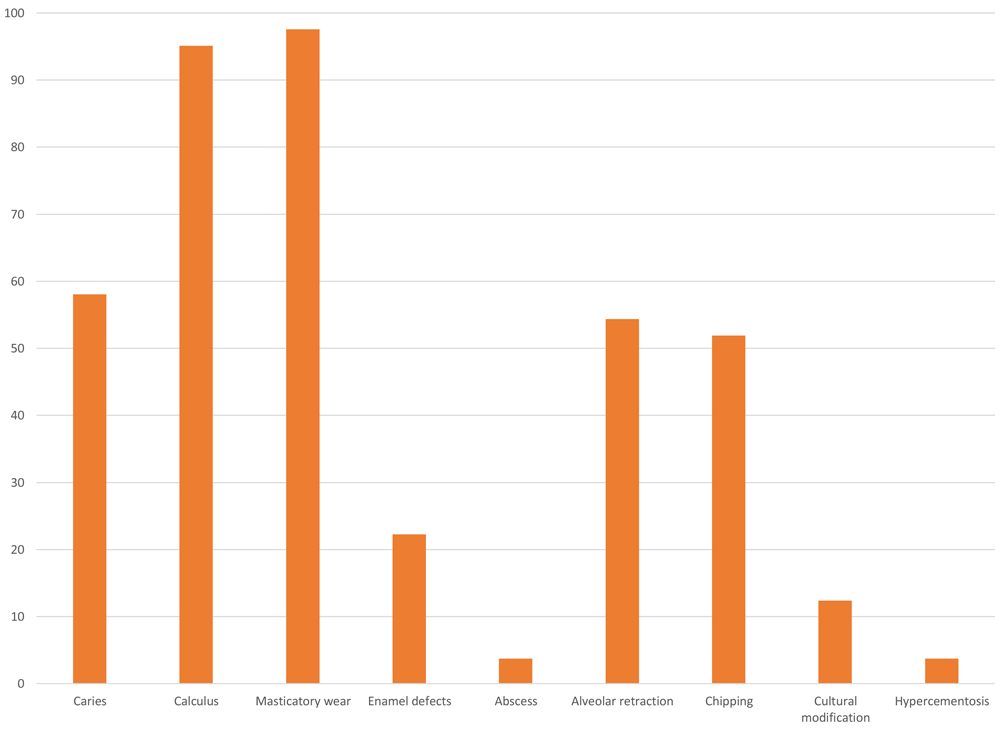
Figure 73. Effective percentage of dental anomalies identified in sample.
In these data, the lesion caused by wear on the occlusal surface of the teeth was associated with the processes of chewing food, which was manifested in different degrees for the inhumed population (Figure 74 to Figure 78); other types of wear associated with labour activity, biocultural practices or the frequent holding of objects with the teeth were recorded as cultural modifications. Moreover, wear due to attrition or bruxism was not identified in the sample. It should be noted that occlusal wear is due to the contact with abrasive particles that may be associated with food or other elements food is prepared with. For example, metates and mano stones were used to process and grind maize during the pre-Hispanic period, and certainly during the colonial period, with such instruments giving off particles that consequently made the wear even more pronounced. Moreover, abrasive diets such as maize may have been a determining factor in this type of lesion.
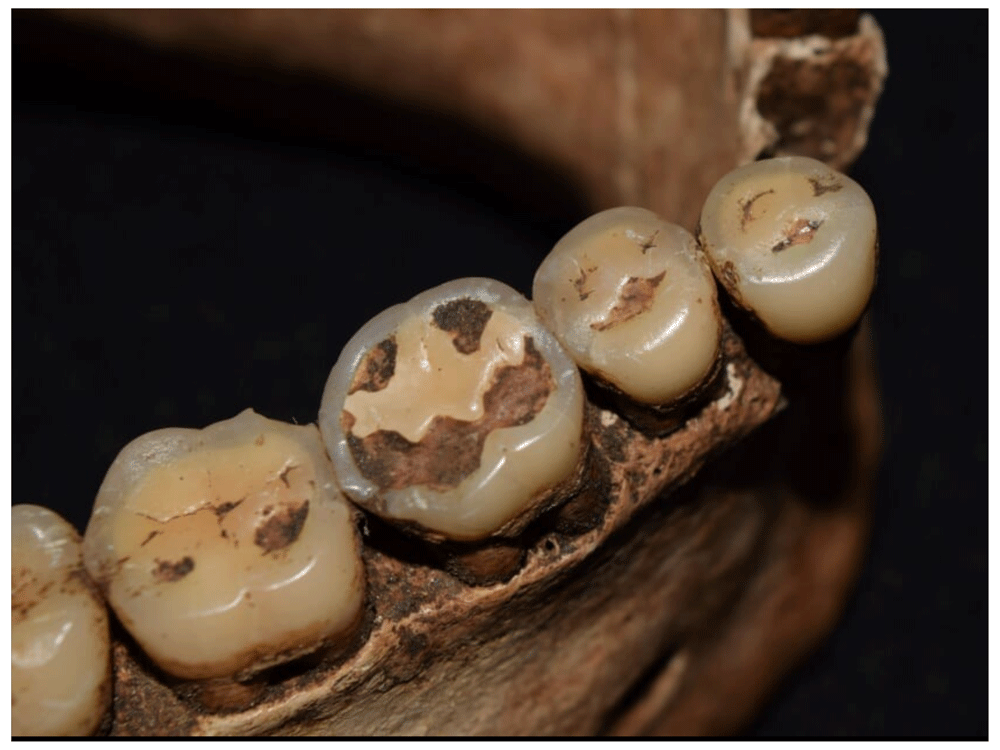
Figure 74. Occlusal wear processes in lower teeth of 1012.
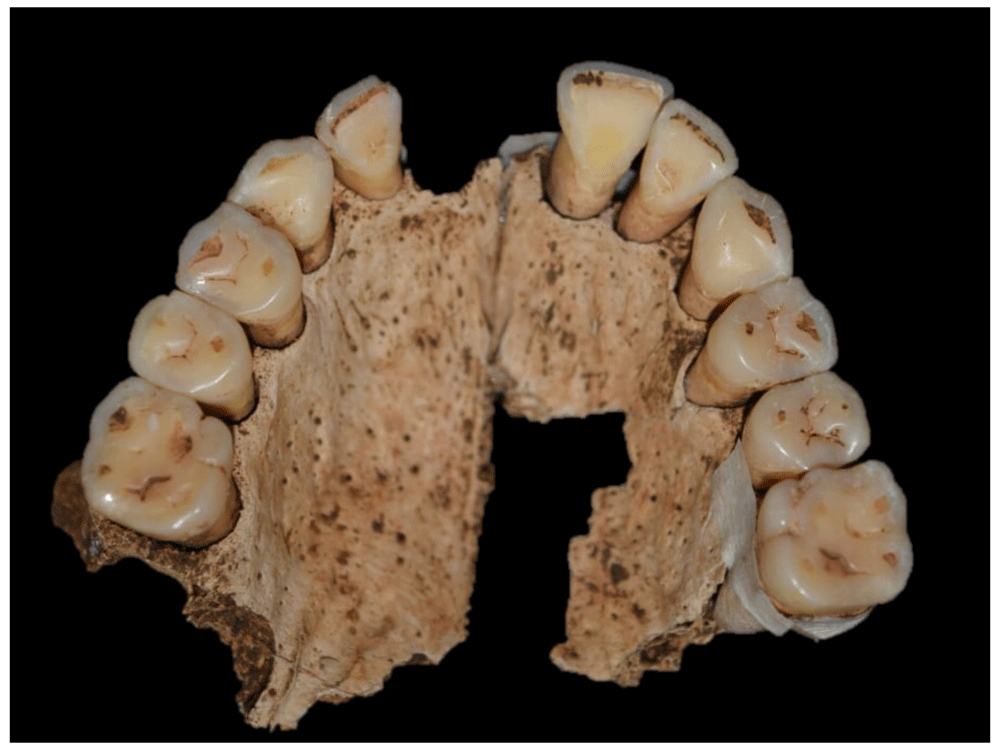
Figure 75. Moderate occlusal wear processes in upper teeth of 2005.
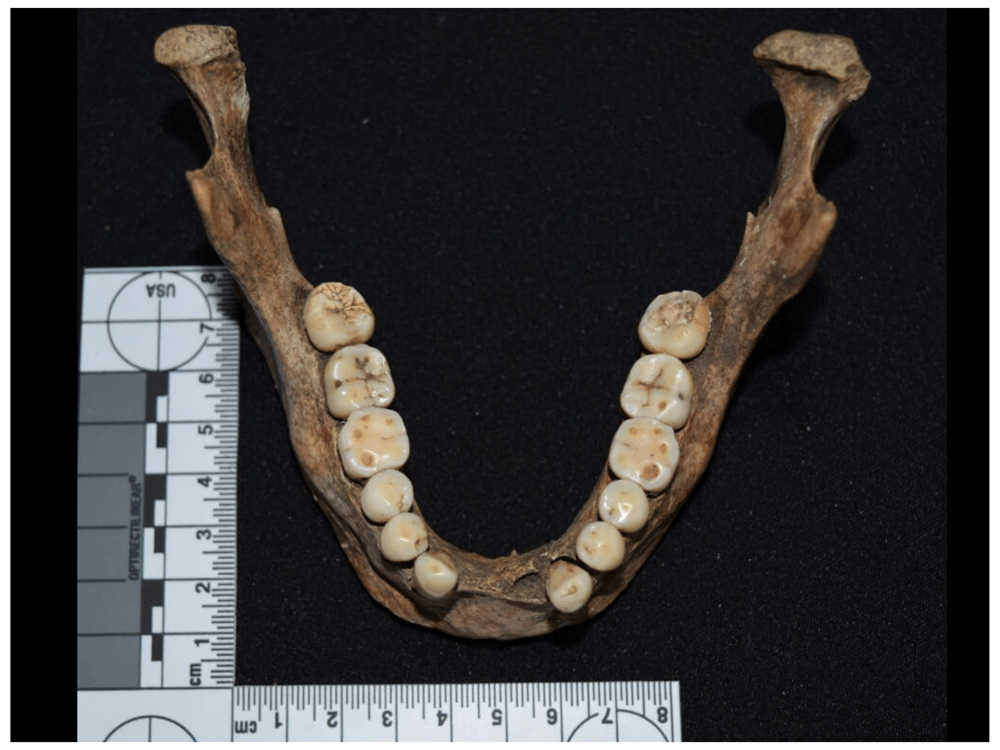
Figure 76. Different degrees of wear in mandible of 1086.
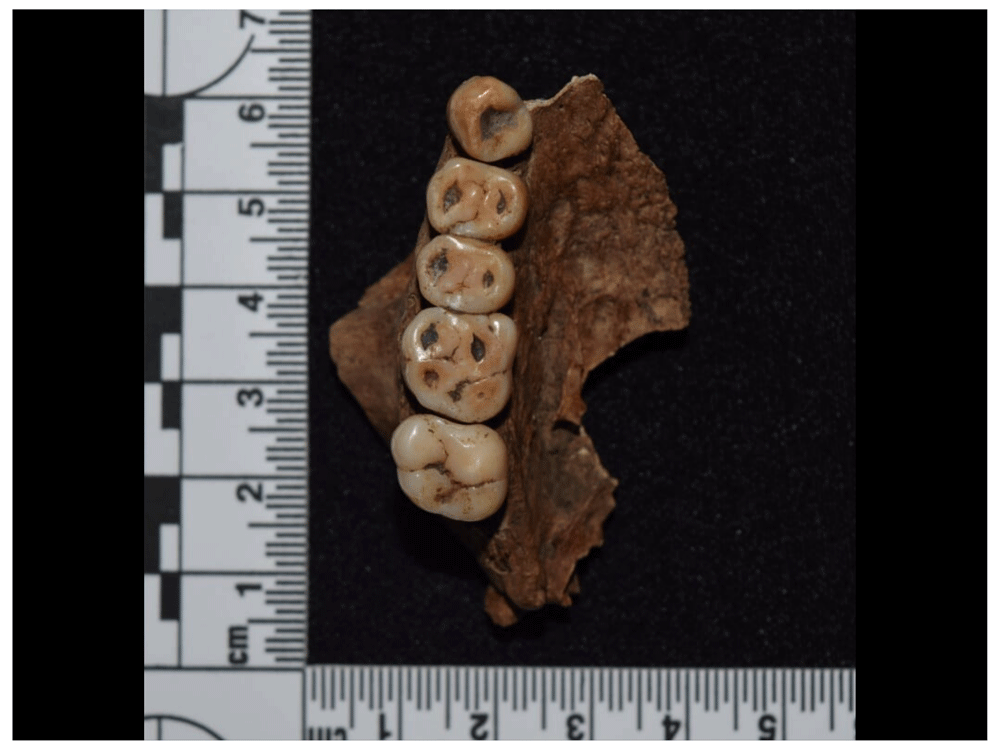
Figure 77. Occlusal wear processes in upper teeth of 1135.
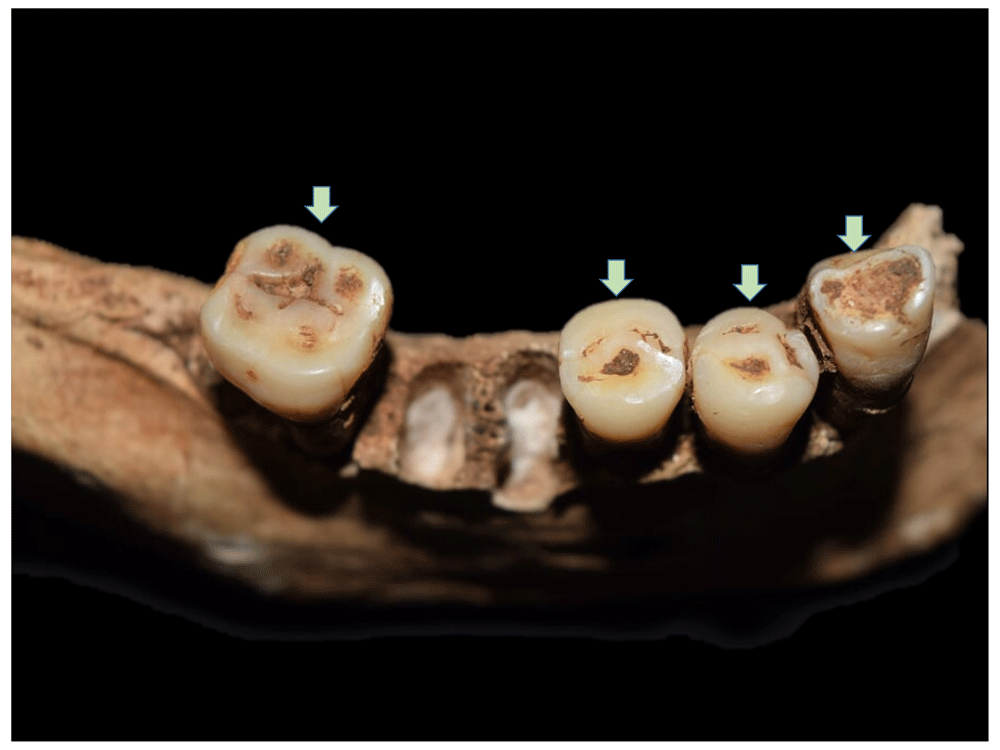
Figure 78. Masticatory wear processes in different degrees of manifestation in mandible of 4023.
An abrasive diet also produces enamel fractures or chipping, which in some cases also affects the dentin (Figure 79 to Figure 81). They are generally located in the incisal margin of the anterior teeth or in the cusp crests of the crown (Chai et al., 2011; Towle et al., 2017). These fractures can often be mistaken for post-depositional events, making it necessary to examine any smooth, rounded margins that may be chipped or show some sign of wear and a shade similar to the adjacent enamel. This is one of the most frequent traumatic lesions to the enamel, and involves contact between the teeth and a hard element that causes the lesion, which, in masticatory processes, can be generated in two ways: 1) by cumulative micro contacts associated with small particles related to diet, and 2) by individual macro contacts with harder items such as nuts, grains and seeds (Chai et al., 2011). Although enamel fractures are generally associated with dietary causes, it is also possible to relate them to the processing of food, environmental contaminants, traumatic events and cultural practices (Towle et al., 2017), which makes it difficult to identify the origin of these lesions. However, it is striking that it reaches an effective prevalence of 51.85% in the sample analysed, and this context is probably also related to processes associated with diet.
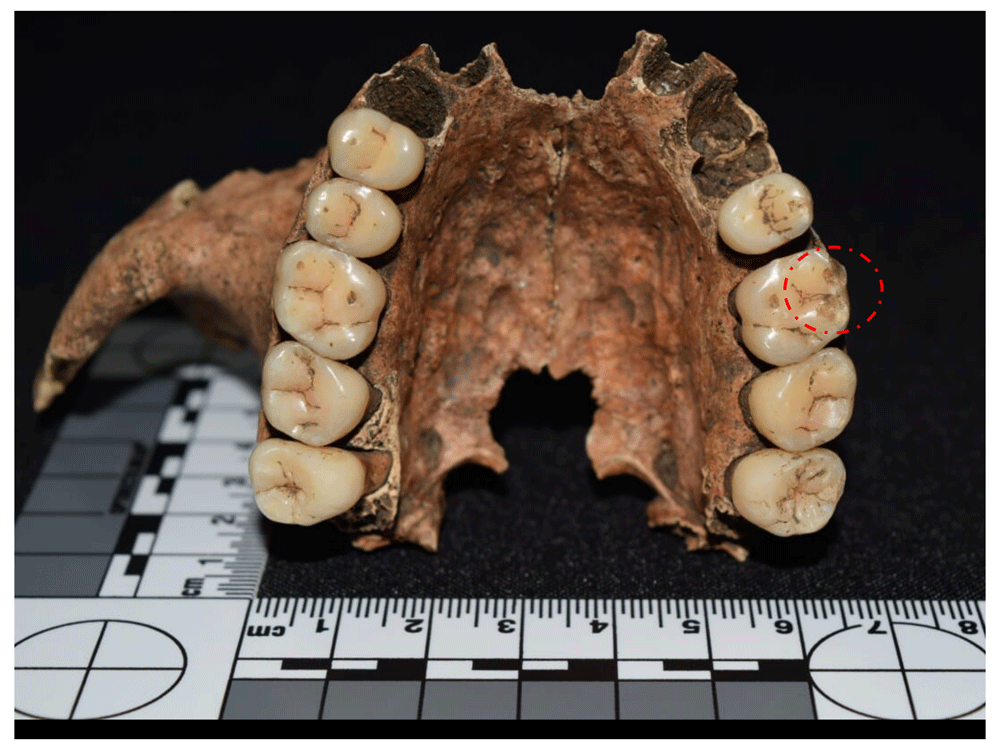
Figure 79. Chipping in left upper M1 of 1027.
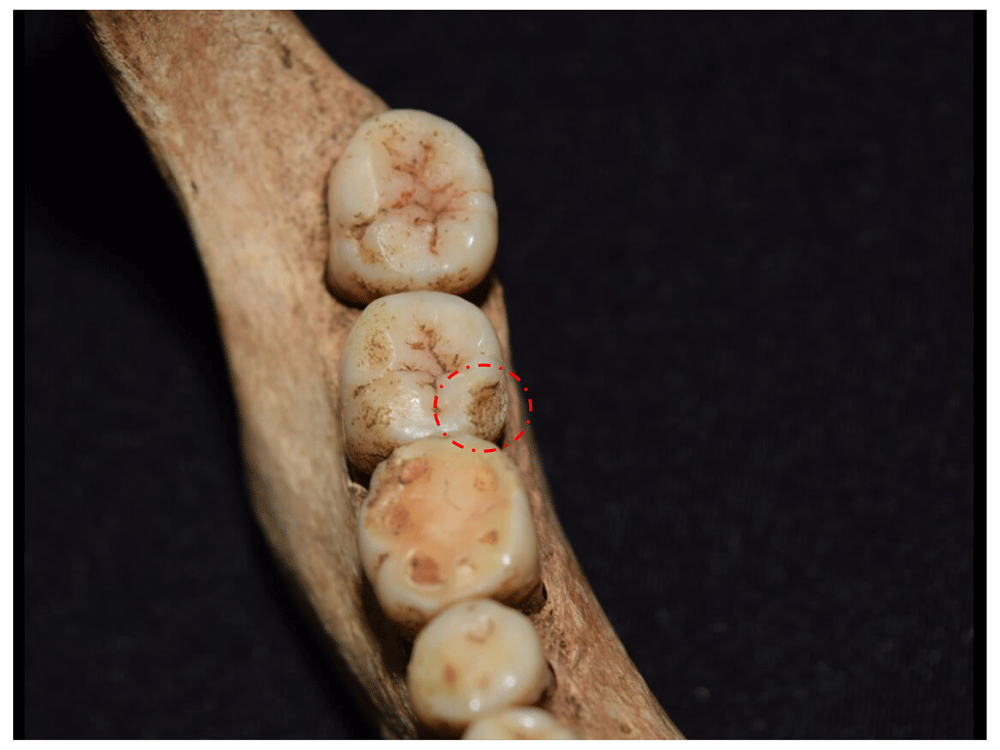
Figure 80. Chipping in right lower M2 of 2008.
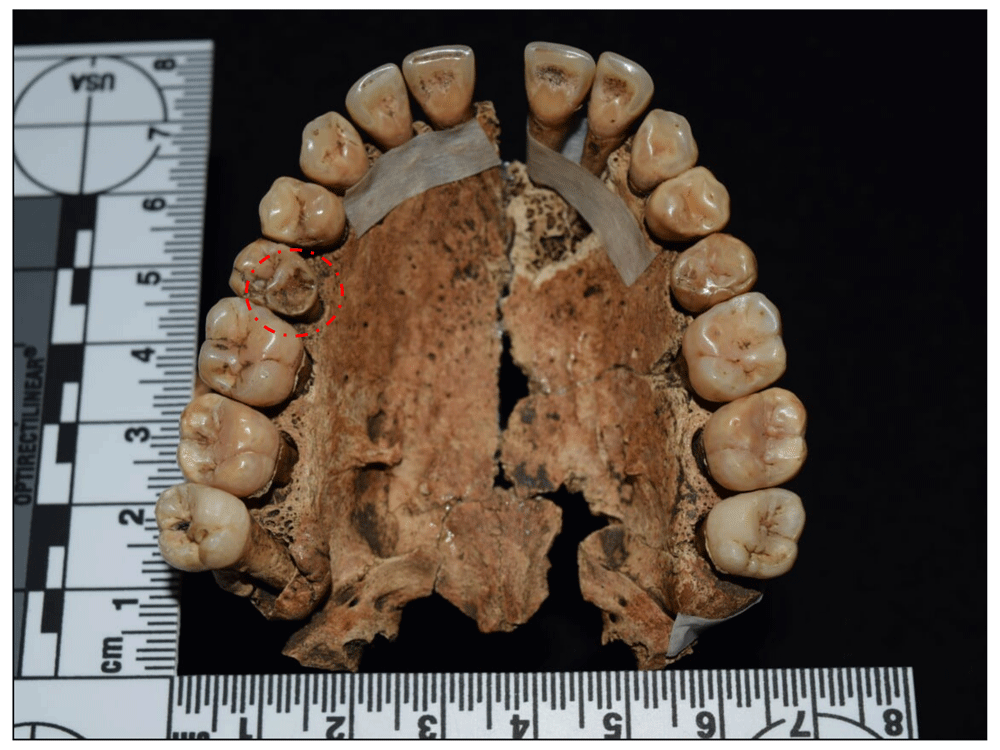
Figure 81. Chipping in right upper P2 of 1060.
A high prevalence of dental calculus is also observed in the sample (95.06% effective) (Figure 82 to Figure 85), characterised by mineralisation of the bacterial plaque aided by the presence of saliva, meaning teeth located near the salivary ducts are most affected (Canci & Minozzi, 2012; Hillson, 1996). There are two types of dental calculus, supragingival and subgingival. The former is attached to the enamel on the gingival margin and, although in life it is very attached to the crown, it tends to be easily lost in the archaeological context. Subgingival calculus is deposited on the root surface and is thinner, harder, and more mineralised than supragingival calculus (Hillson, 1996: 256–257).
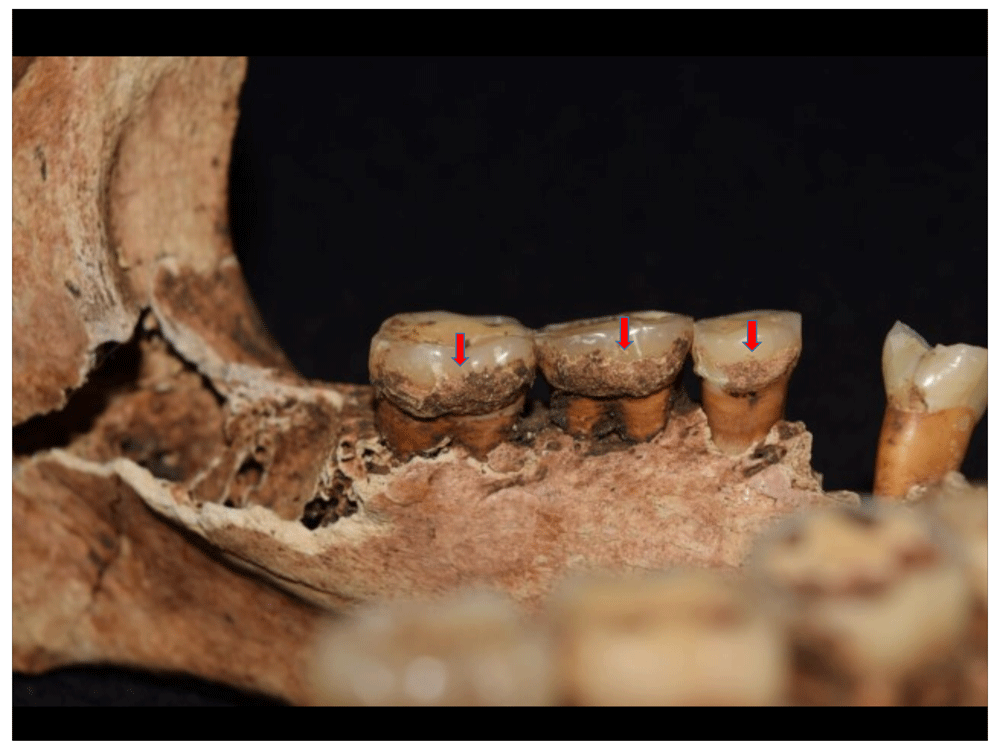
Figure 82. Dental calculus on the lingual surface of left lower molars of 2012.
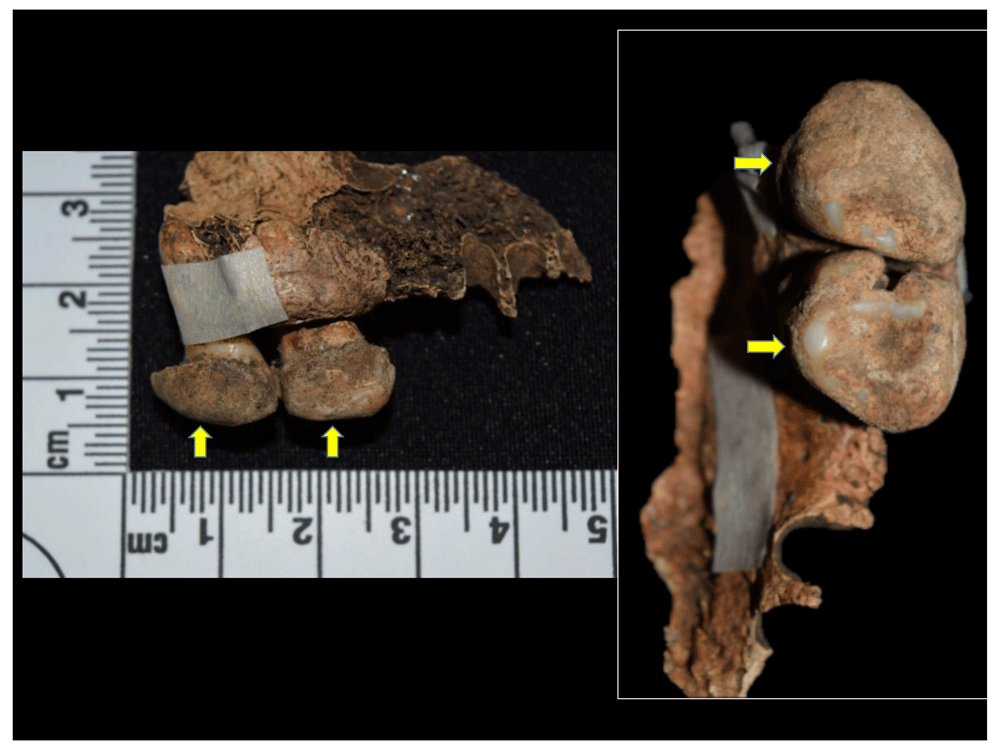
Figure 83. Dental calculus in left upper M2 and M3 covering the occlusal, lingual, and vestibular surfaces in 1102.
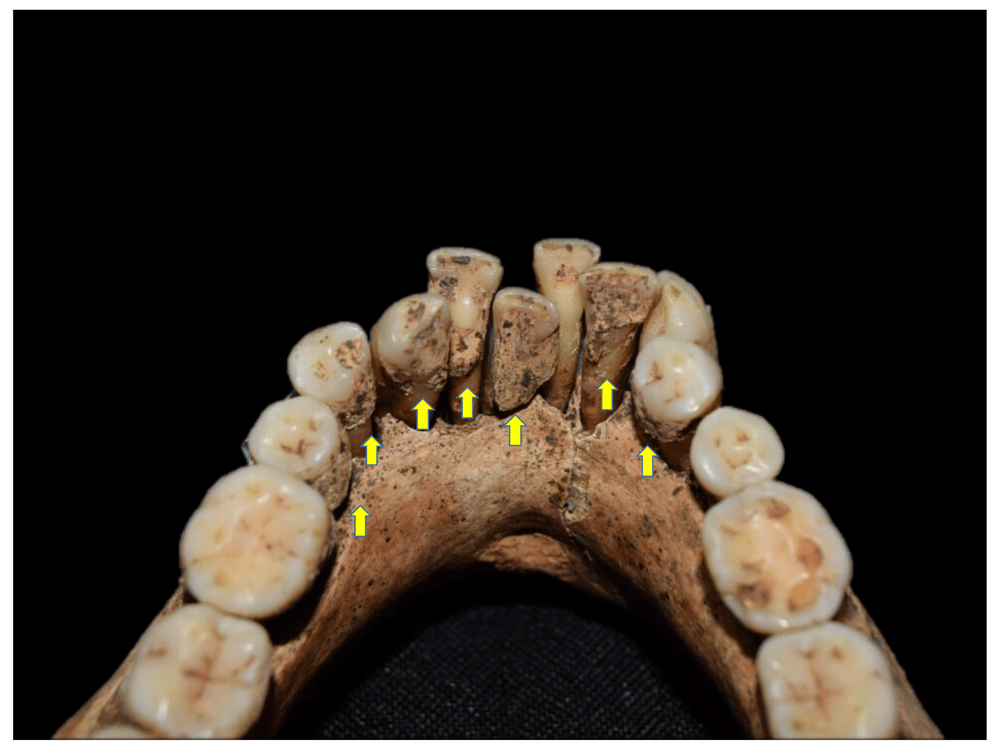
Figure 84. Calculus deposited on the lingual surface on lower teeth of 1049.
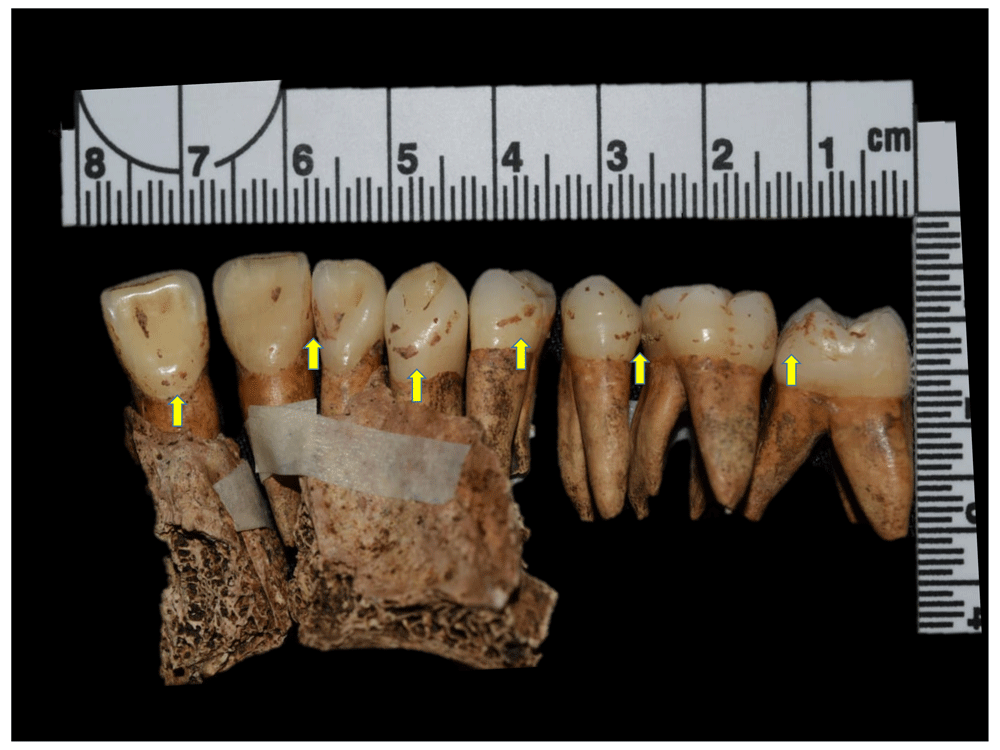
Figure 85. Calculus deposited on the lingual surface on upper teeth of 1201.
Calculus is usually related to carbohydrate-rich diets, although inadequate oral hygiene also plays a role by allowing bacterial plaque to build up. Other related processes can be malocclusion or facial paralysis that create spaces in which calculus begins to deposit, although age also plays a role, becoming more frequent as the individual gets older (Hillson, 1996). Moreover, there is an inverse relationship between the presence of calculus and dental caries, and, although both anomalies may appear in the same tooth, the tendency is for caries to appear in sectors of the tooth that are devoid of dental calculus (Hillson, 1996); this is in line with that observed in the sample, where the effective prevalence of caries is 58.02%.
Caries are characterised as a degenerative disease of the hard tissue of the tooth (i.e. the enamel), although in advanced stages it can affect the dentin and the cementum (Figure 86 to Figure 90). This is caused by the presence of commensal bacteria that are activated by the imbalance of bacterial flora and the progressive demineralisation of enamel; this situation is aggravated by the consumption of carbohydrates and sugars, for which experimental tests have been carried out in order to verify their cariogenic potential in diet (Hillson, 1996: 276–278). Factors such as inadequate oral hygiene, exposure of dental surfaces devoid of enamel, age, odontogenic anomalies, and systemic and periodontal diseases may also predispose to this condition (Canci & Minozzi, 2012: 201–202).
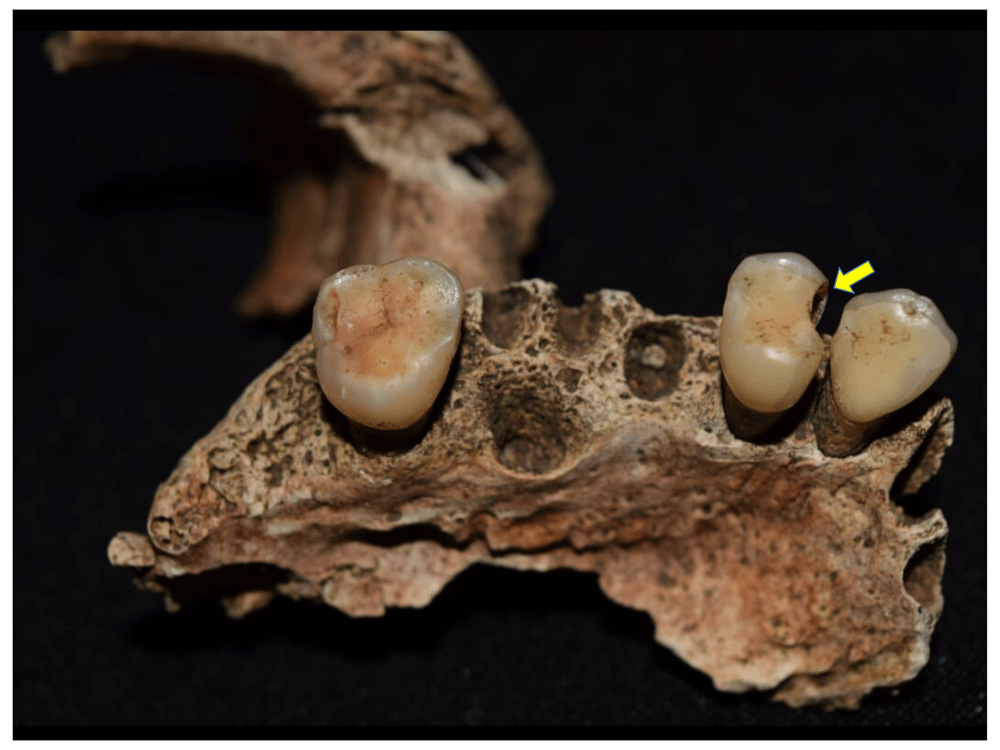
Figure 86. Caries affecting pulp chamber in right upper premolar 1 of 1123.
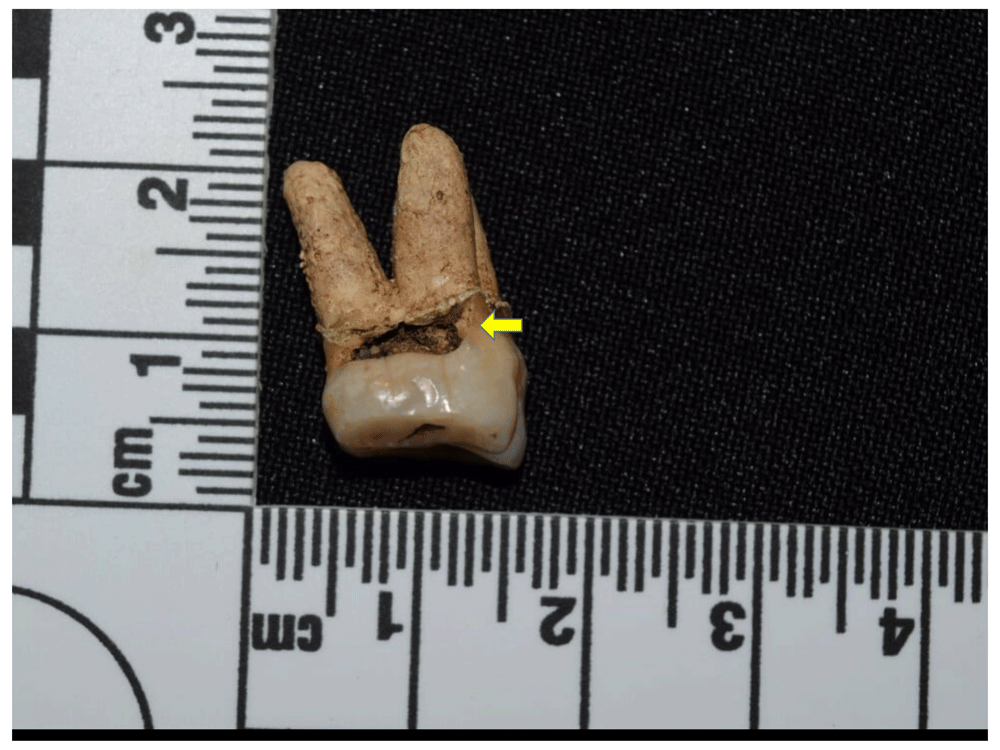
Figure 87. Cervical caries in right upper M2 of 2013.
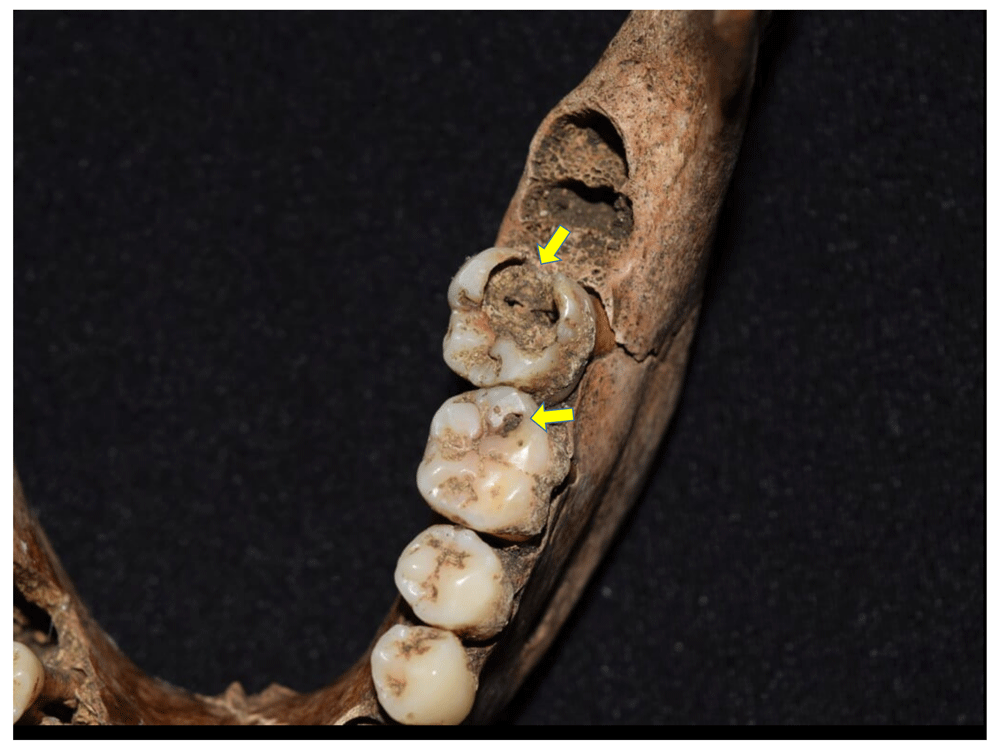
Figure 88. Caries in left lower M1 and M2 of 1129.
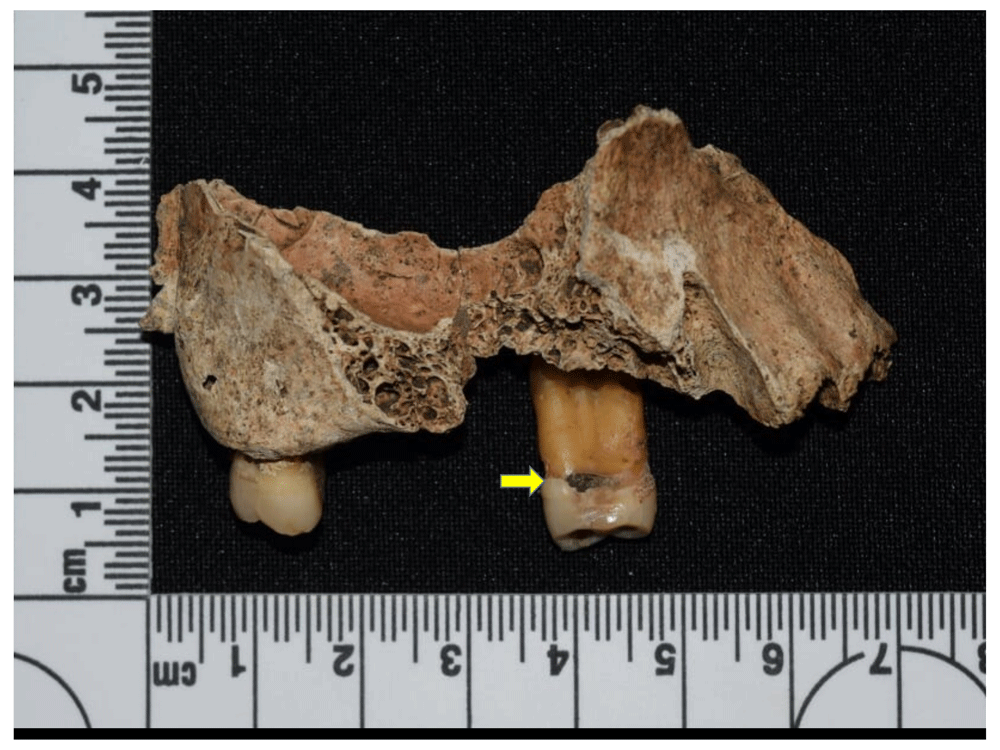
Figure 89. Cervical caries in right upper P1 of 1095.
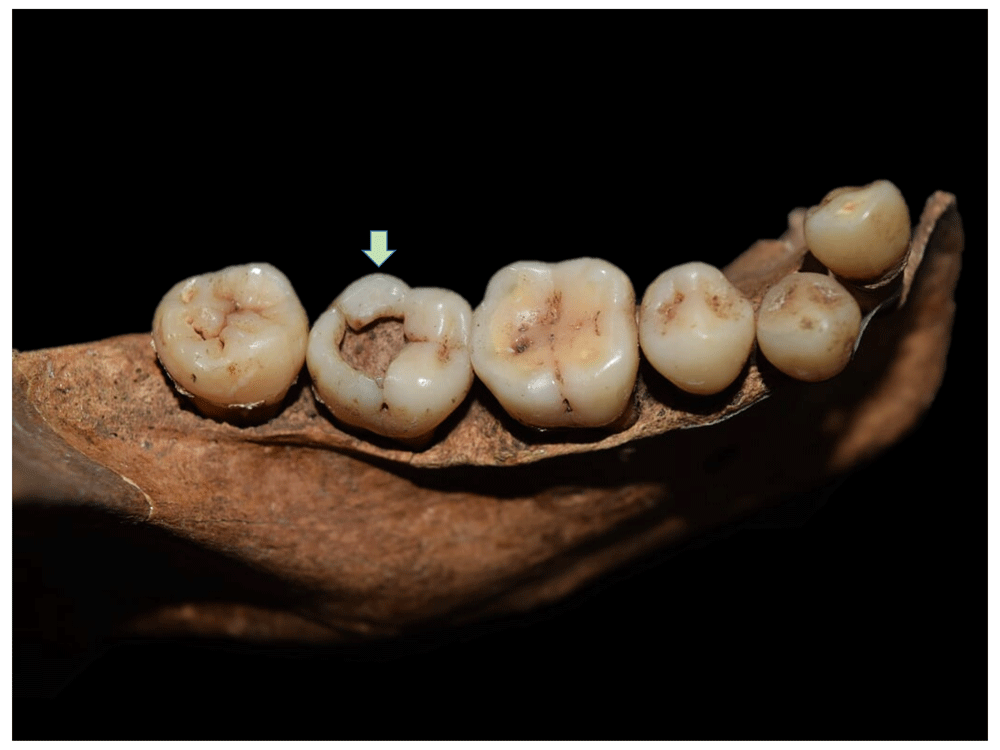
Figure 90. Caries with lesion in pulp chamber in right lower M2 of 4015.
Caries can cause tooth loss, although the most frequent cause is parandontopathy or inflammation of the supporting tissues of the tooth, caused by the action of bacterial plaque which initially affects the gum and spreads to the mucosa, periodontal ligament, and alveolar bone, causing inflammation and retraction of the alveolar margin and, in advanced cases, inflammation of the root that leads to periapical granulomas, with consequent loss of the tooth (Canci & Minozzi, 2012; Hillson, 1996). In the sample, this type of lesion corresponds to an effective prevalence of 54.32% (Figure 91 to Figure 95), with significant representation in the population analysed; however, the causes are of multifactorial origin that include genetic, environmental, hygenic and dietary aspects, making it difficult to associate it with a specific cause.
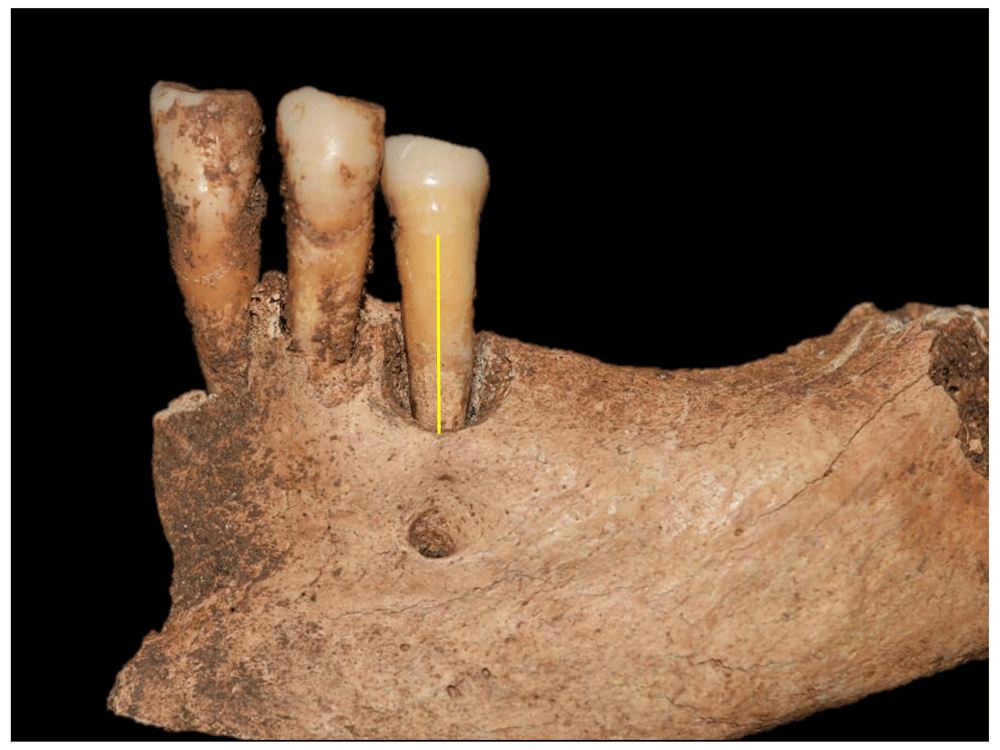
Figure 91. Advanced alveolar retraction in left lower premolar 2 and complete resorption of molars of 4023.
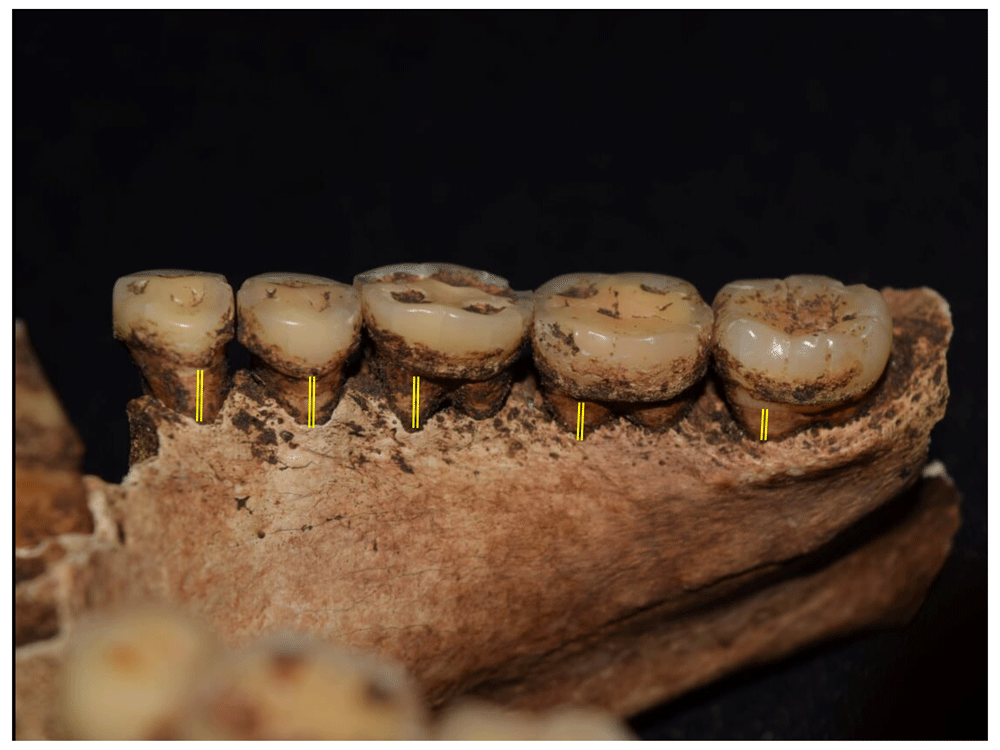
Figure 92. Retraction of alveolar margin in mandible of 2012.
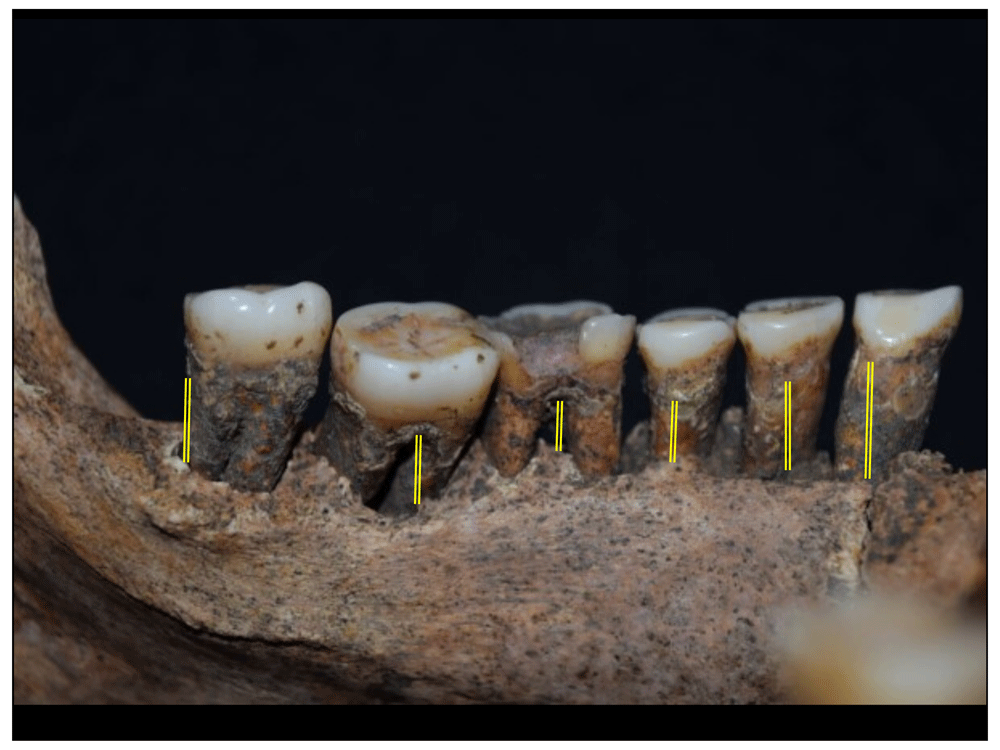
Figure 93. Retraction of alveolar margin in mandible of 1043.
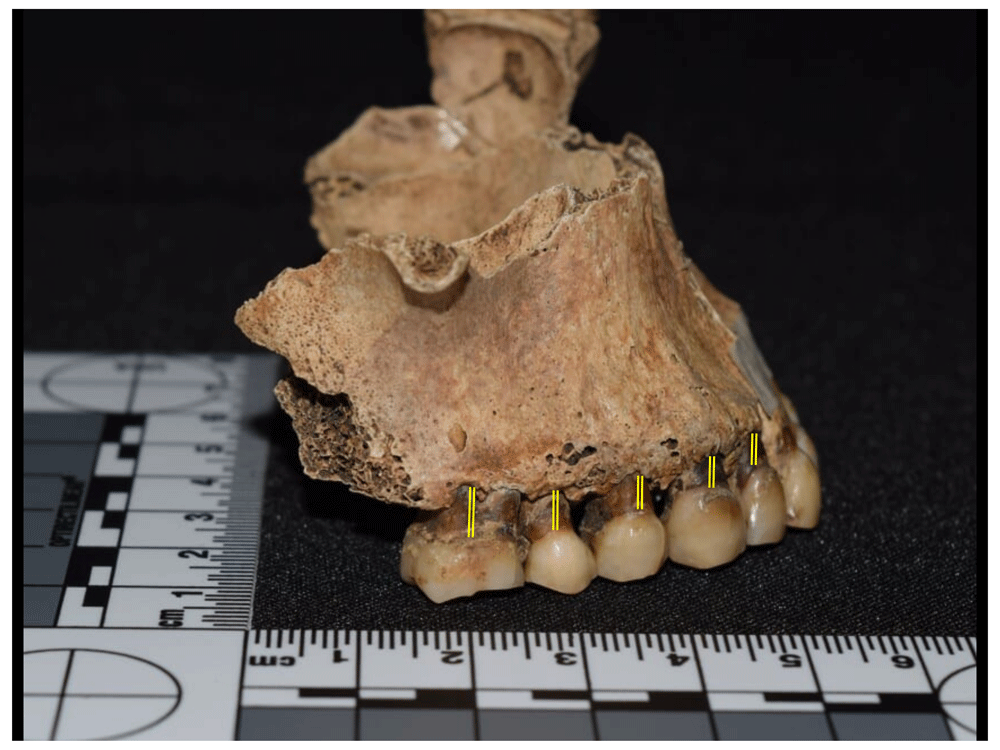
Figure 94. Retraction of alveolar margin in maxilla of 1078.
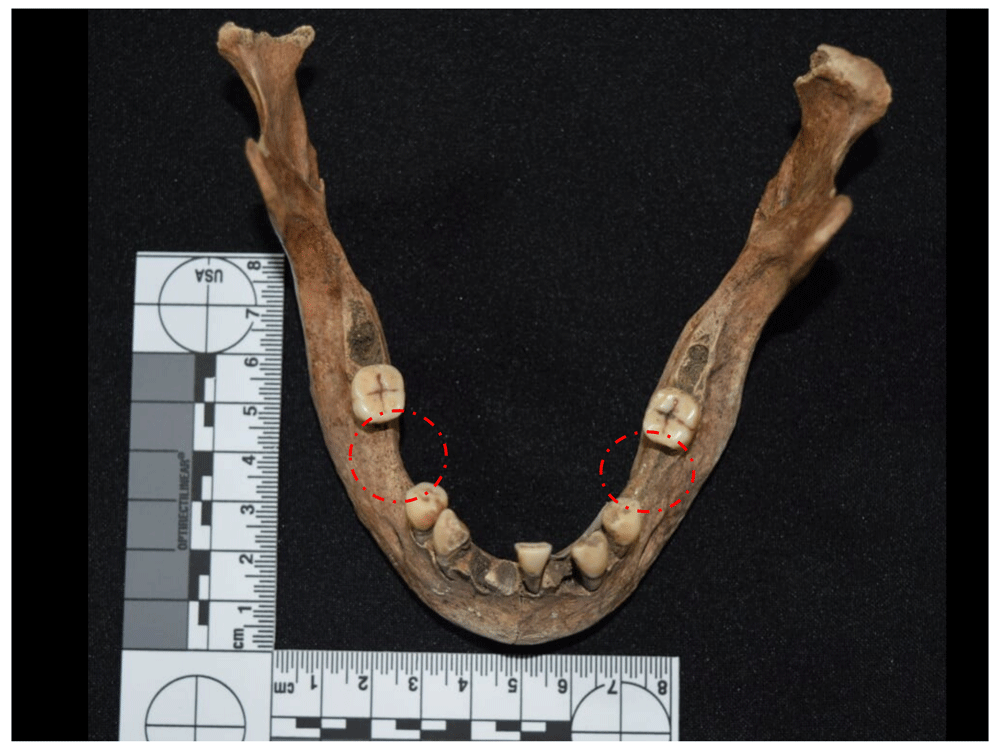
Figure 95. Antemortem dental loss in 1097, probably due to periodontal disease.
Inflammation of periodontal tissues can facilitate the entry of bacteria through caries, dental fracture or excessive wear, generating inflammation and subsequent necrosis of the pulp tissue; this subsequently crosses the root and generates an infection in the apex with accumulation of pus, forming a periapical abscess that can drain through a fistula in the maxillary bone which is not always macroscopically visible. In the sample analysed, these lesions correspond to an effective prevalence of just 3.7%, i.e. three cases (Figure 96 to Figure 98).
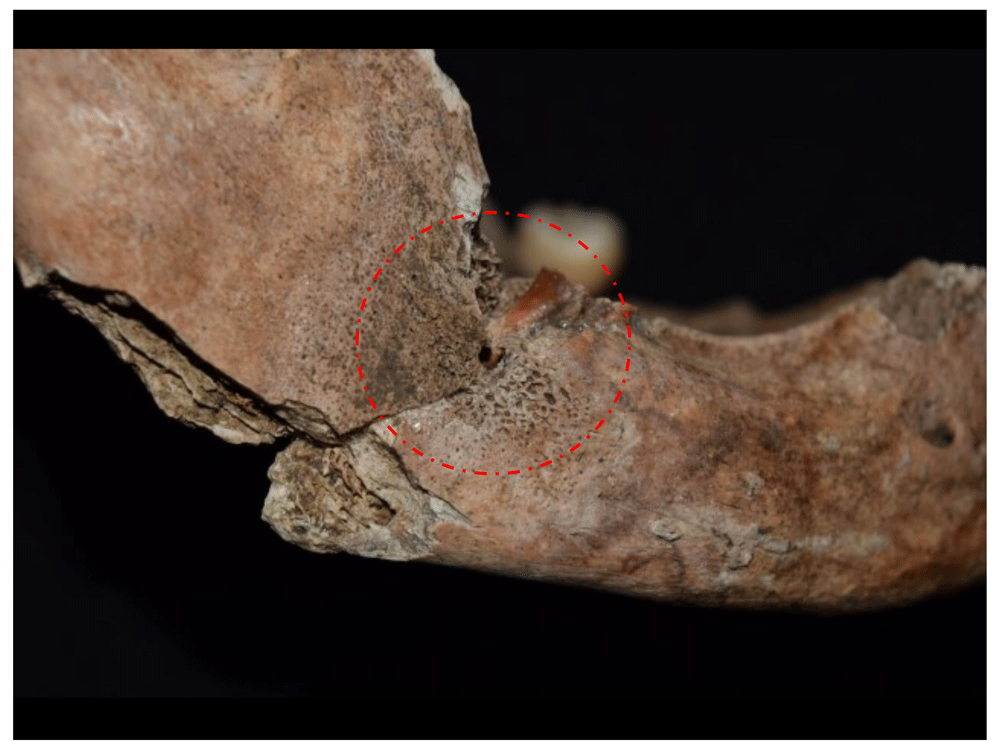
Figure 96. Drainage fistula in abscess of space for right lower M3 in 1176.
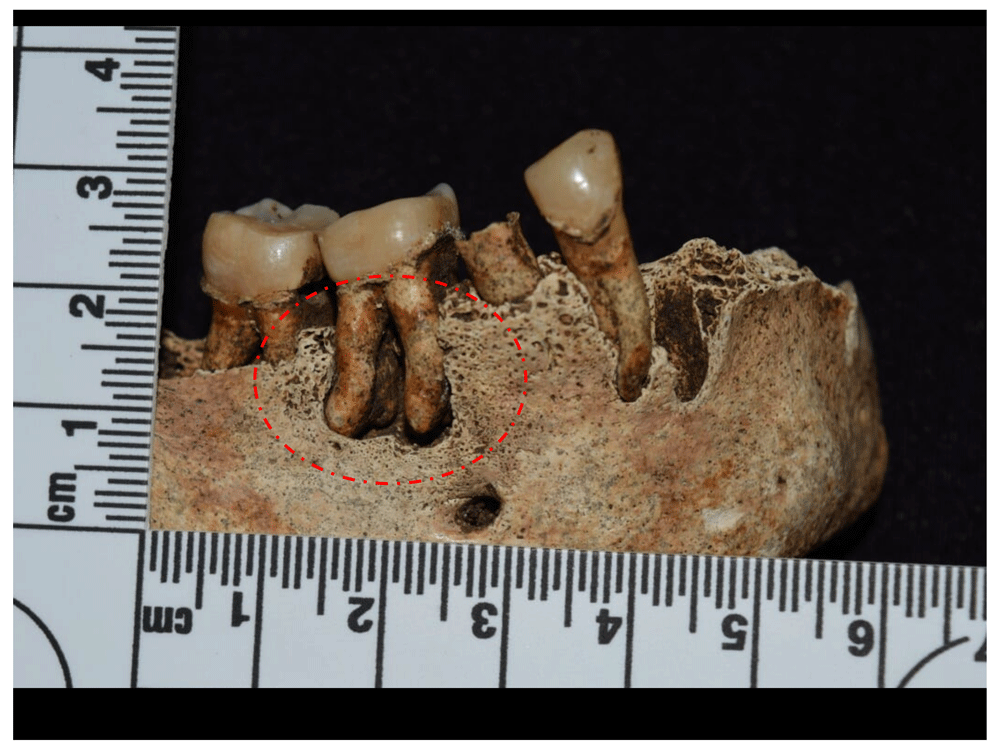
Figure 97. Periapical abscess in right lower M1 of 1019.
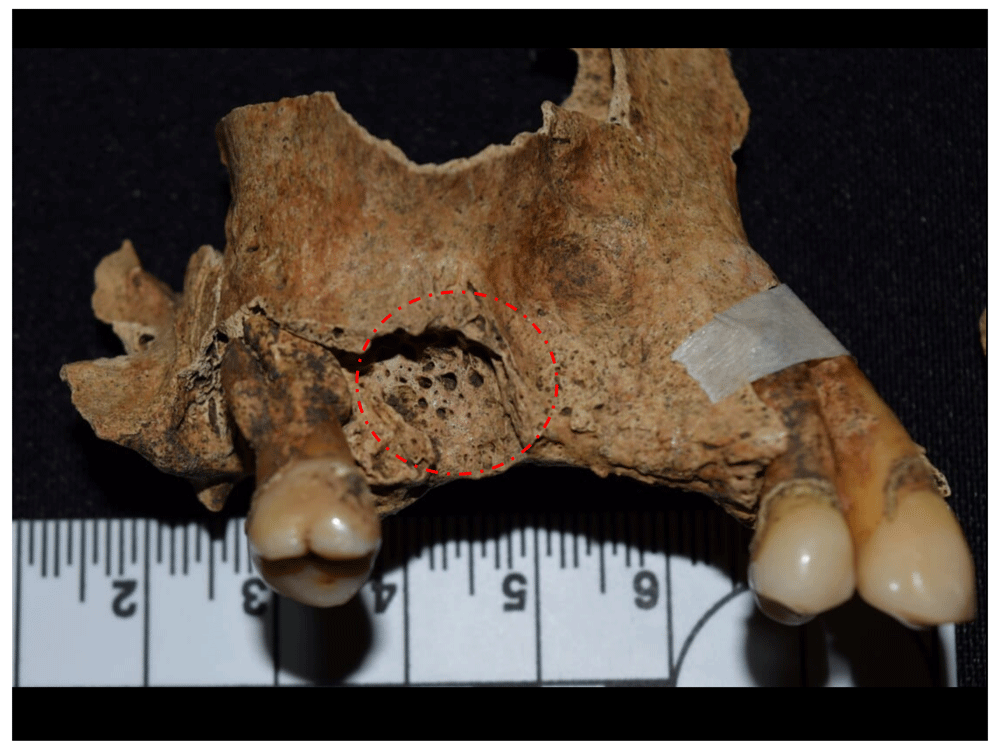
Figure 98. Periapical abscess in right upper M1 space of 1031.
One of the most frequent indicators of nutritional stress in paleopathology are enamel defects and particularly hypoplasias, which are manifested in the form of lines or pits on the surface of the crown and, since they are only formed during dental formation and growth, provide information on the health conditions of infant populations, signalling specific episodes of limited duration associated with events of nutritional deficiency (hypovitaminosis A or D), diseases (infections, influenza, gestational diabetes, etc.), parasitosis and gastroenteritis, among other causes (Canci & Monozzi, 2012). A prevalence of 22.22% was recorded in Panama Viejo (Figure 99 to Figure 102).
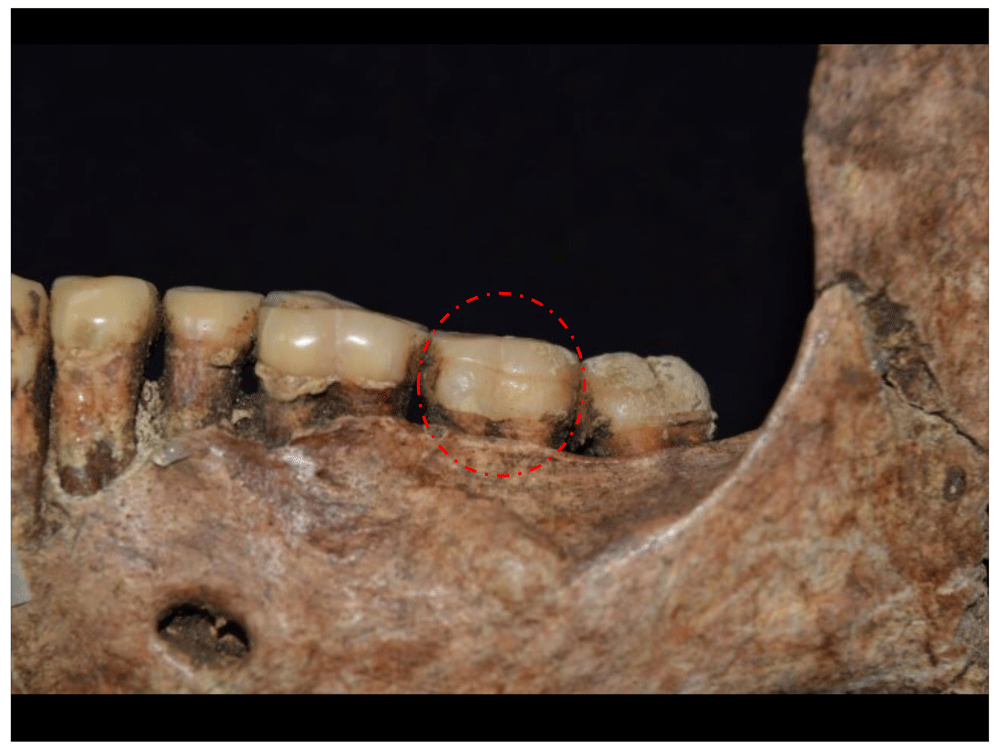
Figure 99. Linear enamel hypoplasia in left upper M2, associated with 1180.
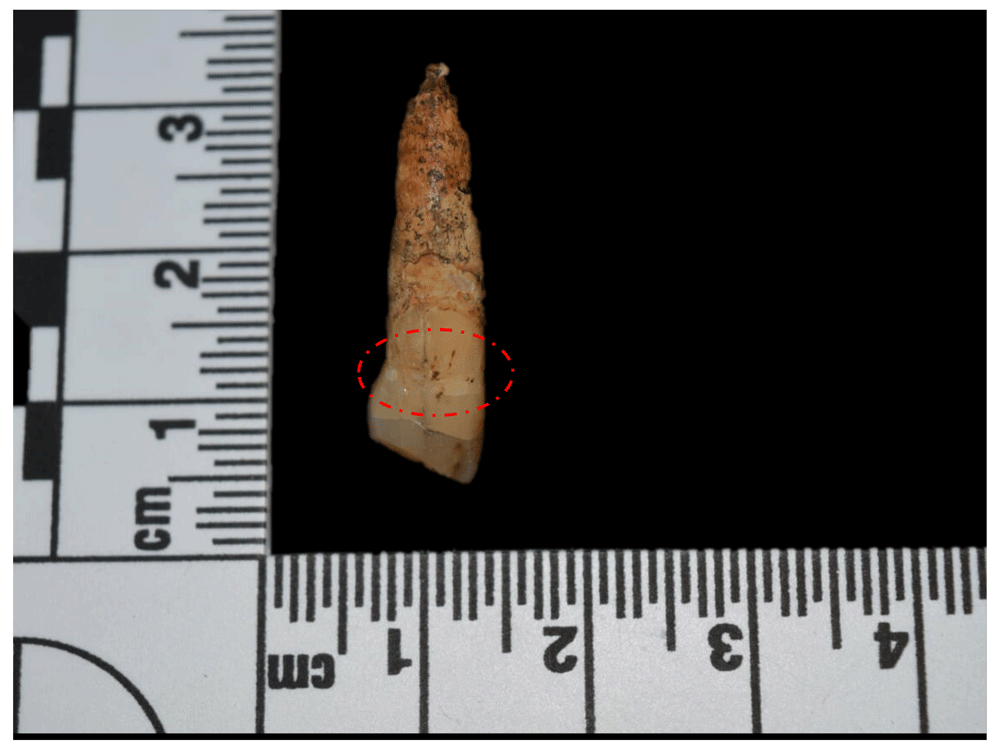
Figure 100. Linear enamel hypoplasia in left lower canine, associated with 1016.
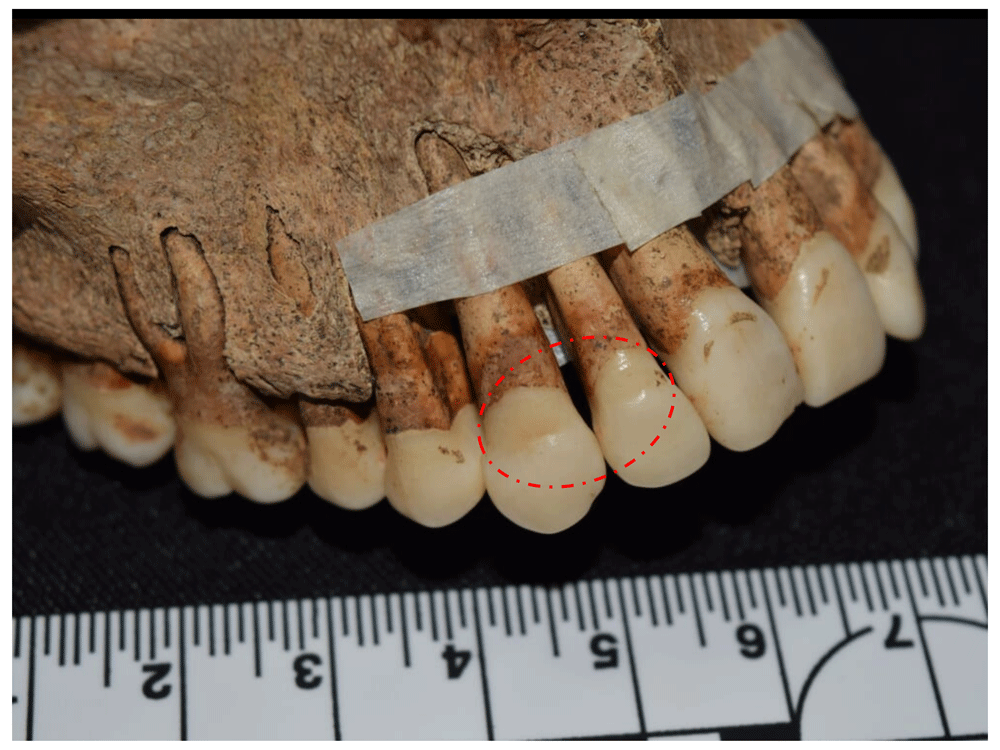
Figure 101. Linear enamel hypoplasia in canine and right upper lateral incisor, associated with 1070.
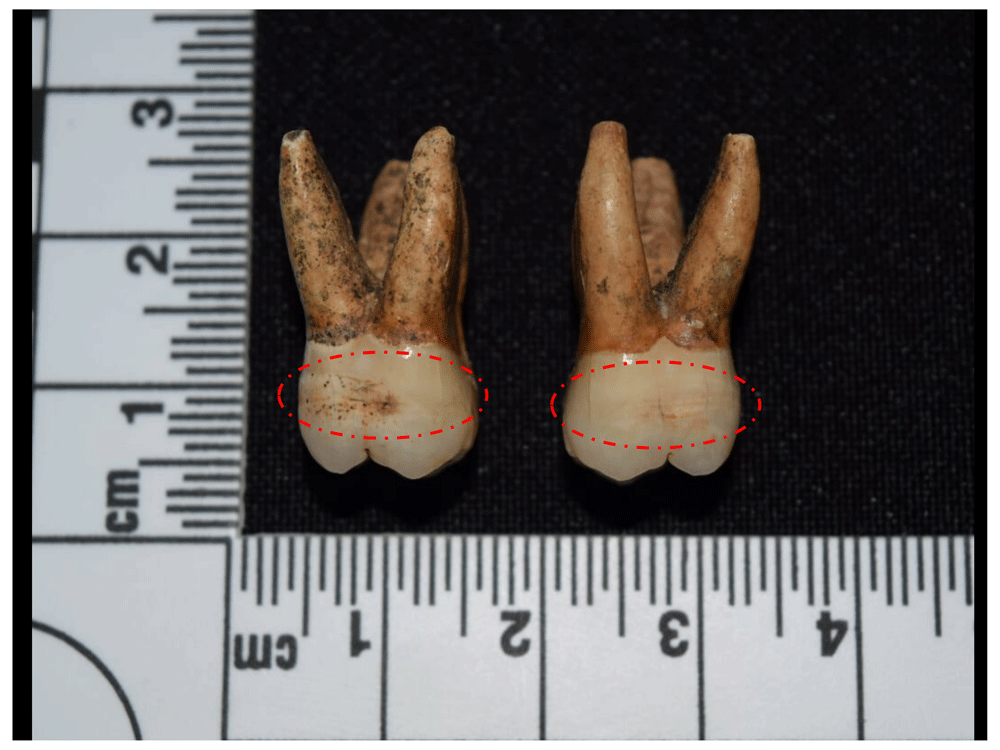
Figure 102. Linear enamel hypoplasia in right upper M1 and M2, associated with 1201.
It was possible to record different types of cultural modification in the teeth in 12.35% of the sample, particularly concentrated in the anterior teeth (Figure 103 to Figure 105), which in four of the 10 cases recorded correspond to dental sharpening, mainly involving the incisors, although it is also possible to see some canines, both in the lower and upper arches (Smith-Guzmán et al., 2020). This modification can be linked to biocultural practices in Sub-Saharan Africa, where sharpening is often related to aesthetic aspects and ethnic differentiation, and, to a lesser extent, to rites of passage to adulthood, punishment, pain resistance and other cultural traditions (Irish, 2017: 35).
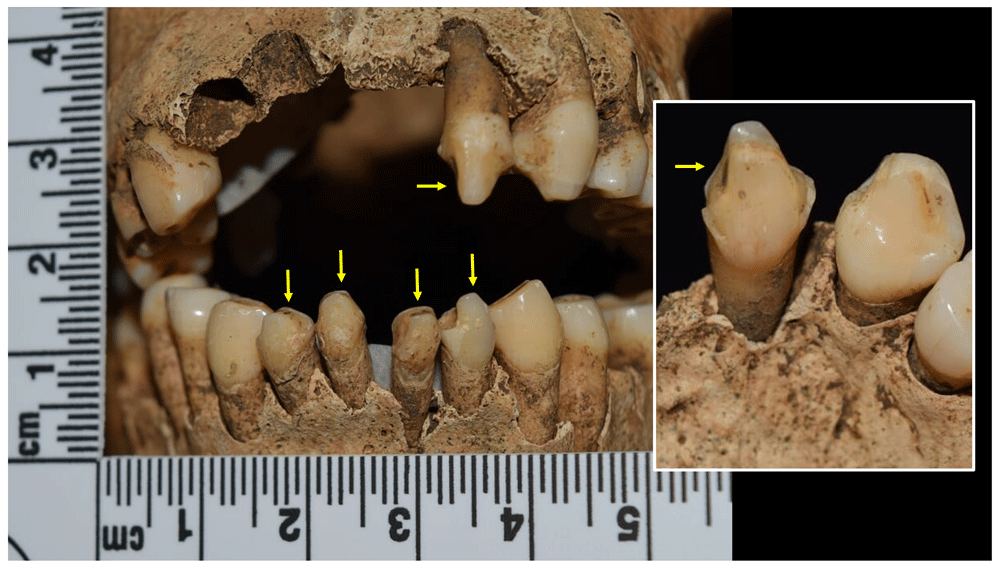
Figure 103. Dental sharpening in incisors of individual of 1082.
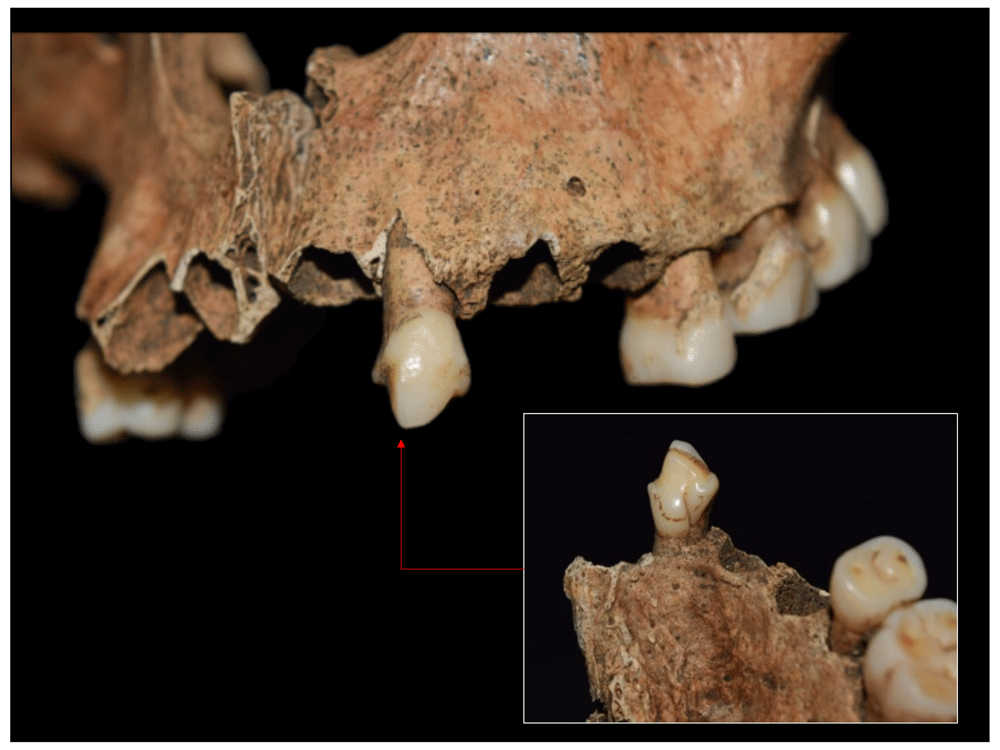
Figure 104. Dental sharpening in left upper I2 of 1082.
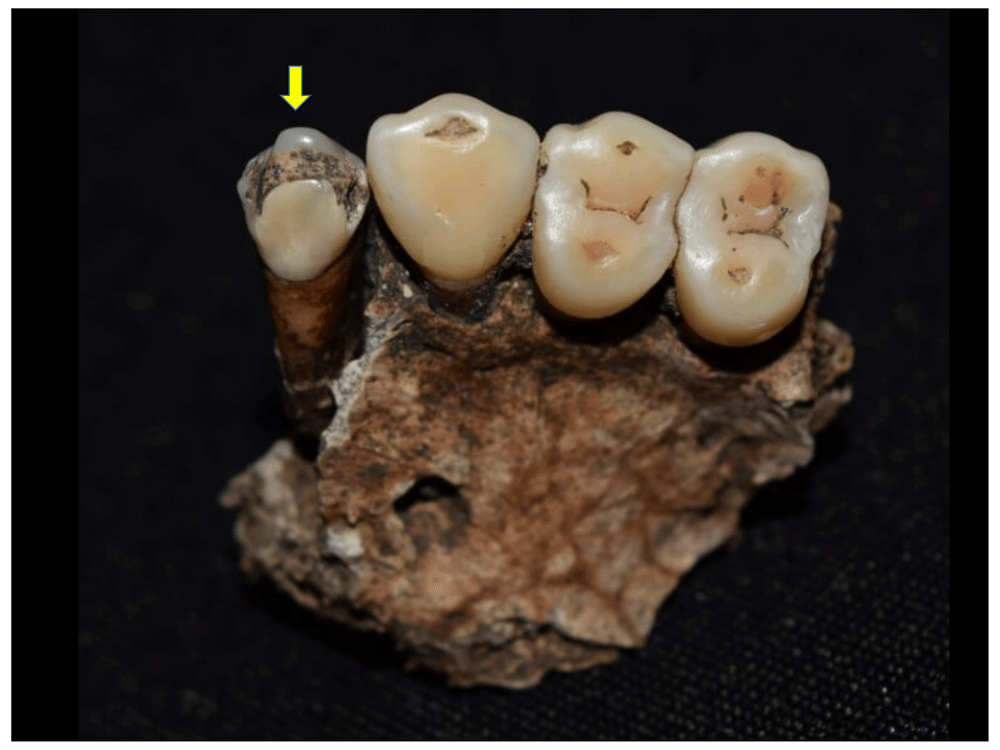
Figure 105. Dental sharpening in left upper I2 of 1162.
The technique used for this modification has been ethnographically recorded for the Aka peoples of the Central African Republic. Here, patients rest their heads on the lap of the person performing the intervention, and are then made to bite on a branch with their molars in order to expose the incisors. The teeth are then struck with the help of a knife or chisel and a stone mallet in order to give them the desired shape, and finally filed to correct possible imperfections (Irish, 2017: 40–41). The complications that can be generated with this intervention include caries, death or loss of the tooth, abscesses, and trauma due to pulp exposure; however, none of these lesions were recorded in the teeth that presented sharpening in the sample.
In four other individuals, there is interproximal wear that is manifested through concavities or grooves in buccolingual direction in the middle portion of the crown or cervical neck, located mostly in the anterior teeth, although they can also be found elsewhere (Figure 106 and Figure 107). This type of modification is generally associated with the use of toothpicks or miliary objects used for dental hygiene, or with work activities such as removing the tendons of animals (Hillson, 1996: 251), preparing plant fibres, or as a "third hand" in producing artefacts (Canci & Minozzi, 2012: 208).
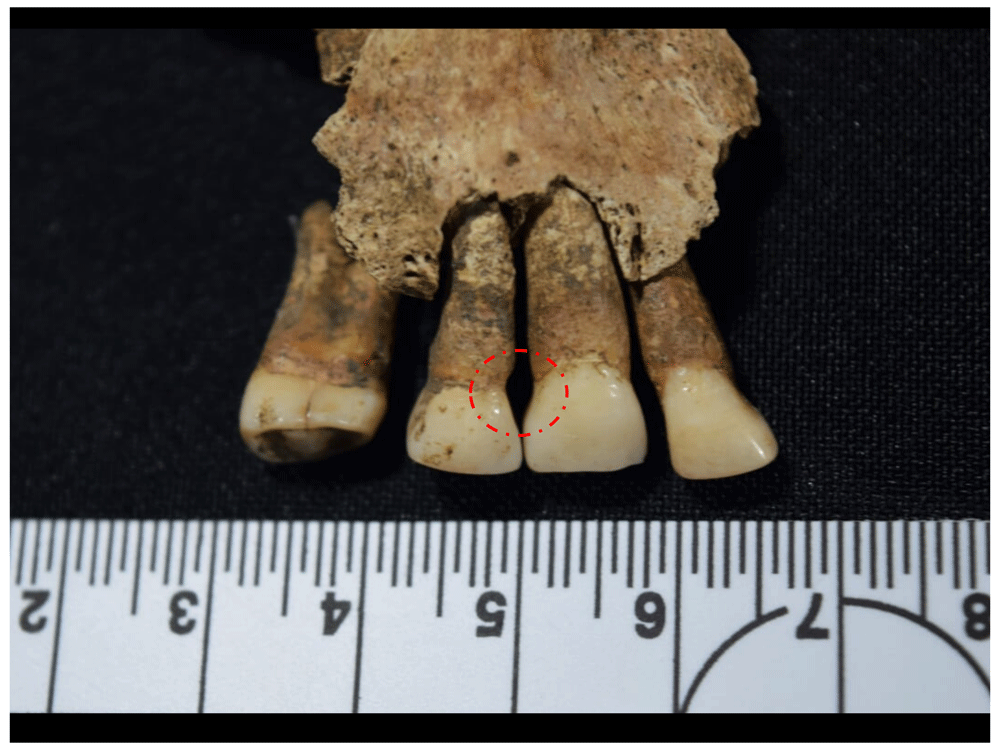
Figure 106. Interproximal wear between right upper P1 and C of 1043.
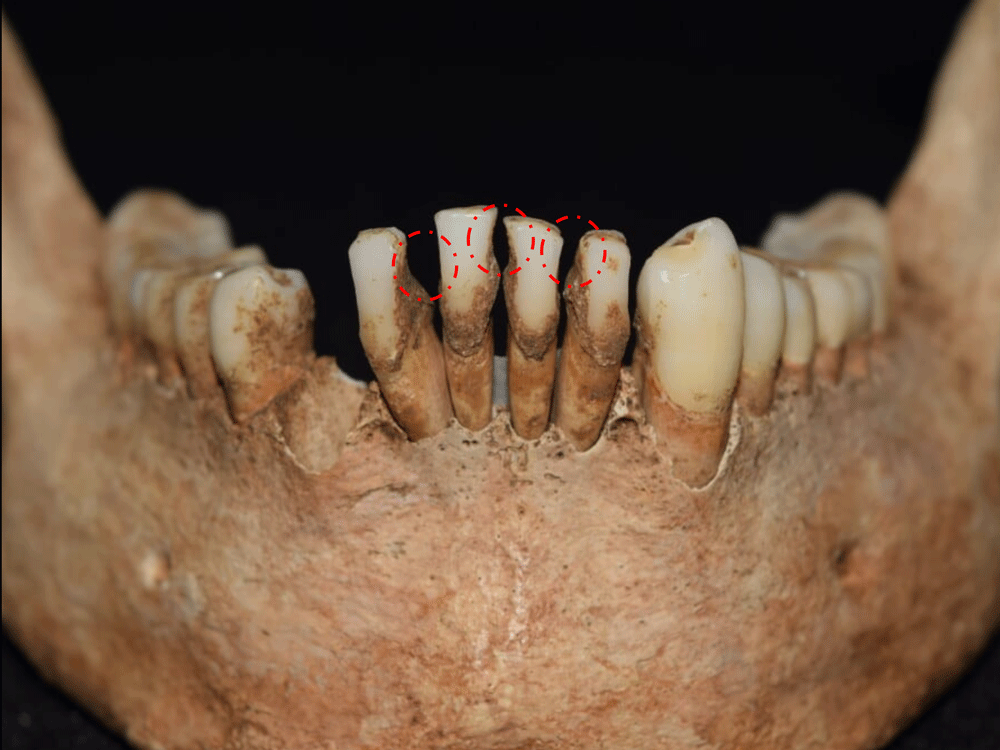
Figure 107. Interproximal wear in lower incisors of 2008.
Other anomalous wear recorded in the sample is compatible with wear of the lingual surface of the maxillary anterior teeth or LSAMAT (Figure 108 to Figure 110), which has frequently been reported in bioarchaeological material for pre-Hispanic American contexts, and has been associated with diet or the use of teeth in preparing food or producing instruments (Hillson, 1996: 252–253). This suggests the continuity of some indigenous practices after contact, although it cannot be ruled out that populations of African or European origin also used their teeth in some or other activity, which ultimately led to the formation of LSAMAT; indeed, three of the four individuals associated with this modification are of European descent.
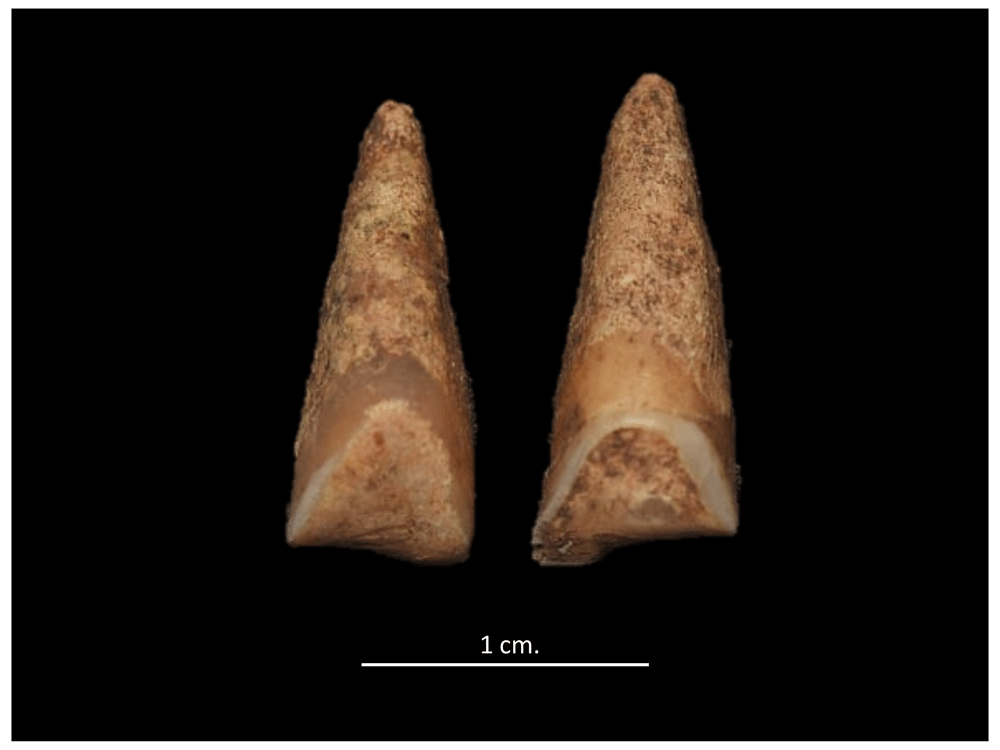
Figure 108. Evidence of wear of the lingual surface of the maxillary anterior teeth in upper central incisors of 4023.
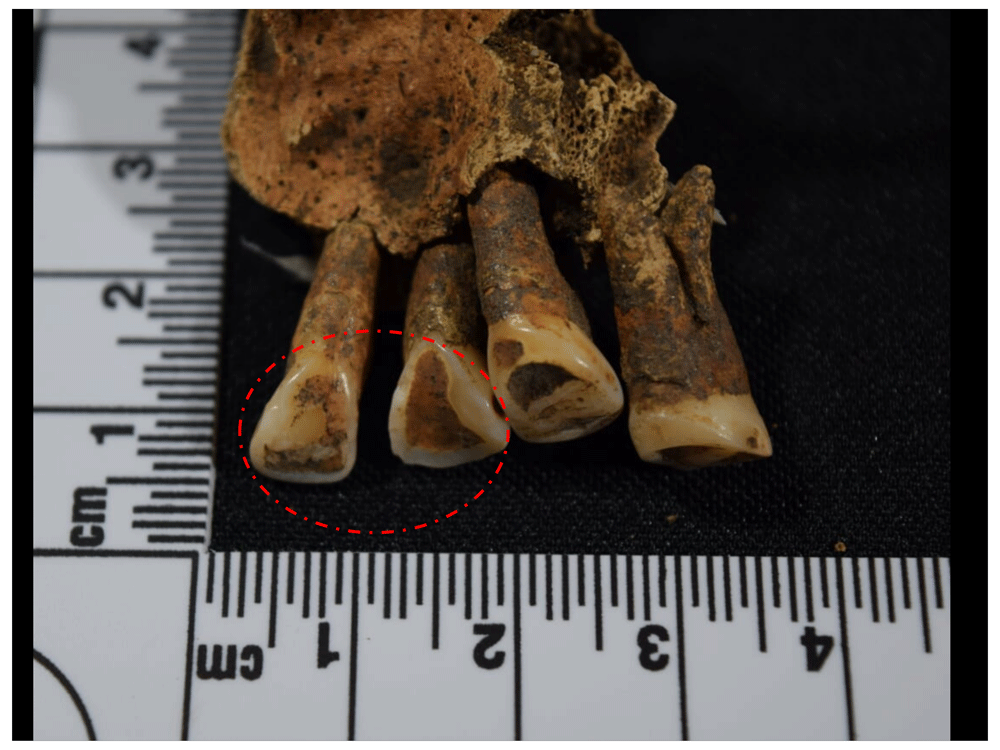
Figure 109. Evidence of wear of the lingual surface of the maxillary anterior teeth in right upper incisors of 1043.
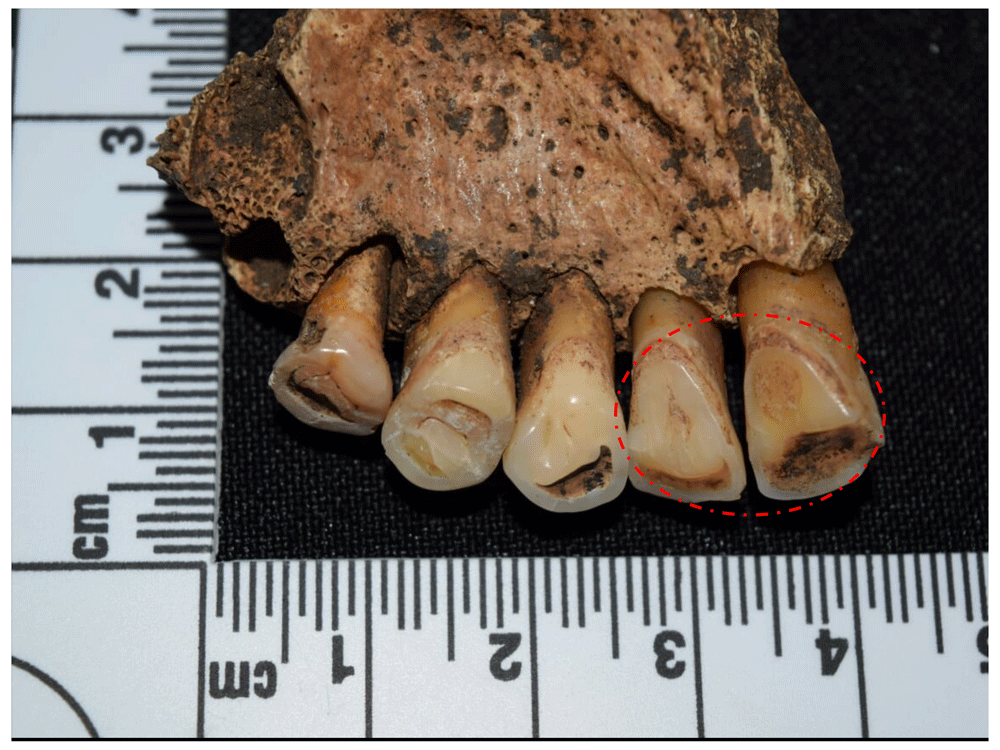
Figure 110. Evidence of wear of the lingual surface of the maxillary anterior teeth in left upper incisors of 1091.
Finally, with an effective prevalence of 3.7% corresponding to three cases, in some teeth it was possible to identify a massive overproduction of cementum in the roots, an anomaly known as hypercementosis, which gives roots a bulbous, irregular appearance (Figure 111 and Figure 112). Although its origin is unknown, it may be related to excessive wear or malocclusion, although it has also been reported for diseases such as Piaget's disease and in bone changes of the mandible and maxilla (Hillson, 1996: 205–206).
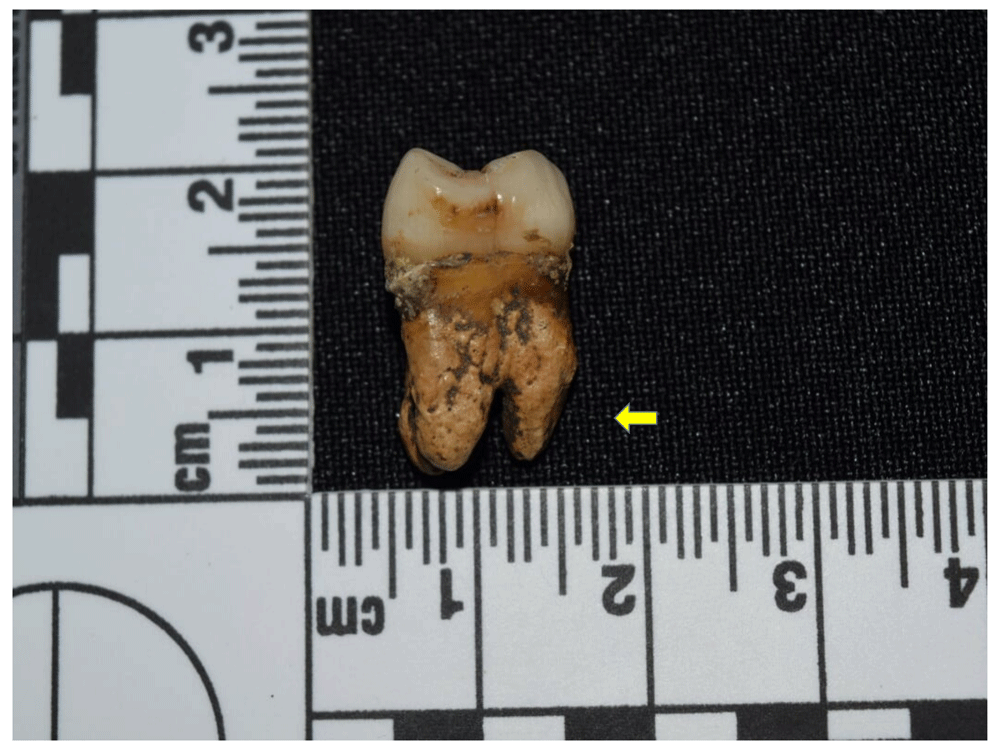
Figure 111. Hypercementosis in right upper M1 root of 1078.
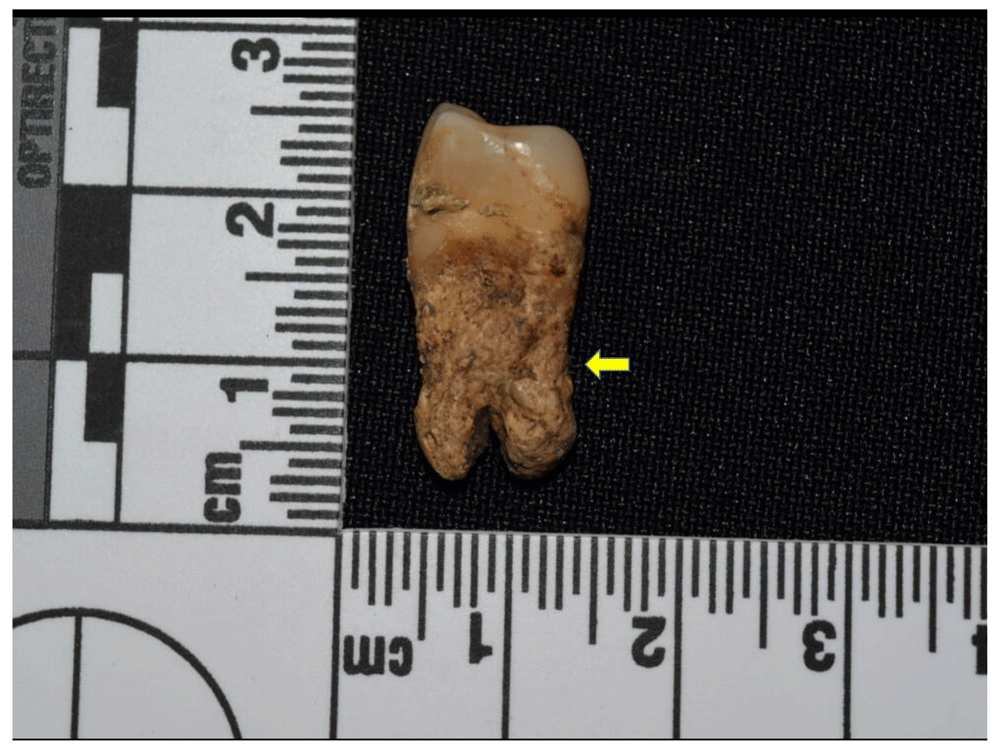
Figure 112. Hypercementosis in root of left upper P1 of 1078.
Overall frequency of bone abnormalities by sex, age, and ancestry. Observing bone anomalies in the defined groups according to sex shows a marked difference between male and female individuals for the excavated sample. While women present an effective prevalence of 67.82%, the proportion of men who manifest at least one bone anomaly stands at 95.53%. The effective percentage for those individuals whose sex could not be estimated was 76.92% (Table 20).
Table 20. Proportion of individuals by sex with bone anomalies in sample.
| Female | Male | Unobservable /
Unknown sex |
|---|
| N | % Total | % Effec. | Freq. | % Total | % Effec. | Freq. | % Total | % Effec. |
|---|
| Unobservable | 10 | 10.31 | - | 2 | 4.00 | - | 2 | 7.14 | - |
| No anomalies | 28 | 28.87 | 32.18 | 2 | 4.00 | 4.17 | 6 | 21.43 | 23.08 |
| Anomalies | 59 | 60.82 | 67.82 | 46 | 92.00 | 95.83 | 20 | 71.43 | 76.92 |
| Total | 97 | 100.00 | - | 50 | 100.00 | - | 28 | 100.00 | - |
| Total Effective | 87 | 89.69 | 100.00 | 48 | 96.00 | 100.00 | 26 | 92.86 | 100.00 |
That said, if the sample is organised according to age groups, only 33.33% correspond to subadult individuals with at least one lesion or bone anomaly, where juveniles (57.14%) and infants II (50%) have the highest values. However, it should be considered that these individuals are underrepresented in the sample, meaning the observations may be skewed. With regard to adults, middle adults present a high prevalence of individuals with the presence of at least one anomaly (90.91%), while young adults total 77.91%, and the figure for those adults whose age range could not be determined is 73.53% (Table 21). This corresponds to epidemiological models, where abnormalities and lesions are expected to increase proportionally with age.
Table 21. Proportion of individuals by age group with bone abnormalities in sample.
| Infant I | Infant II | Juvenile |
|---|
| N | % Tot. | % Effec. | N | % Tot. | % Effec. | N | % Tot. | % Effec. |
|---|
| Unobservable | 1 | 0.00 | | 0 | 0.00 | | 0 | 0.00 | |
| No anomalies | 4 | 80.00 | 100.00 | 3 | 50.00 | 50.00 | 3 | 42.86 | 42.86 |
| Anomalies | 0 | 0.00 | 0.00 | 1 | 50.00 | 50.00 | 4 | 57.14 | 57.14 |
| Total | 5 | 100.00 | | 4 | 100.00 | | 7 | 100.00 | |
| Total Effective | 4 | 80.00 | 100.00 | 4 | 100.00 | 100.00 | 7 | 100.00 | 100.00 |
| Young Adult | Middle Adult | Adult |
|---|
| N | % Tot. | % Effec. | N | % Tot. | % Effec. | N | % Tot. | % Effec. |
|---|
| Unobservable | 6 | 6.52 | - | 0 | 0 | - | 11 | 24.44 | - |
| No anomalies | 19 | 20.65 | 22.09 | 2 | 9.09 | 9.09 | 9 | 20.00 | 26.47 |
| Anomalies | 67 | 72.83 | 77.91 | 20 | 90.91 | 90.91 | 25 | 55.56 | 73.53 |
| Total | 92 | 100.00 | - | 22 | 100.00 | - | 45 | 100.00 | - |
| Total Effective | 86 | 93.48 | 100.00 | 22 | 100.00 | 100.00 | 34 | 75.56 | 100.00 |
The sample organised by population groups according to phenotypic variation (Table 22) shows results with very similar effective percentages for presence of lesions or anomalies among Europeans, Amerindians and Africans, with Europeans showing a slight increase (77.78%) compared to the other two groups, suggesting that individuals of different ancestries were affected in similar proportion.
Table 22. Proportion of individuals by ancestry group with bone abnormalities in sample.
| European and
predominantly European | Amerindian and
predominantly
Amerindian |
|---|
| N | % Tot. | % Effec. | N | % Tot. | % Effec. |
|---|
| Unobservable | 2 | 5.26 | - | 0 | 0.00 | - |
| No anomalies | 8 | 21.05 | 22.22 | 4 | 23.53 | 23.53 |
| Anomalies | 28 | 73.68 | 77.78 | 13 | 76.47 | 76.47 |
| Total | 38 | 100.00 | - | 17 | 100.00 | - |
| Total Effective | 36 | 94.74 | 100.00 | 17 | 100.00 | 100.00 |
| African and
predominantly African | Unobservable |
|---|
| N | % Tot. | % Effec. | N | % Tot. | % Effec. |
|---|
| Unobservable | 1 | 2.44 | - | 15 | 18.99 | - |
| No anomalies | 11 | 26.83 | 27.50 | 17 | 21.52 | 26.56 |
| Anomalies | 29 | 70.73 | 72.50 | 47 | 59.49 | 73.44 |
| Total | 41 | 100.00 | - | 79 | 100.00 | - |
| Total Effective | 40 | 97.56 | 100.00 | 64 | 81.01 | 100.00 |
Specific frequency of bone anomalies by sex, age, and ancestry. The differences found in the specific prevalence of lesions in the individuals from the Cathedral are presented below, grouped by sex, age, and ancestral group (Table 23 to Table 25, and Figure 113 to Figure 115). These show some important differences compared to the epidemiological models that have been built around the incidence of these pathological manifestations at population level, allowing us to address the living and health conditions of the individuals buried in the cathedral and to the south-east of Panama Viejo’s main square.
Table 23. Prevalence of bone lesions in individuals grouped by sex.
| Anomaly or lesion | Female | Male | Unobservable /
Unknown sex |
|---|
| N | % Effective | N | % Effective | N | % Effective |
|---|
Periostosis
(infections) | 22 | 25.29 | 23 | 47.92 | 3 | 11.54 |
| Entheseal changes | 22 | 25.29 | 22 | 45.83 | 2 | 7.69 |
Degenerative joint
disease | 21 | 24.14 | 16 | 33.33 | 1 | 3.85 |
| Trauma | 16 | 18.39 | 9 | 18.75 | 3 | 11.54 |
| Porotic Hyperostosis | 24 | 27.59 | 18 | 37.50 | 1 | 3.85 |
| Cribra orbitalia | 8 | 9.20 | 5 | 10.42 | 0 | 0.00 |
| Neoplastic lesions | 11 | 12.64 | 2 | 4.17 | 1 | 3.85 |
Hyperostosis frontalis
interna | 3 | 3.45 | 2 | 4.17 | 0 | 0.00 |
| Inflammatory process | 1 | 1.15 | 2 | 4.17 | 2 | 7.69 |
| Spondylolysis | 2 | 2.30 | 2 | 4.17 | 0 | 0.00 |
Development
anomalies | 2 | 2.30 | 1 | 2.08 | 0 | 0.00 |
Heterotopic
ossification | 0 | 0.00 | 2 | 4.17 | 0 | 0.00 |
| Trepanation | 0 | 0.00 | 0 | 0.00 | 1 | 3.85 |
| Cranial flattening | 1 | 1.15 | 0 | 0.00 | 0 | 0.00 |
Table 24. Prevalence of bone lesions by age group.
| Anomaly or lesion | No Adult | Young Adult | Middle Adult | Adult |
|---|
| N | % Effec | N | % Effec | N | % Effec | N | % Effec |
|---|
| Periostosis (Infections) | 2 | 13.33 | 27 | 31.40 | 12 | 54.55 | 7 | 20.59 |
| Entheseal changes | 1 | 6.67 | 30 | 34.88 | 12 | 54.55 | 3 | 8.82 |
Degenerative joint
disease | 0 | 0.00 | 21 | 24.42 | 14 | 63.64 | 3 | 8.82 |
| Trauma | 1 | 6.67 | 15 | 17.44 | 2 | 9.09 | 10 | 29.41 |
| Porotic Hyperostosis | 2 | 13.33 | 27 | 31.40 | 4 | 18.18 | 10 | 29.41 |
| Cribra orbitalia | 1 | 6.67 | 9 | 10.47 | 2 | 9.09 | 1 | 2.94 |
| Neoplastic lesions | 0 | 0.00 | 7 | 8.14 | 3 | 13.64 | 4 | 11.76 |
Hyperostosis frontalis
interna | 0 | 0.00 | 2 | 2.33 | 1 | 4.55 | 2 | 5.88 |
| Inflammatory process | 0 | 0.00 | 1 | 1.16 | 1 | 4.55 | 3 | 8.82 |
| Spondylolysis | 0 | 0.00 | 4 | 4.65 | 0 | 0.00 | 0 | 0.00 |
| Development anomalies | 0 | 0.00 | 3 | 3.49 | 0 | 0.00 | 0 | 0.00 |
| Heterotopic ossification | 0 | 0.00 | 0 | 0.00 | 2 | 9.09 | 0 | 0.00 |
| Trepanation | 0 | 0.00 | 0 | 0.00 | 0 | 0.00 | 1 | 2.94 |
| Cranial flattening | 0 | 0.00 | 0 | 0.00 | 1 | 4.55 | 0 | 0.00 |
Table 25. Prevalence of bone lesions in individuals grouped by population affiliation.
| Anomaly or lesion | European and
predominantly
European | Amerindian and
predominantly
Amerindian | African and
predominantly
African | Unobservable |
|---|
| N | % Effec | N | % Effec | N | % Effec | N | % Effec |
|---|
| Periostosis (Infections) | 11 | 30.56 | 3 | 17.65 | 10 | 25.00 | 24 | 37.50 |
| Entheseal changes | 8 | 22.22 | 6 | 35.29 | 8 | 20.00 | 24 | 37.50 |
Degenerative joint
disease | 7 | 19.44 | 3 | 17.65 | 10 | 25.00 | 18 | 28.13 |
| Trauma | 5 | 13.89 | 2 | 11.76 | 6 | 15.00 | 12 | 18.75 |
| Porotic Hyperostosis | 17 | 47.22 | 6 | 35.29 | 11 | 27.50 | 9 | 14.06 |
| Cribra orbitalia | 7 | 19.44 | 2 | 11.76 | 4 | 10.00 | 0 | 0.00 |
| Neoplastic lesions | 3 | 8.33 | 1 | 5.88 | 7 | 17.50 | 3 | 4.69 |
Hyperostosis frontalis
interna | 2 | 5.56 | 0 | 0.00 | 2 | 5.00 | 1 | 1.56 |
| Inflammatory process | 0 | 0.00 | 2 | 11.76 | 2 | 5.00 | 1 | 1.56 |
| Spondylolysis | 0 | 0.00 | 0 | 0.00 | 1 | 2.50 | 3 | 4.69 |
| Development anomalies | 0 | 0.00 | 0 | 0.00 | 1 | 2.50 | 2 | 3.13 |
| Heterotopic ossification | 0 | 0.00 | 0 | 0.00 | 0 | 0.00 | 2 | 3.13 |
| Trepanation | 0 | 0.00 | 0 | 0.00 | 0 | 0.00 | 1 | 1.56 |
| Cranial flattening | 0 | 0.00 | 0 | 0.00 | 1 | 2.50 | 0 | 0.00 |
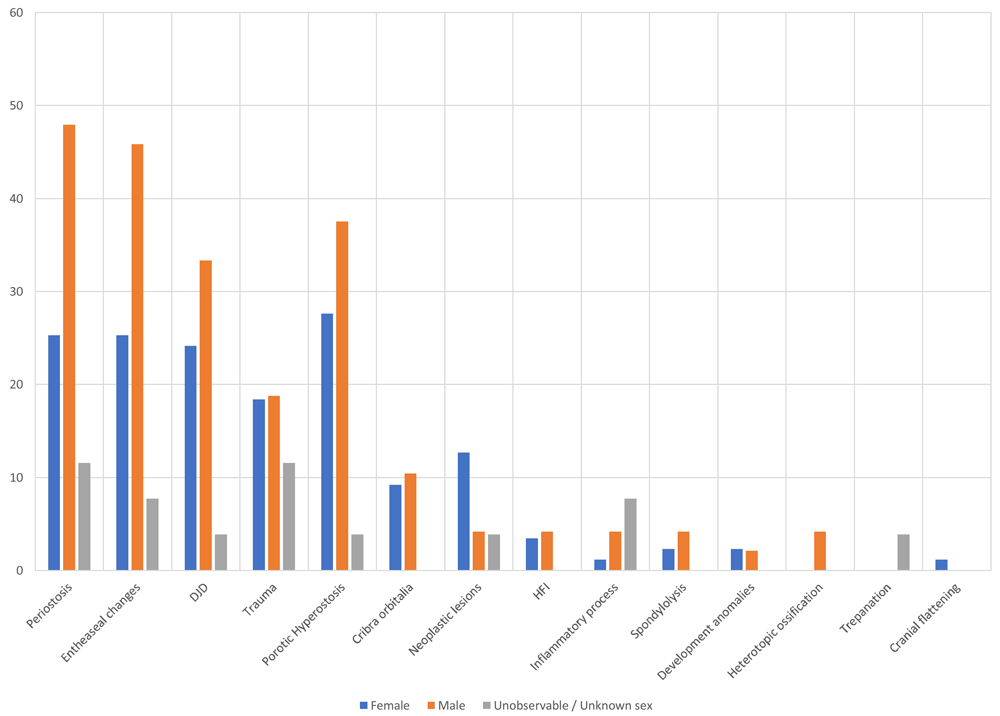
Figure 113. Prevalence of bone lesions in individuals grouped by sex.
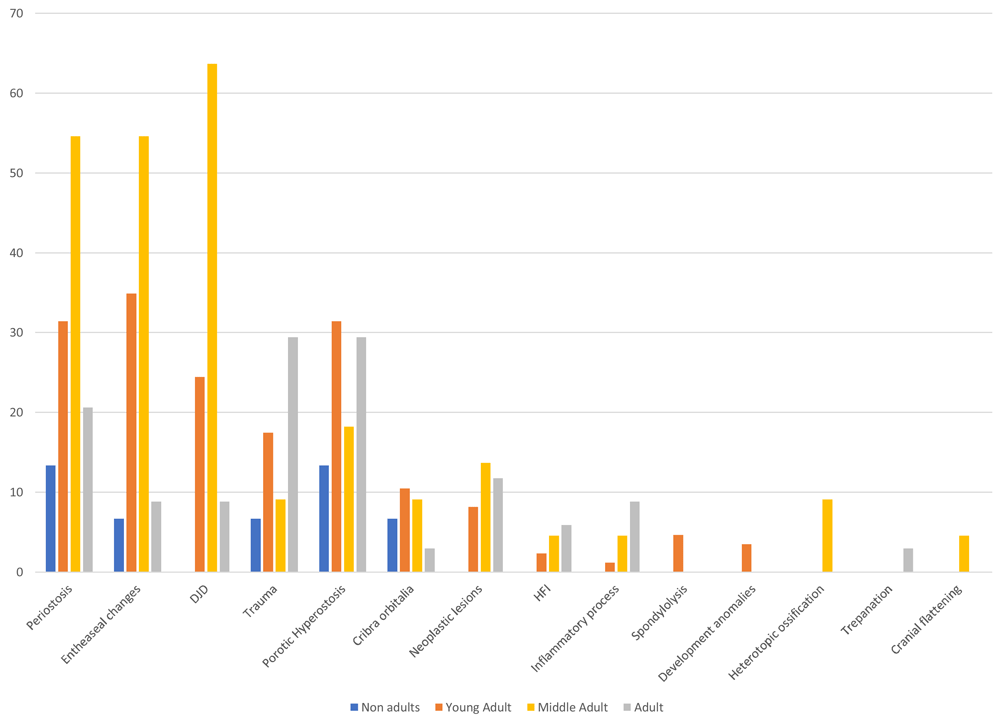
Figure 114. Prevalence of bone lesions by age group.
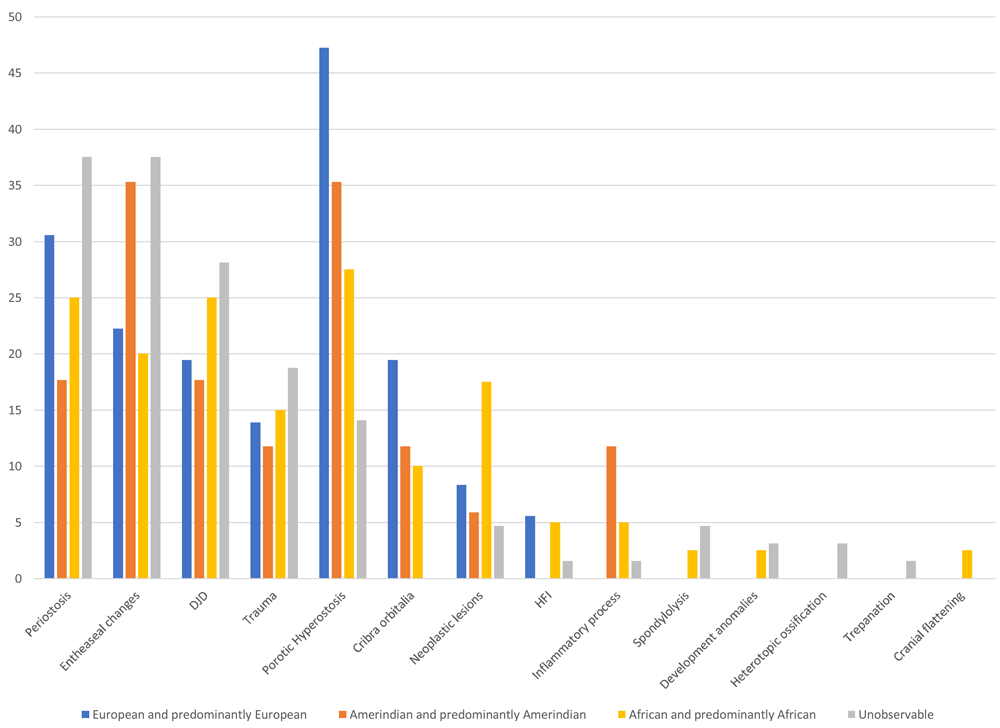
Figure 115. Prevalence of bone lesions in individuals grouped by ancestry.
First of all, with infectious diseases being the most frequent in the sample, observing prevalence according to sex shows a significant proportional difference that affects men (47.92%) much more than women (25.29%). This contrasts with that reported for the collection of colonial period human skeletal remains from Panama Viejo (Rojas-Sepúlveda et al., 2011), which, for infectious diseases, identified that men had an effective prevalence of 20%, while for women this figure was 18.75%. However, the number of cases reported by Rojas-Sepúlveda & colleagues (2011) tends to be low, which may have influenced the results.
However, when we look in detail at the proportion of specific and non-specific infections, we see that those related to treponematosis have a prevalence of 50% for both men and women, while non-specific infections have a slightly higher prevalence in men (46.67%) than in women (43.33%), although the figures are much closer to those for the complete set of infectious lesions (Table 26).
Table 26. Prevalence of infectious lesions in individuals grouped by sex.
| Treponematosis | Non-specific infections |
|---|
| Frequency | % Prevalence | Frequency | % Prevalence |
|---|
| Female | 9 | 50.00 | 13 | 43.33 |
| Male | 9 | 50.00 | 14 | 46.67 |
| Undetermined | 0 | 0 | 3 | 10.00 |
| Total | 18 | 100.00 | 30 | 100.00 |
When the same exercise is carried out by age group and ancestry, it is observed that infections in general terms are more prevalent in middle adults (54.55%) compared to young people (31.40%) or subadults (13.33%). Moreover, individuals with European or predominantly European population affiliation (30.56%) show a higher prevalence of infectious diseases than both Africans and predominantly Africans (25%) and also Amerindians and predominantly Amerindians (17.65%). However, if we compare the data for treponematosic and non-specific infections, we see that the figures are reversed in the age groups, with young adults being more affected by treponematosis (66.67%) than middle adults (22.22%), and the same also being true for non-specific infections, with 50% in young adults and 26.67% in middle adults (Table 27).
Table 27. Prevalence of infectious lesions in individuals by age group.
| Treponematosis | Non-specific infections |
|---|
| Frequency | % Prevalence | Frequency | % Prevalence |
|---|
| Subadult | 1 | 5.56 | 1 | 3.33 |
| Young Adult | 12 | 66.67 | 15 | 50.00 |
| Medium Adult | 4 | 22.22 | 8 | 26.67 |
| Adult | 1 | 5.56 | 6 | 20.00 |
| Total | 18 | 100.00 | 30 | 100.00 |
The frequencies are more balanced when observing ancestry groups, but taking into account that there was a relatively low number of cases associated with each population stock. Hence, treponeme-associated diseases are more frequent in individuals with predominantly European and African population affiliations (11.11% each), and to a lesser extent in Amerindians (5.56%). This trend is maintained when looking at non-specific infections, with a similar percentage in Amerindians (6.67%) and a moderate increase in both Europeans and Africans, who both have a prevalence of 30% and 26.67%, respectively (Table 28).
Table 28. Prevalence of infectious lesions in individuals by ancestry groups.
| Treponematosis | Non-specific infections |
|---|
| Frequency | % Prevalence | Frequency | % Prevalence |
|---|
| European and predominantly European | 2 | 11.11 | 9 | 30.00 |
| Amerindian and predominantly Amerindian | 1 | 5.56 | 2 | 6.67 |
| African and predominantly African | 2 | 11.11 | 8 | 26.67 |
| Undetermined | 13 | 72.22 | 11 | 36.67 |
| Total | 18 | 100.00 | 30 | 100.00 |
These data fit the proposed epidemiological models, where treponematosic diseases are generally found in a higher proportion in male individuals and in young people, with a higher incidence between 15 and 30 years of age for pinta and syphilis, and in subadults for yaws and bejel. Moreover, it appears that there is no direct relationship between population affiliations and the presence of lesions associated with this set of diseases (Aufderheide & Rodríguez-Martín, 1998: 155–158).
With respect to entheses, a marked difference is observed between male and female individuals, with 45.83% and 25.29%, respectively, this being greater than the difference previously recorded for the Panama Viejo colonial series, which presented closer figures between the two groups (Rojas-Sepúlveda et al., 2011). However, if analysed by age group, the trend is similar to that reported previously in Panama Viejo, where there is a higher prevalence of this type of marker in medium adults than in young people (54.55% and 34.88%, respectively, for the cathedral). The three main population groups show a similar trend among individuals predominantly linked to European (22.22%) and African (20%) populations, while those with Amerindian affiliation show a higher prevalence with 35.29%, suggesting that these individuals were more liable to develop hypertrophic processes.
In this sense, the colonial population in Panamá Viejo, regardless of its origins, may have faced physical conditions that led to the development of the musculoskeletal system, but it was the men who were probably engaged in more demanding activities. Considering that this is a cumulative process, it is logical to think that this type of marker is manifested with greater intensity in medium adults than in young people, as was evident in the sample. However, the fact that this information cannot be cross-referenced with the work and activities the individuals may have carried out during their lifetime considerably limits the scope of the interpretation.
Also associated with these anomalies are lesions caused by DJD, which, despite being directly related to individuals’ ageing processes, can also be associated with mechanical stress factors caused by activities carried out during life, aggravated by the fact they are cumulative in nature (Figure 116 to Figure 118). As with entheses, the sample analysed shows that prevalence is higher in men (33.33%) than women (24.14%); however, when comparing age groups, the distance between middle adults and young adults is much greater, with 63.64% and 24.42%, respectively, in line with the expected paleoepidemiological model. But it is interesting to see how the population shows some differences when looking at population affiliation groups, where individuals with African affiliation have a higher prevalence (25%), compared to Europeans (19.44%) and Amerindians (17.65%).
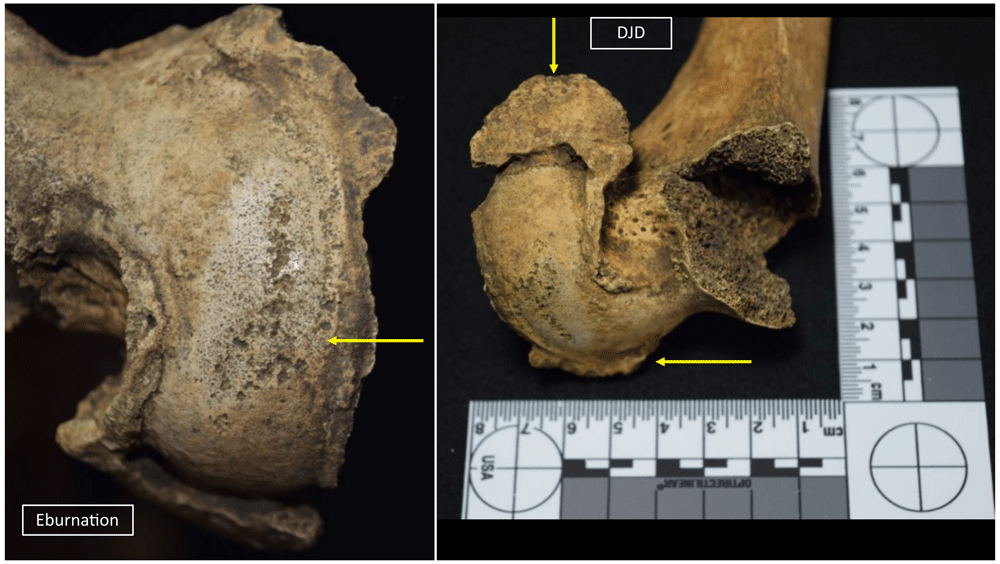
Figure 116. Eburneal and marginal lipping (degenerative joint disease) processes in right femur of 1043.
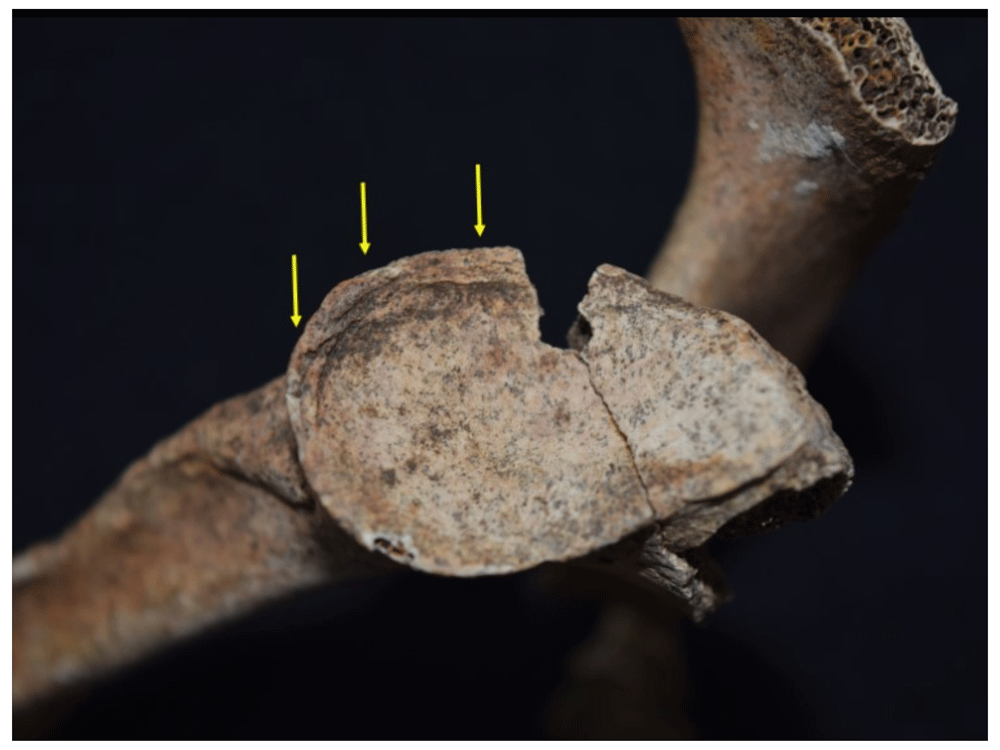
Figure 117. Marginal lipping (degenerative joint disease) in glenoid cavity of right scapula in 1090.
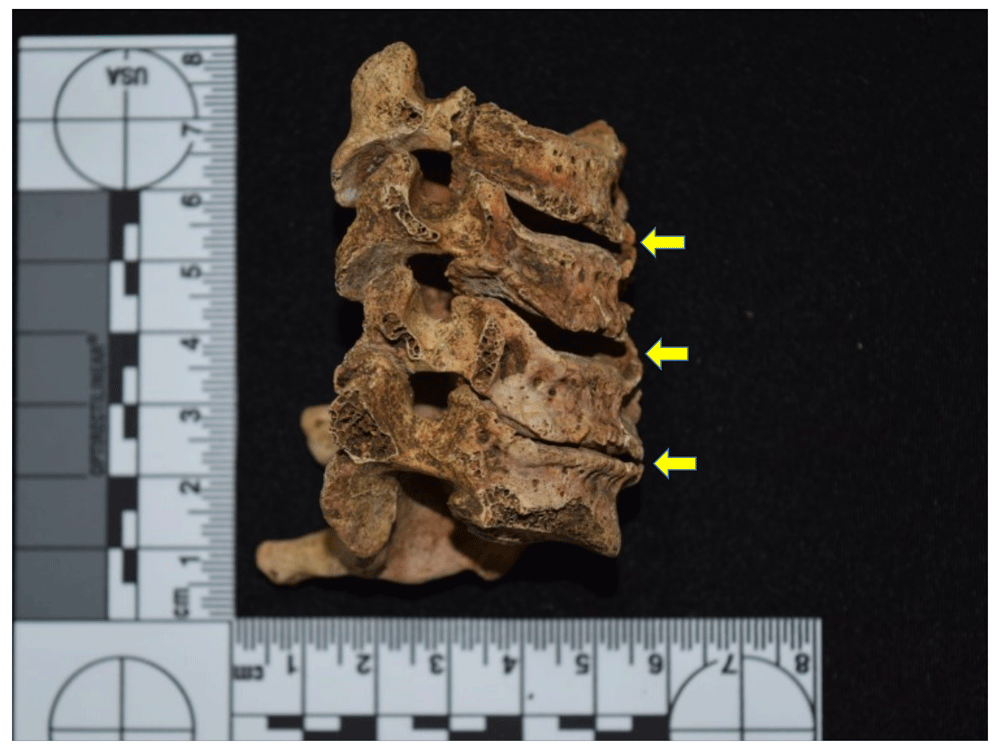
Figure 118. Cervical spondyloarthrosis in individual of 1090.
It should be clarified that these data show the frequency but not the severity of lesions, which also tends to increase with age and to affect the joints to a greater extent in women than in men. However, regardless of time and type of society, male individuals generally have the highest numbers of such lesions, although agro-pottery groups tend to show more cases than hunter-gatherers. In post-contact populations, such as in Panama, lesions increase at the spinal and lower limb levels, perhaps as a result of mobility activities, agricultural tasks and construction work, but with greater biomechanical stress in urban than in rural populations (Fornaciari & Giuffra, 2009: 199–204).
Moving on to other types of lesions, porotic hyperostosis is found more frequently in male (37.5%) than in female individuals (27.59%), while according to age groups it is young adults who manifest the lesion most frequently, with 31.4% compared to middle adults (18.18%) and subadults (13.33%). European groups are the most affected (47.22%), followed by Amerindians (35.29%) and Africans (27.5%). As mentioned above, this lesion is generally associated with nutritional stress processes, including chronic anaemia, although it is also related to environmental factors, parasitosis and other chronic diseases, while in the child population it is more likely to be caused by anaemia (Fornaciari & Giuffra, 2009: 233). However, if we start from the idea that porotic hyperostosis is an indicator of nutritional stress, it can be seen that there is a greater impact in male individuals, suggesting that females were less exposed to the difficult dietary conditions faced by this population, although this does not match that seen previously for the colonial period at Panama Viejo, where an inverse situation is presented (Rojas-Sepúlveda et al., 2011).
The same is true for the age groups, since in the cathedral there is a greater proportion of young adults in relation to middle adults, which is not the case in the rest of the colonial series. This could possibly be due to the survival of individuals who suffered some type of nutritional deprivation during childhood. However, some epidemiological models suggest that the incidence of porotic hyperostosis tends to be high in post-contact populations (Fornaciari & Giuffra, 2009: 233–234), although these models show no specific information on the impact of the lesion according to phenotypic variation. According to the frequencies presented, it apparently affects Europeans in Panamá Viejo Cathedral more, although there are no significant statistical differences with Amerindians or Africans.
It was mentioned above that porotic hyperostosis was related to cribra orbitalia, also associated with nutritional stress processes, and, although the osteological series shows a similar trend when observed by sex and ancestry, this is not the case with the age groups, where young adults present the highest prevalence with 10.47%, followed by middle adults (9.09%), and subadult individuals (6.67%). Again, comparing these groups with each other shows no statistical difference for the cribra orbitalia results.
With regard to traumatic lesions, male individuals are the most affected, with a prevalence of 18.75%, compared to females with 18.39%, while young adults show a higher proportion (17.44%) than middle adults (9.09%) and subadults (6.66%). About prevalence according to phenotypic variation, the difference between groups is relatively low, with predominantly African individuals being the most affected with 15%, followed by Europeans with 13.89% and Amerindians with 11.76%. When compiling the epidemiological models, it must be remembered that traumatology differs according to sex and age, for example, femoral neck fractures will be more frequent in older individuals due to the effects of diseases such as osteoporosis. In paleopathology, the lifestyle of populations in relation to the socioeconomic structure and the historical-cultural context will define the way in which these types of lesions manifest themselves and are studied through what are called "trauma models" (Fornaciari & Giuffra, 2009: 158).
In the case of individuals from Panama Viejo’s cathedral, the traumatological model will be characterised by a very high frequency of cranial fractures (57.14% of the total number of traumas), with evidence also of healing of the lesions, pointing to the individuals surviving these events (Figure 119 and Figure 120). With the exception of two cases, the lesions were characterised as having been caused by blunt weapons, as evinced by the marks left on the cranium, which reproduce the diameter of the impact surface, generally circular or oval in shape. The other wounds recorded in the cranium are due to sharp heavy instruments, as evinced not only by their deep margins but also by the straight edges with evidence of entry and exit points (indicating a sharp weapon) and, most notably, the imprint left behind and the characteristic area of loss (indicating a heavy instrument requiring force to be removed) (Figure 121).
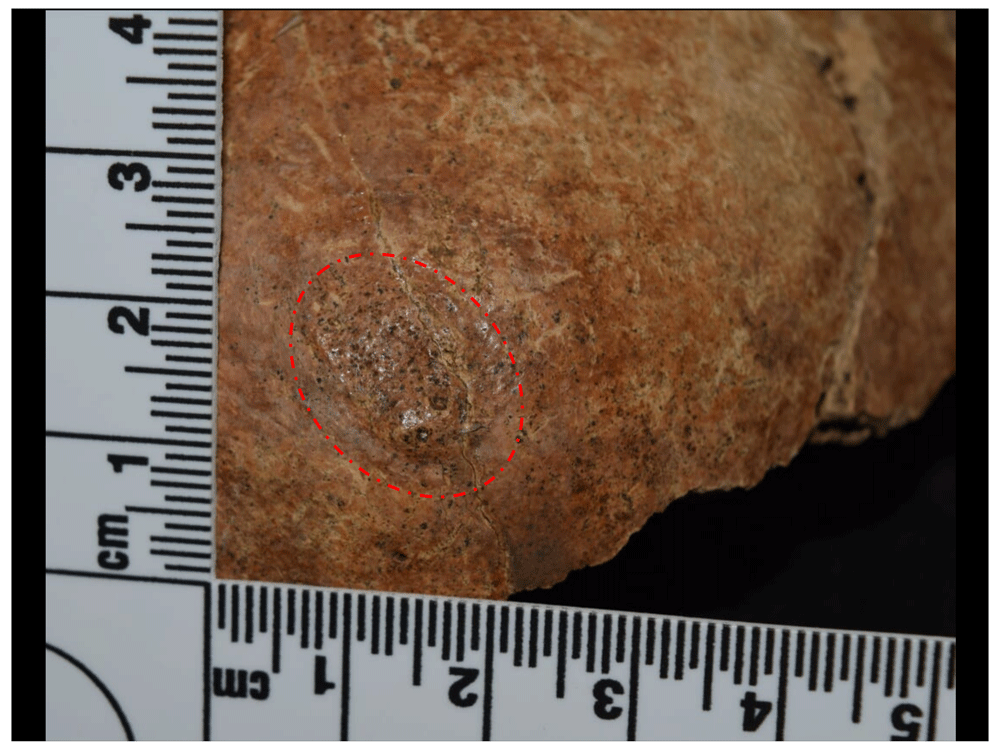
Figure 119. Traumatic oval-shaped lesion in right parietal in 1017.
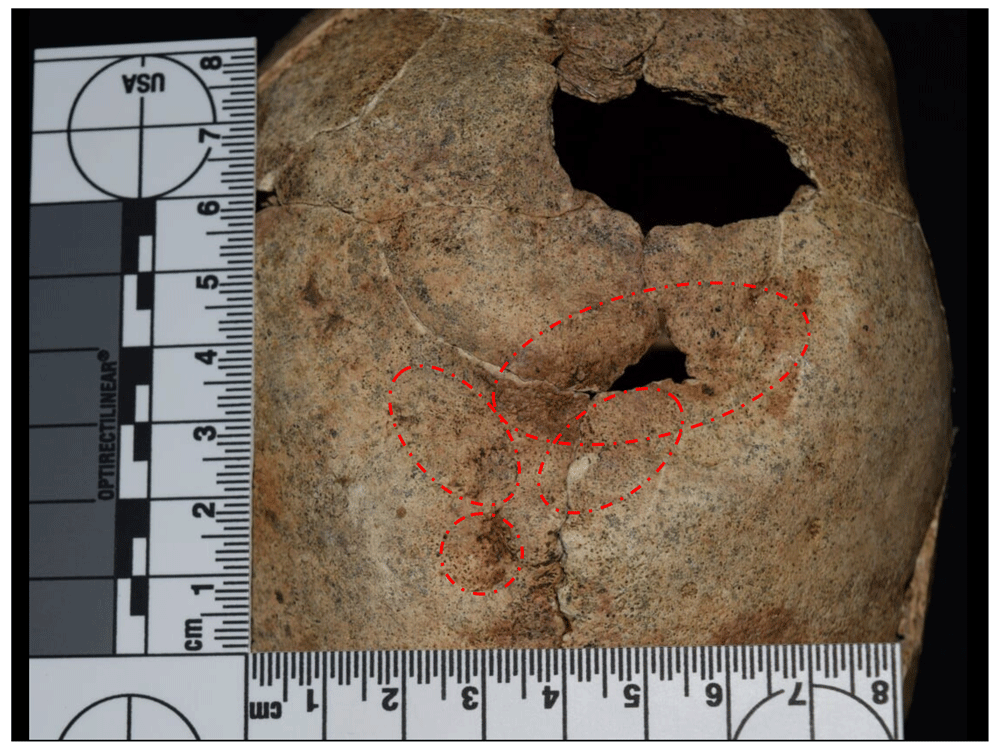
Figure 120. Multiple contusion lesions in parietals of 1059.
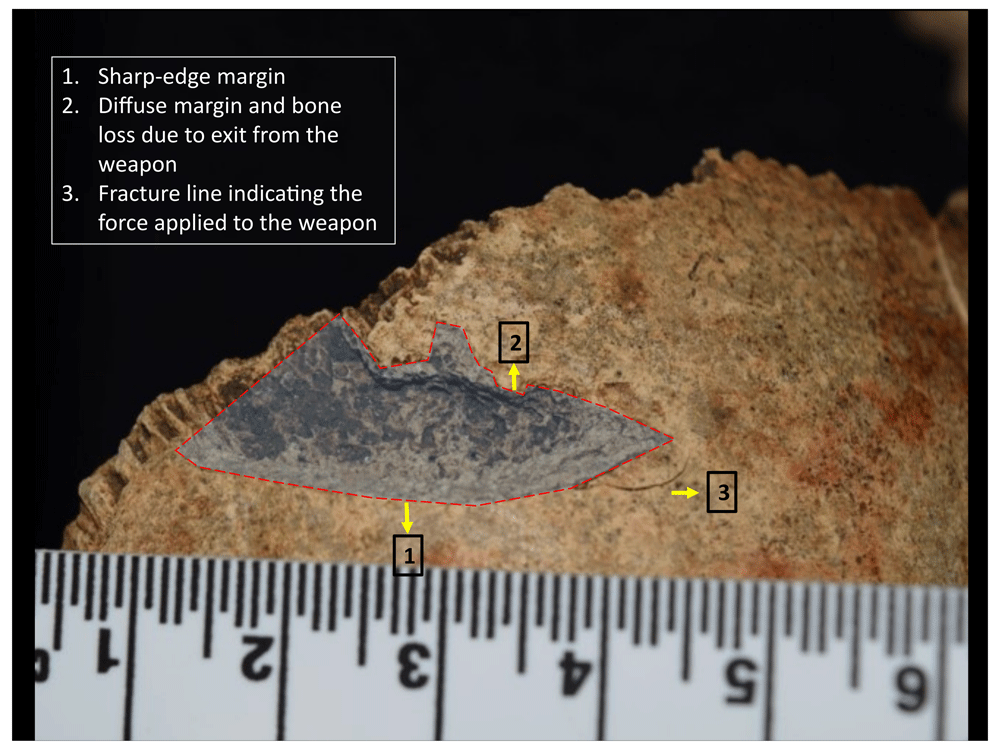
Figure 121. Wound from a short blunt instrument in frontal of 1015.
However, when the data were compared using statistical methods, no significant differences were observed between sex, age, or population affiliation groups, suggesting that all individuals in Panama Viejo were susceptible to some type of traumatic lesion. This is also verified in the multiple scenarios of violence recorded in historical documentation that show the participation of people from a range of sectors (Díaz Ceballos & Rivera-Sandoval, 2020).
Other traumatic lesions in the postcranial skeleton were also recorded, corresponding to 46.42% of the whole sample in this category. Trauma was concentrated basically at the upper (Figure 122 and Figure 123) and lower limb level (Figure 124 and Figure 125), with a prevalence of 14.29% each. These lesions may be related to accidents, particularly given that these are young and middle-aged individuals. However, forearm fractures are characteristic of defensive reactions in which this part of the body is used to protect the face, either in a fall or in a confrontation.
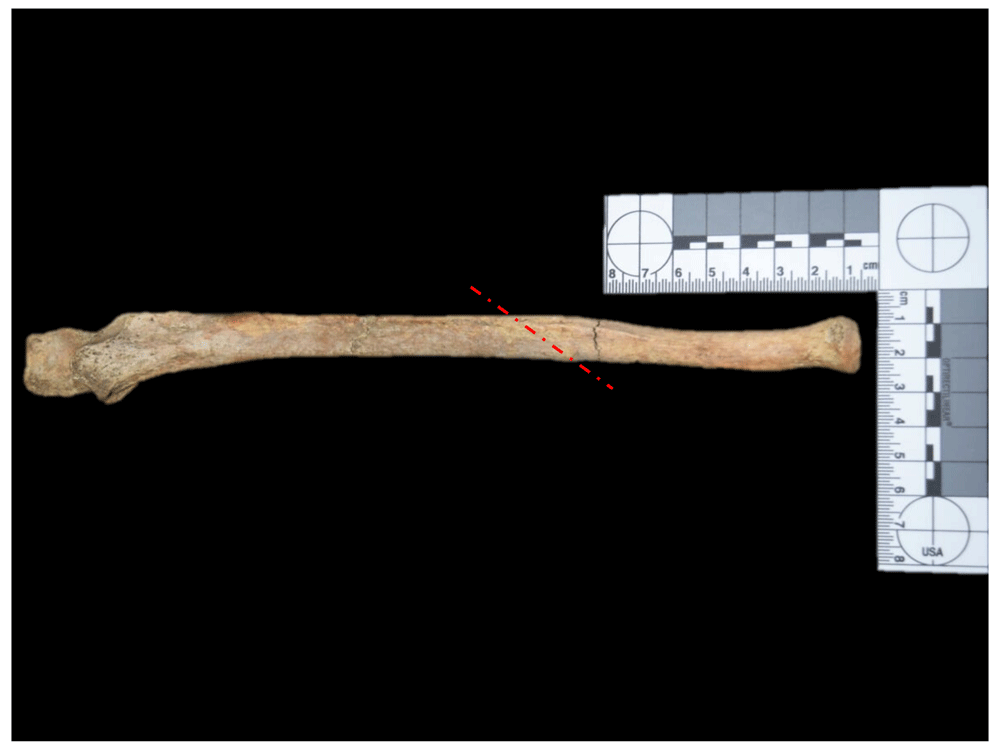
Figure 122. Fracture in distal third of left ulna in 1044.
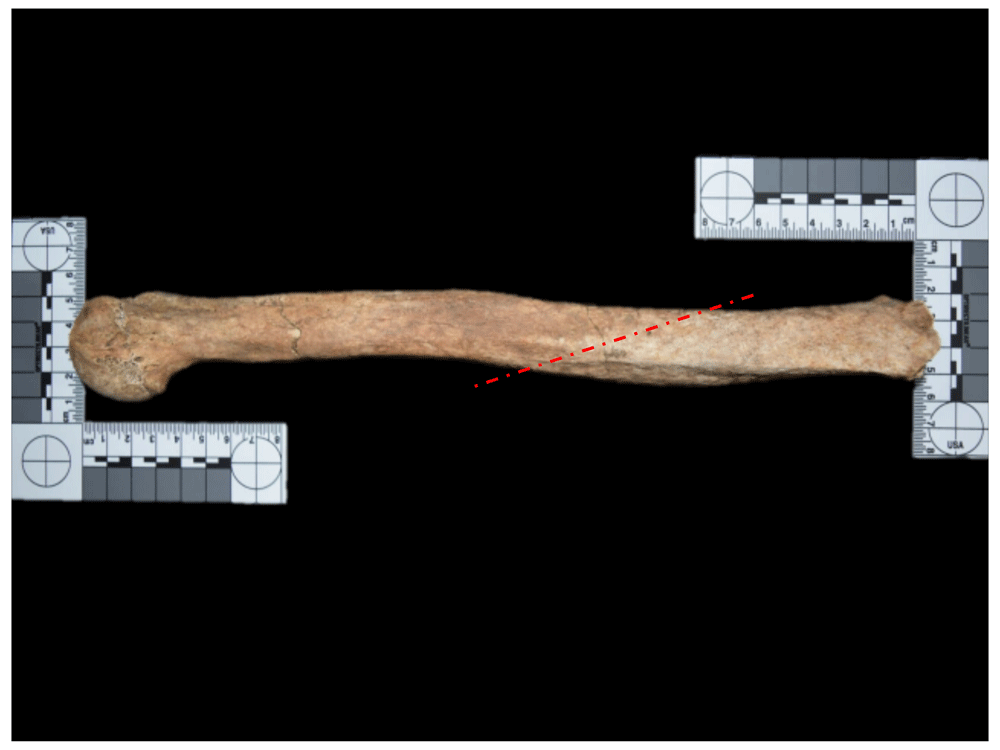
Figure 123. Fracture in distal third of left humerus in 1097.
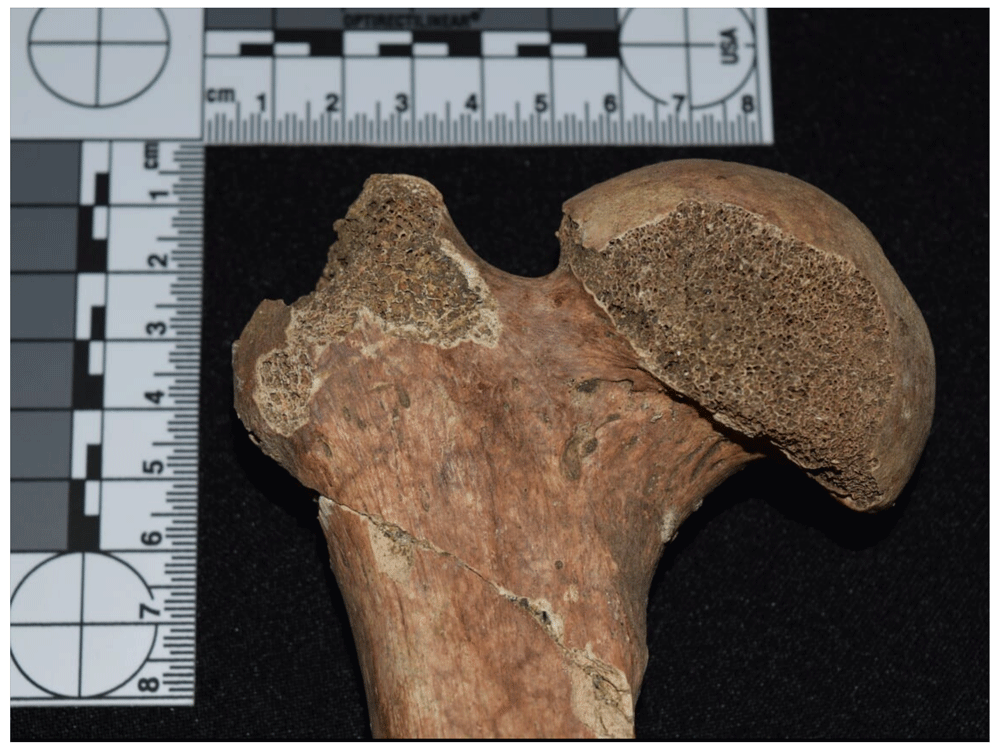
Figure 124. Right femoral neck fracture in 1168.
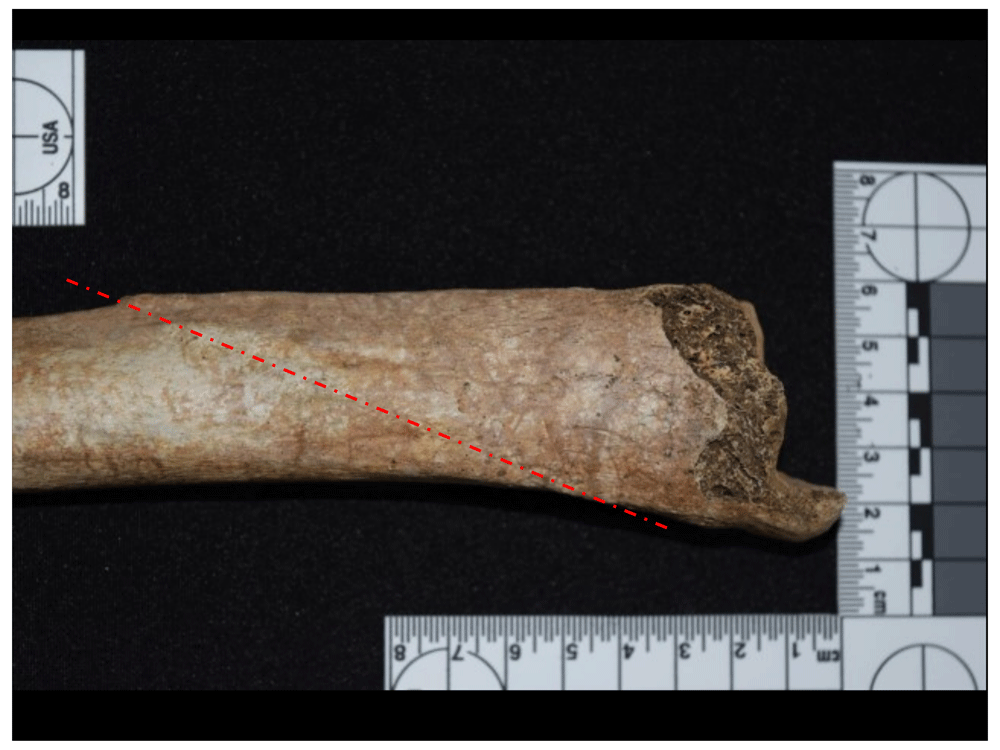
Figure 125. Fracture in distal third of left tibia in 1127.
Associated with traumatic lesions are the cases reported as spondylolysis, which, as mentioned above, is generally related to mechanical stress in the juvenile stage when force is exerted on the lower spine from carrying heavy loads. In the sample, a higher prevalence is observed in men (4.17%) compared to women (2.3%) and reported only in young individuals (4.65%). This fits with the epidemiological models, where generally male individuals are the most impacted (Waldron, 2009), affecting between 4% and 8% of the population, with African populations affected less than European populations (Aufderheide & Rodríguez-Martin, 1998: 63). However, it was only possible to estimate population affiliation in one of the four individuals identified with the lesion in the sample analysed, which in this case had probable African ancestry.
With regard to neoplasms, female individuals present a higher frequency with 12.64%, compared to males with just 4.17%. Moreover, middle adults are the most affected, with 13.64%, compared to young adults (8.14%). In turn, it is the populations of African descent that show the highest number of reported cases with 17.5%, followed by European (8.33%) and Amerindian (5.88%) groups. According to epidemiological models, this type of anomaly has no sex preference and can occur in any age range, although it may be more common after the age of 40, which coincides with that seen in the Cathedral sample.
The other anomalies have a low frequency and representation, meaning it is not advisable to make population-based interpretations in relation to epidemiological models according to sex, age, or ancestry. However, some pertinent comments were made above for lesions such as hyperostosis frontalis interna and heterotopic ossification.
Overall frequency of dental anomalies by sex, age, and ancestry. With regard to anomalies observed in the teeth, it should be considered that all individuals with at least one tooth had some type of lesion or anomalous characteristic to record, especially in the case of adults in any age range, in which the processes of enamel wear are manifested in different stages, meaning the effective percentage is therefore 100%.
However, if we compare the number of individuals who report at least one of the criteria used in dental pathology, we find that 53.61% of the total number of female individuals present anomalies, compared to 46% of males (Table 29).
Table 29. Proportion of individuals by sex with dental anomalies.
| Female | Male | Unobservable /
Unknown sex |
|---|
| N | % Total | % Effec. | N | % Total | % Effec. | N | % Total | % Effec. |
|---|
| Unobservable | 45 | 46.39 | | 27 | 54.00 | | 22 | 78.57 | |
| No anomalies | 0 | 0.00 | 0.00 | 0 | 0.00 | 0.00 | 0 | 0.00 | 0.00 |
| Anomalies | 52 | 53.61 | 100.00 | 23 | 46.00 | 100.00 | 6 | 21.43 | 100.00 |
| Total | 97 | 100.00 | | 50 | 100.00 | | 28 | 100.00 | |
| Total Effective | 52 | 53.61 | 100.00 | 23 | 46.00 | 100.00 | 6 | 21.43 | 100.00 |
Very low frequencies were obtained in subadults when grouping the sample in the different age ranges, meaning these results may be quite skewed, even if the three categories are joined together, leading to there not being enough data to determine a pattern in the presence of anomalies.
For adults, we observe that for the totality of individuals registered as young adults, 67.39% present at least one lesion or anomaly, while middle adults have 50%, and those adults to whom we were unable to assign an age range represent 26.67% (Table 30).
Table 30. Proportion of individuals by age group with dental anomalies.
| Infant I | Infant II | Juvenile |
|---|
| N | % Total | % Effec. | N | % Total | % Effec. | N | % Total | % Effec. |
|---|
| Unobservable | 5 | 100.00 | - | 1 | 25.00 | - | 3 | 42.86 | - |
| No anomalies | 0 | 0.00 | 0.00 | 0 | 0.00 | 0.00 | 0 | 0.00 | 0.00 |
| Anomalies | 0 | 0.00 | 0.00 | 3 | 75.00 | 100.00 | 4 | 57.14 | 100.00 |
| Total | 5 | 100.00 | - | 4 | 100.00 | - | 7 | 100.00 | - |
| Total Effective | 0 | 0.00 | 0.00 | 3 | 75.00 | 100.00 | 4 | 57.14 | 100.00 |
| Young Adult | Middle Adult | Adult |
|---|
| N | % Total | % Effec. | N | % Total | % Effec. | N | % Total | % Effec. |
|---|
| Unobservable | 30 | 32.61 | - | 11 | 50.00 | - | 33 | 73.33 | - |
| No anomalies | 0 | 0.00 | 0.00 | 0 | 0.00 | 0.00 | 0 | 0.00 | 0.00 |
| Anomalies | 62 | 67.39 | 100.00 | 11 | 50.00 | 110.00 | 12 | 26.67 | 100.00 |
| Total | 92 | 100.00 | - | 22 | 100.00 | - | 45 | 100.00 | - |
| Total Effective | 62 | 67.39 | 100.00 | 11 | 50.00 | 110.00 | 12 | 26.67 | 100.00 |
Finally, the cathedral sample was organised by population groups in order to verify the frequency of cases reported within each of the groups, with African and predominantly African individuals having the highest proportion (80.49% of individuals with the presence of lesions or dental anomalies). Europeans, in contrast, show 73.68% and Amerindians 70.59% (Table 31).
Table 31. Proportion of individuals by ancestry group with dental anomalies.
| European and
predominantly European | Amerindian and
predominantly
Amerindian |
|---|
| N | % Total | % Effec. | N | % Total | % Effec. |
|---|
| Unobservable | 10 | 26.32 | - | 5 | 29.41 | - |
| No anomalies | 0 | 0.00 | 0.00 | 0 | 0.00 | 0.00 |
| Anomalies | 28 | 73.68 | 100.00 | 12 | 70.59 | 100.00 |
| Total | 38 | 100.00 | - | 17 | 100.00 | - |
| Total Effective | 28 | 73.68 | 100.00 | 12 | 70.59 | 100.00 |
| African and predominantly
African | Unobservable |
|---|
| N | % Total | % Effec. | N | % Total | % Effec. |
|---|
| Unobservable | 8 | 19.51 | - | 71 | 89.87 | - |
| No anomalies | 0 | 0.00 | 0.00 | 0 | 0.00 | 0.00 |
| Anomalies | 33 | 80.49 | 100.00 | 8 | 10.13 | 100.00 |
| Total | 41 | 100.00 | - | 79 | 100.00 | - |
| Total Effective | 33 | 80.49 | 100.00 | 8 | 10.13 | 100.00 |
Specific frequency of dental anomalies by sex, age and ancestry. Analysing the specific prevalence of dental lesions in Panama Viejo’s Cathedral sample according to sex, age and ancestry allowed us to contrast them with some of the epidemiological models proposed to interpret the incidence of oral diseases in past populations, thus giving us an insight into the lifestyles of Panamanians in the 16th and 17th centuries (Table 32 to Table 34 and Figure 126 to Figure 128).
Table 32. Prevalence of dental lesions in individuals grouped by sex.
| Anomaly or lesion | Female | Male | Unobservable /
Unknown sex |
|---|
| N | % Effective | N | % Effective | N | % Effective |
|---|
| Caries | 32 | 61.54 | 15 | 65.22 | 0 | 0.00 |
| Calculus | 52 | 100.00 | 21 | 91.30 | 4 | 66.67 |
| Masticatory wear | 52 | 100.00 | 23 | 100.00 | 3 | 50.00 |
| Enamel defects | 10 | 19.23 | 6 | 26.09 | 2 | 33.33 |
| Abscess | 2 | 3.85 | 0 | 0.00 | 1 | 16.67 |
| Alveolar retraction | 31 | 59.62 | 12 | 52.17 | 1 | 16.67 |
| Chipping | 27 | 51.92 | 13 | 56.52 | 2 | 33.33 |
| Cultural modification | 6 | 11.54 | 3 | 13.04 | 1 | 16.67 |
| Hypercementosis | 1 | 1.92 | 1 | 4.35 | 1 | 16.67 |
Table 33. Prevalence of dental lesions by age group.
| Anomaly or lesion | No Adult | Young Adult | Middle Adult | Adult | Anomaly or lesion |
|---|
| N | % Effec | N | % Effec | N | % Effec | N | % Effec | N | % Effec |
|---|
| Caries | 2 | 28.57 | 33 | 53.23 | 11 | 100.00 | 1 | 8.33 | 2 | 28.57 |
| Calculus | 4 | 57.14 | 60 | 96.77 | 10 | 90.91 | 3 | 25.00 | 4 | 57.14 |
| Masticatory wear | 4 | 57.14 | 62 | 100.00 | 10 | 90.91 | 3 | 25.00 | 4 | 57.14 |
| Enamel defects | 3 | 42.86 | 14 | 22.58 | 0 | 0.00 | 1 | 8.33 | 3 | 42.86 |
| Abscess | 0 | 0.00 | 3 | 4.84 | 0 | 0.00 | 0 | 0.00 | 0 | 0.00 |
| Alveolar retraction | 0 | 0.00 | 36 | 58.06 | 8 | 72.73 | 0 | 0.00 | 0 | 0.00 |
| Chipping | 2 | 28.57 | 32 | 51.61 | 8 | 72.73 | 0 | 0.00 | 2 | 28.57 |
| Cultural modification | 0 | 0.00 | 7 | 11.29 | 3 | 27.27 | 0 | 0.00 | 0 | 0.00 |
| Hypercementosis | 0 | 0.00 | 1 | 1.61 | 1 | 9.09 | 1 | 8.33 | 0 | 0.00 |
Table 34. Prevalence of dental lesions in individuals grouped by ancestry.
| Anomaly or lesion | European and
predominantly
European | Amerindian and
predominantly
Amerindian | African and
predominantly
African | Unobservable |
|---|
| N | % Effec | N | % Effec | | N | % Effec | N |
|---|
| Caries | 17 | 60.71 | 7 | 58.33 | 18 | 54.55 | 5 | 62.50 |
| Calculus | 26 | 92.86 | 11 | 91.67 | 31 | 93.94 | 9 | 112.50 |
| Masticatory wear | 27 | 96.43 | 12 | 100.00 | 32 | 96.97 | 8 | 100.00 |
| Enamel defects | 6 | 21.43 | 3 | 25.00 | 6 | 18.18 | 3 | 37.50 |
| Abscess | 2 | 7.14 | 0 | 0.00 | 0 | 0.00 | 1 | 12.50 |
| Alveolar retraction | 18 | 64.29 | 7 | 58.33 | 19 | 57.58 | 0 | 0.00 |
| Chipping | 21 | 75.00 | 5 | 41.67 | 16 | 48.48 | 0 | 0.00 |
| Cultural modification | 4 | 14.29 | 0 | 0.00 | 6 | 18.18 | 0 | 0.00 |
| Hypercementosis | 2 | 7.14 | 0 | 0.00 | 1 | 3.03 | 0 | 0.00 |
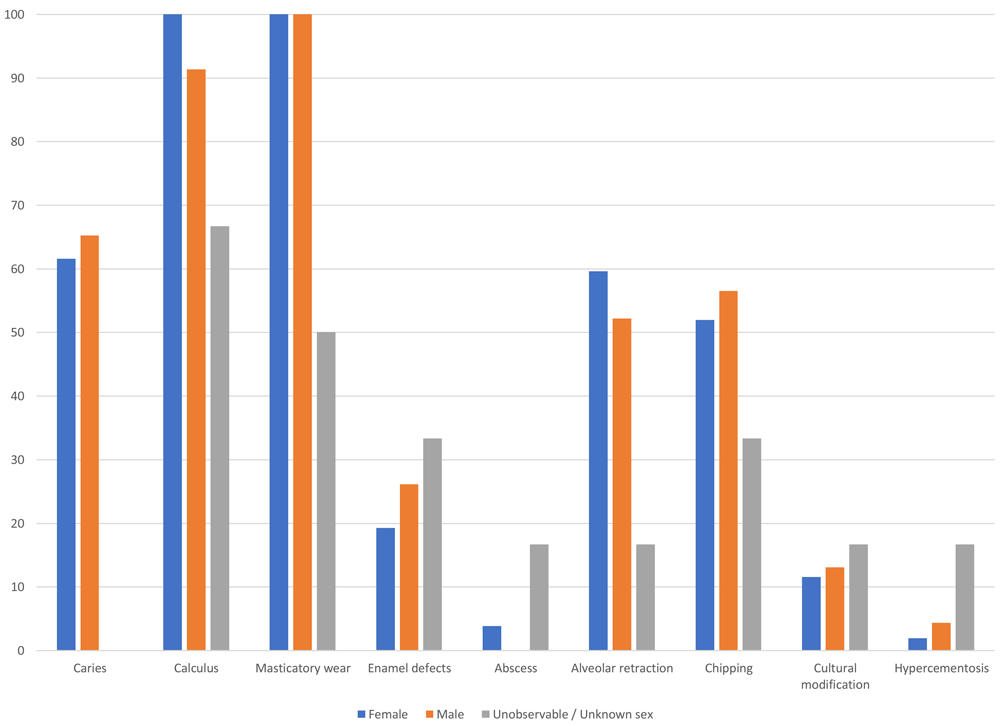
Figure 126. Prevalence of dental lesions in individuals grouped by sex.
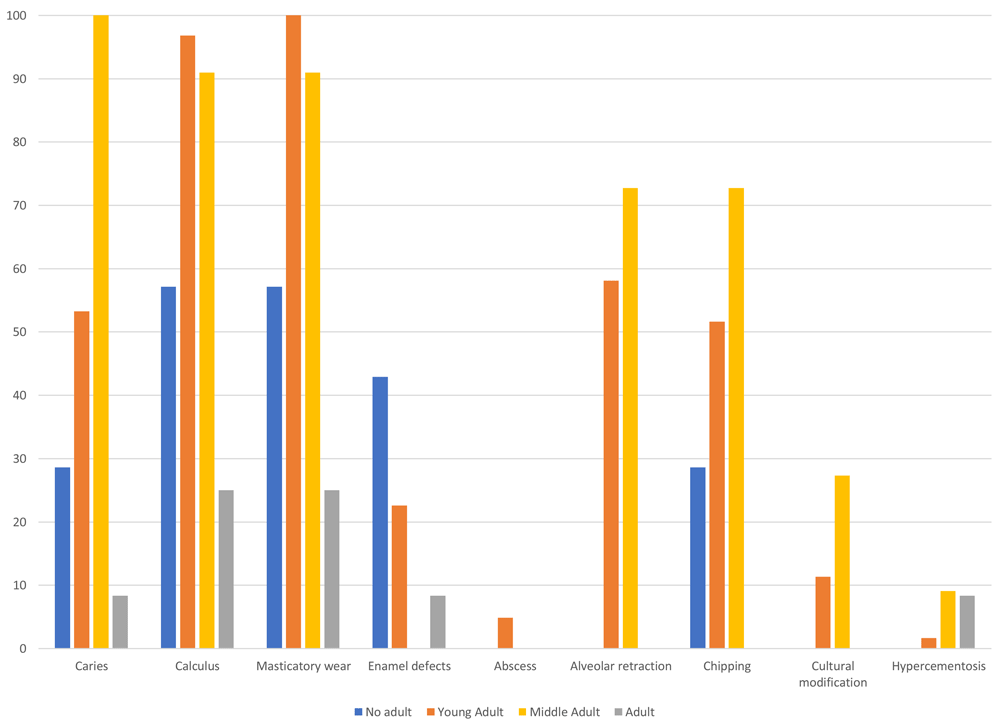
Figure 127. Prevalence of dental lesions by age group.
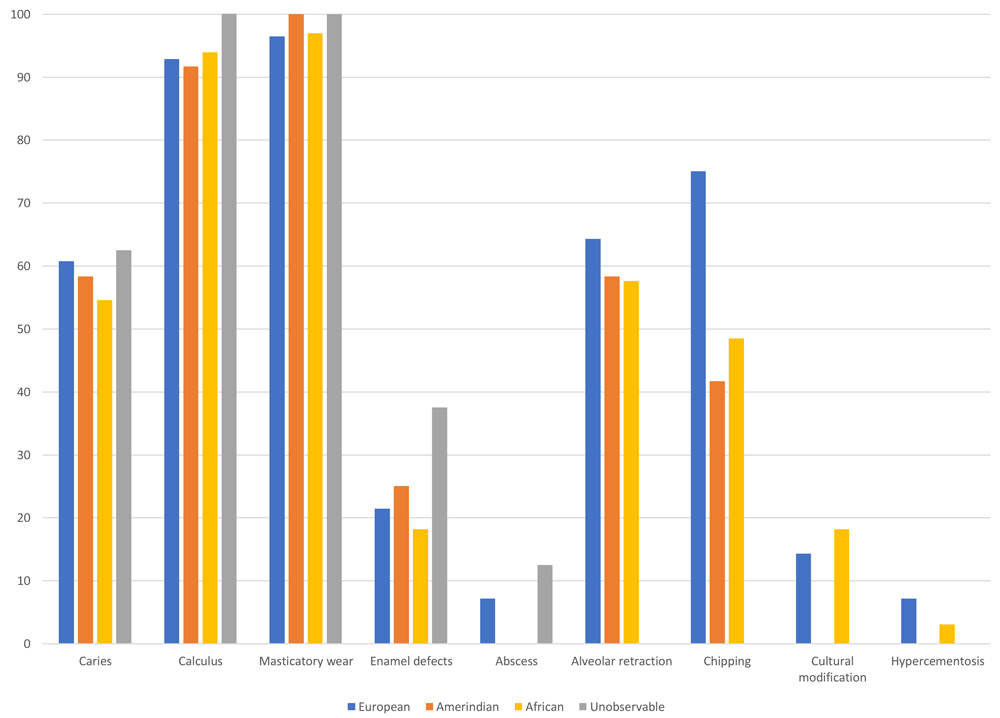
Figure 128. Prevalence of dental lesions in individuals grouped by ancestry.
Initially, it is striking that caries, as one of the most frequent lesions in teeth, affects men and women in a similar way, with a prevalence of 61.64% and 65.22%, respectively, which suggests similar exposure to the factors that cause the lesion. Furthermore, this differs from that previously reported for the colonial series of Panama Viejo, in which males showed a much lower trend (Martín et al., 2007).
Furthermore, the high frequency rate of caries in the population analysed is considerable, which may be associated with the increase in carbohydrates in the diet. In the paleopathological literature, the increase in these lesions is associated with populations moving to an agricultural model, for example, in America with the adoption of maize, and in Europe with the incorporation of starch-rich cereals (Fornaciari & Giuffra, 2009; Larsen, 2015). Another food that began to be introduced more frequently from the 16th century onwards was sugar, which consequently led to an increase in dental decay.
Epidemiological models indicate that women are the more affected by caries than men, arguing differences in the type of diet between genders, where it is assumed that males have access to meat protein and female individuals to vegetables and carbohydrates (Larsen, 2015: 74). However, this situation does not seem to match that described in the documentary sources in Panamá, since meat costs were relatively low, and this type of protein was relatively easy to obtain (Castillero Calvo, 2006).
With regard to age, the prevalence of caries is much more evident in middle adults, showing 100% in individuals with some dental lesion, compared to young adults (53.23%) and subadults (28.57%), which would imply the accumulation of these ailments as the individual ages, leading to problems such as periodontal disease, abscesses and loss of teeth.
Caries have also been associated with differences in social status and access to certain foods incorporated into diet, with the more privileged classes consuming much more protein and, therefore, showing a lower frequency of these lesions (Larsen, 2015: 77). However, when comparing the data in each of the three ancestry groups in Panamá Viejo, there is a relative similarity in the prevalence of caries, where the most affected are Europeans with 60.71%, followed closely by Amerindians with 58.33% and, finally, Africans with 54.55%. This situation suggests similar conditions in the type of foods that were being consumed in the city, with significant intake of carbohydrates and probably with a strong influence of maize. It is suggested that one of the most important new productions in Panamá was rice, a cereal that adapted well to the climatic and environmental conditions of the isthmus, as indicated in a 1614 document transcribed by Lucena Salmoral (2005: 158), in which he speaks of groups of slaves who sowed maize, rice and other pulses in Chepo and Chimán, which were then traded with people of different ethnic origins. However, in a bioarchaeological context, rice-consuming Asian populations show a relatively low prevalence of caries compared to groups that base their diet on maize, suggesting the low cariogenic power of rice (Larsen, 2015: 71). However, the data obtained from analysis of starches in the dental calculus and in the stable isotopy will allow us to determine this population's diet in greater detail (Martín et al., forthcoming).
Associated with these lesions, it can be observed that wear occurs with a prevalence of 100% in women and men, again clarifying that different degrees of wear of the occlusal surface of the teeth were recorded. This situation is equally evident in young adults and, to a lesser extent, in middle adults, with a prevalence of 90.91%. It is also striking that in the non-adult population, wear is registered in 57.14% of individuals who register some form of dental anomaly. With regard to population variation, in the African and Amerindian groups there is a prevalence of 100%, while in Europeans this reaches 96.43%. These high figures may be caused by hard diets that required the masticatory apparatus to be used in order to process food; in this sense, carbohydrates are again related to this type of evidence of mastication, although it is important to distinguish to what extent the wear is manifested in each individual.
Diet can also be tracked through dental calculus, which also shows a significant influence due to carbohydrate intake. In the sample, it was possible to identify different degrees of development with an effective prevalence of 100% of female individuals and 91.3% of males, which still suggests a similar degree of wear and a type of diet that did not distinguish between men and women. Moreover, it was possible to register dental calculus in 96.77% of young adults, 90.91% of middle adults, and 57.14% of subadults; this difference is probably related to the ageing processes this sector of the population would surely have suffered, in addition to poor oral hygiene, further causing the development of calculus. When observing population affiliation, 93.94% of African individuals present some degree of calculus severity, followed by Europeans with 92.86% and Amerindians with 91.67%, showing the same trend of wear and caries in which there is no significant difference between the groups.
With regard to evidence of periodontal disease, particularly in terms of alveolar retraction, women show a higher prevalence than men, with 59.62% and 52.17%, respectively. The epidemiological models do not show a consistent pattern regarding sex differences, although some data show an increased risk in men (Larsen, 2015: 83). However, it should be remembered that these lesions are due to multiple factors and specific sociocultural behavioural patterns in human populations. For example, it is reported that the prevalence of periodontal disease in women is higher than in men for those indigenous groups in South America that were in contact with Western populations (Larsen, 2015: 83), a situation that coincides with the sample from Panamá Viejo, where it is almost certainly associated with the processes of adapting to a new lifestyle and a new way of producing food.
Observing this criterion in the population affiliation groups, the population with European traits is the most affected, with 64.29%, while Amerindians have 58.33% and Africans 57.58%. Prevalence of periodontal disease also increases with the complexity of social organisation and the economic system in societies, with high numbers occurring in agricultural and industrialised groups (Larsen, 2015: 81). Moreover, the trend increases with age, a situation that is clearly evident in the sample analysed, where medium adults have a prevalence of 72.73%, compared to 58.06% in young adults.
These cumulative processes associated with age are also reflected in enamel fractures or chipping, where middle adults have 72.73%, compared to 51.61% in young adults and 28.57% in subadults. Remembering that this lesion can be multifactorial, including aspects related to hard diets, it is again likely that the carbohydrates incorporated in the diet of Panamanians of the 16th and 17th centuries influenced the frequency of these dental fractures. However, a slight difference is observed when comparing the data recorded for men and women, with 56.52% and 51.92%, respectively, while for ancestry groups it is Europeans who show a higher rate of lesions of this type (75%) than Africans (48.48%) and Amerindians (41.67%). These data may be due to other types of environmental, cultural, and dietary conditions that led to enamel fractures, although it is difficult to identify their causes.
Another indicator of the state of health of populations is enamel defects, since they are associated with nutritional stress events in the odontogenesis stages of individuals, affecting subadult individuals. The highest frequency of the lesion in the sample corresponds precisely to this group, together with young adults, with 42.86% and 22.58%, respectively. With regard to differences based on sex, a prevalence of 26.09% is observed in men, while women have a prevalence of 19.23%. Moreover, phenotypic variation shows slight differences between each of the three main groups, with Amerindians reaching a prevalence of 25%, Europeans 21.43%, and Africans 18.18%. This situation suggests a relatively symmetrical incidence throughout the population, which is also consistent with that described for nutritional stress bone indicators and other dental anomalies associated with dietary patterns.
Finally, the lesions related to abscesses, hypercementosis and cultural modifications do not provide sufficient data to sustain a paleodemographic discussion. However, it is important to consider some of the observations made above from a population perspective, particularly in the case of cultural modifications, since at least three types of alteration were found, of which dental sharpening is associated only with populations of African origin (Smith-Guzmán et al., 2020).