Introduction
Broadband amplifiers with quantum-limited noise performance and low power consumption are crucial for applications involving ultra-sensitive cryogenic detection systems such as astronomical receivers1–3, axion dark matter search experiments4–6, and quantum computation7–9. Kinetic inductance travelling-wave parametric amplifiers (KITWPAs)10–14 are quantum devices, which can achieve high gain over broad bandwidth by efficiently transferring power from a strong ‘pump’ wave to a weak ‘signal’ wave via the wave mixing mechanisms in a non-linear medium comprising a high kinetic inductance wire. They are typically realised as long superconducting transmission lines, which are fabricated using films with high normal-state resistivity. They have been experimentally verified to exhibit near quantum-limited noise performance15 with negligible heat dissipation, whilst their ease of fabrication compared to the Josephson junction based TWPA makes them readily scalable to arrays for large pixel count applications e.g., readout of large astronomical detector arrays and practical large scale quantum computation platforms.
The vast majority of KITWPAs reported in the literature are fabricated using niobium titanium nitride (NbTiN) films, however, in principle, a KITWPA can be fabricated from any superconducting film provided that it possesses the necessary high kinetic inductance and low loss characteristics16. In this paper, we experimentally characterise the performance of KITWPAs fabricated from titanium nitride (TiN) films. TiN films have found applications in superconducting micro-resonator detectors e.g., microwave kinetic inductance detectors (MKIDs)17, due to their high kinetic inductance, controllable critical temperature (Tc) and physical robustness18. They have additionally been shown to display low-loss behaviour comparable to other superconducting films19. Despite this, NbTiN films remains a popular choice for KITWPA fabrication due to their high Tc, making them better suited for applications at higher bath temperatures and higher frequency ranges, such as the readout or pre-amplification of millimetre (mm) heterodyne receivers.
A plethora of microwave applications at sub-Kelvin temperatures remain, however, such as the readout of astronomical bolometric receivers and first-stage sensors for axion search experiments, and in some of these cases, the high pump power required for driving a NbTiN-KITWPA may affect the overall system sensitivity. We, therefore, intend to explore the use of lower Tc TiN films for such applications and investigate whether there are additional advantages and/or limitations compared to the more conventional NbTiN films. Of particular interest, is whether such TiN KITWPA technology holds the potential to be directly integrated with front-end detectors fabricated with the same material, such as an array of TiN-based MKIDs17.
Methods
Previous investigations20,21 have demonstrated that TiN films display the necessary non-linear behaviour required for wave mixing and, hence, potentially parametric amplification. In this paper, therefore, we proceed with the design and characterisation of full KITWPA devices. Figure 1(a) shows a Computer Aided Design (CAD) image of our TiN-KITWPA, which has been designed using the methodology presented in 16. The device comprises a 42 cm long coplanar waveguide (CPW) transmission line containing 300 unit cells patterned onto a 22 mm by 22 mm chip. Figure 1(b) shows a zoom-in of a section of the CAD image, highlighting the spacing of 175 µm between adjacent lines, and the periodic loading structure. The 100 nm thin TiN transmission line coupled with capacitive stubs (or fingers) has a nominal characteristic impedance of 50 Ω with perturbations to the impedance made every 460 µm with lengths of 48 µm. Most of the perturbations have a characteristic impedance of 60 Ω to create a large band gap near 20 GHz and integer multiples thereof. Every third loading has a characteristic impedance of 70 Ω to create a sub-band-gaps near 6.66 GHz and integer multiples thereof. Figure 1(c) shows a zoom-in of one of the 50 Ω sections of the transmission line, which has a centre-strip width of 2 µm, a gap width of 2 µm, and a finger length of 71 µm. The device dimensions are summarised in Table 1.
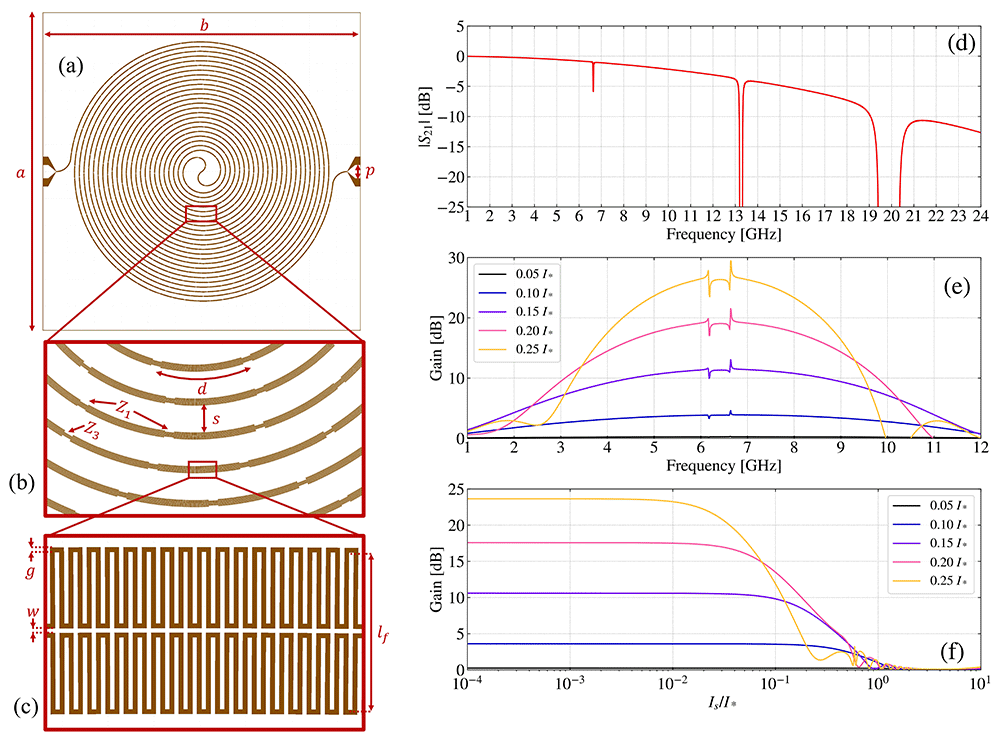
Figure 1. Design layout of the 100 nm TiN KITWPA chip.
(a) CAD image of the full KITWPA device, including bonding pads. (b) Zoom-in of double-spiral winding structure, highlighting the spacing between the spiral arms and the positions of the periodic loadings. (c) Zoom-in of the 50 Ω section, highlighting the fishbone structure of the transmission line. The brown regions indicate the areas where the TiN film has been etched away. (d) Simulated transmission profile of the device. (e) Examples of simulated gain profiles at different pump powers. (f) Compression points predicted for the device at different pump powers. Full chip details reported in 23.
Table 1. Physical dimensions of the TiN CPW KITWPA devices described in this paper.
| Parameter | Symbol | Unit | Value |
|---|
| Chip Width | a | mm | 22 |
| Chip Length | b | mm | 22 |
| Bond Pad Width | p | µm | 960 |
| Periodic Loading Separation | d | µm | 460 |
| Spiral Arm Separation | s | µm | 175 |
| Main Line Impedance | Z0 | Ω | 50 |
| Primary Loading Impedance | Z1 | Ω | 60 |
| Third Loading Impedance | Z3 | Ω | 70 |
| Centre-Strip Width | w | µm | 2 |
| CPW Gap Width | g | µm | 2 |
| Finger Length | lf | µm | 71 |
The TiN-KITWPA devices were fabricated in the clean-room facilities at the Observatoire de Paris using standard sputter deposition, photolithography, and lift-off techniques, which have previously been described in 17,22. The TiN films are reactively sputtered onto a 2-inch diameter substrate made from either high resistivity (>15 kΩ cm), <100>-oriented silicon or 99.999% high-purity, c-plane mono-crystalline sapphire, each with a thickness of 500 µm. Typically, the deposition of the film is done using a 99.995% titanium target with a nitrogen (N2) flow rate of 5.2 sccm and an argon (Ar) flow rate of 50 sccm at a total pressure of 0.6 Pa with 700 W DC power. Nevertheless, the flexibility to tune the sputtering process parameters allows us to optimise and fine-tune the desired properties of the film. The films produced for our KITWPA devices have target parameters of ρN = 140 µΩ cm, Tc = 4.39 K, and a film thickness of t = 100 nm.
Figure 1(d) shows the simulated S21 transmission profile, highlighting the first three band gaps, which are created by the periodic impedance perturbation sections described earlier. Figure 1(e) shows the simulated gain-bandwidth profile for different pump current (Ip) values for fp = 6.41 GHz, and Figure 1(f) shows the gain as a function of input signal current for different Ip values for fp = 6.41 GHz and fs = 5 GHz. The gain performance of the KITWPA design has been calculated by numerically solving the coupled-mode equations (CMEs) in a degenerated pump four wave mixing regime, as described in 16.
Experimental setup
The fabricated KITWPA samples are mounted in a gold-plated copper sample holder and are wire bonded to a copper-clad grounded CPW line etched into a 0.51 mm thick Rogers Duroid® RO4350B printed circuit board (PCB), which is connected to the required SubMiniature version A (SMA) interfaces for connection to the external circuitry. The sample holders are then mounted to the mixing stage of a Bluefors® LD250 dilution refrigerator (DR), which cools the devices down to ~10 mK.
Figure 2 shows a schematic of the cryogenic experimental setup used to characterise the KITWPA devices. The setup comprises an Anritsu® Vector-Star MS4644B vector network analyser (VNA) used to provide a swept-frequency signal tone. The pump tone is provided by an Anritsu® Rubidium MG36241A signal generator (SG), which is coupled to the signal tone via a room temperature RF-Lambda® RFDC5M18G10 directional coupler. After warm attenuation, the combined signal/pump tones are injected into the DUT (device-under-test) anchored at the 10 mK stage of the DR. The output signal from the DUT is then routed back to the VNA via a series of low-loss radio frequency (RF) coaxial lines. A DC current can also be provided by a Keithley® 6221 programmable current source and injected along the length of the transmission line using a pair of Sematron® 8810SMF2-26 cryogenic bias tees to operate the DUT in the 3WM operation mode. Additionally, a pair of Radiall® R591762600 6-way actuator-operated coaxial switches at the cryogenic stage are utilised to switch between multiple DUTs and a through line, to allow for in-situ cryogenic calibration. A Keithley® 2182A nanovoltmeter is used to measure the voltage across the KITWPA devices, when needed.
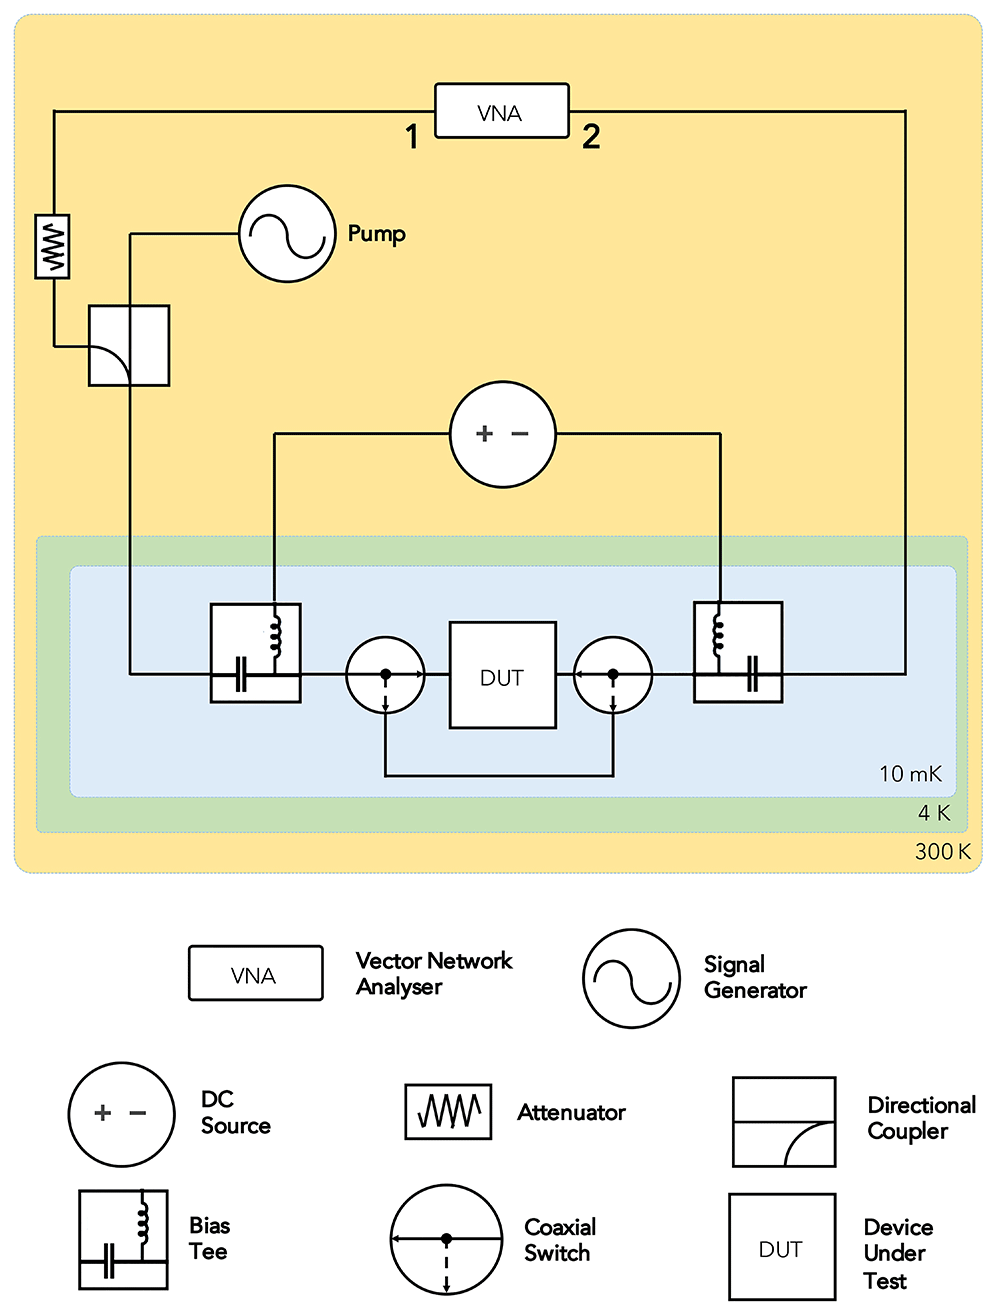
Figure 2. Schematic of cryogenic experimental setup used to characterise the KITWPA devices.
Results
Summary of the fabricated batches
We have fabricated seven different batches of TiN KITWPA devices in total, with each batch containing five KITWPA devices. The key properties of each batch are summarised in Table 2.
Table 2. Summary of the fabricated TiN CPW KITWPA batches, where ρN,Measured is the measured normal-state resistivity of the film, tMeasured is the measured thickness of the film, ZRecalculated is the recalculated characteristic impedance of the transmission line, and nloss is the surface resistance correction factor.
| Batch | Substrate | ρN,Measured (µΩ cm) | No. Surviving (/5) | tMeasured (nm) | ZRecalculated (Ω) | nloss (%) |
|---|
| 1 | Sapphire | - | 0 | 97 | - | - |
| 2 | Sapphire | - | 0 | 97 | - | - |
| 3 | Sapphire | 380 | 1 | 96 | 85 | 5 |
| 4 | Sapphire | 380 | 2 | 106 | 81 | 5 |
| 5 | Sapphire | 200 | 2 | 106 | 63 | 10 |
| 6a | Sapphire | 120 | 1 | 95 | 55 | 50 |
| 6b | Silicon | 120 | 1 | 95 | 51 | 40 |
Unfortunately, the first two batches did not result in any useful devices, as the long transmission lines were either open- (see example in Figure 3(a)) or short-circuited (see Figure 3(b)). A detailed examination of the fabrication process found that the wavelength of the UV light used in the photo-lithography process (365 nm) was too long, leading to poorly-defined line edges. For long and narrow transmission line structures, such as the devices presented here, a shorter wavelength of 320 nm is more appropriate. The adoption of this shorter wavelength for subsequent batches led to a fabrication yield of 20–40%, which whilst still low, is sufficient to characterise the KITWPA devices.
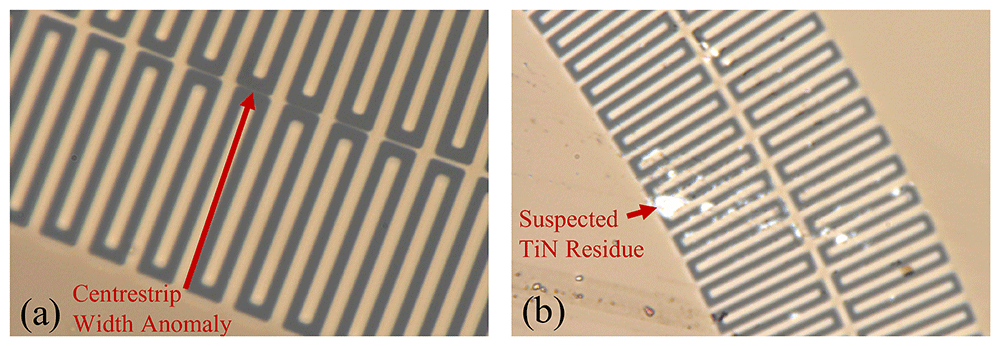
Figure 3.
(a) Possible hotspot/open-circuit in transmission line. (b) Possible short-circuit in transmission line, with the white debris likely to be residual TiN not successfully etched away. Gold coloured areas highlight the regions were the TiN film is deposited.
The KITWPA shown in Figure 1 was designed and simulated using an assumed film resistivity of ρN = 140 µΩ cm, however, subsequent measurements of the film resistivity of each batch using a four-point probe revealed a considerable variation in ρN between each batch. This variation is shown in Table 2, highlighting how ρN for batches 3 and 4 deviates from the design value by a factor of over 2.5. Whilst the reason for this resistivity variation is not completely clear at the moment, one possible reason could be due to erosion of the Ti target used in the sputtering process, which could lead to drifts in the fabrication parameters used when sputtering TiN films24. In subsequent batches, we managed to achieve ρN values closer to the design value by reducing the pressure in the sputtering machine from 0.6 Pa to 0.4 Pa. The first five batches were fabricated using sapphire substrates, however, to investigate the effect that the substrate material may have on the performance of the TiN KITWPA, we additionally fabricated a batch on silicon during our sixth fabrication run, where batch 6a denotes a sapphire substrate and 6b denotes a silicon substrate.
Figure 4 shows the un-pumped transmission spectrum for a single device from each batch (except batch 2), where the raw data is shown in light grey and the smoothed (averaged every 100 data points) data is shown in orange. The transmission spectrum for the batch 1 chip is included to show the transmission of a device with defects such as those highlighted in Figure 3. For the devices that are not short- or open-circuited, we see that the ‘envelope’ of the transmission spectra are closer to 0 dB, plus we also observe the presence of periodic band gaps. The positions of the band gaps, however, are different to those simulated in Figure 1(d), which can be explained by the deviation in ρN and film thickness from the simulated parameters. This variation additionally means that the characteristic impedance of each transmission line would have deviated from the 50 Ω design value, causing an impedance mismatch at the two ends of the KITWPA. This is evident from the ripples in the raw transmission spectra in Figure 4, which are largest for batches 3 and 4 since they have the largest deviation in measured resistivity from Table 2, hence the largest mismatch to 50 Ω.
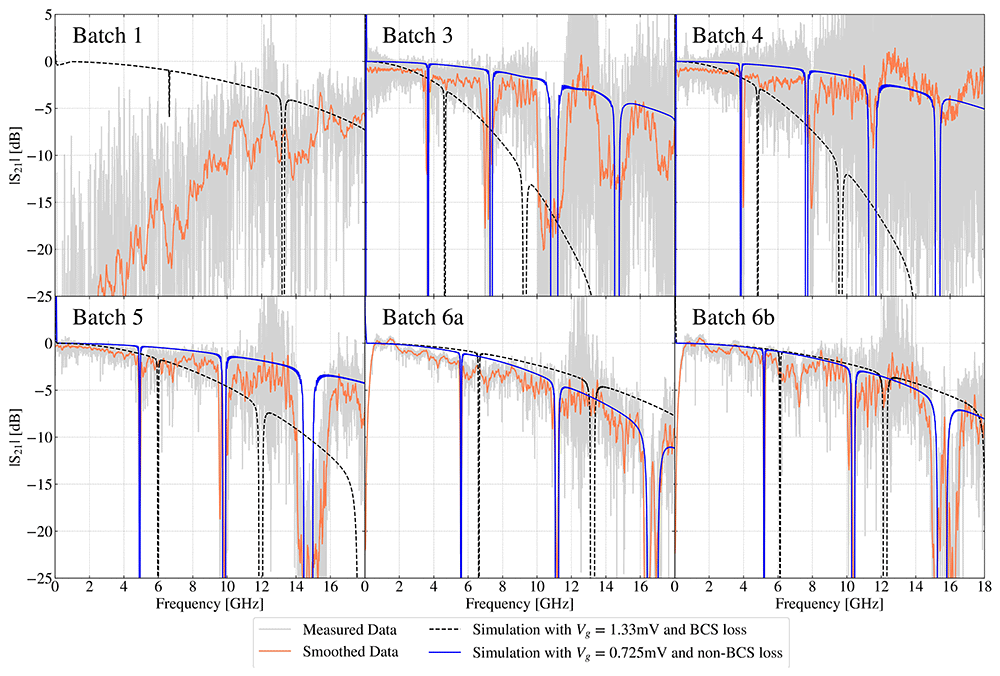
Figure 4. Un-pumped transmission profile of KITWPA devices from different fabrication batches as summarised in Table 2.
The simulated transmission curves for each batch were calculated using the methodology in 16. For Batch 5, 6a & 6b, the measured first band gap may not be clearly visible as it coincides exactly with the simulated curve.
For batches 3–6b, we re-simulated the transmission spectra using the measured ρN and thickness parameters given in Table 2, with the assumed gap voltage, Vgap = 1.33 mV. The results are denoted by the dashed black curves in Figure 4, which show that for each batch, the frequency of the simulated first band gap is still approximately 1 GHz higher. Another feature to note from these re-simulations is the difference between the simulated and measured ‘envelope’ of the spectrum. For batches 3 and 4, which have the highest resistivity, the measured transmission is much higher than the simulation performed using the standard BCS (Bardeen-Cooper-Schieffer) theory. This implies that the film is much less lossy than expected for a BCS film, suggesting it would be suitable for use as KITWPA. For the batches with a lower film resistivity, however, we see that this discrepancy is less significant, especially for batch 6b. We can quantify this behaviour by introducing a constant, nloss, defined by,
where Rs(Measured) is the measured surface resistance of the film and Rs(BCS) is the surface resistance of the film calculated from standard BCS theory. Using this nloss parameter, as well as allowing Vgap to be a free-fitting parameter to recover the true value of both parameters, we further re-simulate our transmission spectra. These results are illustrated by the blue curves in Figure 4, where for each batch we reduced the simulated gap voltage of the film to Vgap = 0.725 mV instead of the expected Vgap = 1.33 mV. The positions of simulated band gaps now match very well to the measured ones, which suggests that Vgap of our TiN films is much lower than expected, although the reason for this is not completely clear. One possible explanation could be a systematic error in our fabrication process16, as the Vgap of our TiN film is sensitive to the nitrogen flow rate in the sputtering machine. Another possibility is that this behaviour is due to some microphysical behaviour that we have not taken into account, such as the smearing of the superconducting gap25–27.
The nloss values used for each re-simulation are summarised in Table 2, and from this we see a clear ρN-dependence on the value of nloss, with the films with higher ρN resulting in a lower nloss. For all batches, we notice that nloss < 100% i.e., the films appear to be less lossy than expected from BCS theory, which is a desired feature for TWPA operation. It should be noted that nloss is not a fundamental parameter, but simply a free parameter we use to recover the true value of Rs. Nevertheless, this clear dependence of nloss on ρN is an indication that some microphysics beyond standard BCS theory is required to better understand the behaviour of our TiN films.
Device characterisations
The non-linear kinetic inductance for a superconducting transmission line exhibits a quadratic current-dependence in the limit of small currents,
The I* term can be obtained from measuring the change in the phase of S21 in response to an applied current by equating the two expressions for the phase velocity of a transmission line,
to produce a relationship between the fractional change in the wavevector, k, and the fractional change in L i.e.,
A stronger phase shift would be observed for a stronger applied DC current, hence we can plot the fractional change in Lk against the applied DC current. Fitting the data with the quadratic expression for the current-dependent kinetic inductance allows the value of I* to be recovered, as shown in Figure 5 for one of the devices from batch 6b, resulting in I* = 11.29 mA for this particular device.
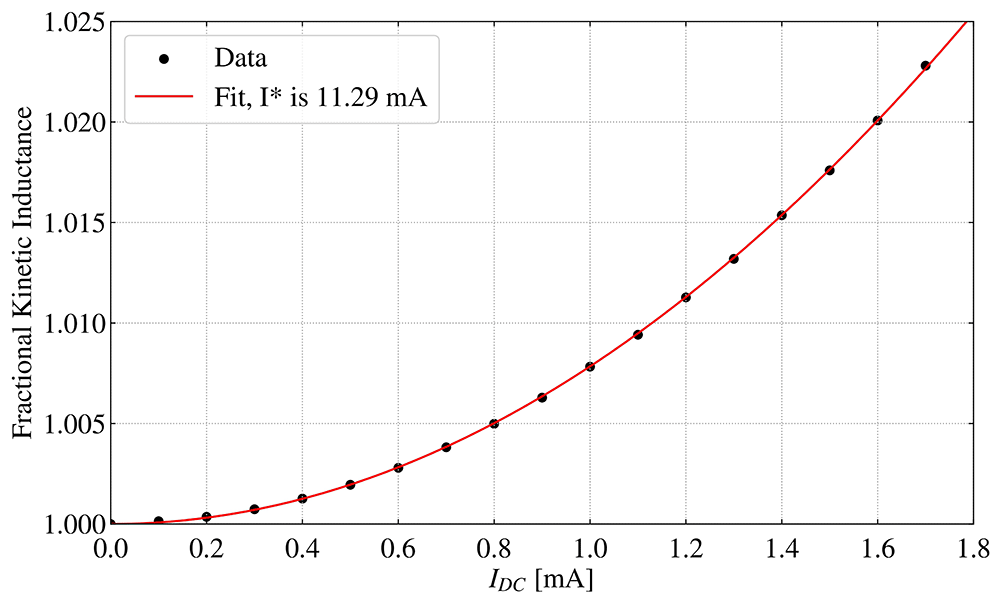
Figure 5. Fractional kinetic inductance as a function of applied DC current for a batch 6b device.
The data were fitted with L = 1+ IDC to give an estimated I* = 11.29 mA.
To probe other non-linear properties of the TiN film, we make use of some test structure devices (short transmission line coupled with lumped-element TiN resonators21) such as those shown in Figure 6(a). Figure 6(b) shows the |S21| of the resonator as the input power from the VNA is increased, and from this we see that for powers up to –20 dBm, the resonator shifts to lower frequencies without the depth in the resonance changing, suggesting that the film is operating in a lossless non-linear regime. For higher powers beyond this maximum lossless power point Plossless, the depth of the resonance starts to decrease, suggesting the film has now entered a lossy non-linear regime.
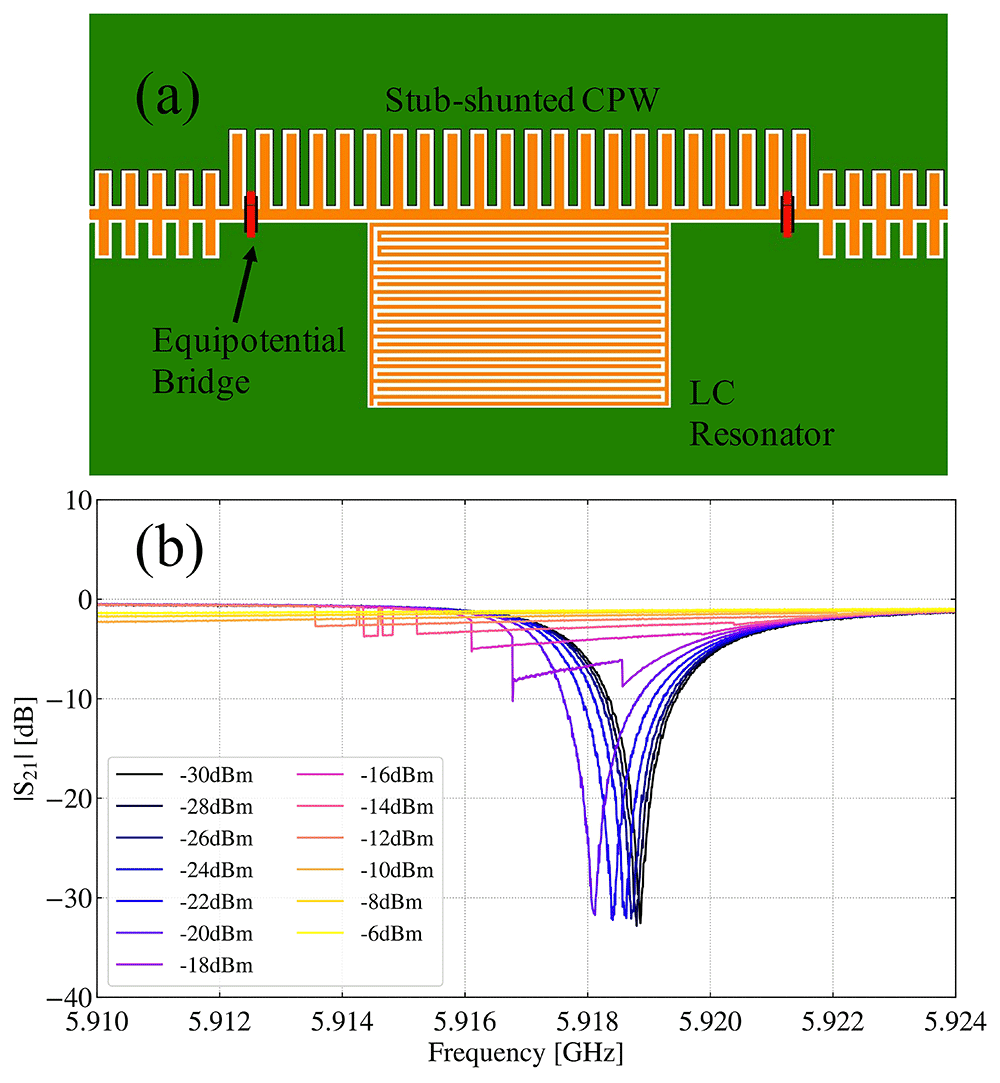
Figure 6.
(a) CAD image of a lumped element LC resonator shunted to a 50 Ω transmission line. Note that the red equipotential bridges20 are not included on the fabricated chip. (b) Shift in the resonance frequency and depth as the input power from the VNA is increased.
Figure 7(a)–(b) show the change in the transmission spectrum for the batch 4 and batch 6b devices, respectively, when pumped just below the first band gap at a power level of 1 dB below the critical current. Instead of amplifying, as one would expect when pumped, the transmission through the devices decreases, with the magnitude of the losses in each chip being broadly identical when normalised by the pump frequency, fp, to take into account the difference in the effective electrical lengths between the two chips due to the different resistivities. On initial inspection, this pump-induced loss appears unexpected, however, when comparing the pump powers used in Figure 7 with the RF powers applied to the resonators in Figure 6(b), we see that the pump powers in the KITWPA devices are much higher than Plossless, implying that our KITWPA devices are in fact operating in a lossy regime now. This implies that the KITWPA devices may not work properly in their designed DP-4WM regime, as the pump powers required to achieve the simulated gain lead to unexpected losses that would negate any possible gain from wave mixing. Reducing the pump power to be lower than Plossless would result in too weak a pump power to promote sufficient wave mixing in order to achieve the desired gain, hence we would require a much longer transmission line to achieve usable gain.
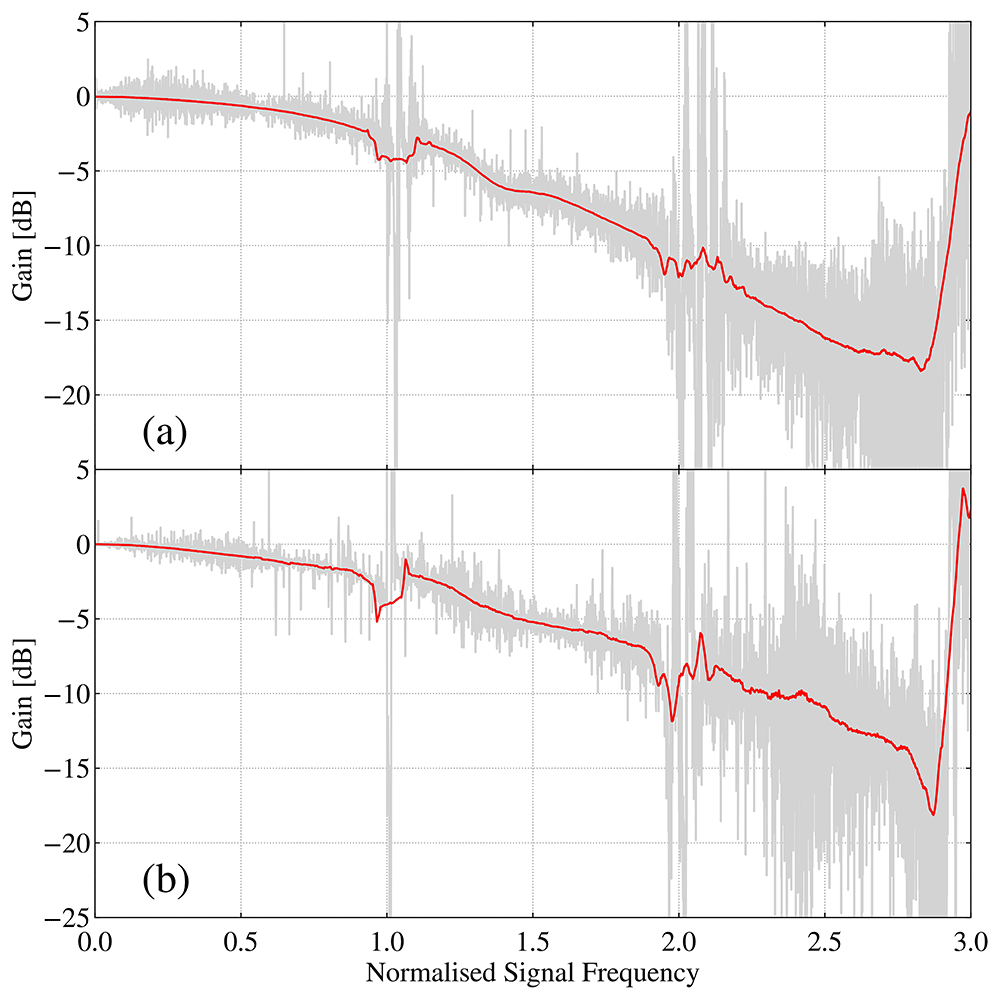
Figure 7.
(a) Transmission profile for batch 4 device with pump tone at 3.75 GHz and –14.00 dBm. (b) Transmission profile for batch 6b device with pump tone at 5.10 GHz and –7.00 dBm. In both plots, the frequency is normalised by the pump frequency, fp.
The mechanisms behind the observed pump-induced losses are not completely clear at the moment. We believe that the two most likely physical mechanisms are unexpected multiple photon Cooper pair breaking, or parasitic wave mixing, whereby unwanted frequency conversion mechanisms are stealing energy away from the signal frequency by converting it to other frequencies. The two loss mechanisms can conveniently be distinguished, however, by using the fact that as with parametric amplification, parasitic wave mixing is only expected to occur when the pump and signal tones are co-propagating along the KITWPA in the same direction, as the phase matching conditions for when the pump and signal are anti-propagating are different28, hence parametric process will be suppressed in this case. Conversely, Cooper pair breaking will occur independently of the pump propagation direction. By measuring and comparing the change in the forward transmission ∆|S21|, where,
and the change in the reverse transmission ∆|S12|, where,
it is possible to identify the responsible loss mechanism.
Figure 8 plots ∆|S21| and ∆|S12| for different fp values. For each pump frequency, the pump power was set to just below Ic to ensure the same amount of power was entering the transmission line at each fp. Studying the spectra across Figure 8, we observe a large range of variation. For fp = 1 GHz, 2 GHz, and 3 GHz, we see a stark contrast between ∆|S21| and ∆|S12|, however, as the pump frequency shifts higher, we observe tha ∆|S21| gets progressively closer to resembling ∆|S12|. This is strongly indicative that the generation of pump harmonics and/or the interaction between these pump harmonics and fs, could be the primary source of the observed losses at lower pump frequencies. For fp > 3 GHz, both the forward and reverse transmission curves are virtually identical, suggesting that these parasitic harmonic wave mixing processes have been suppressed, possibly due to poorer phase matching caused by the stronger non-linear dispersion at higher frequencies.
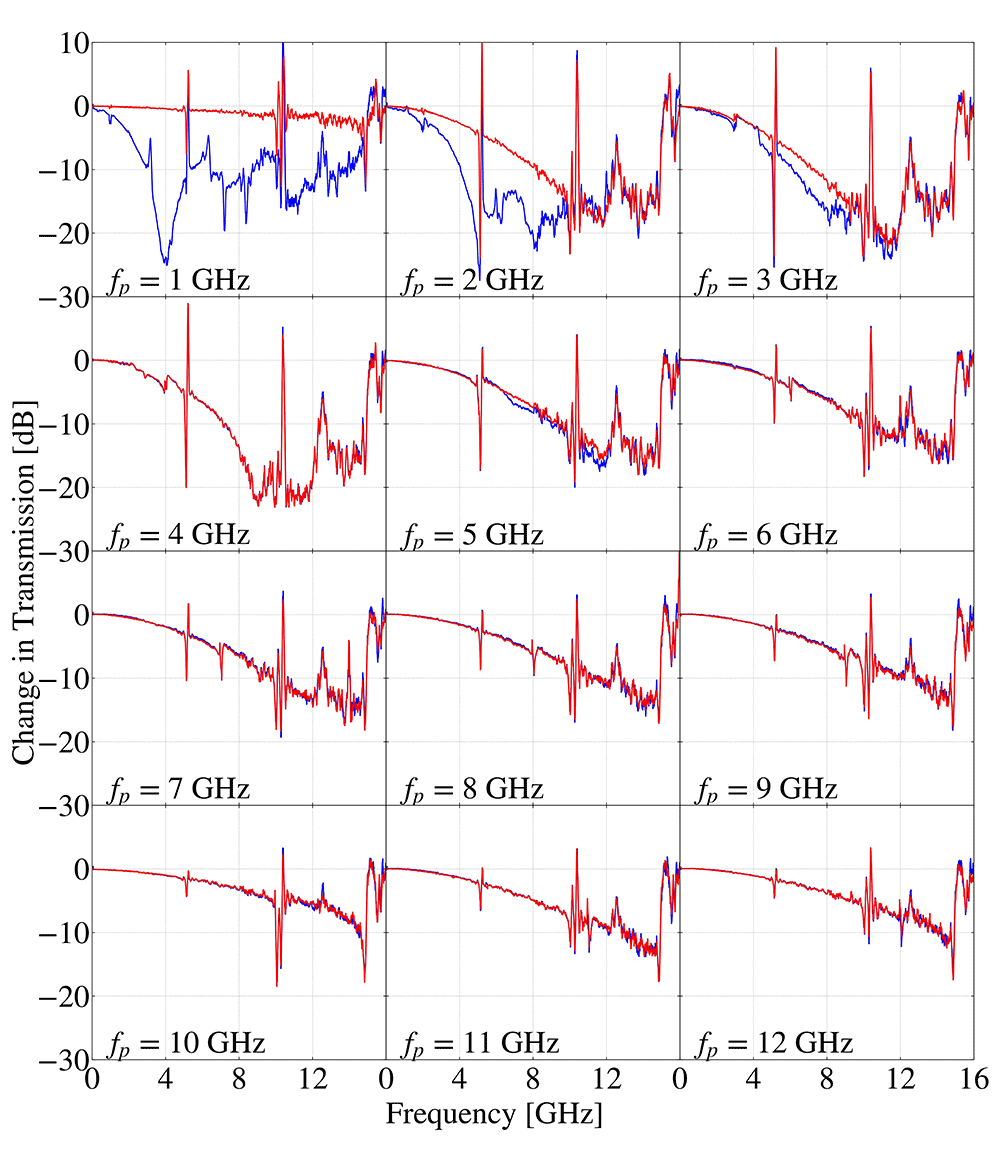
Figure 8. Change in |S21| (blue) and |S12| (red) for different pump frequencies for a batch 6b chip, where for each pump frequency, the power was adjusted to be just below the point at which superconductivity is broken.
Note that the sharp peaks near 5 GHz, 10 GHz, and 15 GHz are related to the designated band gaps.
From the ∆|S12| spectra, we see that applying a pump tone in the opposite direction to the signal tone also results in losses, albeit with different behaviour below fp = 3 GHz, which indicates the presence of multi-photon Cooper pair breaking, and possibly pump harmonics generation as well. Figure 9 plots ∆|S12| as a function of Pp − Pc, where Pc = Ic2Z is the RF power at which superconductivity is broken for an impedance, Z, for various fs values. This figure shows a clear increase in ∆|S12| with increased Pp, suggesting the observed losses are pump power dependent, consistent with the multi-photon Cooper pair breaking mechanism theorised earlier.
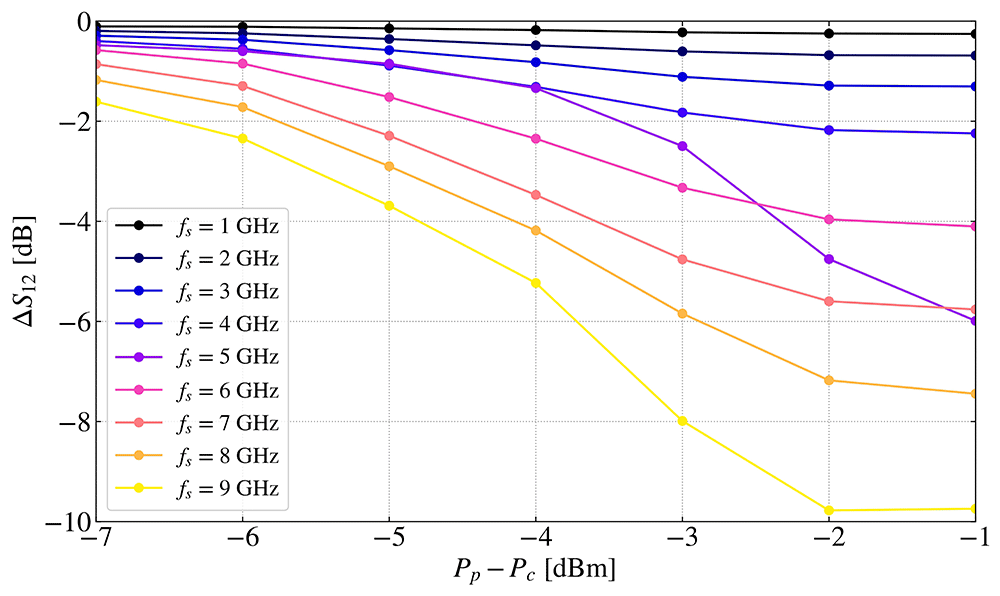
Figure 9. Change in S12 as a function of pump power for different signal frequencies.
The pump frequency for each case was 5 GHz. Note that the losses that appear to increase faster at fs = 5 GHz is due to its proximity to the first band gap, shifting the gap to lower frequencies as the pump power is increased.
DC-3WM measurements
Whilst our TiN film appears to display unexpected multi-photon Cooper pair breaking that significantly affects the gain performance of our KITWPA devices, Figure 8 clearly shows that wave mixing processes are also taking place, as indicated by the difference between ∆|S21| and ∆|S12|. Since multi-photon Cooper pair breaking requires the presence of RF photons, we could potentially minimise this effect by replacing some of the pump power required to achieve parametric non-linear wave mixing by injecting a DC current instead i.e., operating the device in the DC-3WM regime. Furthermore, we observed in Figure 8 that parasitic harmonic wave mixing processes are suppressed for higher pump frequencies due to poorer phase-matching caused by the stronger non-linear dispersion at higher frequencies. This suggests it would be advantageous to pump the device at higher order stop bands instead of the primary stop band near 5 GHz.
Figure 10(a)–(b) show the gain curves normalised by fp for a chip from both batch 4 and batch 6b, respectively, operating in the DC-3WM mode when pumped just above the third band gap. Remarkably, both devices exhibit a measurable gain, with the batch 4 device having a peak average gain of approximately 2 dB, and the batch 6b device having a peak average gain of approximately 5 dB.
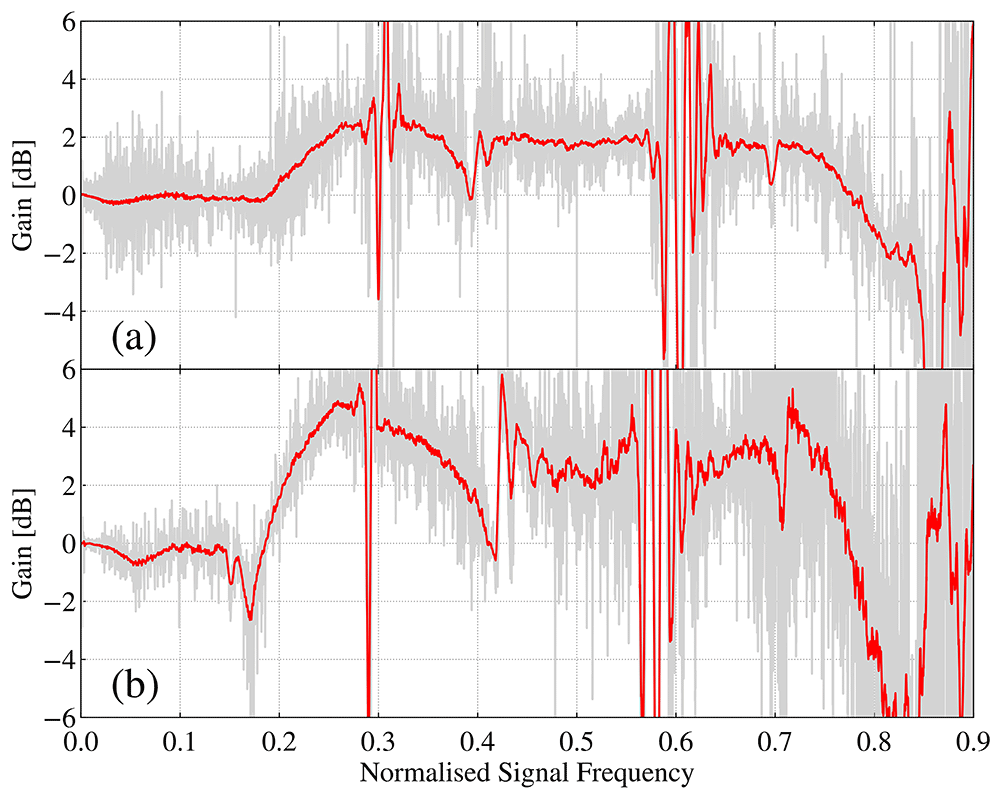
Figure 10.
(a) DC-3WM gain profile for batch 4 device with fp = 12.7 GHz, Pp = −21.0 dBm, and IDC = 0.63 mA. (b) DC-3WM gain profile for batch 6b device with fp = 17.7 GHz, Pp = 10.0 dBm, and IDC = 1.53 mA. Each device has been pumped just above the third band gap and in both plots, the frequency is normalised by the pump frequency, fp.
Aside from the difference in peak average gain, the two plots are noticeably similar in shape, with dips in the gain profiles at roughly 0.3 fp and 0.6 fp, which are caused by the presence of the first and second band-gaps in the transmission spectrum, respectively. We additionally notice a pair of dips at roughly 0.4 fp and 0.7 fp, which occur when a signal propagating at these frequencies generates an idler, fi = fp − fs, that falls into or close to one of the two band-gaps at 0.3 fp and 0.6 fp, which suppresses any gain at those frequencies.
As stated previously, it is expected that signal-pump wave mixing only occurs when the pump and signal tones are propagating along the KITWPA in the same direction, meaning that any directionally independent losses can be factored out by measuring the reverse transmission when the pump and DC are applied. Figure 11 plots the forward and reverse ‘gain’ for the batch 6b chip when DC-biased and pumped above the third stop band. The device behaves as expected, with a clear gain in the forward direction and only a small loss in the reverse direction, which is caused by the Cooper pair breaking mechanism theorised earlier, but weaker due to the higher pump frequency used in this DC-3WM case.
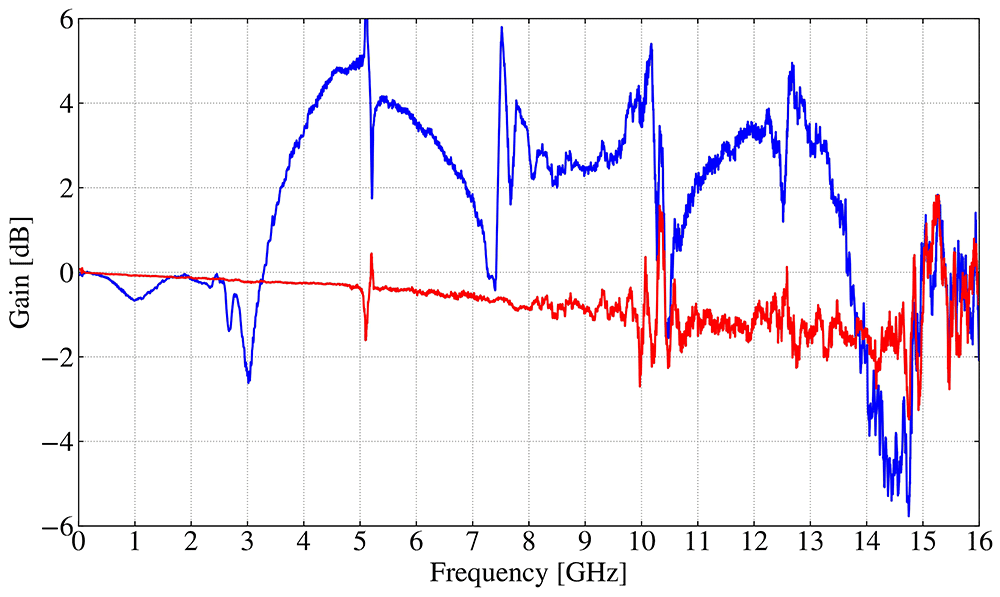
Figure 11. Smoothed DC-3WM gain profile of the batch 6b device when the pump and signal are co-propagating (blue) and when they are anti-propagating (red) when pumped just above the third band-gap.
Conclusions
This paper has presented the preliminary characterisation of TiN KITWPA devices. We found that operating the devices in a DC-3WM regime was able to produce a broad-band gain of up to 5 dB over a bandwidth of 9 GHz, however, the measured gain was lower than expected due to unexpected loss mechanisms. The results presented here demonstrate that TiN films display the necessary non-linear behaviour for KITWPA operation but our particular design meant the film was not operating in the desired lossless regime when the pump tone was applied. Measurements of the un-pumped transmission spectra revealed that films with a higher ρN displayed much lower losses compared to the BCS simulations, which provides experimental evidence for microphysics beyond standard BCS theory that requires further investigation. These measurements also suggest that higher-ρN films are more likely to operate in the desired regime. Comparing to other devices reported in the literature, our TiN KITWPAs use thicker films and larger transmission line dimensions. Making modifications to our KITWPA design, therefore, such as using increased ρN, decreased thickness, or narrower transmission line width, may further extend the lossless non-linear regime, meaning that TiN could potentially be used as an alternative to NbTiN for the fabrication of high-gain KITWPA devices.
Ethics and consent
Ethical approval and consent were not required.









