Key findings
Diverse Microbiomes
2,495 bacterial species were found in the hand samples, with large individual differences.
The most common bacteria on hands were from the Staphylococcus genus, making up 69% of the sample.
Bacterial overlap between hands and surfaces
The bacteria on surfaces closely resembled those found on hands, suggesting frequent transfer between humans and the environment.
22 bacterial species were present on almost all surfaces, including potential pathogens like Staphylococcus aureus, Klebsiella pneumoniae, Escherichia coli, and Acinetobacter baumannii.
Antibiotic Resistance Genes
Bacteria on the ship contained genes that can make them resistant to antibiotics, raising concerns about their spread in crowded settings.
These resistance genes were found even on regularly cleaned surfaces, indicating that cleaning alone may not fully eliminate resistant bacteria.
Implications
This study highlights how bacteria move between people and the environment, emphasizing the need for improved hand hygiene and thorough disinfection. While the ship's cleaning protocols were in place, potentially harmful bacteria and antibiotic-resistant genes were still detected, showing the challenge of maintaining a microbially safe environment.
Introduction
During the past decade, next-generation sequencing technologies have fundamentally transformed metagenomics, making this type of research more affordable, which has led to an explosion of metagenomic studies1. Most microbiome studies focus on the human microbiome, particularly the gut microbiome (Figure 1). Environmental studies are emerging but remain less explored, just as the skin microbiome.
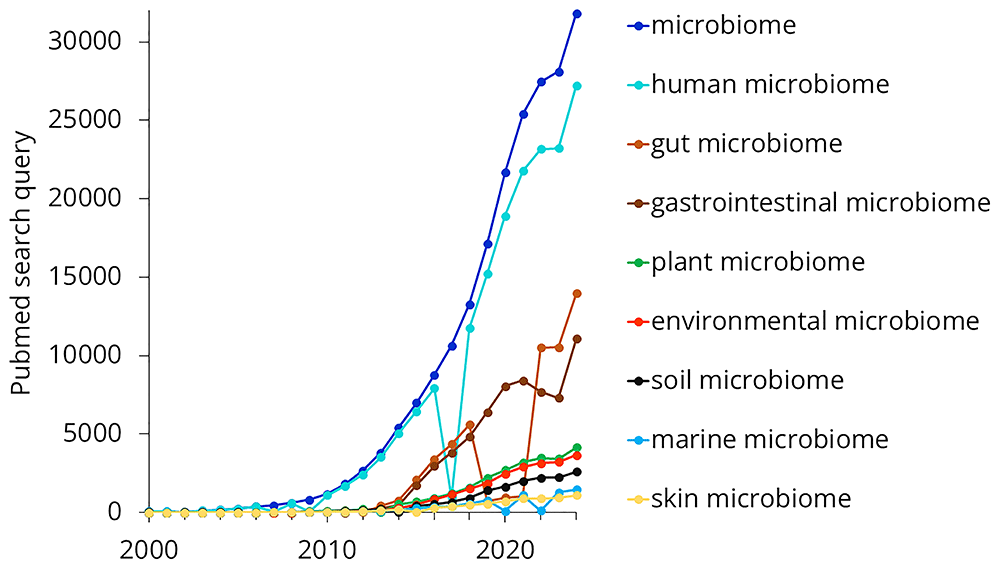
Figure 1. Trends in microbiome-related search terms on PubMed from 2000 to 2024.
In this study, we focused on the microbiome of a cruise ship. In one sense, cruise ships are similar to other crowded environments where many people live or travel together, such as hotels, schools, or public transportation. Microbes found in built environments primarily originate from humans or enter from the outside environment through ventilation2. The Home Microbiome Project concluded that the home microbiome was largely derived from humans3.
A study on the microbiome of the Mexico City subway found a strong relationship between surface microbiomes and hand microbiomes4. The study described how passengers deposit bacteria onto surfaces and pick up others, making subway travel a means of microbial exchange.
On the other hand, cruise ships have some unique characteristics. Daily exposure to seawater and the salt mist that settles each night could significantly influence microbiome composition. Prado et al. studied the microbiome of a polar research ship5, finding that the predominant bacterial species were those typically associated with human skin. Their study also emphasized that human movement patterns had a major impact on the microbiome and noted that ship samples were consistent with those collected from other transportation facilities.
The aim of the present study was to map the composition of the microbiome found on a cruise ship. As previous studies have described a strong correlation between environmental microbiomes and skin microbiomes, the hand skin microbiome of crew members was also investigated.
Methods
We conducted a cross-sectional study aboard the Celestyal Olympia, a 12-deck cruise ship with a passenger capacity of 1,664 and a crew of 540. The primary objectives were (1) to characterize the microbial communities on frequently touched surfaces, (2) to examine the skin microbiome of crew members’ fingertips, and (3) to compare the two microbial profiles for potential overlaps. Sampling was carried out using various agar-based methods, followed by DNA extraction and Nanopore long-read sequencing. Taxonomic classification was performed using Kraken2, and antibiotic resistance genes were identified via the CARD RGI tool. Below, we detail the logistics of sample collection, culture conditions, sequencing protocols, and subsequent bioinformatic analyses.
The cruise ship
Sample collection was conducted onboard the Celestyal Olympia, a 12-deck cruise ship accommodating 1,664 passengers and 540 crew members traveling across the Aegean Sea. Passengers originated from all over the world and typically participated in 3- or 4-day voyages departing from and returning to Athens (Lavrio Port). From Monday to Friday, it followed the route marked with solid arrows, while from Friday to Monday, it skipped Rhodes to shorten the journey, as indicated by the dashed arrow (Figure 2).
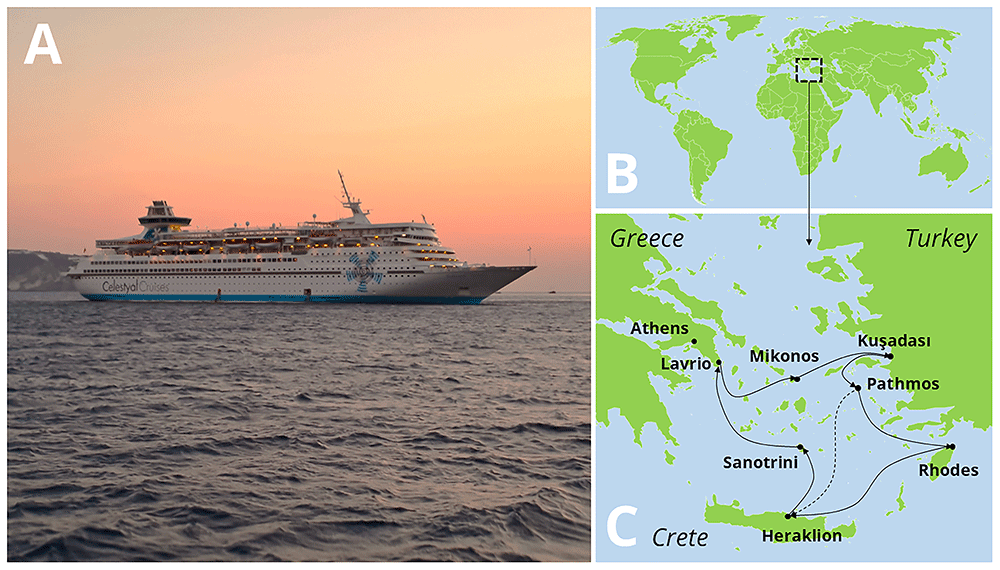
Figure 2.
The cruise ship Celestyal Olympia (A), and its route during that season (B, C).
Sample collection
Hand samples. Hand samples were collected from 19 volunteering participants during a hand hygiene training session organized for the crew. Volunteers were asked to gently touch a contact plate (VWR C31114TI) with their fingertips. These contact plates contained tryptic soy agar (TSA).
Surface samples. In total, 18 samples were collected from frequently touched surfaces aboard the ship, as such surfaces represent the highest risk for pathogen transmission. Four different agar media were used for surface sampling: TSA contact plates (VWR C31114TI), standard TSA plates (VWR 17114ZA), contact slides containing nutrient agar (NA) (VWR 535092Q), and MacConkey contact plates (Liofilchem S.r.l., Ref: 15329). Figure 3. illustrates the sampling sites where either nutrient agar (NA) or tryptic soy agar (TSA) was used. Both media are general-purpose and support the growth of most bacteria, providing an overview of the bacterial microbiome present on these surfaces. A detailed description of the sampling sites is provided in Table 1.
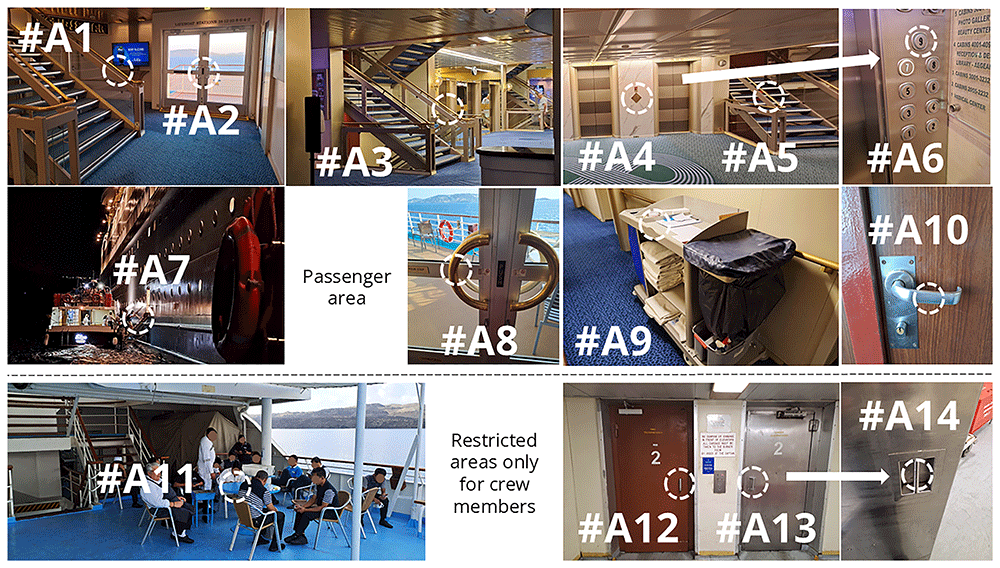
Figure 3. Sampling sites of surface samples collected using general-purpose agar plates.
Table 1. Detailed descriptions of the surfaces sampled during the study.
| # | Collected by | Description of the sampling site |
|---|
| A1 | TSA contact | Midship staircase rail on Deck 7, collected after the mandatory lifeboat drill, when all passengers were required to locate their lifeboat station, all situated on Deck 7. |
| A2 | NA slide | Door handle on Deck 7, collected at the same time as sample #A1. |
| A3 | TSA contact | Midship staircase rail on Deck 5, collected after the late-night show, which took place near this staircase. |
| A4 | TSA contact | Outside panel of the elevator at the forward staircase, collected after passengers disembarked for excursions. |
| A5 | TSA contact | Forward staircase rail, collected at the same time as sample #A4. |
| A6 | TSA contact | Button #9 on the elevator panel inside one of the forward staircase elevators, collected in the afternoon after tea-time snacks were served on Deck 9. |
| A7 | TSA contact | Rails of the mobile stairs used for docking tender boats (tender boats was used to transport passengers to the port when the cruise ship was too large to dock). |
| A8 | TSA contact | Door handle at the Selena Lounge after the late-night Karaoke party. This door opened to an open deck, the only nearby smoking area. |
| A9 | TSA contact | Cleaning trolley during the regular morning cleaning routine. |
| A10 | NA slide | Restroom door knob on Deck 5, sampled during the late-night show. This restroom was located between the Muses Lounge (where the show took place) and the Argo Bar (with live music). |
| A11 | NA slide | Crew table at the crew deck (Deck4). This were a crew-only are, where crew member had a chance to rest during their free time. The area was partially open, with the upper deck providing shading but lacking air conditioning, and the salty fog covered surfaces every night. |
| A12 | NA slide | Outside handle of the food elevator in the crew-only area. This double elevator had a brown door for food transport, and a silver door for garbage. The food elevator was mainly used to transport food between Deck 4 kitchen, Deck 5 and Deck 9 restaurants. |
| A13 | NA slide | Outside handle of the garbage elevator (silver door) in the same crew-only area. This elevator transported waste from all kitchens and restaurants to Deck 1 for disposal during port docking. |
| A14 | TSA plate | Similar as #A13, but inside control panel of the same garbage elevator. |
| B1 | MacConkey | Similar as #A14, inside panel of the garbage elevator, Button #3 |
| B2 | MacConkey | Black waterproof boots used by crew members handling waste, with the sample taken from the toe of a boot. |
| B3 | MacConkey | Similar to #B2 but collected from the sole of the boot. |
| B4 | MacConkey | Outside panel of the elevator in the kitchen on Deck 4. |
Four surfaces were sampled using MacConkey contact agar plates, a selective and differential culture medium designed to grow only Gram-negative bacterial species6 (Table 1, #B1 – #B4).
Samples were incubated at 35–36°C for 48 hours. After incubation, all colonies from the agar were collected using a swab and stored in either Nucleic Acid Preservation Solution (NAPS NKS-40, Anthelos Ltd.) or sterile 0.9% NaCl solution (R-Biopharm Z0301).
Sequencing. For DNA extraction, the Invitrogen PureLink Microbiome DNA Purification Kit (Invitrogen) was used according to the manufacturer's protocol. Fragment lengths were measured using DNA ScreenTape on the TapeStation System (Agilent Technologies). Sequencing was conducted on a Nanopore MinION device with an R10 Flow Cell (FLO-FLG114). Sample preparation was performed using the Native Barcoding Kit 24 v14, following the SQK-NBD-114.24 protocol. Metagenomic data were uploaded to the following repository: European Nucleotide Archive (ENA) Accession number contains: Metagenomic data. Accession number: PRJEB87289. Link to the data: https://www.ebi.ac.uk/ena/browser/view/PRJEB87289.
Bioinformatics workflow. Taxonomic classification of metagenomic sequences was performed using Kraken2 with default parameters, followed by downstream analysis utilizing KrakenTools for data processing and visualization7,8. For antibiotic resistance analysis fastq file was converted to fasta format with bugaco sequence converter (https://sequenceconversion.bugaco.com/), then fasta files were uploaded to CARD RGI Resistance Gene Identifier (https://card.mcmaster.ca/analyze/rgi). All data were stored and subjected to further analysis using Microsoft Excel (Version 2308, Build 16.0.16731.20310).
Results
In total, 33 samples were loaded onto the flow cell, generating 10’369’710 reads. The number of reads per sample ranged from 16’245 to 3’509’833. The average fragment read length was 1’934 bae pairs, average Phred quality score was 33.0. Supplementary Table 1 contains data on read length and quality at the sample level.
Hand samples
Nineteen fingertip samples were collected. Due to insufficient DNA in some samples, only 15 samples were successfully sequenced. Table 2 summarizes the number of species, genera, and phyla identified in the samples. In total, 2’495 different species were detected across the 15 samples, representing 749 genera and 38 phyla.
Table 2. Number of different species, genera, and phyla found in individual fingertip samples (P#1: Participant #1).
| P#1 | P#2 | P#3 | P#4 | P#5 | P#6 | P#7 | P#8 | P#9 | P#10 | P#11 | P#12 | P#13 | P#14 | P#15 | Total |
|---|
| Species | 663 | 432 | 418 | 520 | 389 | 497 | 472 | 236 | 144 | 526 | 205 | 156 | 280 | 282 | 376 | 2495 |
| Genus | 296 | 168 | 157 | 204 | 147 | 155 | 180 | 100 | 42 | 213 | 86 | 53 | 85 | 100 | 151 | 749 |
| Phylum | 16 | 16 | 15 | 17 | 14 | 16 | 20 | 11 | 7 | 18 | 14 | 8 | 6 | 9 | 15 | 38 |
The vast majority of the identified DNA fragments belonged to Bacteria (99.9%), as presented in Table 3. Viruses and Archaea were present in less than 0.02% of the samples. The only Eukaryota species detected in the samples was human, which represented the dead skin cells in the samples. No fungi were detected. The DNA extraction method being optimized for bacteria detection, and may not open fungal cell walls, to extract the DNA.
Table 3. Proportions of superkingdoms in individual fingertip samples (percentage).
| Superkingdom | P#1 | P#2 | P#3 | P#4 | P#5 | P#6 | P#7 | P#8 | P#9 | P#10 | P#11 | P#12 | P#13 | P#14 | P#15 | AVG |
|---|
| Viruses | 0.00 | 0.02 | 0.00 | 0.02 | 0.02 | 0.01 | 0.02 | 0.01 | 0.02 | 0.01 | 0.02 | 0.01 | 0.00 | 0.05 | 0.02 | 0.01 |
| Archea | 0.00 | 0.00 | 0.00 | 0.00 | 0.00 | 0.00 | 0.01 | 0.01 | 0.00 | 0.00 | 0.00 | 0.00 | 0.00 | 0.00 | 0.00 | 0.00 |
| Bacteria | 99.88 | 99.95 | 99.81 | 99.95 | 99.68 | 99.92 | 99.93 | 99.94 | 99.95 | 99.94 | 99.94 | 99.96 | 99.98 | 99.75 | 99.95 | 99.90 |
| Eukaryota | 0.12 | 0.03 | 0.19 | 0.03 | 0.29 | 0.07 | 0.04 | 0.04 | 0.03 | 0.05 | 0.04 | 0.03 | 0.02 | 0.21 | 0.03 | 0.08 |
Among the bacteria, the most abundant phylum was Bacillota (78.08%), followed by Actinomycetota (16.93%), Pseudomonadota (4.83%), and Bacteroidota (0.4%) (Table 4). All other phyla represented less than 0.2% of the samples. At the phylum level, significant individual differences were observed. For example, Actinomycetota represented 43.20% of Participant #2’s sample but only 2.48% in Participant #9’s sample. Note that the samples also appeared to have different compositions at first glance (Figure 4).
Table 4. Proportions of the most prevalent bacterial phyla in individual fingertip samples (percentage).
| Phylum | P#1 | P#2 | P#3 | P#4 | P#5 | P#6 | P#7 | P#8 | P#9 | P#10 | P#11 | P#12 | P#13 | P#14 | P#15 | AVG |
|---|
| Actinomycetota | 3.27 | 43.20 | 22.36 | 22.24 | 11.20 | 7.33 | 35.90 | 33.50 | 2.48 | 5.52 | 5.01 | 4.86 | 37.80 | 6.36 | 12.97 | 16.93 |
| Bacillota | 94.87 | 56.29 | 76.41 | 77.09 | 87.04 | 88.97 | 63.06 | 66.07 | 93.22 | 66.12 | 94.40 | 93.68 | 42.39 | 87.26 | 84.34 | 78.08 |
| Bacteroidota | 0.26 | 0.03 | 0.04 | 0.01 | 0.01 | 0.05 | 0.01 | 0.01 | 0.02 | 0.02 | 0.02 | 0.00 | 0.00 | 0.03 | 0.01 | 0.04 |
| Pseudomonadota | 1.40 | 0.40 | 0.97 | 0.59 | 1.42 | 3.54 | 0.94 | 0.34 | 4.22 | 28.24 | 0.49 | 1.41 | 19.78 | 6.07 | 2.62 | 4.83 |
| other | 0.07 | 0.02 | 0.03 | 0.02 | 0.01 | 0.03 | 0.03 | 0.01 | 0.01 | 0.03 | 0.03 | 0.00 | 0.00 | 0.02 | 0.01 | 0.02 |
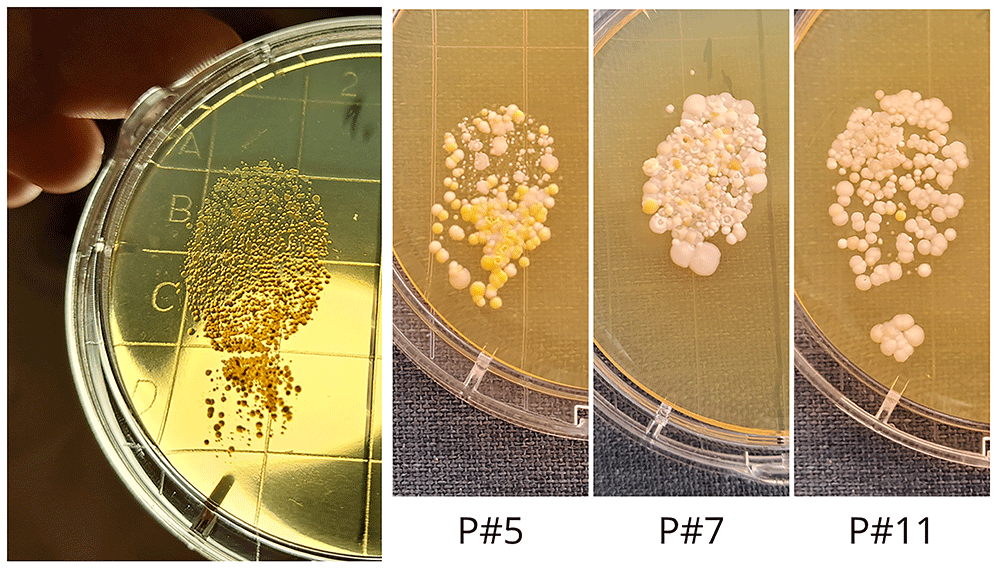
Figure 4. Individual differences of fingertip samples collected by TSA plates. (P#5: Participants #5).
At the genus level, each of the 15 samples exhibited a unique pattern (Table 5). In 14 cases, the most abundant genus was Staphylococcus, which, on average, accounted for 69.38% of the samples. However, in Participant #1’s sample, the dominant genus was Priestia (87.78%), primarily composed of a single species, Priestia flexa (also known as Bacillus flexus).
Table 5. Top 19 most common genera in the hand samples, as percentage of each individual sample.
| Genus | P#1 | P#2 | P#3 | P#4 | P#5 | P#6 | P#7 | P#8 | P#9 | P#10 | P#11 | P#12 | P#13 | P#14 | P#15 | AVG |
|---|
| Staphylococcus | 1.70 | 51.58 | 66.17 | 74.90 | 86.64 | 81.73 | 62.25 | 65.68 | 86.73 | 66.22 | 94.20 | 93.11 | 42.40 | 83.39 | 84.08 | 69.38 |
| Micrococcus | 2.04 | 31.20 | 18.35 | 18.22 | 10.47 | 4.48 | 33.81 | 31.36 | 0.91 | 4.07 | 2.94 | 4.13 | 36.88 | 1.59 | 11.57 | 14.13 |
| Priestia | 87.78 | 0.06 | 0.11 | 0.13 | 0.28 | 0.08 | 0.07 | 0.12 | 0.18 | 0.08 | 0.05 | 0.27 | 0.13 | 1.49 | 0.16 | 6.07 |
| Pantoea | 0.04 | 0.01 | 0.03 | 0.05 | 0.10 | 0.03 | 0.04 | 0.05 | 0.09 | 24.61 | 0.02 | 0.11 | 0.05 | 0.68 | 0.05 | 1.73 |
| Rothia | 1.19 | 9.59 | 0.10 | 3.14 | 0.54 | 1.44 | 0.22 | 0.10 | 1.49 | 0.90 | 0.22 | 0.39 | 0.14 | 2.72 | 0.19 | 1.49 |
| Klebsiella | 0.03 | 0.02 | 0.02 | 0.03 | 0.07 | 0.03 | 0.03 | 0.03 | 0.05 | 0.29 | 0.02 | 0.10 | 18.71 | 0.49 | 0.04 | 1.33 |
| Bacillus | 1.19 | 0.02 | 10.01 | 0.03 | 0.05 | 5.67 | 0.05 | 0.04 | 0.03 | 0.02 | 0.05 | 0.04 | 0.02 | 0.16 | 0.03 | 1.16 |
| Corynebacterium | 0.01 | 0.35 | 3.66 | 0.34 | 0.01 | 1.10 | 1.19 | 0.76 | 0.02 | 0.32 | 1.73 | 0.24 | 0.14 | 1.85 | 1.06 | 0.85 |
| Mammaliicoccus | 0.00 | 4.74 | 0.03 | 0.02 | 0.01 | 0.01 | 0.21 | 0.01 | 4.56 | 0.01 | 0.01 | 0.00 | 0.01 | 0.03 | 0.02 | 0.64 |
| Streptococcus | 0.02 | 0.00 | 0.01 | 2.11 | 0.01 | 0.78 | 0.07 | 0.00 | 0.40 | 0.09 | 0.02 | 0.19 | 0.00 | 1.95 | 0.00 | 0.38 |
| Enterobacter | 0.12 | 0.08 | 0.09 | 0.15 | 0.38 | 0.06 | 0.09 | 0.12 | 0.26 | 0.32 | 0.07 | 0.57 | 0.23 | 2.80 | 0.26 | 0.37 |
| Moraxella | 0.65 | 0.04 | 0.00 | 0.01 | 0.10 | 0.07 | 0.13 | 0.01 | 2.09 | 0.01 | 0.24 | 0.00 | 0.00 | 0.03 | 1.45 | 0.32 |
| Escherichia | 0.25 | 0.06 | 0.05 | 0.06 | 0.56 | 0.15 | 0.01 | 0.03 | 1.55 | 0.99 | 0.04 | 0.05 | 0.10 | 0.20 | 0.03 | 0.27 |
| Neisseria | 0.00 | 0.00 | 0.00 | 0.00 | 0.00 | 2.03 | 0.44 | 0.00 | 0.00 | 0.00 | 0.00 | 0.00 | 0.00 | 0.01 | 0.00 | 0.17 |
| Agrobacterium | 0.00 | 0.04 | 0.04 | 0.01 | 0.00 | 0.00 | 0.06 | 0.00 | 0.00 | 0.65 | 0.03 | 0.37 | 0.03 | 0.01 | 0.60 | 0.12 |
| Kocuria | 0.00 | 0.16 | 0.03 | 0.02 | 0.00 | 0.24 | 0.03 | 1.06 | 0.00 | 0.00 | 0.08 | 0.00 | 0.01 | 0.00 | 0.02 | 0.11 |
| Exiguobacterium | 0.01 | 0.00 | 0.00 | 0.00 | 0.01 | 0.00 | 0.00 | 0.00 | 1.27 | 0.00 | 0.00 | 0.01 | 0.00 | 0.04 | 0.00 | 0.09 |
| Acinetobacter | 0.08 | 0.02 | 0.03 | 0.05 | 0.10 | 0.04 | 0.02 | 0.03 | 0.09 | 0.05 | 0.02 | 0.08 | 0.04 | 0.52 | 0.08 | 0.08 |
| Streptomyces | 0.01 | 0.05 | 0.03 | 0.06 | 0.02 | 0.02 | 0.09 | 0.02 | 0.01 | 0.03 | 0.01 | 0.03 | 0.84 | 0.03 | 0.03 | 0.08 |
This species has been described as both a urinary tract pathogen9 and a marine bacterium10. The overrepresentation of Priestia flexa in Participant #1’s sample suggests that it had the opportunity to proliferate somewhere. However, it remains unclear whether this proliferation occurred inside the body (as an infection or colonization) or it originated from the environment. No participants reported any ongoing infections, although, they were not directly asked about that.
Figure 5 illustrates the most common species detected in the hand samples. Individual samples display significant variability, with no two samples being identical. Notably, the top 20 species account for 84.77–96.80% of the total sample composition. Among these, 11 species belong to the genus Staphylococcus.
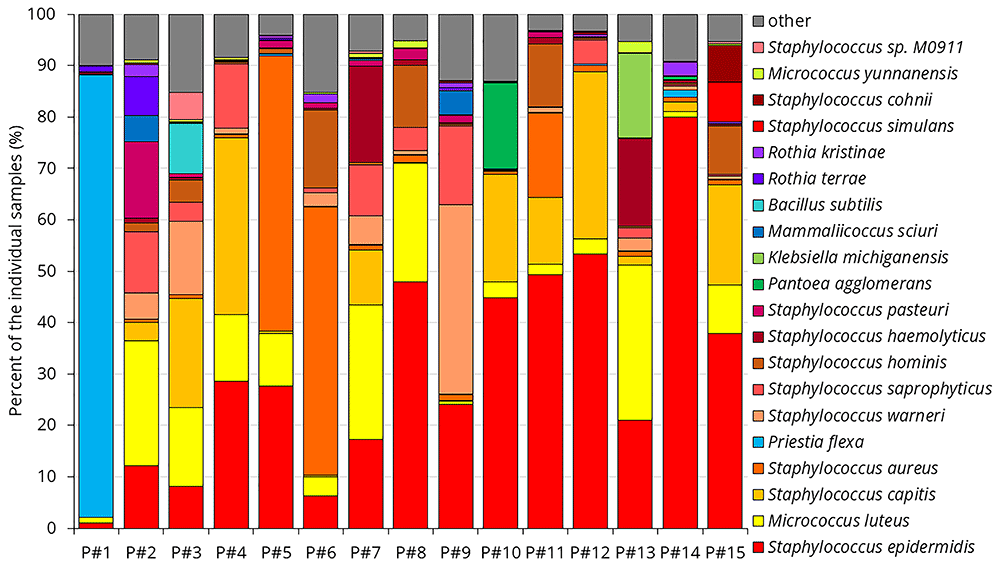
Figure 5. The 20 most common species in the individual hand samples.
Table 5 highlights that the Staphylococcus genus constitutes the vast majority of the samples. Figure 5 further demonstrates that various Staphylococcus species occur in widely different proportions across the samples. Table 6 summarizes the Staphylococcus species alongside the Staphylococcus viruses identified in the hand samples.
Table 6. Top 30 most common Staphylococcus species and all Staphylococcus phages detected in the hand samples.
| Staphylococcus species | P#1 | P#2 | P#3 | P#4 | P#5 | P#6 | P#7 | P#8 | P#9 | P#10 | P#11 | P#12 | P#13 | P#14 | P#15 | AVG |
|---|
| Staphylococcus epidermidis | 1.02 | 12.16 | 8.20 | 28.52 | 27.65 | 6.31 | 17.26 | 47.89 | 24.09 | 44.83 | 49.27 | 53.30 | 20.96 | 79.91 | 37.89 | 30.62 |
| Staphylococcus capitis | 0.04 | 3.44 | 21.22 | 34.40 | 0.46 | 0.20 | 10.67 | 0.10 | 0.15 | 20.88 | 13.06 | 32.49 | 1.75 | 1.88 | 19.55 | 10.69 |
| Staphylococcus aureus | 0.04 | 0.65 | 0.75 | 0.71 | 53.54 | 52.26 | 1.00 | 1.46 | 1.09 | 0.71 | 16.46 | 1.23 | 0.88 | 0.87 | 0.91 | 8.84 |
| Staphylococcus warneri | 0.01 | 5.13 | 14.22 | 1.08 | 0.13 | 2.77 | 5.71 | 0.74 | 36.83 | 0.06 | 1.04 | 0.11 | 2.57 | 0.73 | 0.58 | 4.78 |
| Staphylococcus saprophyticus | 0.03 | 11.89 | 3.66 | 12.55 | 0.08 | 0.89 | 9.78 | 4.57 | 15.43 | 0.03 | 0.08 | 4.56 | 1.88 | 0.27 | 0.31 | 4.40 |
| Staphylococcus hominis | 0.22 | 1.72 | 4.39 | 0.26 | 0.88 | 15.09 | 0.56 | 12.12 | 0.20 | 0.11 | 12.24 | 0.32 | 0.30 | 0.40 | 9.40 | 3.88 |
| Staphylococcus haemolyticus | 0.26 | 0.82 | 0.38 | 0.12 | 0.15 | 0.34 | 18.75 | 1.07 | 0.35 | 0.13 | 1.22 | 0.19 | 17.11 | 0.41 | 0.46 | 2.78 |
| Staphylococcus pasteuri | 0.01 | 14.98 | 0.87 | 0.05 | 1.52 | 1.09 | 1.07 | 2.11 | 1.43 | 0.05 | 1.05 | 0.05 | 0.03 | 0.14 | 0.07 | 1.64 |
| Staphylococcus simulans | 0.00 | 0.03 | 0.14 | 0.06 | 0.05 | 0.03 | 0.04 | 0.03 | 0.05 | 0.14 | 0.04 | 0.37 | 0.02 | 0.07 | 7.74 | 0.59 |
| Staphylococcus cohnii | 0.00 | 0.28 | 0.06 | 0.02 | 0.02 | 0.04 | 0.09 | 0.01 | 0.35 | 0.01 | 0.11 | 0.20 | 0.01 | 0.02 | 7.17 | 0.56 |
| Staphylococcus sp. M0911 | 0.00 | 0.01 | 5.37 | 0.00 | 0.01 | 0.01 | 0.47 | 0.01 | - | - | 0.00 | - | 0.00 | - | 0.52 | 0.43 |
| Staphylococcus sp. 11-B-312 | 0.01 | 1.71 | 0.01 | 0.01 | 0.02 | 0.01 | 0.20 | 0.01 | 2.37 | 0.01 | 0.00 | 0.62 | 0.01 | 0.01 | 0.02 | 0.33 |
| Staphylococcus sp. SB1-57 | 0.00 | 0.01 | 4.19 | 0.00 | 0.00 | 0.00 | 0.06 | - | 0.01 | 0.00 | 0.01 | 0.01 | 0.01 | 0.01 | 0.22 | 0.30 |
| Staphylococcus caprae | - | 0.06 | 1.59 | 0.05 | 0.04 | 0.02 | 0.06 | 0.02 | 2.08 | 0.02 | 0.03 | 0.01 | 0.02 | 0.01 | 0.05 | 0.27 |
| Staphylococcus ureilyticus | 0.01 | 0.81 | 0.02 | 0.01 | 0.01 | 0.01 | 0.27 | 0.01 | 1.43 | 0.01 | - | 0.28 | 0.00 | 0.03 | 0.02 | 0.19 |
| Staphylococcus lugdunensis | - | 0.03 | 0.22 | 0.06 | 0.08 | 0.04 | 0.14 | 0.11 | 0.22 | 0.04 | 0.09 | 0.08 | 0.06 | 0.04 | 0.07 | 0.08 |
| Staphylococcus pettenkoferi | 0.00 | 0.84 | 0.07 | 0.05 | 0.02 | 0.01 | 0.00 | - | 0.17 | 0.01 | 0.01 | 0.02 | 0.01 | 0.02 | 0.01 | 0.08 |
| Staphylococcus equorum | 0.00 | 0.12 | 0.11 | 0.15 | 0.01 | 0.02 | 0.06 | 0.09 | 0.11 | 0.01 | 0.01 | 0.05 | 0.03 | 0.02 | 0.09 | 0.06 |
| Staphylococcus pseudintermedius | 0.01 | 0.05 | 0.03 | 0.06 | 0.04 | 0.05 | 0.10 | 0.05 | 0.11 | 0.03 | 0.04 | 0.06 | 0.05 | 0.02 | 0.06 | 0.05 |
| Staphylococcus argenteus | - | 0.00 | 0.01 | 0.00 | 0.30 | 0.26 | 0.02 | - | - | 0.00 | 0.02 | - | 0.00 | - | 0.01 | 0.04 |
| Staphylococcus xylosus | - | 0.04 | 0.08 | 0.05 | 0.03 | 0.06 | 0.05 | 0.10 | 0.04 | 0.01 | 0.02 | 0.01 | 0.03 | 0.02 | 0.04 | 0.04 |
| Staphylococcus arlettae | - | 0.02 | 0.14 | 0.08 | 0.02 | 0.03 | 0.03 | 0.06 | 0.05 | 0.00 | 0.01 | 0.02 | 0.01 | 0.03 | 0.04 | 0.04 |
| Staphylococcus schweitzeri | - | - | 0.01 | - | 0.24 | 0.20 | 0.01 | - | - | - | 0.01 | - | - | 0.01 | - | 0.03 |
| Staphylococcus petrasii | 0.00 | 0.07 | 0.02 | 0.02 | 0.00 | 0.01 | 0.03 | 0.01 | 0.04 | 0.01 | 0.01 | 0.06 | 0.04 | - | 0.02 | 0.02 |
| Staphylococcus simiae | 0.00 | 0.00 | 0.05 | 0.01 | 0.10 | 0.14 | 0.01 | - | 0.01 | 0.00 | 0.01 | 0.00 | 0.00 | - | 0.01 | 0.02 |
| Staphylococcus succinus | - | 0.02 | 0.05 | 0.02 | 0.01 | 0.02 | 0.01 | 0.01 | 0.10 | 0.00 | 0.00 | 0.00 | 0.00 | 0.01 | 0.02 | 0.02 |
| Staphylococcus nepalensis | - | 0.02 | 0.07 | 0.00 | 0.01 | 0.01 | 0.02 | 0.03 | 0.02 | 0.01 | 0.00 | 0.01 | 0.00 | - | 0.04 | 0.02 |
| Staphylococcus carnosus | 0.00 | 0.03 | 0.04 | 0.01 | 0.00 | 0.01 | 0.02 | 0.03 | 0.04 | 0.00 | 0.00 | 0.01 | 0.00 | 0.06 | 0.01 | 0.02 |
| Staphylococcus sp. NRL 16/872 | - | 0.01 | 0.13 | 0.01 | - | - | 0.02 | 0.00 | - | 0.00 | 0.00 | 0.00 | 0.02 | 0.01 | 0.00 | 0.01 |
| Staphylococcus gallinarum | - | 0.01 | 0.14 | 0.01 | 0.01 | 0.00 | 0.01 | - | 0.02 | 0.00 | - | - | 0.00 | - | 0.01 | 0.01 |
| other Staphylococcus | 0.01 | 0.10 | 0.68 | 0.13 | 0.30 | 0.37 | 0.23 | 0.20 | 0.21 | 0.04 | 0.14 | 0.11 | 0.06 | 0.17 | 0.23 | 0.20 |
| Staphylococcus phages | P#1 | P#2 | P#3 | P#4 | P#5 | P#6 | P#7 | P#8 | P#9 | P#10 | P#11 | P#12 | P#13 | P#14 | P#15 | AVG |
|---|
| Staphylococcus phage phiRS7 | - | 0.005 | - | 0.007 | - | - | 0.014 | - | 0.018 | - | - | 0.005 | 0.002 | - | 0.003 | 0.004 |
| Staphylococcus phage StB27 | - | - | - | - | - | 0.005 | - | - | - | - | 0.011 | - | - | - | 0.001 | 0.001 |
| Staphylococcus phage StB12 | - | - | - | - | 0.001 | - | - | - | - | - | 0.004 | - | - | - | 0.002 | 0.000 |
| Staphylococcus phage StB20-like | - | - | - | - | - | - | 0.001 | - | - | - | - | - | - | - | - | 0.000 |
| Staphylococcus phage DW2 | - | - | - | - | 0.001 | - | - | - | - | - | - | - | - | - | - | 0.000 |
The host of Staphylococcus phage phiRS7 is reported to be S. saprophyticus11. S. saprophyticus was most prominently detected in the hand sample of Participant #9 (15.49%), where the highest number of phiRS7 phages was also found. Similarly, phage StB27’s host is identified as S. hominis. In the two samples where these phages were detected (Participants #6 and #11), the largest proportions of S. hominis were also observed (15.09% and 12.24%, respectively). Interestingly, Participant #8 also exhibited a substantial proportion of S. hominis (12.12%), but the StB27 phage was absent. Phage StB12, detected in the hand sample of Participant #11, also uses S. hominis as its host. In this case, 12.24% of S. hominis appeared sufficient to support the presence of two distinct phages.
Surface samples
A total of 14 surface samples were collected using general-purpose media (NA and TSA) from various surfaces (Figure 3). Some samples were dominated by a single species, what is probably a bias caused by the culturing step. For example, 94% of Sample #A8 consisted of Rothia kristinae, while 90% of Sample #A6 was composed of Pantoea agglomerans. This can be attributed to the fact that in surface samples, in some cases only a few colonies grew (in contrast with the hand samples, hundreds of colonies were consistently observed in all samples.) All surface samples contained a high number of species, ranging from 184 in Sample #A6 to 4’320 species in Sample #A11. Table 7 summarizes the species that were found in all, or nearly all (13 out of 14) surface samples and compares their prevalence to that in the hand samples.
Table 7. Summary of species prevalence across surface samples. Color-codes indicates frequency in hand samples.
| Founded in 14/14 samples | Founded in 13/14 samples | Color code |
|---|
| Acinetobacter baumannii | Acinetobacter pittii | top1-10 in hand samples |
| Cytobacillus kochii | Bacillus altitudinis | top11-20 in hand samples |
| Enterobacter asburiae | Bacillus safensis | top21-30 in hand samples |
| Enterobacter hormaechei | Bacillus subtilis | top31-50 in hand samples |
| Enterobacter roggenkampii | Bacillus velezensis | top51-100 in hand samples |
| Escherichia coli | Enterobacter kobei | |
| Homo sapiens | Enterobacter mori | |
| Klebsiella pneumoniae | Klebsiella quasipneumoniae | |
| Micrococcus luteus | Mammaliicoccus sciuri | |
| Niallia circulans | Micrococcus sp. KBS0714 | |
| Pantoea agglomerans | Micrococcus yunnanensis | |
| Priestia flexa | Moraxella osloensis | |
| Priestia megaterium | Rothia terrae | |
| Rothia kristinae | Staphylococcus cohnii | |
| Staphylococcus aureus | Staphylococcus pettenkoferi | |
| Staphylococcus capitis | Staphylococcus sp. 11-B-312 | |
| Staphylococcus epidermidis | Staphylococcus ureilyticus | |
| Staphylococcus haemolyticus | | |
| Staphylococcus hominis | | |
| Staphylococcus pasteuri | | |
| Staphylococcus saprophyticus | | |
| Staphylococcus warneri | | |
A total of 22 species were found in all 14 surface samples, and 17 species were detected in 13 out of 14 samples. These species were also highly prevalent in hand samples. Notably, the top 10 most common hand-associated bacteria were found in all surface samples. All surface samples contained human DNA, likely representing dead skin cells. Only four species common on surfaces were not among the top 100 most prevalent species in hand samples; Cytobacillus kochii (#112 in hand samples), Enterobacter mori (#118), Bacillus safensis (#134) and Acinetobacter pittii (#152). These findings suggest a strong correlation between the microbiome of the surfaces and the microbiome of human hands in this environment. This emphasizes the role of surfaces in the potential transmission of bacteria, and thus, infection-transmission.
In healthcare settings, ESKAPE bacteria are often discussed due to their association with life-threatening, healthcare-associated infections. These bacteria are known for their ability to "escape" the effects of antibiotics by developping resistance. The acronym ESKAPE stands for: Enterococcus faecium, Staphylococcus aureus, Klebsiella pneumoniae, Acinetobacter baumannii, Pseudomonas aeruginosa, and Enterobacter spp,) and sometimes Escherichia coli is also mentioned as an ESKAPE bacteria12. Five of the seven ESKAPE bacteria (Staphylococcus aureus, Klebsiella pneumoniae, Acinetobacter baumannii, and three different Enterobacter species and Escherichia coli) were present on all surfaces. Instead of the fact that in the cruise ship everyone was healthy, or at least felt themselves good enough to participate a vacation trip. These findings underscore why some of the healthcare-infections cannot be prevented; bacteria often arrive to the healthcare facility together with the patients This highlights the critical need for continuous and thorough disinfection of surfaces, particularly in environments with vulnerable individuals.
The samples analyzed so far were predominantly dominated by Staphylococcus and other Gram-positive species. In the case of hand samples, 18 of the top 20 bacteria were Gram-positive, while only 2 were Gram-negative: Pantoea agglomerans and Klebsiella michiganensis. Similarly, among the species found in all surface samples, Gram-positive bacteria were dominant, with 14 species detected, compared to only 7 Gram-negative species, including Acinetobacter baumannii, various Enterobacter species, Klebsiella pneumoniae, and Pantoea agglomerans. Notably, all the Gram-negative bacteria mentioned here were known pathogens, with some classified among the ESKAPE pathogens. For instance, Pantoea agglomerans has been associated with wound infections13 and pneumonia in immunocompromised individuals14. Meanwhile, Klebsiella michiganensis is an emerging human pathogen15.
To further investigate the Gram-negative bacterial population on surfaces, some samples were collected using MacConkey agar plates (Table 1). These samples were mostly targeted areas likely to be the most contaminated on the cruise ship, including the elevator used by the crew to transport waste and the waterproof boots worn by crew members working in the waste disposal area (Samples #B1, #B2, and #B3, Figure 6).
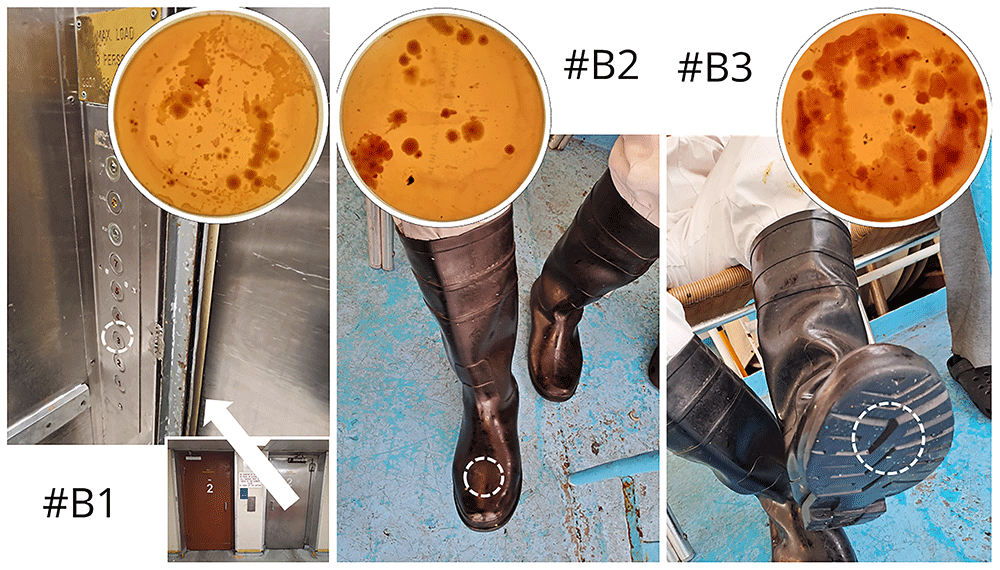
Figure 6. Environmental surface sampling using MacConkey contact agar plates at the waste disposal area.
Figure 7 shows the most commonly identified bacteria in each sample. Sample #B1 was dominated by Acinetobacter species, with 7 different Acinetobacter species ranked among the top 21 species. Together, these Acinetobacter species accounted for 64.70% of the total sample. In sample #B2, Klebsiella species were more prevalent, while sample #B3 was dominated by Enterobacter species. Lactiplantibacillus carotarum was first isolated in 2023 from fermented carrot juice16. Ligilactobacillus salivarius is a lactic acid bacterium, recognized as a promising probiotic, and interestingly, it is a Gram-positive species17.
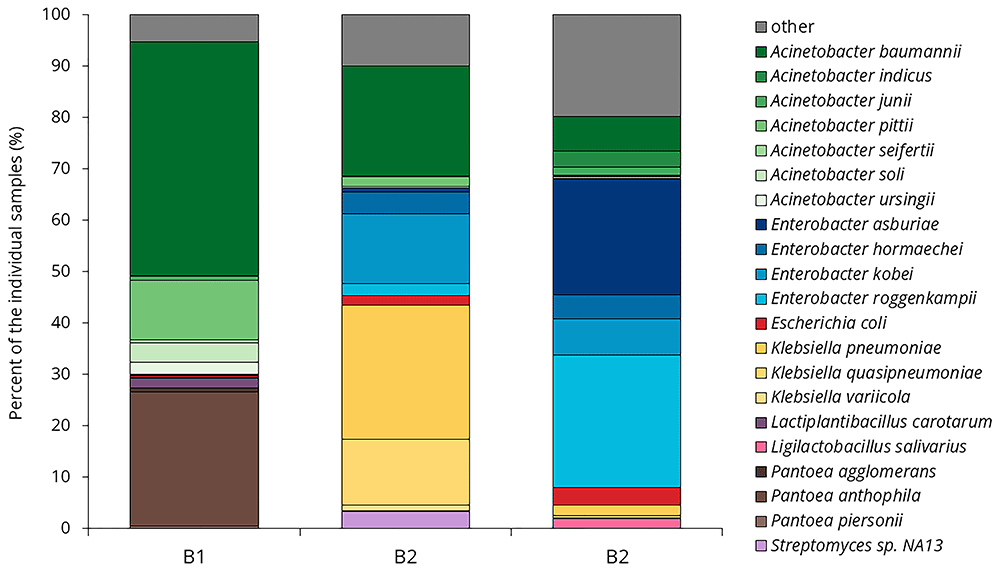
Figure 7. Bacterial profiles from waste disposal samples on MacConkey agar.
The final sample (#B4) differed from the others, as it was collected from the elevator control panel in the main kitchen area (Table 1, Figure 8). Here, fewer Gram-negative bacteria were expected due to regular disinfection. On the other hand, the site was also frequently touched. In sample #B4, 1’501 species were identified, which was surprisingly high compared to the other samples: 661 species in #B1, 1’294 species in #B2, and 1’661 species in #B3, respectively.
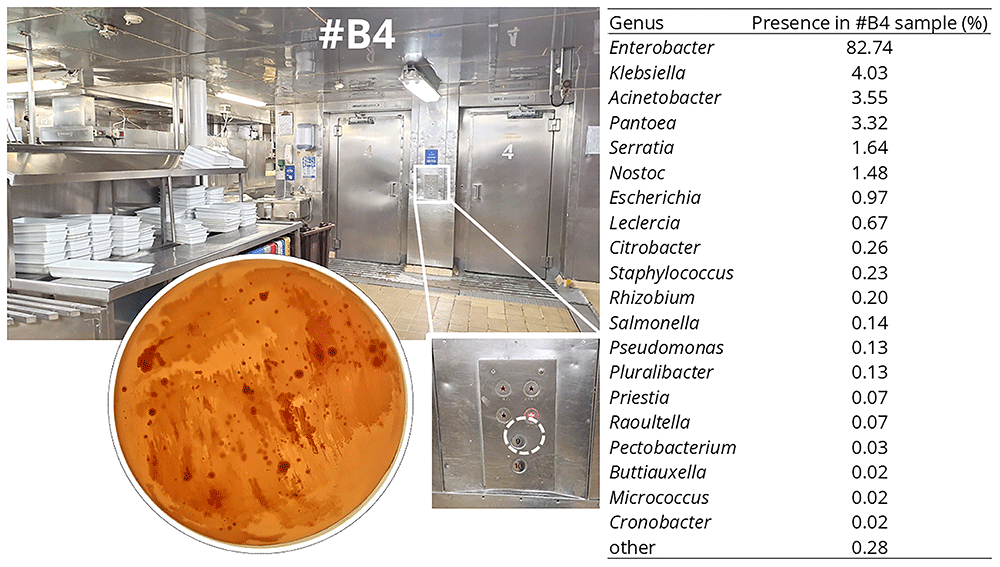
Figure 8. Sample collected in the main kitchen using a MacConkey contact agar plate.
Sample #B4 was dominated by Enterobacter species, with a total of 82.74% of the sample belonging to this genus. The most prevalent species were Enterobacter hormaechei (36.56%), Enterobacter cloacae (19.30%), Enterobacter roggenkampii (7.29%), Enterobacter mori (5.42%), and Enterobacter asburiae (2.77%). Among the top 20 species, six additional Enterobacter species were identified.
Other known pathogens were also found among the top 20 species, including Acinetobacter baumannii, A. pittii, Klebsiella pneumoniae, K. michiganensis, Escherichia coli, and Serratia marcescens. The only two non-pathogenic species in the top 20 list were Nostoc sp. C057, a cyanobacterium, and Rhizobium sp. C104, a soil bacterium that lives in endosymbiosis with plant roots and plays an important role in nitrogen fixation18. The presence of soil bacteria suggests that some of these microbes may have entered the kitchen through vegetables being processed.
To better assess the potential risks posed by these bacteria, resistance genes were analyzed in sample #B4. Many antibiotic resistance genes were present in the sample, with varying frequencies. In Table 8, the identified resistance genes were categorized by gene families and their frequency of occurrence.
Table 8. Antimicrobial resistance genes found in sample #B4, grouped by their frequency of occurrence.
| AMR gene family | ARO Term |
|---|
Rare
(Founded 1–5 times) | Moderate
(Founded 6–40
times) | Common
(Founded 41+ times) |
|---|
| ACT beta-lactamase | ACT-17, ACT-47, ACT-47, ACT-86,
ACT-118, ACT-179, ACT-192 | | |
| ANT(3',',) | ANT(3'')-IIa | | |
| BlaZ beta-lactamase | PC1 | | |
| elfamycin resistant EF-Tu | Escherichia coli EF-Tu mutants | | |
| fosfomycin thiol transferase | fosA5 | | FosA2 |
major facilitator superfamily (MFS)
antibiotic efflux pump | emrB, Staphylococcus aureus
norA | Klebsiella pneumoniae
KpnH, leuO, H-NS | emrR |
| MIR beta-lactamase | MIR-35 | | |
| pmr phosphoethanolamine transferase | ArnT | | |
resistance-nodulation-cell division (RND)
antibiotic efflux pump | Enterobacter cloacae acrA,
Shigella flexneri acrA, ramA | baeR, baeS, CRP,
oqxA, marA | Escherichia coli AcrAB-TolC
with MarR mutations, rsmA |
small multidrug resistance (SMR)
antibiotic efflux pump | abeS | | Klebsiella pneumoniae KpnE,
Klebsiella pneumoniae KpnF |
Target protecting FusB-type protein
conferring resistance to Fusidic acid | fusB | | |
The two most common resistance gene families were MSF and RND antibiotic efflux pumps. Some resistance genes were directly linked to ESKAPE bacteria, including E. coli, Enterobacter cloacae, Klebsiella pneumoniae, and Staphylococcus aureus. Additionally, Shigella flexneri was also identified. S. flexneri is an emerging pathogen that causes diarrhea19. It was present on 4 out of 15 (27%) hands and on 8 out of 18 (44%) surfaces.
Figure 9 compares the composition of the hand samples and surface samples collected using general-purpose agar plates. Staphylococcus, Micrococcus, Corynebacterium, Mammaliicoccus, and Klebsiella were more dominant in hand samples than in surface samples. The first four genera are Gram-positive bacteria, their proportion likely decreased due to their limited survival capability on surfaces. In contrast, Klebsiella is a Gram-negative bacterium that can survive on surfaces for days to more than a month, so this difference cannot be explained by survival capability20.
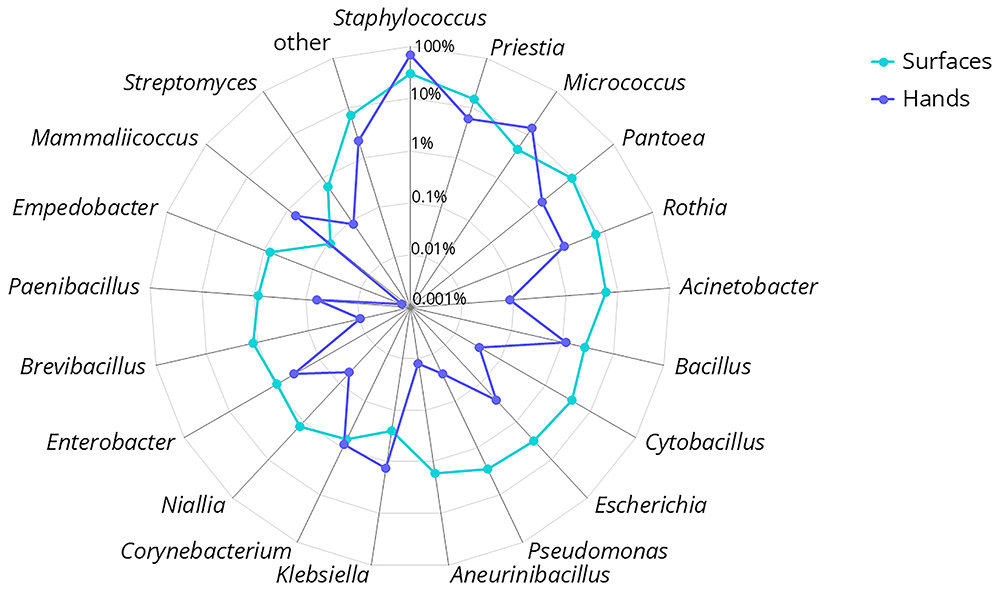
Figure 9. Comparison of the composition of surface and hand samples for the 20 most common genera.
Discussion
The composition of hand microbiome samples was consistent with the literature, being dominated by Staphylococcus species21. In our samples, we observed Corynebacterium species less frequently than reported in the literature, where they are cited as one of the three most abundant bacterial genera22.
Individual hand samples were quite variable, despite the fact that crew members lived onboard 24/7, shared meals, and spent their days in the same relatively small area. In the case of this specific ship, the season started in mid-March and ended in mid-November. Most of the crew spent the entire season onboard, without any days off. Fingertip sampling was carried out between October 30th and November 2nd, when the crew had been living together for the past 7–8 months. The differences in the composition of the hand microbiomes were remarkable. This study only recorded a snapshot of the microbiomes, so we cannot answer the question of how stable these individual compositions were.
As mentioned previously, our analysis appeared to be blind to fungi, as our DNA extraction method was not capable of breaking the fungal cell wall. A previous review states that human skin contains a diverse fungal microbiome21. In a study on a polar research ship, bacteria formed only 83.7% of the surface samples, with the second largest domain being eukaryotes (16.2%), includes fungi5. Another review claims that hand samples also contain one-quarter viruses23. Based on this, it seems that our method was also unsuitable for detecting viruses, as we detected less than 0.01% viruses in our hand samples. This suggests that from this analysis, we can only draw conclusions regarding the bacterial portion of the microbiome.
Before shifting focus from hand microbiomes to surface-associated communities, it is important to underscore the dynamic interplay that likely exists between these two bacterial reservoirs. As our data show, the composition of hand microbiomes can be highly individualized, yet the strong overlap with surface microbes suggests frequent bidirectional transfer. Hands may deposit skin-associated bacteria onto shared surfaces, which can in turn become ecological “hotspots” for microbial persistence and redistribution. This interplay underscores the value of examining both hand and surface microbiomes in tandem when assessing the potential for pathogen spread or environmental colonization in communal settings, such as a cruise ship.
ESKAPE bacteria were frequently described in both hand and surface samples. Resistance genes were also present in large numbers in the analyzed sample (#B4). On one hand, it is concerning that so many potential pathogens were found on an otherwise clean-looking, regularly disinfected surfaces. On the other hand, these pathogens were also present on hands, suggesting that we can expect them on every surface touched by people.
The main limitation of our study is that all of our sampling involved some culturing steps. Culture-based methods may bias community composition. As mentioned, we were able to detect human DNA in all samples, which indicates that, despite the culturing effect, we were still able to detect small amounts of non-dividing DNA. We made sure to be very cautious in interpreting the results, disregarding the very low percentage of detections, as we did not want to draw incorrect conclusions from possible misclassification.
Conclusions
Our findings reveal a strong overlap between the cruise ship surface microbiome and that of crew members’ hands. While it remains unclear whether this similarity is driven by the environment’s impact on the hand microbiome or vice versa, our results suggest that human-associated microbes are likely deposited onto surfaces despite rigorous cleaning regimens. This strong correlation highlights the role of these surfaces in spreading potential pathogens.
Importantly, we detected five of the seven ESKAPE bacteria on virtually all sampled surfaces, indicating that opportunistic and resistant organisms are more widespread than commonly assumed. In hospital environments, it has been documented that surfaces are often contaminated with pathogens20, but this seems to be a more general phenomenon. These pathogens may be more common in our surroundings than we previously thought. They can pose a serious threat in hospitals, not only because they easily develop antibiotic resistance but also because they can be found everywhere, continuously spread by patients, staff members, and visitors.
Moreover, although we cannot definitively assess the influence of environmental factors such as salt-laden air, frequent disinfection protocols, or air conditioning on microbial assemblages, these variables likely shape bacterial survival and transmission. Understanding how such factors interact with the human microbiome in enclosed, high-traffic settings is critical for informing more effective cleaning strategies and mitigating the spread of clinically relevant pathogens in both healthcare and non-clinical environments.
Ethics and consent
As the project coordinator (University of Thessaly) is based in Greece and the work package leader (University of South-Eastern Norway) is Norwegian, the research proposal was submitted to both the Greek and Norwegian ethical boards. The Research Ethics Committee of the University of Thessaly approved the project (decision number: 59/19.09.2022, date: Sep 19, 2022). The proposal was submitted to the Norwegian Medical Research Ethics Committee (REK), which determined that the project falls outside the scope of the Health Research Act (i.e., it is not considered a clinical study) and therefore does not require ethical approval (reference number: 562942, date: Jan 30, 2023). The Norwegian Agency for Shared Services in Education and Research (Sikt) was notified of the project and granted approval (reference numbers: 164497, date: Oct 15, 2023, and 664058, date: Mar 6, 2024).
This study did not involve human participants, human samples, or personal data. The microbiome samples analyzed were not associated with any individuals. The hand hygiene training, where fingertip samples were collected was part of an intervention study. All crew members who participated in the training provided written consent. The study was conducted in accordance with general ethical standards aligned with the Declaration of Helsinki.