Introduction
Ethanol is a widely used biofuel that provides a lower-emission alternative to gasoline1. Biofuels are produced from the fermentation of crops, a process that yields a mixture of water and ethanol. To obtain high-purity ethanol for use as fuel, the mixture must be separated. The separation of water-ethanol mixtures is typically done using distillation-based methods that require heat and high pressures, resulting in significant energy consumption2. In response to this challenge, ongoing efforts are aimed at developing more efficient separation technologies, such as isothermal filtration with microporous membranes3.
Binary mixtures like water-ethanol have been the focus of intensive research since the pioneering work by Frank and Evans in 19454. Yet, the properties of such mixtures are still under active investigation due to the complex nature of their interactions5. Ethanol is a weakly amphiphilic molecule with a hydrophilic head and a non-polar tail. When mixed with water, it exhibits numerous anomalous behaviors compared to pure solvents. For instance, the hydrophobic segments of ethanol tend to cluster together to avoid interaction with water, while the hydrophilic heads form polar interactions with water6. The competition between hydrophilic and hydrophobic interactions gives rise to several anomalies, such as incomplete mixing of water and alcohol, local microheterogeneity, and a negative excess entropy7.
When a water-ethanol mixture is in contact with an interface, an equilibrium configuration that best satisfies the competition between entropy and enthalpy is established. Next to non-polar solids such as graphene or hexagonal boron nitride, ethanol and other alcools tend to accumulate over water within the first density layer8–13. A similar surface accumulation of ethanol occurs at liquid-vapor interfaces, where the surface ethanol molar fraction can exceed the bulk molar fraction by a factor that depends, among other factors, on the mixture composition14,15. Conversely, polar interfaces like hydrophilic silica surfaces show little to no preference for ethanol adsorption over water16,17, while polar alumina surfaces exhibit a preference for water adsorption over ethanol18,19.
The molecular enrichment of ethanol over water at non-polar interfaces could form the basis for microporous membrane separation. To achieve effective large-scale separation, membranes must feature well-controlled hierarchical porosity, strong mechanical properties to with-stand the high pressures involved in separation processes, and must also be cost-effective and durable20–23. Fabricating membranes based on graphene or its derivatives, such as carbon nanotubes, is currently impractical24, but a promising alternative is nanoporous organosilica25,26. Organosilica materials are composed of nanoporous silica functionalized with organic compounds, such as methyl groups or hydrocarbons16,27. Organosilica membranes combine excellent mechanical properties with tunable hydrophobic/hydrophilic surfaces28,29, making them a compelling candidate for fluid separation applications.
In this study, the properties of water-ethanol mixtures near organosilica surfaces with varying functionalizations and structures are examined using molecular dynamics simulations. The organosilica surfaces are functionalized with a fraction rC/O of non-polar (−CH3) groups and a fraction 1 − rC/O of polar (−OH) groups. By exploring a wide range of rC/O values (from 0 to 1), we create surfaces with a broad spectrum of hydrophilicities. The composition and structure of the fluid near these surfaces are analyzed and compared with those near a graphite surface and a liquid-vapor interface.
Methods
Molecular dynamics simulations of a mixture of water and ethanol in a silica-based slit pore were performed using GROMACS30. The composition of the mixture was varied from = 0 (pure water) to = 1 (pure ethanol), where
is the total ethanol number fraction, with Neth and Nwat representing the numbers of ethanol and water molecules in the simulation. In most of the simulations presented here, the mixture contained 150 ethanol molecules and 2850 water molecules, corresponding to an ethanol number fraction = 0.05 and a mass = 0.12. For each simulation, the ethanol mass fraction in the bulk (i.e., far from the surfaces), was measured after the equilibrium was established. Generally, differs from due to the preferential surface adsorption of one species over the other, as illustrated, for example, in Figure 1A.
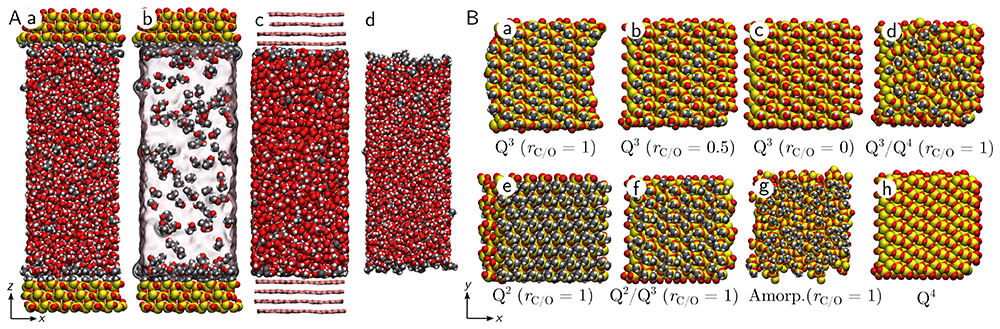
Figure 1.
(A) Side view of a water-ethanol mixture with = 0.05 confined inside an organosilica slit pore with rC/O = 0 (a and b), a graphite pore (c), and two liquid-vapor interfaces (d). Oxygen atoms are represented in red, carbon atoms in gray, silicon in yellow, and hydrogen in white. In panel b, water is represented as a continuous transparent field for clarity, and in panel c, the carbon atoms of graphite are represented as pink bonds. (B) Top view of different silica surfaces considered here: Q3 surface with rC/O = 1.0 (a), rC/O = 0.5 (b), and rC/O = 0.0 (c), Q3/Q4 surface with rC/O = 1.0 (d), Q2 surface with rC/O = 1.0 (e), Q3/Q4 surface with rC/O = 1.0 (f), amorphous surface with rC/O = 1.0 (g), and Q4 surface (h).
Unless stated otherwise, the surfaces of the slit pores were constructed from a Q3 silica material characterized by a surface group density of 5 nm−2 (Figure 1). Here, the index ‘3’ in Q3 refers to the number of bridging oxygens connected to a silicon atom. The dangling Si atoms of the silica were functionalized with non-polar (-CH3) groups at a fraction rC/O and polar (-OH) groups at a fraction 1 − rC/O. Slit pores made from Q2 silica, mixed Q2/Q3 silica, mixed Q3/Q4 silica, Q4 silica, amorphous silica, and graphite were also generated (Figure 1). For comparison, simulations of a liquid-vapor interface were also carried out. For rC/O = 0, the Q3 solid surface is hydrophilic, exhibiting a measured water contact angle of approximately 40° (Fig. S1). In contrast, for rC/O = 1, the surface is hydrophobic, with a measured water contact angle of approximately 90°31,32.
The distance between the two walls of the slit pore, h, was approximately 8 nm, while the system dimensions along the x and y axes were approximately 3 nm (Figure 1). The system was first equilibrated at ambient temperature (T = 300 K) and pressure (p = 1 atm) for a total duration of 50 ns, allowing the density profile to stabilize. During this equilibration step, the temperature was maintained using the Canonical Sampling through Velocity Rescaling (CSVR) thermostat33 with a time constant of 0.1 ps, and the pressure was maintained using an anisotropic Berendsen barostat34 with a time constant of 1 ps. Water was modeled with the TIP4P/ϵ model35, and ethanol was modeled using the OPLS/AA force field36. Cross parameters were calculated using the Lorentz-Berthelot mixing rule. The SURFACE force field was used for silica37, along with the GROMOS force field, which was used for the −CH3 groups38. The simulation scripts are available in a public online repository39.
Results
Density profiles
First, density profiles normal to the solid surface were extracted for both water and ethanol, using the MAICoS toolkit40 (Figure 2). Here, the fluid is mostly composed of water, with an ethanol mass fraction = 0.12. For one of the most hydrophobic silica surfaces considered here, where rC/O = 1, our results indicate ethanol accumulation within the first density layer next to the solid surface (blue line in Figure 2A). Our results also show that, when rC/O = 1, water is partially depleted from the first density layer (blue line in Figure 2B). By contrast, for a more hydrophilic silica surface with rC/O = 0, our results show an accumulation of both species within the first density layer (red lines in Figure 2A and B). Regardless of the surface hydrophilicity, there is a clear structuring of the fluid next to the solid interface, as indicated by the oscillations in the total fluid density ρtot = ρeth + ρwat (Fig. S2). The maximum density value is approximately 0.75 u/Å3 (about 25 % higher than in bulk) and is largely independent of the value of rC/O.
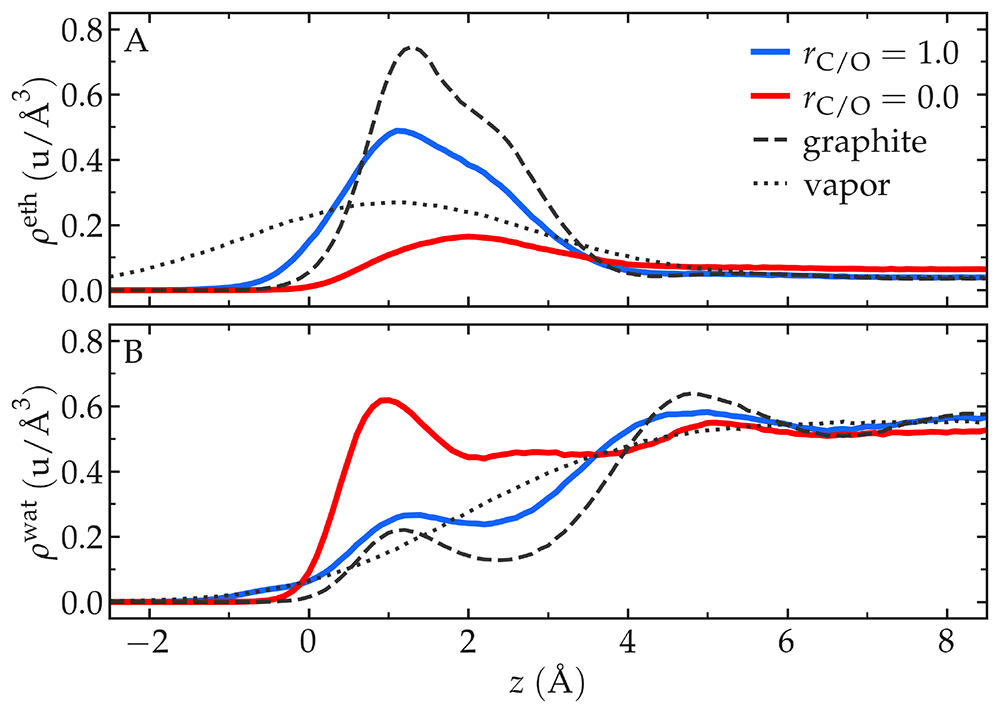
Figure 2.
Density profiles next to the interface for ethanol, ρeth, (A) and water, ρwat, (B), respectively. The position z = 0 corresponds to the Gibbs dividing plane, and the bulk ethanol number fraction far from the solid surface is ≈ 0.05. The results were obtained with Q3 organosilica surfaces with two different values for the ratio rC/O: rC/O = 1 corresponding to a hydrophobic surface (full blue line) and rC/O = 0 corresponding to a hydrophilic surface (full red line). The dashed dark line was obtained with graphite, and the dotted dark line with a liquid-vapor interface.
For comparison, density profiles were also extracted for a graphite slit pore and a liquid-vapor interface. Both the graphite slit pore and the liquid-vapor interface show an accumulation of ethanol within the first density layer (dark lines in Figure 2), in good agreement with previous works10,14,15. In the case of graphite, the maximum fluid density within the first layer reaches a higher value compared to silica surfaces: 1.0 u/Å3 (dark dashed line in Fig. S2). In contrast, silica reaches about 0.75 u/Å3. Our results also show that the first layer of fluid next to a graphite surface is thinner than that next to a silica surface (dark dashed lines in Figure 2). In contrast, the first fluid layer at a liquid-vapor interface is broader than those at any of the solid surfaces considered here (dark dotted lines in Figure 2), highlighting differences in the fluid structuring that will be analyzed below.
Surface enrichment
To quantify the surface enrichment of ethanol over water at the interfaces, we measure the ethanol mass fraction within the first density layer, which we define as
where the index ‘1’ refers to the first fluid layer adjacent to the interface. The molecules of the first density layer were identified using the ITIM algorithm of Pytim41,42 (see examples of the first four detected layers in
Fig. S3). For comparison, the ethanol mass fraction was also measured in the bulk region, defined as the fluid molecules not belonging to the four detected layers (typically corresponding to molecules located at distances greater than approximately 1.2 nm from any interface):
The ethanol enrichment factor was then defined as
> 1 indicates that ethanol is enriched in the first density layer relative to the bulk.
For the most hydrophobic organosilica surfaces considered here, and for an ethanol mass fraction = 0.12, the ethanol enrichment factor ⪆ 10 (Figure 3A). The best-performing silica surface, for which ≈ 13, is the Q2 silica surface with rC/O = 1. The Q2 silica surface has the highest surface group density of all the organosilica structures considered here (Figure 1B), a property that will be discussed below. Interestingly, for the most hydrophilic surfaces considered here with rC/O = 0, the ethanol enrichment factor exceeds one ( ≈ 3), indicating preferential ethanol adsorption even on polar surfaces. By comparison, for graphite, ≈ 14, slightly exceeding the best organosilica surfaces (dashed line in Figure 3A). At the liquid-vapor interface, ≈ 9, which is lower than that of all organosilica surfaces with rC/O = 1 (dotted line in Figure 3A).
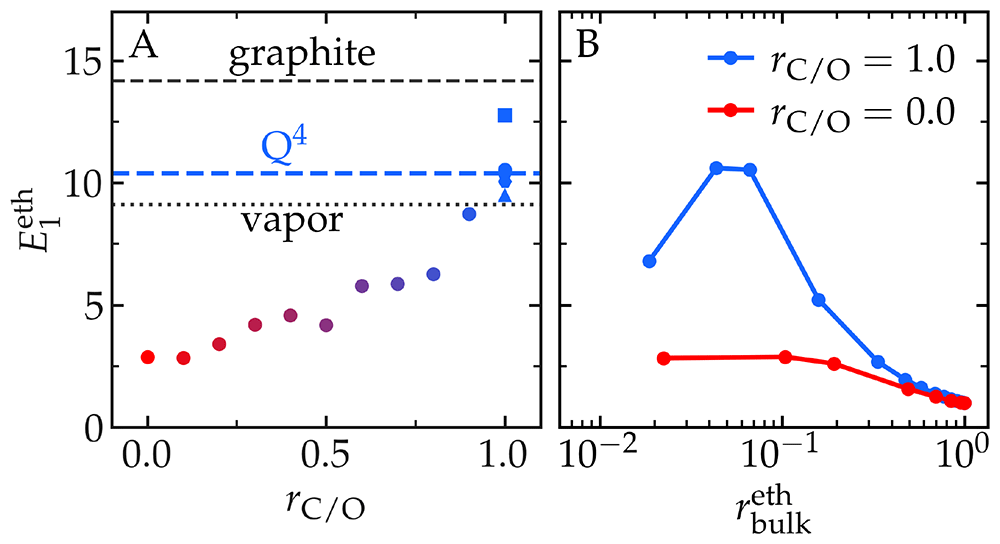
Figure 3. The ethanol enrichment factor, within the first density layer next to the interface [see Equation (4)].
A) as a function of the carbon-to-oxygen ratio, rC/O, of the organosilica surfaces, from rC/O = 0 (hydrophilic surface) to rC/O = 1 (hydrophobic surface). The ethanol mass fraction is = 0.12. The dark dashed line is in the case of the graphite surface, the blue dashed line corresponds to the Q4 surface, and the dark dotted line corresponds to the liquid-vapor interface. Disks are the default Q3 surface, the square is Q2, the pentagone is Q2/Q3, the hexagone is the amorphous surface, and the triangle is Q3/Q4. B) as a function of the bulk ethanol mass fraction, , in the case of the hydrophobic surface with rC/O = 1 (blue), and hydrophilic surface with rC/O = 0 (red).
Results for the organosilica surfaces with rC/O = 1 and varying reservoir composition show a non-homogeneous variation in , with an optimum near = 0.05 (Figure 3B). In the case of reservoirs of pure ethanol (i.e., → 1), → 1 as expected. For reservoirs rich in water (i.e., → 0), is lower than when ≈ 0.05 which reveals an enhancement of surface ethanol enrichment at intermediate concentrations. The origin of this enhancement could be the hydrophobic interactions between ethanol molecules, as will be discussed below. For the hydrophilic silica with rC/O = 0, ⪅ 2.5, regardless of the reservoir composition.
The ethanol enrichment factor was also calculated within the second density layer (i.e., ) next to the solid surface (Fig. S4 A). Our results show that is nearly independent of rC/O, suggesting that the surface properties mainly affect the fluid composition of the first density layer, with only a minor impact on the second density layer. However, with ≈ 1.1, the second layer is slightly richer in ethanol than the bulk reservoir, implying that the surface influence extends beyond the first density layer, as also seen in the oscillations of the total density (Fig. S2). Our results also show that within the second layer and in the limit → 0, is lower than 1, indicating a slight depletion in ethanol (Fig. S4 B).
The results in Figure 3A indicate that the ratio of polar to non-polar groups, rC/O, is the primary factor determining ethanol enrichment at an organosilica surface. However, Figure 3A also demonstrates that rC/O is not the sole determinant, as surfaces with rC/O = 1 exhibit a wide range of enrichment values, from approximately 9.5 (for the Q3/Q4 surface) to approximately 13 (for the Q2 surface). This suggests that additional parameters, beyond rC/O, influence ethanol enrichment. One likely candidate is the surface group density, characterized by the number of -CH3 groups per unit surface area, nCH3. This parameter ranges from 0 (Q4 surface) to approximately 9nm−2 (Q2 surface) (Figure 4A). Interestingly, the relationship between nCH3 and is non-monotonic, with relatively high ethanol enrichment observed at both small and large values of nCH3. This observation indicates that other factors, alongside nCH3 and rC/O, likely contribute to ethanol enrichment at the interface. These factors are further explored in the next section.
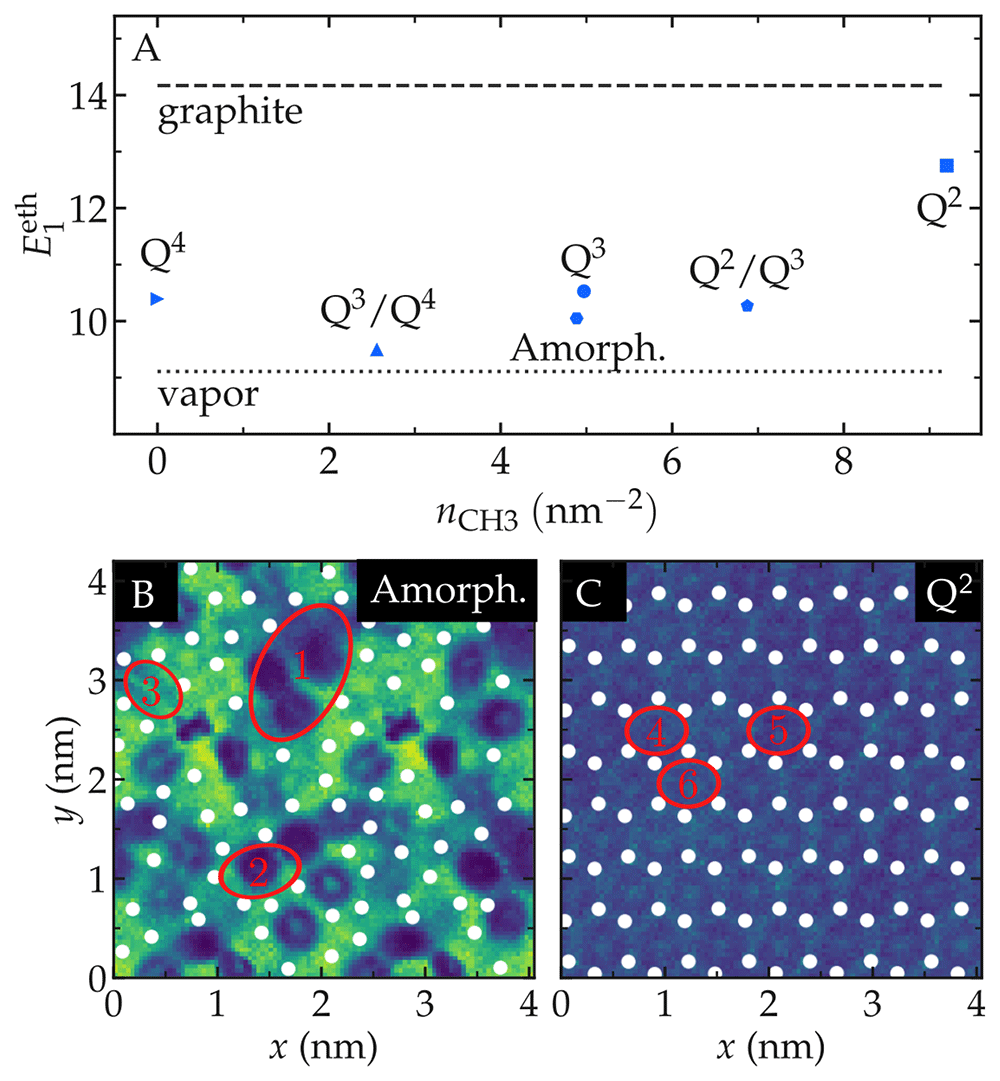
Figure 4.
A) Ethanol enrichment factor within the first density layer, as a function of the surface density of CH3 groups, nCH3, for the six organosilica surfaces considered: Q4, Q3, Q2, Q3/Q4, Q2/Q3, and amorphous. The dashed line represents for graphite, and the dotted line corresponds to the liquid-vapor interface. B–C) Density maps of the ethanol mass fraction within the first density layer, for the amorphous and Q2 organosilica surfaces with rC/O = 1. Yellow indicates a low ethanol fraction ( = 0), while blue indicates a high ethanol fraction ( = 1). White dots mark the average positions of the −CH3 groups. In panel B, red ellipses highlight a large patch (n◦1) with surface area Ap ≈ 1 nm2, and two medium-sized patches (n◦2 with Ap ≈ 0.33 nm2 and n◦3 with Ap ≈ 0.28 nm2). In panel C, all patches are of similar size (Ap ≈ 0.23 nm2).
Surface -CH3 patches
The results obtained with different types of silica surfaces (Figure 4A) indicate that while the number of surface groups, nCH3, is a useful indicator of surface efficiency in separating ethanol and water, it does not fully account for the preferential adsorption of ethanol. Notably, the Q4 surface achieves reasonable a value for despite having no surface groups. We hypothesize that surface atomic roughness and the specific organization of surface groups play significant roles in the ethanol enrichment (Figure 1B). To test this hypothesis, -CH3 patches were defined as the largest possible ellipses connecting neighboring −CH3 groups within the (x, y) plane (red ellipses in Figure 4B, C). We found that the most heterogeneous surfaces considered here, such as amorphous and Q3/Q4, exhibit −CH3 patches with surface areas as large as Ap ≈ 1nm2, alongside smaller patches with Ap ≈ 0.3nm2. In contrast, more regular surfaces, like Q2, show only smaller patches ranging in size from 0.2 to 0.3nm2 (Figure 4B, C and Fig. S5).
The ethanol mass fraction, was measured within individual patches (Fig. S6). Although no clear relationship between patch size and local ethanol enrichment could be established, certain trends emerged. Large patches with Ap > 0.4nm2 consistently exhibit high fraction , which aligns with the high value observed for the Q4 surface despite its lack of surface
groups. Conversely, all patches with low ethanol fraction (i.e., < 0.8) fall within the size range of 0.1nm2 < Ap < 0.3nm2. However, many patches within this range, including all patches from the Q2 and Q3 surfaces, exhibit high ethanol fraction (see for example patches n◦2 and n◦3 in Figure 4B). These findings suggest that while patch size may play a role in local ethanol enrichment, a more detailed characterization of the atomic structure is required. Such characterization could involve surface topography (e.g. positions of −CH3 groups along the z axis normal to the surface) and/or the distribution of local surface dipole moments.
Hydrogen bonding
To further caracterize the state of water-ethanol mixtures within the first layers next to the solid surfaces, the number of OH· · · O hydrogen bonds per molecule, nHB, was measured31. Our results indicate that for a fixed reservoir composition ( = 0.12), the number of hydrogen bonds per ethanol molecule in the first density layer decreases with the enrichment factor (Figure 5A)43. On surfaces with low (i.e., hydrophilic surfaces), the number of hydrogen bonds per ethanol molecule is approximately 2, similar to what is measured in bulk. However, on surfaces with high , this number decreases to 1.75. A qualitatively similar trend is observed for water, for which nHB decreases from approximately 3.1 to 2.6 as increases. This reduction can be partially attributed to the absence of hydrogen bonds between molecules and non-polar surface groups (Fig. S7).
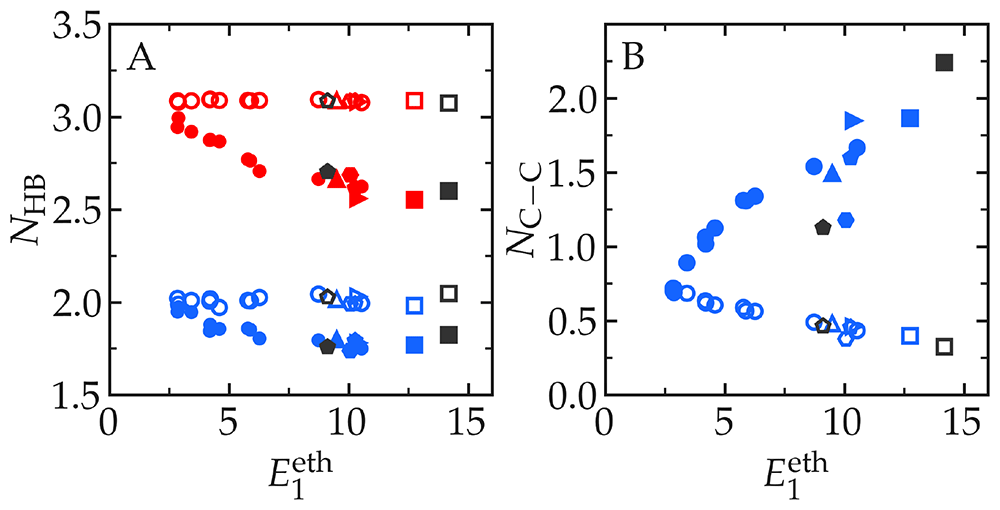
Figure 5.
A) Number of OH· · · O hydrogen bonds, NHB, per ethanol (blue) and water (red) molecule as a function of the enrichment factor . Filled symbols represent measurements from the first density layer, while open symbols are from the bulk. Symbols correspond to different surfaces: disks for Q3, squares for Q2, pentagons for Q2/Q3, hexagons for amorphous, upward triangles for Q3/Q4, and rightward triangles for Q4. The gray pentagones are results from the vapor interface, and the gray squares are from graphite. The ethanol mass fraction is = 0.12. B) Number of neighboring carbon atoms per carbon atom, NC-C, from ethanol molecules in the first density layer (filled symbols) and in the bulk (open symbols) as a function of . Only carbon atoms located within a distance r < 4.6 Å and from different molecules are considered, see Ref. 31.
Results from Figure 5A indicate that for both water and ethanol, adsorbing at non-polar surfaces implicate a reduction in the number of hydrogen bonds compared to the bulk. That reduction is however slightly larger for water (about 16 %) than for ethanol (about 12 %). In addition to the value of nHB, there is a well known advantage associated with concentrating the ethanol molecules at the interfaces: it mitigates the disturbance to the hydrogen bond network in the fluid by allowing water molecules to form more hydrogen bonds with themselves7,44. To caracterise this effect, we counted the number of neighboring ethanol carbon-carbon atoms, NC-C. Our results show that, for low (i.e., hydrophilic surfaces), NC-C ≈ 0.75 for both ethanol molecules from the bulk and the first density layer (Figure 5B). This indicates that in the case of the most hydrophilic surfaces, there is no visible clustering of ethanol molecules within the first density layer. As increases, NC-C from the first density layer increases up to almost 2, while NC-C from the bulk decreases below 0.5. Interestingly, all data points in Figure 5B fall on the same master curve, except for the vapor interface and the amorphous silica surface, for which NC-C is lower, suggesting that the specifity of the interface can favor or hinder the contact between ethanol carbon-carbon atoms, with possible impact on the selective adsorption.
Discussion
Our results for varying reservoir composition reveal a maximum in the ethanol enrichment at an ethanol mass fraction of = 0.05, in the case of organosilica surfaces with rC/O = 1 (Figure 3B). This suggests that collective effects may enhance surface enrichment. One likely contributor is the hydrophobic interaction between clustering ethanol molecules5,45, an effect that is expected to only be significant at intermediate ethanol concentrations and to diminish as → 0. Indeed, the typical number of neighboring ethanol carbon-carbon atoms, NC-C, shows an inflection point near ≈ 0.1 (Figs. S8-S9). This indicates that, below , there is a substantial decrease in ethanol-ethanol hydrophobic interactions within the first layer. Such a decrease aligns with the observed reduction in ethanol enrichment as → 0. These findings suggest that membrane separation based on the preferential adsorption of ethanol over water could lose efficiency in the limit of vanishing ethanol concentrations.
The surfaces considered in this study exhibit varying degree of atomic roughness, ranging from the atomically smooth graphite to the disordered amorphous silica surface (Figure 1). These differences in surface roughness lead to distinct structuring of molecules within the first density layer, as revealed by 1D (Figure 2) and 2D (Figure 4) density profiles, the number of neighboring ethanol carbon-carbon atoms NC-C (Figure 5B), as well as orientation distribution of molecules within the first layer (Fig. S10). However, despite these differences, certain generic trends emerge across all surfaces. For example, the number of hydrogen bonds per molecule, nHB, from all systems follows the same master curves (Figure 5A). Additionally, the thickness of the first density layer, σ1, measured as the variance of the density profile ρ1(z) [see Eq. (S2)], decreases with increasing ethanol enrichment factor, (Fig. S11). In other words, surfaces with thinner first density layer tend to exhibit better ethanol-water separation performance.
Although our results show that silica surfaces decorated with −CH3 are not as effective as pristine graphite for selectively adsorbing ethanol over water, they also reveal that even the least effective surfaces considered here (i.e., the Q2/Q3 and amorphous surfaces) show an ethanol enrichment factor of about 10 for = 0.12. This indicates that the enrichment of ethanol at hydrophobic silica surfaces is quite robust and should be measurable with any nanoporous silica-based material primarily decorated with non-polar groups, regardless of its structure.
Conclusion
In conclusion, we used molecular simulations to study the preferential adsorption of ethanol over water at organosilica surfaces. Our results reveal that the primary predictors of an organosilica surface ability to separate ethanol from water are the type and density of surface groups. The organosilica surface exhibiting the highest ethanol enrichment is a Q2 surface fully decorated with non-polar groups (rC/O = 1). This surface features a high density of -CH3 groups (nCH3 ≈ 9nm−2), and performs nearly as well as pristine graphite in preferentially adsorbing ethanol over water. Our study also highlights the non-trivial influence of surface atomic structure on ethanol enrichment. Surfaces with disordered groups, such as amorphous and Q2/Q3 surfaces, exhibit the poorest performance. This reduced enrichment could arise from geometric effects, as smaller water molecules may more readily adapt to rough landscapes (thereby decreasing ethanol enrichment), or from an increased local polarity associated with disordered surfaces.








