Introduction
Cities, together with their inhabitants, are vulnerable to climate challenges triggered by the force of heavy and rapid urbanisation and industrialisation. In the current era, the share of the urban population within the world population is increasing rapidly. For this reason, urban areas are becoming more vulnerable to climate change leading to pressures on the environment like extreme weather events, droughts, massive floods, heat island effect or resource depletion. Thus, devoted efforts for the mitigation of these impacts are of the utmost importance. This is directly linked with European Union (EU) target to become carbon neutral by 2050. In that respect, various voluntary movements, initiatives (e.g. the Global Covenant of Mayors (GCoM)) as well as governmental and inter-governmental efforts are addressing different urban challenges to make cities sustainable and climate-resilient1. In pursuit of slowing down anthropogenic greenhouse gas (GHG) emissions to the atmosphere and mitigating urban impacts of climate change in support of global attempts to fight climate crisis, all urban decision makers are urged to investigate, identify, and propose solutions for the urban challenges affecting their cities.
The effort to harness the regenerative potential of nature is crucial to move forward with the United Nations Framework Convention on Climate Change (UNFCCC)’s five action areas of “Learn, Access Technical Support, Commit, Finance and Unite”1 and progress towards achieving Sustainable Development Goals (SDG). The cities need to be in close contact with nature to eliminate challenges including SDG13 – Climate Change, SDG11 - Sustainable Cities and Communities, SDG 6 – Clean Water and Sanitation, SDG 3 – Good Health and Well-being and SDG 3 – Zero Hunger and protect the balance between urban development and environment for sustainable cities.
Sustainable urban management approach aims to deliver viable and credible solutions to cities and their inhabitants, who are continuously facing environmental impacts and urban challenges. The applicability of these solutions, specific to the challenge and scale, depends on the robustness and sustainability of the solution in hand.
Urban challenges created by climate change could be tackled via nature based solutions (NBS) defined as “solutions that are inspired and supported by nature, which are cost-effective, simultaneously provide environmental, social and economic benefits and help build resilience. Such solutions bring more, and more diverse, nature and natural features and processes into cities, landscapes and seascapes, through locally adapted, resource-efficient and systemic interventions.”2. According to International Union of Conservation of Nature (IUCN), which launched a global standard for NBS in July 2020 including a standardised approach and means of assessing the strength of an NBS, NBS addresses societal challenges through the protection, sustainable management and restoration of ecosystems, benefiting both biodiversity and human well-being.
In the UN Climate Action Summit of 2019, NBS was proposed as one of the key themes aiming to foster its application by means of political and financial supports. According to repositories such as Oppla and Nature4Cities Platform, there are already numerous examples of NBS implemented all around the world like green spaces in nearly every developing and developed city; green wall application (climate mitigation and adaptation measure) in Vienna (Austria); cosmetic factory filtration gardens (wastewater treatment) in Benevide (Brazil); urban planning strategies like in Gardanne (France) to establish scientific knowledge on soil quality; ecological restoration with insect hotels in Lille (France); or applying NBS in harmony with society by collaborating with indigenous people to sustain the grassland health against fatal wildfire in Australia.
From the perspective of stakeholders (e.g., municipalities, decision makers, urban planners, policy makers, architects, environmental engineers and/or experts, practitioners), it is necessary and useful to have an assessment framework to identify and govern different phases of the NBS throughout its life cycle in the local context and be informed about the added values obtained from these solutions. Performance indicators are necessary metrics for NBS in the course of short-, medium- (mitigation action) and long-term (adaptation action) monitoring to quantify and highlight their benefits together with their trade-offs. Knowledge, created by application of performance indicators, is essential to map the current conditions of the urban environment, monitor them over time and, if possible, gain insights on predictive performance in the future. This is an important process to assist governance, establish a strategy and action plans and bring NBS projects closer to finance. Moreover, this process, especially when applied iteratively, helps lower uncertainty and favour “adaptive management” in urban strategies and actions. Data generated from monitoring supports stakeholder engagement for a more sustainable urban management strategy by providing evidence and knowledge for NBS, establishing the interaction between science, business, and civil society.
Assessing potential environmental impacts of the proposed or selected NBS is essential for the decision makers and urban planners, both for the design and implementation phases. The hazards and impacts created by this urban challenge can arise at different spatial scales, which are categorized as object, neighbourhood, and city scale within the scope of this study. To mitigate adverse urban impacts through deployment of suitable NBS, the decision makers and regulating bodies will need to assess the effectiveness of NBS during two phases of the NBS projects. The first is during the selection of the NBS to be implemented from a set of alternatives, which are capable of mitigating the urban issues with varying effectiveness, while the second is during deployment of the selected NBS.
In a nutshell, the main aim of this article is to establish an assessment framework, which fosters the urban planning and implementation periods with respect to NBS projects and forms a linkage between adaptation actions with urban sustainability policies by making use of monitoring data that enables predictive estimation of future scenarios. This study is beginning to pave a strategic way for an NBS life cycle and address the gap related to planning and implementation of NBS projects by quantifying and indicating their environmental performance. Ultimately, this framework aspires to determine a proper strategy for NBS life cycle stages and improve system transparency for multiple NBS components. This undertaking provides critical and operational insights for performance of the NBS over time by means of an analytical assessment under the umbrella of environmental assessment framework.
Environmental assessment framework
This section outlines the general notion of the proposed assessment methodology for the analysis and evaluation of the environmental aspects using a quantitative and dynamic method. This method serves the purpose of improved decision support during the planning phase of NBS projects for the selection among different NBS alternatives of the project with the highest potential benefits. It is also targeted to help the performance evaluation of NBS during the implementation phase in a dynamic manner as explained in ’Performance tracking methodology and benefits’. In order to accomplish these two objectives, a two-stage evaluation strategy is developed involving the establishment of the baseline through indicator-based assessment of urban processes and urban flows followed by a dynamic analysis of these indicators revealing benefits and/or trade-offs with the intention of performance monitoring.
The proposed methodology is comprised of several components to be used within different stages of the NBS project life cycle. To begin with, it utilizes material and energy flows by considering urban metabolism as a tool for urban modelling and quantitative analysis through urban flow indicators to understand the state of the system. Later, repetitive measurements during monitoring are evaluated with the same indicators in a dynamic manner to introduce the performance of the NBS by tracking these changes in the selected indicators over time.
The assessment framework seeks to determine NBS performance through temporal and spatial observations based on relevant indicators. Data for these indicators are obtained with the help of measurements and observations where these data later enable the decision makers to deduce changes in the state of the environmental issues over time. This framework is important for setting the baseline for decision making and for understanding how to achieve certain targets through NBS selection or implementation against varying urban challenges. Urban processes, flows and indicators are to be determined in parallel with dynamic observation so that temporal observations for quantification can be made using the same system boundary as the NBS. Using the indicator-based quantification approach, decision makers can apply performance tracking to see how the metrics are changing throughout the lifetime of the NBS.
By means of the indicator-based and dynamic assessments, decision makers can make critical judgements to decide whether an intervention is required or not to achieve their needs and related targets. Consequently, strategic decisions can be made using these results acquired from the assessment.
Indicator-based quantification approach
Urban metabolism
The environmental assessment framework involves two interrelated sets of activities comprising the identification of system boundaries most appropriate for supporting NBS decision making processes, and an indicator-based quantification approach for analysis of these system boundaries, supporting a life cycle approach.
Identification of system boundaries relies on a simplified urban metabolism approach. Urban metabolism is a concept based on the analogy for the technical and socio-economic processes in cities resulting in resource consumption and waste generation, bearing a resemblance to the nutrient intake need, energy demand, consequent growth and production of metabolic wastes of a living organism3. It brings together a broad range of quantitative methods attempting to conceptualize urban areas as organisms, requiring goods and energy to maintain functionality and support growth, while emitting waste as a by-product4. Therefore, urban metabolism considers the quantification of inputs, outputs and storage of energy, water, nutrients, materials and wastes within urban regions. Beside the articles addressing flow analysis for environmental assessment, some studies focus on urban metabolism as a defining feature for cities. Rosado et al. (2016) determines "urban metabolism profiles" of cities based on benchmarks defined for resource consumption and material flows and discusses three cities (Stockholm, Malmö and Gothenburg) in terms of dependency of their economies (in other words self-sufficiency) and pressure on the environment5. Another approach using the urban metabolism concept is linking metabolic flows and aspects of urban quality such as air pollution or water quality for choosing the most appropriate policies and making conscious trade-offs between local and system-wide consequences6. Indicators of health, employment, income, education, housing, leisure and community activities were included in the urban metabolism models and subsequently connections between urban metabolism and quality of life were established3,7,8. In addition to scientific literature, there are some projects that utilize the urban metabolism approach. For example, Sustainable Urban Planning Decision Support Accounting for Urban Metabolism Project (BRIDGE) funded under Theme 6: Environment of FP7 Programme Project also aims to present knowledge on energy, carbon and water exchanges of the urban biophysical system through a conceptual framework of urban metabolism9. The main goal of that project was to develop a decision support system (DSS) to be used for modifications to the metabolism of urban systems towards sustainability. The analysis of urban flows in the BRIDGE model is built upon the material and energy balances following the state-of-the-art methods.
As seen in the examples, the study of urban metabolism not only allows us to understand mass and energy flow interactions between different subsystems but also to develop strategies for cities converging towards sustainable and circular ecosystems resembling natural ones. By tracing flows of water, energy, nutrients and materials through an urban system, close loops can be designed, thus reducing the input of resources and output of wastes, consequently improving the degree of self-sufficiency and resource efficiency in cities3. NBS, by re-naturing cities, serve this function of closing the loop in multiple ways. Therefore, urban metabolism becomes an appropriate approach to model, analyse and quantify the benefits of NBS as well as evaluate possible trade-offs. Prevalent urban metabolism assessment methodologies include material flow analysis (MFA), energy approach, multi-regional input-output analysis and other variations based on these methods such as energy flow analysis and ecological network analysis10–12. Among these, MFA is broadly implemented in the field of resource efficiency studying flows such as water, energy, food, waste, or pollutants to provide information on efficiency indicators for the above-mentioned fields in addition to environmental releases5,13–20. This article employs the MFA method and establishes links with life cycle assessment (LCA) for quantification of urban metrics (indicators) considering its practicality to identify potential inefficient use of natural resources, energy, and materials within the system boundary.
Indicator-based quantification methodology
In order to perform a quantitative indicator-based assessment, certain urban datasets are needed. This is where the urban metabolism models come into play. They enable the assessor to conceptualize the urban processes and associated flows, which should be quantified to obtain necessary indicator results for the decision-making process about NBS.
To initiate the development of the indicator-based quantification methodology, this study follows the steps shown in Figure 1.
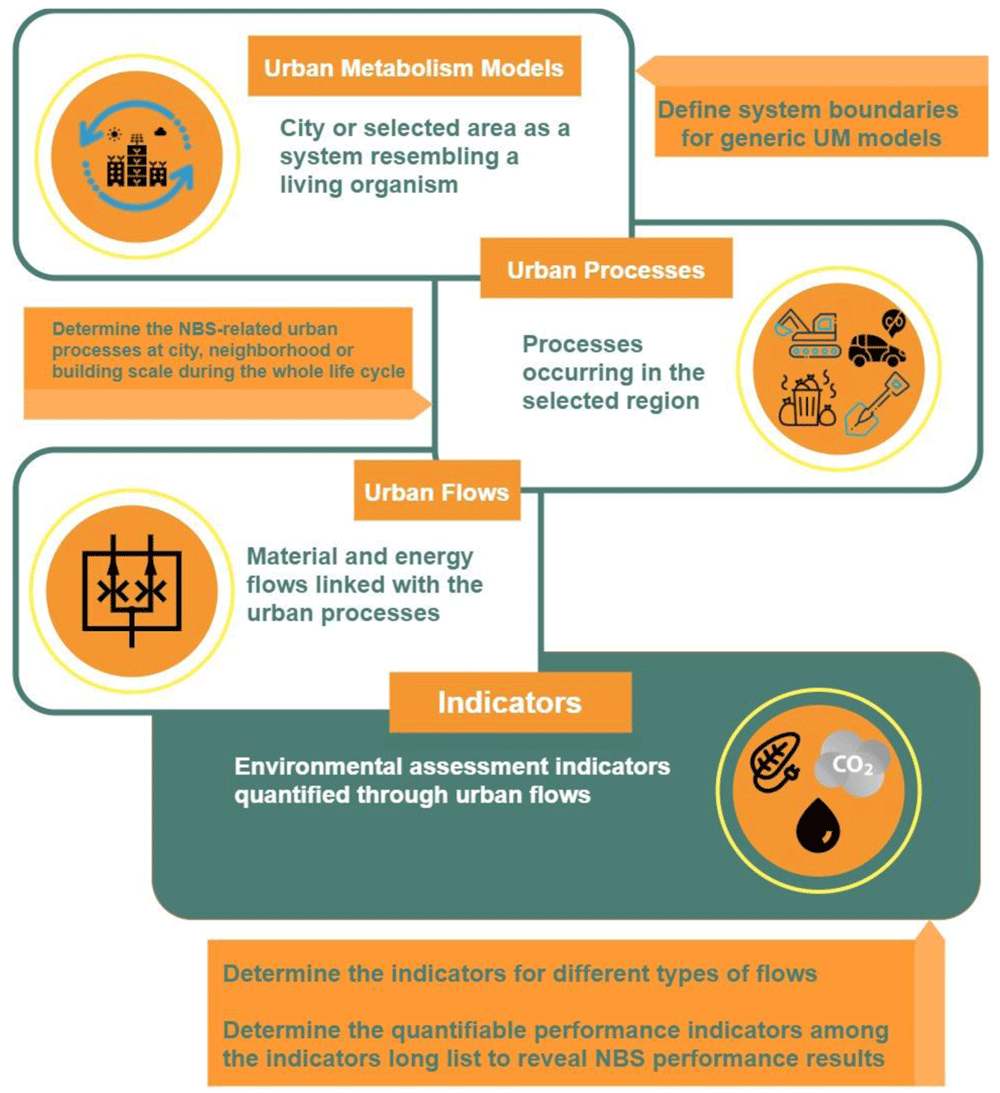
Figure 1. Generic approach for generating urban indicators using urban metabolism models NBS, nature based solutions; UM, urban metabolism.
High volumes of data might be necessary for cities to evaluate impacts of and solutions to different urban challenges. However, data may not be available readily or obtaining data might be costly. For this reason, it is proposed to streamline the data collection for environmental assessment and derive “headline” indicators for the NBS in question among the potential list of indicators. The concept of headline indicators gives decision makers the ability to concentrate on and process only the relevant information regarding their specific NBS projects, reducing the time needed for data gathering and processing as well as required efforts for quantification. Another significant aspect for the selection of headline indicators is that it allows us to focus on the indicators that relate to the processes and flows that show changes following NBS implementation. Headline indicators will enable the stakeholders to evaluate the performance indicators where changes occur.
For the selection of headline indicators and definition of system boundaries for each NBS, the steps below were followed:
• Determination of NBS impacts at object, neighbourhood and city scales
• Determination of headline indicators among the generic indicator list using the identified major environmental impacts resulting from urban processes and relevant flows21.
• Establishment of system boundaries for modelling and assessment: the headline indicators provide the set of information that is crucial for environmental assessment of NBS. Upon determination of headline indicators, it is necessary to establish the system boundaries for analysis. The system boundary is comprised of the urban flows and processes of urban metabolism. These system boundaries should be inclusive of different geographical scales, allowing environmental assessment at object, neighbourhood, and city scales.
Urban processes and process related urban nexus
As a first step, urban processes are identified in order to facilitate the establishment of an urban metabolism model. Elaborating the NBS related processes is the starting point for the quantification of the environmental assessment. The processes are selected keeping the life cycle of NBS in mind where all the possible processes that can relate to the environmental assessment are listed for different life cycle phases. To do so, it is important for the decision makers to consider not just the benefits of the NBS under consideration, but also potential negative environmental impacts caused by the implementation of that NBS. For example, for a given public urban green space (PUGS), although the biomass will act as a natural carbon sink, there will inevitably be some irrigation needs, resulting in energy, material, and water consumption. For evaluating such trade-offs, the proposed methodology not only considers the carbon sequestration process but also addresses the water and electricity usage processes for irrigation as well as other background processes like treatment of irrigation water. Potential urban processes are investigated using this approach and the appropriate processes are selected.
Identification of these processes is interrelated with the input and output flows of the system. It is challenging to decide on the final list of processes without integrating the material and energy flows within the selected system boundaries since this is an iterative process. At this point, the MFA approach becomes a part of the environmental assessment since both the urban data and indicators are represented through material and energy flows of the urban systems.
The urban flows consist of input flows such as energy demand, output flows such as GHG emissions released and finally a special set of flows avoided with respect to resource and energy consumption or emissions and waste. These process-related flows are defined to underline the impact of avoided burdens created by implementation of NBS. Furthermore, for the same type of material flow, certain distinctions were made in order to allocate flows to different urban processes with ease. For instance, when addressing “water” flows, a differentiation is made between water supplied from a municipal supply system or from alternative sources as well as differentiating water flows into water for human consumption, irrigation, and maintenance. Similar categorisation is performed for chemicals such as fertilizers or pesticides depending on them being of organic origin or chemical origin, which would make a difference during implementation of certain NBS in terms of impacts.
It is possible that similar indicators, urban flows, and processes are valid for many different types of NBS. This enables us to set up a starting structure including these flows and processes. In some cases, a given indicator can be utilized for multiple processes. A good example for such a case is the utilization of energy demand for cooling of buildings, which is employed during the estimation of building energy needs, energy efficiency and cumulative energy demand.
Urban data necessary to estimate the indicators are represented through material and energy flows of the urban systems. Some examples of these material and energy flows comprise energy, traditional urban water systems and GHG emissions including emissions of carbon dioxide, methane and other GHGs that are directly emitted from a city. Together with the direct releases of GHGs, embedded carbon, for instance in construction materials or carbon sequestered in urban vegetation, is also taken into account in urban metabolism studies22.
A compilation of potential and relevant urban flows is listed in Table 1, which is a non-exhaustive list including the material and energy flows linked with urban processes for the NBS in question.
Table 1. List of identified urban processes and urban flows for nature based solutions (NBS).
| Urban flows | Relevant urban processes |
|---|
| Carbon sequestered | Carbon uptake by plants |
| Greenhouse gas emissions removed | Technological carbon capture and storage (CCS) solutions, emissions avoided (by reducing
current practices or operations), best management practices |
| Food supply | Urban and conventional farming, fuel consumption, irrigation processes, production and
transportation of agricultural chemicals, consumption of resources for maintenance,
water consumption |
| Wastes including waste recycling | Recycling processes, composting, incineration processes, energy generation, water
pumping and treatment |
| Biomass and compost | Composting, energy generation, fuel consumption, water consumption, transportation |
| Chemicals including fertilizers, herbicides, water treatment etc. | Manufacturing processes for chemicals, transportation of chemicals, treatment processes
for medium contaminated with chemicals, spreading, water and wastewater treatment |
| Construction materials in and out | Manufacturing of construction materials, transportation of construction materials,
decommissioning and reuse |
| Nutrients to soil or water | Agricultural processes, urban farming, manufacturing processes, NBS maintenance |
| Water flows | Groundwater infiltration, transportation of chemicals, manufacturing of chemicals,
water pumping from groundwater, energy generation, water and wastewater treatment,
evapotranspiration, flooding control, storm water reuse |
| Energy into and out of the system | Renewable electricity production, energy generation, non-renewable electricity production |
| Fuel consumption released/avoided | Fuel extraction, fuel refining and processing, fuel transportation, fuel combustion, fuel
consumption |
In Table 1, all flows are found to be appropriate for object, neighbourhood, and city scales to varying degrees. Applicable urban flows can be selected for each specific NBS type.
To better illustrate the selection of relevant urban processes for a given NBS type, an exemplary NBS, PUGS, is selected in this study as it is a very common NBS implemented in almost all cities. PUGS address topics mainly related to climate where they provide solutions and/or trade-offs to the sub challenges throughout their whole life cycle, including climate mitigation and urban water management among other co-benefits such as social positive contributions. They act as natural carbon sinks capturing atmospheric CO2 during natural lighting hours. Potential processes expected to occur in establishment and operational phases are elaborated considering possible positive and negative environmental impacts resulting from the implementation of the NBS. From a life cycle perspective, once a public park NBS is selected by the decision makers, park construction takes place, and trees and plants are managed during the operational phase. Additional operational phase processes include the use of water for irrigation of the plants and trees, people visiting the park, waste and wastewater generation from the visitors, and transportation of visitors to the park, etc. After the operational phase, at the end-of-life of the park, demolition processes occur. All these processes are considered separately from their own life cycle aspect and included in the system definition. For example, for visitors coming with their vehicles, fuel combustion from the transportation process is taken into account since there will be some emissions from this activity that result in adverse environmental impacts. In addition to that, other life cycle processes like fuel extraction, fuel refining and processing, fuel generation and fuel transportation to the stations are also addressed.
Continuing with the exemplary NBS, PUGS, the relevant urban processes are discussed and urban flows are identified in Table 2.
Table 2. Urban processes and urban flows for a large urban public park.
| Flow | Urban processes within the system boundaries |
|---|
| Carbon sequestered | Carbon uptake by plants |
Energy demand for irrigation, water
treatment, water supply | Fuel extraction and processing, electricity production from renewable sources, electricity
production from non-renewable sources |
| Chemicals used for water treatment | Water treatment, wastewater treatment, manufacturing processes for chemicals,
transportation of chemicals |
| Infiltration to groundwater | Recharge of water into groundwater resources, increased evapotranspiration, retained
water volumes, reduced and delayed peak flows |
Pesticides, herbicides, insecticides (chemical
and organic) | Manufacturing, transportation of chemicals, agricultural applications |
Water for maintenance and irrigation and
operation | Pumping operations, energy generation, water treatment if necessary |
| Fuel consumption for vehicles | Fuel extraction, fuel refining and processing, fuel transportation, fuel combustion |
| Greenhouse gas (GHG) emissions released | All GHG emitting processes including combustion, energy generation, transportation,
biogenic carbon releases |
Urban metabolism indicators relevant for environmental assessment
Following the elaboration of the flows through urban metabolism models, the next step of the assessment is to estimate indicators in a quantitative way by using the relevant urban flows. Using quantitative and traceable results, decision makers can choose the best applicable NBS for their interest and invest in them accordingly. Moreover, by repeating the measurements of indicators over time, dynamic monitoring assessment becomes applicable. For the derivation of indicators, MFA and LCA approaches are used as in the previous step to generate the urban data necessary for quantification.
The assessment framework for this study focuses on identifying the flow-based indicators that can be estimated by quantification of urban material and energy flows. These urban flow indicators can also be regarded as MFA indicators, which serve the life cycle impact assessment (LCIA) stage of LCA. Impact indicators at this level are associated with possible environmental damage and trade-offs. In this study, nine indicators were shortlisted as flow-based urban indicators for the environmental assessment methodology addressing urban challenges in the field of climate and resource efficiency23. However, it is possible to enlarge the list of indicators in case there are additional urban challenges and impacts such as biodiversity, air quality, circularity etc. In this situation, additional processes and flows should also be taken into account during the assessment.
Among the urban flow indicators selected for this study, headline indicators can be generated for selected NBS use cases by the decision makers. Headline indicators allow the decision makers to streamline the environmental assessment towards a specific NBS. Determining the headline indicators paves the way to identifying the smallest set of indicators and datasets capable of providing the desired information. In this study, a long list of potential indicators has been evaluated and the most applicable indicators among the list of indicators described in Deliverable 1.1 “NBS multi-scalar and multi-thematic typology and associated database” of the Nature4Cities Horizon 2020 project23 were selected and adapted as the headline indicators as shown in Table 3.
Table 3. Urban challenges and short list of environmental indicators.
| Topic | Urban challenge | Indicator(s) |
|---|
| Climate | Climate issues | Annual CO2 sequestration |
| Avoided greenhouse gas emissions |
| Resource | Resource
efficiency | Energy efficiency |
| Per capita food production variability |
| Cumulative energy demand |
| Water scarcity |
| Raw material efficiency |
| Specific waste generation |
| Efficiency of valorisation as a result of recycling processes |
These indicators can be applied to various groups of NBS that can be assessed using the list of indicators presented in Table 4. There are two major NBS groups, one dealing with tangible solutions and the other with intangible solutions. The first one relates to objects/shapes/physical projects or design/construction interventions and the second with strategies, actions and management23. Objects/shapes/physical NBS types include NBS that can be linked with interventions on the ground, to buildings and structures or water management. On the other hand, the strategies/actions and management category include management of urban spaces, waste management, urban planning strategies etc.
Table 4. Applicable headline environmental indicators for different types of NBS.
| Categories | NBS types | Environmental indicators |
|---|
Annual CO2
sequestration | Avoided
GHG
emissions | Energy
efficiency | Raw
material
efficiency | PCFPV | Specific
waste
generation | ERP | Cumulative
energy
demand | Water
scarcity |
|---|
| On the ground | Parks and gardens | √ | √ | √ | √ | | √ | | √ | √ |
On the
buildings | Green roofs | √ | √ | √ | √ | √ | | | √ | √ |
On the
buildings | Vertical structures
(green walls and facades) | √ | √ | √ | √ | √ | | | √ | √ |
| On the ground | Structures associated with urban
networks | √ | √ | √ | √ | | | | √ | √ |
| On the ground | Structures characterized by food
and resources production | √ | √ | √ | √ | √ | √ | | √ | √ |
| Water | Natural and semi-natural water
bodies and hydrographic networks | √ | √ | √ | √ | √ | | | √ | √ |
| Water | Constructed wetlands and built
structures for water management | √ | √ | √ | √ | √ | | √ | √ | √ |
| Strategies | Waste management | | | | √ | | √ | √ | √ | √ |
| On the ground | Systems for erosion control | √ | √ | | √ | | | | √ | √ |
| On the ground | Works on soil | | √ | √ | √ | √ | √ | √ | | |
| On the ground | Use of fauna | | √ | | √ | √ | √ | | √ | |
| Strategies | Urban planning strategies | √ | | √ | √ | √ | √ | | | √ |
| Strategies | Direct human interventions (e.g.,
sustainable use of fertilizers) | √ | √ | √ | √ | √ | √ | √ | √ | √ |
| On the ground | Ecological restoration | √ | √ | √ | √ | | | | √ | √ |
PUGS indicators are selected such that they will be addressing climate and resource topics in terms of carbon sequestration, GHG emission avoidance and energy efficiency. Other potential benefits that are not included in this example are comprised of reduced removal of air pollutants, change in organic matter content of the soil, creation of surfaces for infiltration, flood protection, water supply through infiltration, increased biodiversity, etc. On the other hand, there may be certain trade-offs that also need to be considered during the implementation phase. Some trade-offs are the increased transportation demand as a result of the recreational effect on the population, water usage for maintenance or use of chemicals as plant care ingredients. Taking into consideration these positive and negative impacts, the following headline indicators are selected: annual CO2 sequestration, avoided GHG emissions, energy efficiency, raw material efficiency, water scarcity, and cumulative energy demands.
Figure 2 displays the system boundaries for the case of a PUGS. Decision makers or experts can apply this approach under the umbrella of environmental assessment framework for different NBS types as well.
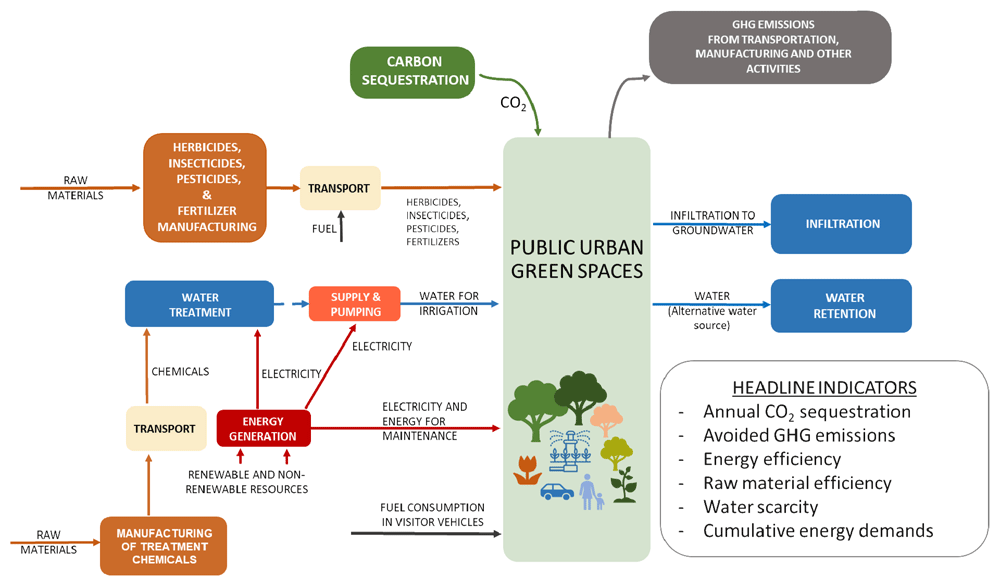
Figure 2. System boundaries developed for a public urban green space with the urban management – life cycle assessment - material flow analysis approach.
Finally, to better visualize the steps of the indicator-based assessment approach and present the methodology in a concise way, Figure 3 is generated. Different urban flows and processes can be seen in Figure 3 where relevant urban challenges and environmental indicators are also addressed. In this figure, processes highlighted with green are those that generate positive environmental impacts while orange indicates the processes that generate trade-offs. Still, it is important to consider the fact that NBS implementation does not necessarily have environmental impacts only. In other words, an NBS with trade-offs in terms of environmental impacts can still lead to benefits from social or economic aspects. Therefore, it is important to evaluate these processes in a holistic manner.
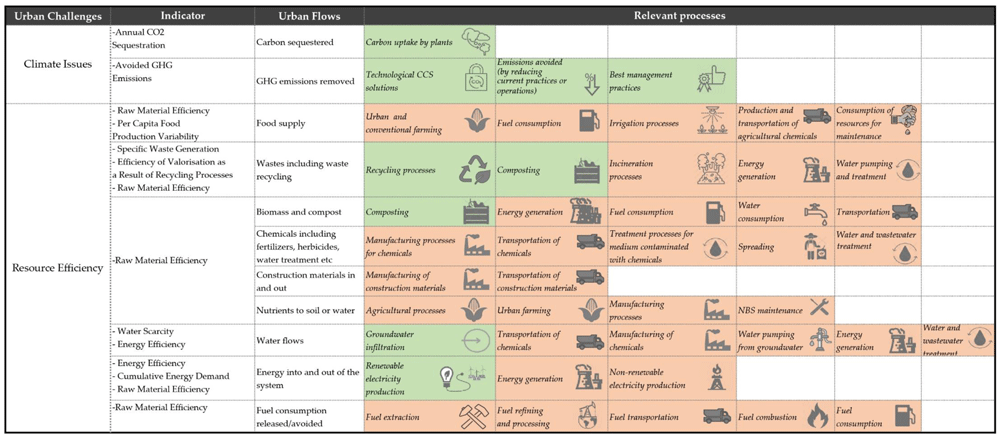
Figure 3. Illustration of the urban processes, urban flows and indicators addressing different urban challenges.
GHG, greenhouse gas; CCS, carbon capture and storage; NBS, nature based solution.
Quantification of environmental urban indicators
Once the system boundary is set with headline indicators, these indicators can be quantified. This is a crucial step since it establishes the baseline for both static and dynamic performance tracking. To make the measurements and monitoring possible for the decision makers and urban planners, quantification methods for nine indicators have been explained together with their definitions with the help of Deliverable 2.1 “System of integrated multi-scale and multi-thematic performance indicators for the assessment of urban challenges and NBS”21 of the Nature4Cities Horizon 2020 project as below.
Annual CO2 sequestration: The annual carbon (or CO2) sequestration is used for global climate regulation ecosystem services of different vegetation types. The storing and sequestration of CO2 can be quantified and monitored relatively, allowing also spatial and temporal comparisons of different NBS. The following calculation method can be used to identify the sequestered CO2 in the case of trees21:
where:
Cbt: carbon stored in living biomass at time ‘t’ (tC/ha)
Gbt: biomass growth at time ‘t’
Tt: biomass turnover at time ‘t’
Mst: tree mortality due to senescence at time ‘t’
Ht: harvest at time ‘t’
where:
Kv: constant to convert volume yields into dry biomass (basic wood density, in tons of dry biomass per m3 of fresh stemwood volume)
Ys: the volume yield of stem wood (m3/ha*yr)
Avoided GHG emissions: With this indicator, six main anthropogenic greenhouse gases that are recommended by Intergovernmental Panel on Climate Change (IPCC) can be calculated24. IPCC or LCA approaches can be used for the calculation of released and avoided GHG calculations. For this calculation, GHG emission and conversion factors should be used. Since the assessment methodology in this study covers the whole life cycle, IPCC conversion factors are used for the whole cycle.
Energy efficiency: This indicator is used to derive the change in the energy consumption of NBS implementation in comparison with a baseline for a selected timeframe. As a first step, the total energy consumption per time or per capita is evaluated using energy bills, building energy simulations, statistical data etc. Once the energy consumption is calculated, this value is compared with the baseline data to get the percent (%) efficiency25,26.
Per capita food production variability (PCFPV): The Food and Agriculture Organization of the United Nations (FAO) defines the PCFPV as the variability of the "food net per capita production value in constant 2004–2006 international $". It is used to analyse the production variability across different countries and time. For NBS implementations that involve food production, this indicator could be useful in concept and detailed design phases, although calculation of PCFPV is complex. FAO uses its own calculations based on food security statistics for calculating PCFPV.
Cumulative energy demand: This is a useful indicator to understand the total energy demand for the whole life cycle of an NBS implementation. Calculation is not very complex and required data can be obtained using MFA or life cycle inventory databases. It is calculated by multiplication of the raw resources and energy by a characterisation factor. Multiplied values are then summed to get the final cumulative energy demand for a system27.
Water scarcity: For NBS implementations with a focus on water management, this indicator can be helpful to determine the type of impacts of the NBS in question on water availability. It requires data on the amount of water from different natural ecosystems like lakes, rivers or oceans etc. This indicator can be calculated by multiplying the water flows (in m3) by a factor in m3 world water equivalent/m3 expressing the scarcity of water in the local context. Values are then summed to get the total value for the indicator in m3 world water equivalent28.
Raw material efficiency: This indicator is used to assess the change in primary raw material consumption and can be applied for specific NBS where consumption of a raw material like fossil fuel, biomass, chemicals, or such occurs. It is calculated as percentage (%) change. To evaluate the change, the amount of primary raw material consumption needs to be identified per capita. Then, using the baseline consumption data, raw material efficiency can be calculated26.
Specific waste generation: To measure the annual municipal solid waste generation per capita, the specific waste generation indicator is used. This indicator is important for understanding the efficiency and sustainability of an NBS implementation with regards to waste treatment and resource consumption. It is easy to calculate, and data can be obtained from national statistic institutes as well as case-specific audits. Specific waste generation can be calculated using26:
Efficiency of valorisation as a result of recycling processes (ERP): This indicator is used to evaluate the efficiency of recycling processes to produce recycled feedstock. The objective of this indicator is to analyse the improvement in valorisation of waste and other by-products, focusing on circularity of the system. The calculation is complex, and a lot of data is required to measure ERP. The calculation method is as follows21,29:
The amount of waste going to landfill, or energy recovery is calculated as follows:
where;
CR: fraction of the mass of product collected for recycling at the end of its use phase
CU: fraction of the mass of the product that goes into reuse
Furthermore, the amount of waste generated in the recycling is obtained as:
where;
EC: efficiency of recycling process used for recycling the product at the end of its use phase.
Finally, waste generated to produce any recycled content as feedstock is calculated as:
where;
EF: efficiency of recycling process used to produce the recycled feedstock.
For the identified system boundary, stakeholders and experts can decide on the relevant headline indicators to measure and monitor the performance of the NBS in question. These indicators are especially of great use for quantitative assessment. As it will be explained in depth in the next section, the same set of indicators can also be applied in a repetitive way to track performance accordingly. More information via more than 60 info-sheets defining the system boundaries of different types of NBS (Table S1) are given in Table S2 to Table S62 found in the Extended data30 where definitions of the NBS, indicators linked with urban processes and flows and other information are available.
Performance tracking methodology and benefits
As already mentioned, it is possible to apply environmental assessment in two ways; during decision making between different NBS alternatives and during implementation of the NBS. The environmental assessment framework described in the previous section is about quantifying indicators defined at a point in time (i.e., static evaluation) whereas the dynamic assessment methodology supported by this framework is a repetitive implementation of indicator-based assessment.
The initial point for the development of this methodology is to support the needs of monitoring and assessment in the context of strategic quality planning (SQP) in cities. SQP basically defines the route between the point where the system is and the level that it wants to achieve. It focuses on results and outputs. It allows the organization to define itself, to evaluate and check its service and products through a systematic method31. This strategy in our case is linked with the adaptive management approach for NBS deployment. Programmed monitoring provides a picture of the status of the NBS which helps to indicate the points of interventions linked with the hot spots. Hence, it is important to deliver a monitoring program to understand the relationship between NBS providing ecosystem services and the benefits obtained together with some possible trade-offs. The monitoring program can be divided into two categories which are:
Performance monitoring within the context of SQP in urban areas compares the status of the system against the level of achievement to a set target. In this way, ecosystem services provided by NBS are easily assessed by means of results and outputs through a systematic methodology. This approach needs input data to provide output data revealing four basic parameters that are the analysis of the existing situation, the identification of the system and its boundary, goal and objective and then monitoring and assessment. The latter basically entails tracking of a service or product and evaluating it with respect to the selected criteria. Through this method, it will be possible to identify the degree of achievement for the measures (solutions) applied. This needs a reference point, i.e., baseline, to see the before and after scenarios for the purpose of comparison which could be extended to benchmarking in respect to best practices.
All these considerations are aggregated to fulfil the strategical gap in the context of sustainable urban planning by establishing a monitoring methodology. The structure of this methodology, which is dynamic assessment methodology, includes “processing” and “monitoring and interpretation” that are linked with “data” and supported by “visualisation”, which can be seen in Figure 4.
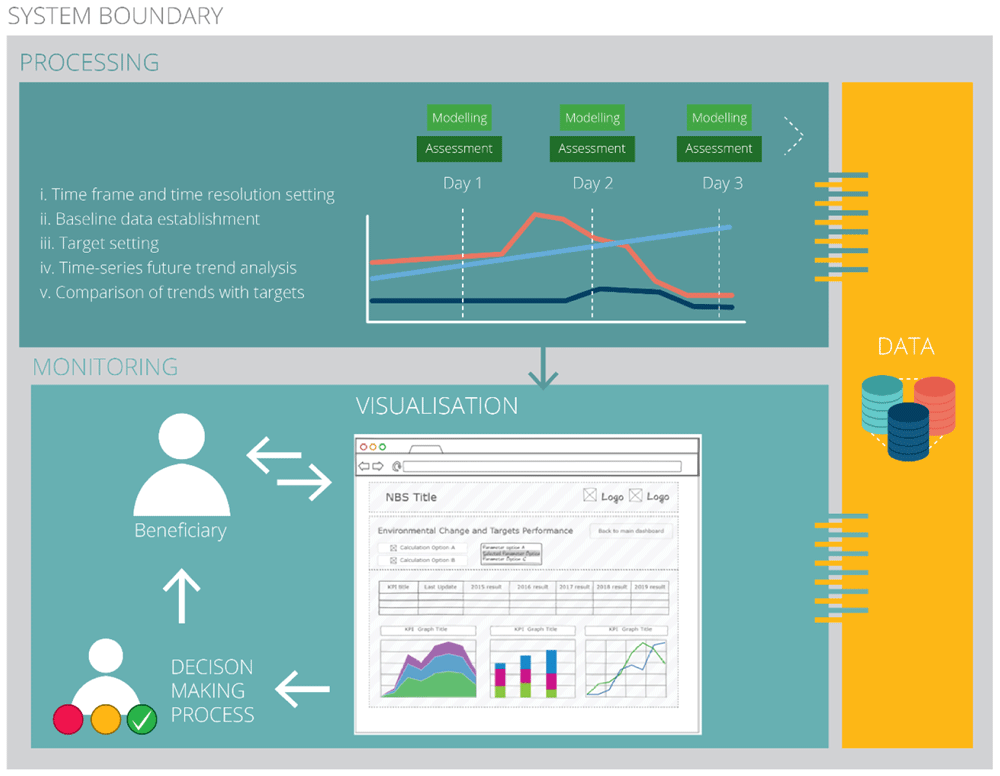
Figure 4. Performance tracking methodology.
To begin with, data, which is used in MFA, is considered to be the foundation and the most important part of this assessment methodology. To demonstrate the relationship with other stages of this methodology, data is formed and ingested then it is filtered, combined, homogenised, enriched (i.e., processing) and then analysed (i.e., monitoring and interpretation). Lastly, the methodology emphasises the significance of gaining insights from data analytics processing at different spatial levels (i.e., visualisation). Consequently, it is vital to organise data in a simple form to introduce the ability of viewing, interrogating, and sorting to be done by the relevant user. Hence, data organisation, which could be assisted by a relevant software, is the basis of the management structure to operate the methodology. The process of abstracting insights from large data resources to support experts and decision makers is called data analytics.
Within this concept, the aim is to discover useful interpretations to reach some conclusions for decision making purposes. Therefore, the term “insight”, which is a critical parameter that paves the way for this methodology, is inevitably included in the smart city concept where different insight categories (Table 5) are applied32.
Table 5. Insight categories commonly utilised within smart cities framework and their objectives.
| Insight category | Objective in the context of nature based solution (NBS) |
|---|
| Operational | Assessment of characteristics and operational performance of buildings, communities, and organizations. |
| Critical | Enabling rapid action to on-going NBS projects or disruptive intervention by real-time monitoring of
infrastructure or even people |
| Analytical | Determining the patterns, correlations, and predictions with the help of city data to reveal the system or
service whether they are properly set for an urban challenge or not. |
| Strategic | The outcomes of strategic objectives or decisions in urban planning context is provided by holistic
approach in data analytics framework monitoring |
In order to understand the significance of these insight categories, it is vital to understand the purpose of an NBS as a sustainable solution inspired by nature for different challenge(s) confronted by cities. In this context, to identify meaningful insights for the planning and management of the NBS, temporal- and spatial-based observations are key activities for depicting the state of the environment impacted by the solution, followed by conversion of the observations into performance metrics. This process brings the concept of analytical insight where NBS components in respect of their functions and design are revealed and then turned into operational and critical insights that will be supported by the big umbrella, strategic insight, at the end, as seen in Figure 5.
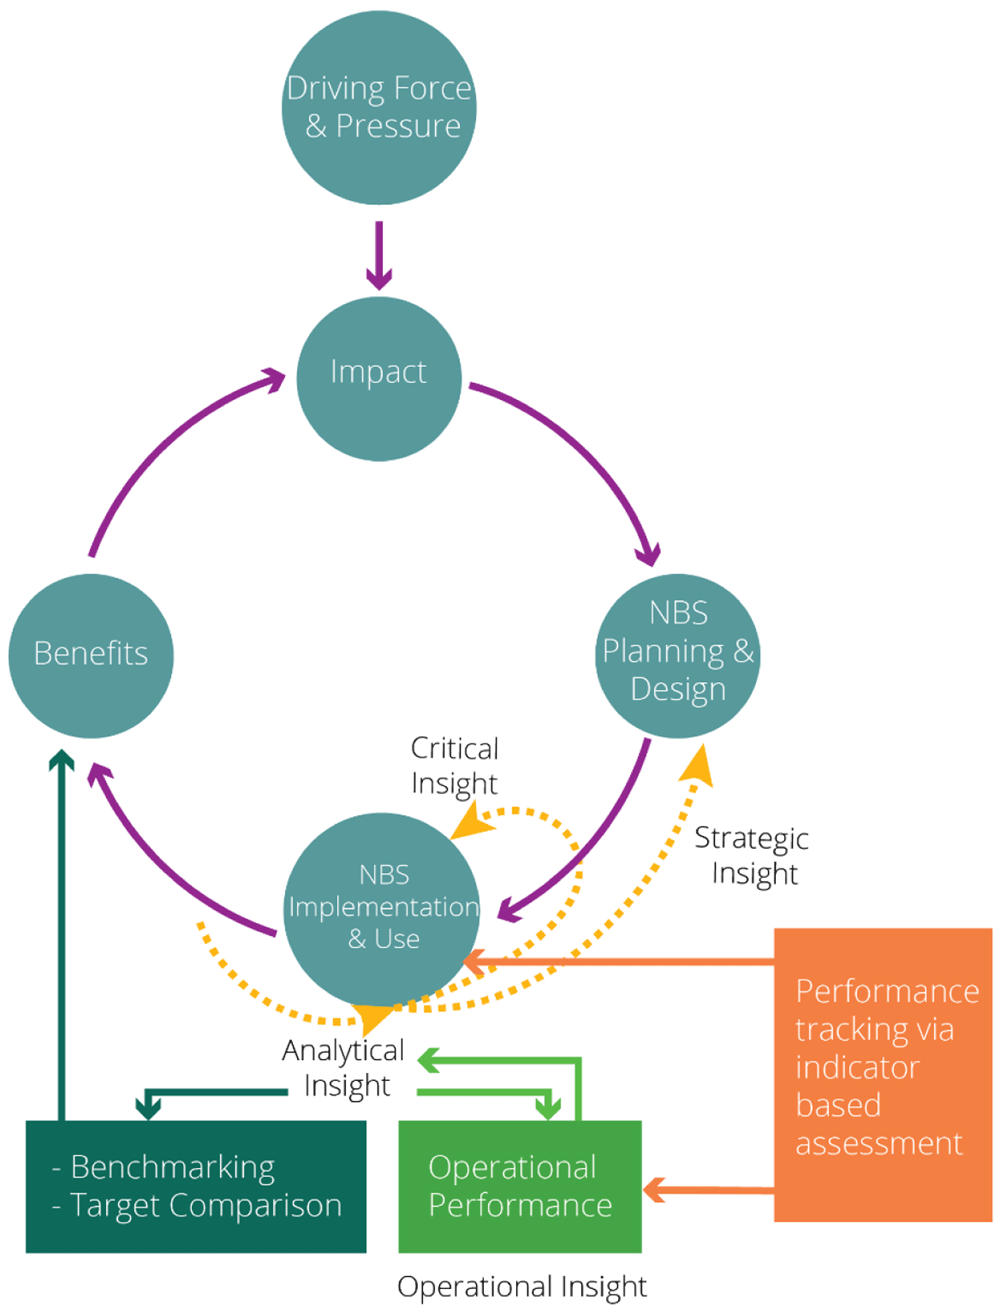
Figure 5. Insight categories relationship with nature based solution (NBS) performance tracking.
To obtain a robust insight, input data is the key element that should be handled and stored properly. In addition to that, data determines the interval of assessment, which is directly linked with the urban flow(s) necessary to calculate a specific performance indicator. In that respect, this methodology is basically operated with the available data sources for calculation. It begins by applying various data, providing the opportunity to determine an exact interval of assessment for the urban planner or decision maker to capture the appropriate time resolution of the performance indicator together with the underlying raw data necessary for evaluation.
To obtain the data necessary to describe each urban flow related to an NBS, it is possible to categorise the data source into three major groups such as:
• Generic/public: e.g., in the context of air quality, the air pollutants monitored by governmental institutes are available to the public
• Measurement and direct measurement: e.g., indoor building energy measurement via sensors
• Modelling tools/software: e.g., “i-Tree Eco” (a cooperative effort between the USDA Forest Service, Davey Tree Expert Company, The Arbor Day Foundation, Society of Municipal Arborists, International Society of Arboriculture, Casey Trees, and SUNY College of Environmental Science and Forestry) for climate mitigation performance indicators or “EnergyPlus” (developed in collaboration with the National Renewable Energy Laboratory (NREL) and various U.S. Department of Energy’s (DOE) National Laboratories, academic institutions, and private firms) via Design Builder for resource efficiency categories
Generic data sources according to the urban flow indicators selected for environmental assessment methodology linked with climate and resource related urban challenges can be found in Table 6. The next activity is related to the collection of data which will be processed within a methodology called performance tracking methodology. It is worth remembering that this methodology is built upon the data analytics practices supported by the environmental assessment framework described in ‘Indicator-based quantification approach’.
Table 6. Urban flow indicators and data source.
| Topic | Urban flow
indicator | Source of data |
|---|
| Climate | Annual CO2
sequestration | -Biomass and climatic data |
Avoided GHG
emissions | -Sustainable Energy Action Plans (SEAP) and
Sustainable Energy and Climate Action Plans
(SECAP)
-National/city level GHG inventories
-Commercial/free LCA database
-Direct measurement
-International Energy Agency (fossil fuel combustion)
-Eurostat |
| Resource | Energy efficiency | -Energy bills
-Electricity consumption statistics
-International Energy Agency
-World Bank
-Electricity and fuel distributor(s)
-National statistical institute |
Per capita food
production
variability | -FAOSTAT
-Urban Data Platform (JRC and DG REGIO) |
Cumulative
energy demand | -Commercial/free LCA database
-Urban Audit (DG REGIO and
Eurostat) |
| Water scarcity | -Life Cycle Initiative
-Urban Audit (DG REGIO and Eurostat)
-Water supply and treatment companies |
Raw material
efficiency | -Eurostat
-National statistical institute |
Specific waste
generation | -Eurostat
-National statistical institute
-Ministry of Environment and Urban Planning
-Urban Audit (DG REGIO and Eurostat)
-Municipal waste facilities
-Private solid waste collector |
Efficiency of
valorisation as a
result of
recycling processes | -Waste treatment company (private or public)
-Public services
-Municipal bodies
-Expert NGO |
As a part of this methodology, the concept of processing is mainly aiming to reflect the dynamic nature of the urban ecosystem with the results obtained from the environmental evaluation of the NBS. This urban ecosystem illustrated by urban metabolism is the basis of this methodology that includes different headline indicators with a time-based approach to identify the trend against urban challenges. The “time-based” approach can be simply defined as the measurements over time, forming a sequence including different points in time (i.e., variable for the “trend” determination).
To begin with, it is important that each indicator is evaluated individually. To run this assessment methodology, it is necessary to update raw time-series data linked with each urban flow indicator periodically. This will result in the formation of time-series trends and performance forecasts. Regarding the outputs together with the pattern obtained in respect to time, it is possible to monitor the progress of the NBS (operational insight) against any future targets or a baseline (business as usual, BAU) scenario for the duration of assessment on an aggregated basis (analytical insight) (Figure 6 and Figure 7). Additionally, another output allowed by this methodology is the comparison of alternatives to the NBS such as novel technologies or grey solutions for the same urban challenges.
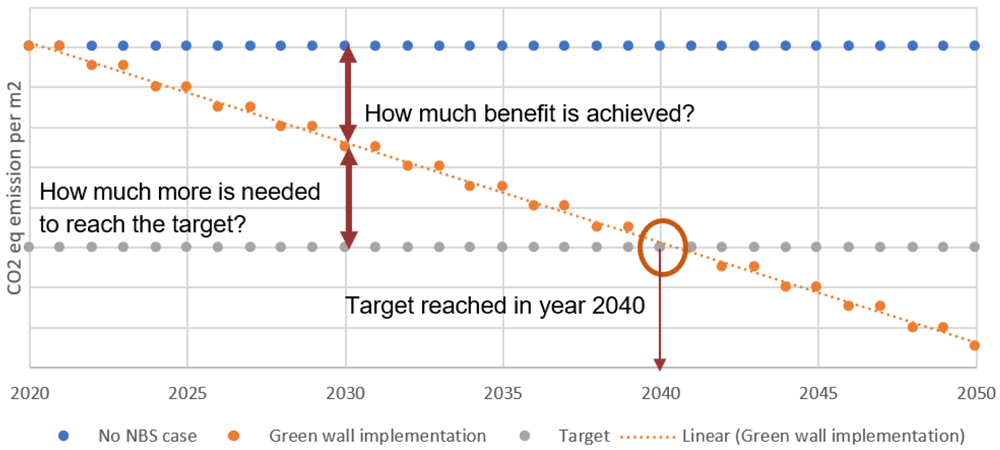
Figure 6. Hypothetical green wall nature based solution (NBS) case with baseline, monitoring and NBS target.
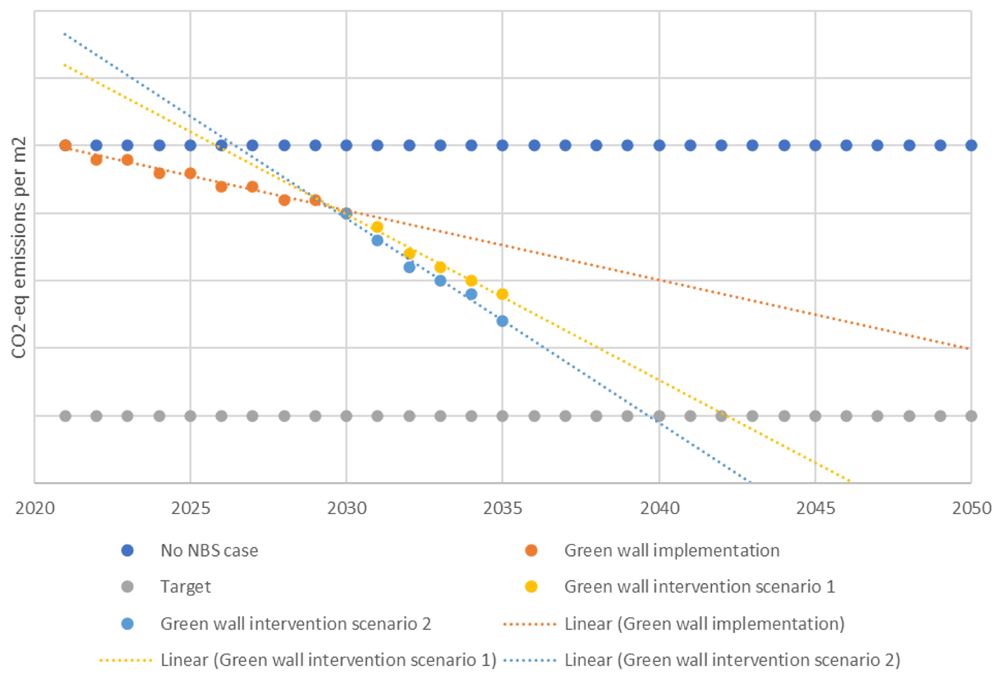
Figure 7. Intervention scenarios.
NBS, nature based solution; CO2-eq, carbon dioxide equivalent.
To perform an environmental assessment in a dynamic manner, a performance tracking methodology is developed including five consecutive steps of:
1. Time frame and time resolution setting
2. Baseline data establishment
3. Target setting
4. Time-series future trend analysis
5. Comparison of trends with targets
At the heart of these abovementioned steps, the main concern is the data together with its availability and collection. As mentioned in ‘Indicator-based quantification approach’, input and output flows can be linked with several headline indicators that describe different life cycle stages of the NBS. Therefore, the focus and the content of the following steps of this methodology is shaped around the flow data.
Step 1: Time frame and time resolution setting
This is the initial step of the assessment methodology for which each urban flow indicator should be associated with a “time frame” and “time resolution”. “Time frame” indicates the assessment period so that a target can be set within the lifetime of the NBS project in cooperation with urban planning timelines. The other term, “time resolution”, is the frequency of repetition of the dynamic assessment or, in other words, the interval of evaluation within a time frame. So, the periodicity of assessment is directly related to data availability, data collection feasibility and the degree of repetition of quantifiable benefits at specific intervals. Reported units in databases, expert models and measurement methods can guide decision makers to understand the appropriate time resolution of performance indicators and their underlying raw data, which will be shortly discussed in the following paragraph.
To illustrate the determination of time resolution, it is better to realise an NBS project for a specific urban challenge, as already explained in ‘Indicator-based quantification approach’, with its own input and output flows structure. The material and/or energy flows to be monitored during the dynamic assessment of such implementation depends on the headline indicator selected for the purpose. Therefore, the input flow data is the key for choosing the most appropriate and feasible time resolution. For instance, for a planter green wall application on a residential building in relation to its energy demand, which affects the amount of greenhouse gases emitted, it is meaningful to select the interval of the assessment as daily or monthly based on the data availability. Hourly consumption data could be aggregated into monthly or even annual data points for lower granularity, which are more meaningful. This is an example covering only one single flow; however, there are of course lots of cases where multiple flows are necessary to evaluate one headline indicator. In that situation, the most influential flow in the indicator assessment or in other words, the one with the lowest granularity, will determine time resolution choice. To illustrate further, for a building without any sensor-based measurements, heating energy figures are assessed by bi-weekly natural gas bills. For the cooling energy, the consumption amount is obtained from monthly electricity bills. Therefore, the granularity for these two cases is determined by the monthly electricity bill.
Step 2: Baseline data establishment
The BAU scenario can be explained as the situation without the NBS implemented in the area of intervention or an already existing NBS in the area of concern. In a simple manner, it is a/any reference point(s) applied for highlighting possible deviation(s) for the selected timeline along the service life of NBS against other scenarios.
The BAU scenario can be evaluated for different cases including individual or multiple NBS projects as long as their functional units are identical (e.g., m2 of urban green space).
Step 3: Target setting
This is an optional step to be applied when comparing the performance of an NBS with regards to any targets. Each indicator can have its own target for monitoring the level of achievement and/or any possible improvements. These target values can be urban targets within the scope of international commitments/agreements (e.g., Paris Agreement), urban transformation, environmental regulations for air quality, resource efficiency or Sustainable Climate and Energy Action Plans etc. Although it is an optional step, it is beneficial for decision makers to use this step by setting target values at the beginning of the implementation phase, or evaluation phase for an existing NBS. It is necessary to set the target at the same spatial level as the BAU. Another aim of this step is to check the performance of an NBS with a similar NBS for benchmarking. The results obtained from these comparison studies reveal the losses or benefits acquired and create critical insight for the implementation and use phase of the NBS as well as strategic insight for new NBS in planning and design phases.
Step 4: Time-series future trend analysis
This a pivotal step in the performance tracking methodology and determines the trend for a specific urban flow indicator to understand the potential improvement for a particular NBS. BAU here can be the case without NBS or with NBS implemented (i.e., there could be existing NBS in place) to evaluate the whole service life of the NBS. There are several statistical time-series methods which are applicable to assess the “trend”, “seasonality” and “unit root” of the time series. Trend is the continuous flow of data altering over time in a specific pattern without regular repetition, at least not within the time range defined by data. In the case of seasonality, the data component repeats itself in systematic intervals. Lastly, the unit root can be explained as the component of unpredictable data following a chance-based process or, in other words, unit root is a random trend showing an unpredictable systematic pattern. For instance, CO2 emissions from vehicles in a city are directly proportional with the number of vehicles on the road; therefore, it follows that emissions can quickly increase over time, i.e., can have an increasing trend. This situation follows a seasonal pattern so that during the winter more people use their cars and walking, cycling or other transportation methods with no harmful emissions are used more frequently in the summer/warmer times. Additionally, there could be some unpredictable changes like the Covid-19 situation in 2020, which drastically affects electricity consumption as well as the usage of public transportation. This is a significant and unpredicted change in emissions sourced from fuel consumption called unit root or non-stationary time series.
To begin future trend analysis, a set of data should be logged at regular time intervals. In this way, a dynamic pattern will be obtained including all the three time series components. This will give insight into long-term trends, ignoring any short-term effects, and help to predict future values based on past data. Hence, this procedure, which is called “time series analysis”, is trying to fit a time series to a proper model, which can be, depending on the growth pattern, linear, quadratic or logarithmic33. These patterns are used in different forecasting applications together with the methodology developed for NBS cases in this article. For adequate forecasting, it is vital to obtain a well-fitted model, which paves the way for proper future data points. The exactness of these data points generated by prediction is measured with accuracy and precision parameters. These two approaches can be evaluated with the help of the regression coefficient (R2), which ranges between 0 and 1.
Step 5: Comparison of trends with targets
The fifth step for the assessment is the comparison of trends with set targets. This helps urban planners or decision makers to analyse any kind of gap in achieving the target. Moreover, it helps to answer questions like “What is the level of benefits achieved” or, in the case of annual CO2 sequestration, “How much more CO2 should be sequestered to reach the target level”. In this way, the result of the assessment determines the potential demand for intervention of NBS like maintenance, renovation, restoration, adjustment or even rebuilding. This offers a great opportunity to manage possible crises (i.e., maintenance of NBS or renovation, restoration or rebuilding of NBS) and develop intervention strategies. This intervention strategy ensures the robustness of urban planning operations by assisting the decision makers significantly to act in a proactive manner and close the gap.
Data that has been collected, organised, and evaluated in the course of the stepwise performance tracking process is used within the activities of NBS monitoring followed by interpretation of the results obtained from the assessment. Due to the long service life of NBS, monitoring, which shows the change in effectiveness of a NBS over time, is of paramount importance in the course of its life cycle. Moreover, monitoring is also available to validate performance indicators related to NBS, which confronts internal and external impacts across time. In this way, it is possible to understand the degree of reliability of the solution and then act accordingly. It is possible that reliability could be underestimated, but stakeholder engagement is also connected with this activity. This can be explained by the knowledge gap in current practices about the NBS performance tracking. For example, in the case of grey solutions, most stakeholders including experts, decision makers and citizens perceive them as lower risk investments due to a lack of experience of NBS. Another issue is short and long-term visions which are not integrated with the NBS since too much attention is paid to the economical aspect of a solution and there is insufficient expertise of sustainable business models. Additionally, uncertainty of a solution together with little or no knowledge about NBS in an urban context is the driver of this tracking activity. Therefore, by considering stakeholders’ perspective, monitoring is an important process to communicate about NBS, which builds up a continuous knowledge as well as secures NBS funding.
Use case
This section presents a tentative planning scheme to guide researchers or experts in applying and testing the performance tracking methodology in the future. To facilitate use of the described procedures during a NBS scenario evaluation, a hypothetical case below indicates the substantial points to consider and shows the application of the methodology.
This hypothetical case is based on a PUGS where a significant amount of reduction (e.g. 10%) is expected in terms of the carbon dioxide equivalent (CO2-eq) emissions per m2 of the green space. The service life considered for this NBS is assumed to be 50 years in operation for city dwellers. In that respect, Table 7 presents the specific properties of this hypothetical NBS project.
Table 7. Hypothetical NBS project description.
| Location | Country | Turkey |
| City | Ankara |
| District | Çankaya |
| Project | Type | Construction project (Business model: Public-Private Partnership) |
| Challenges | City objectives | Climate mitigation
Climate adaptation
Urban space management |
Nature based
solutions | Category | On the ground |
| Type | Public urban green space (PUGS) |
| Spatial scale | Neighbourhood |
| Expected service life | 50 years |
| Performance tracking | KPI (Environmental) | i. Annual CO2 sequestration
ii. Avoided GHG emission |
| Time | Month and year of NBS
implementation | April 2020 |
| Assessment period | To be determined (See below explanations) |
| Resolution | To be determined (See below explanations) |
Time series
assessment | Assumed order | Order:1 |
Step 1: Time frame and time resolution setting
As a preliminary step, the time frame of the assessment has to be determined. In that matter, the service life of the PUGS is assumed to be 50 years. Considering the EU short-term (2030) and long-term strategies (2050) about climate neutrality, it is advisable to have a 35-year time frame for the assessment of an NBS implemented in 2020 to monitor the trends of selected key performance indicators (KPIs), which can be compared with municipality targets (i.e. local targets affecting national targets).
To illustrate, the mitigation potential in terms of CO2-eq emissions per m2 of PUGS, CO2 sequestered, is determined according to the number of trees, shrubs, perennials, other vegetation, or the area of grass and other auxiliary parameters. This performance monitoring also takes into account the “Annual Operational Emissions” and “Avoided GHG Emissions” performance indicators of the park. Variations in the number of trees and vegetation as well as their coverage area will affect the sequestered CO2. In parallel, green space usage by visitors, maintenance activities or composting with foliage debris or grass mowing, trimming dead branches, using water pumps, electricity consumed for lighting, etc. are also considered as sources of GHG emissions that alter dynamically. Within a 35-year time frame, it is necessary to determine the frequency of repetition of the evaluation. Consequently, the appropriate time resolution is specified according to the input flows of PUGS. A simplified version including some of the significant input flows according to the selected KPIs and the system boundary of the PUGS requested by the Nature4Cities Platform are indicated in Table 8.
Table 8. Public urban green space input flows for selected key performance indicators (KPIs).
Environmental assessments
Simplified inputs of public urban green space scenario |
|---|
KPI: Annual CO2
sequestration
input flows | Unit | KPI: Avoided greenhouse gas emission
input flows | Unit |
|---|
| Service life of the park | year | Annual CO2 sequestration | kgCO2-eq/year/total park area (m2) |
Number of trees, shrubs,
perennials, and grass | piece(s)/service life
of the park (year) | Pavement area | m2 |
Lifetime of trees, shrubs,
perennials, and grass | year | Soccer/ballfield area | m2 |
| Total park area | m2 | Energy consumption for water pumping | kWh/year/total park area (m2) |
Number of park visitors
(Annual) | Person/year | Energy consumption for mowing | kWh/year |
| Tree coverage area | m2 | Monthly electricity consumption | kWh/month |
| Grass coverage area | m2 | Total park area | m2 |
| | Energy of diesel/lubricant
(used in power tiller) | |
| | Energy necessary for bitumen pavement
implementation
(pavement) | kWh/pavement area (m2)/service
life (year) |
| | Energy necessary for concrete pavement
implementation
(soccer/ball field) | kWh/pavement area (m2)/service
life (year) |
| | Number of restrooms | piece(s)/total park area (m2)/
service life of the park (year) |
| | Working hours of the machine used in
soil preparation | hours/m2 |
The measurement units of the input flows of the system reveal the time resolution for the assessment. For instance, despite the possibility of obtaining monthly electricity or water consumption figures for the park through monthly bills, annual data points are far more feasible and valid here as they have the lowest granularity. Therefore, the time resolution is selected as “annual”. It should be noted that the input for the PUGS can be expanded upon by considering different park input flows (material, energy, etc.).
Step 2: Baseline data establishment
A baseline should be created as an assembly of reference points where the same area without NBS or with existing NBS (e.g., a green space) will be monitored for the KPIs selected to understand the BAU case. For this step, it is important to consider the same area as the PUGS to be consistent for any comparison activity outlined in Step 5 to be undertaken. In addition, past data for the baseline before 2020 in our case will pave the way to forecast the tendency (i.e., the trendline) of the BAU and provide valuable information to use in Step 5.
Step 1 and Step 2 need a robust data management strategy requiring quantitative information to be collected. Different data sources have already been mentioned in the previous paragraphs. In this hypothetical case, for instance, the data source for the total park area, number of restrooms and the number of plants and trees is the parks and gardens department of the Çankaya municipality. Additionally, it is possible to obtain monthly electricity and water consumptions from the bills provided by the electricity and water suppliers of Ankara. Once the expert has determined the data requirements (see Table 8), it is time to collect these data and validate their consistency before use. As a recommendation, a simple Microsoft Excel sheet together with a file repository or a single folder containing the relevant data will affect the assessment process in a positive way. Data collection can be achieved in a “smart” (e.g., sensors, Internet of things (IoT), mobile applications, drone footages, satellite images, etc.) manner depending on the location of NBS and the degree of technological capabilities such as through aerial mapping of tree coverage area or grass coverage area.
Step 3: Target setting
After establishing the baseline according to the past data and/or continuous monitoring of the KPIs after 2020, it is time to define upper/lower boundary in respect to targets determined internationally, nationally, or locally (i.e., urban scale) such as climate mitigation or adaptation targets of sustainable energy and climate action plans of cities or nationally determined contributions (NDC) of countries. This step should be considered before the implementation of PUGS. In our hypothetical case, the spatial scale that is affected by PUGS implementation is the neighborhood; this should be scaled up or down where necessary depending on the target settings and whether scale is urban, national, or international. This is important while identifying the target points to be achieved in a 35-year period. These target values and the baseline data should match each other in terms of their spatial level, meaning that both BAU and target settings have to be at the neighborhood scale.
Step 4: Time-series future trend analysis
The potential environmental improvements in this hypothetical case, as well as trade-offs in respect to operational consequences of the PUGS, will be monitored with two KPIs. In this step, a basic time series analysis should be conducted. Time resolution (i.e., data collection for regular time interval) for the assessment has already been determined as annual. Therefore, starting from April 2021, input flows requested by the Nature4Cities Platform (Table 8) should be collected regularly to evaluate selected KPIs for 35 years. Within that time frame, a set of data will be continuously collected. For example, in May of 2025, there will be already five data points collected representing KPIs. In this way, it is possible to predict future values based on the trendline obtained with past data in Microsoft Excel or using other data analytic tools. The order of the trendline equation can be modified to fit the past data for better forecasting. In other words, the order of the equation can be augmented to increase the accuracy of future predictions. As a final remark, the methodology described in this article does not indicate simple linear regression as a ground method. Consequently, the selection of the methodology for the assessment depends on the expert’s opinion and the context in order to choose appropriate techniques for forecasting like moving average, multiple linear regression, or others. Single linear regression is applicable for this use case.
Step 5: Comparison of trends with targets
Considering the local target for the year 2030 in terms of sequestered carbon or net GHG emissions in an urban context, the trend chart drawn in Step 4 will help to compare the level of sequestered carbon against the local target. In this way, the expert can identify any deviations with respect to the target and call for intervention proactively.
Additionally, to capture the environmental benefits of the NBS throughout the assessment period, a hypothetical time series bar chart for PUGS is illustrated below (Figure 8). In this figure, the net carbon dioxide balance is directly obtained by subtracting sequestered CO2 from operational emissions over 35 years. For example, in 2024, operational emissions cannot be compensated by the sequestered CO2 in the park. On the other hand, the year 2026 is the break point to pass to a net positive CO2 balance.
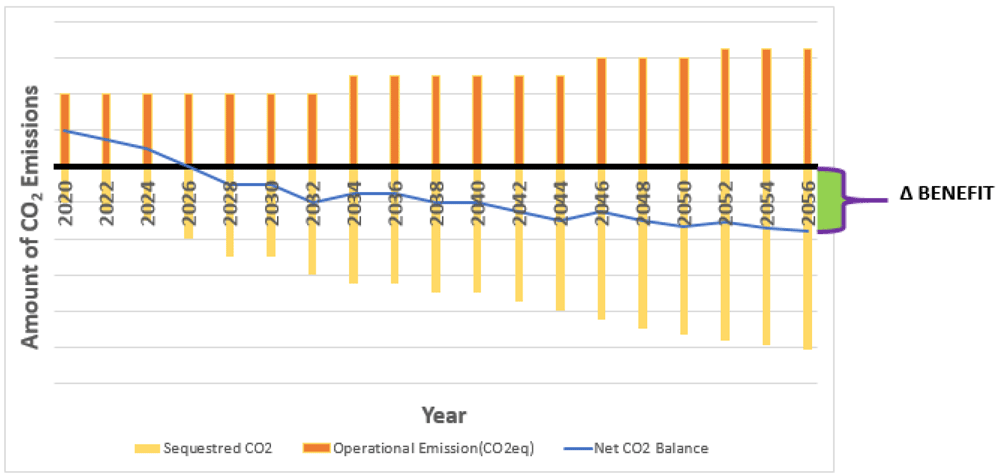
Figure 8. Hypothetical bar chart for CO2 emission in a public urban green space (PUGS) along the time frame of the assessment.
There are various tools and methods that can be used to apply five steps described in this section. It is vital to mention here that one of the tools that can be used for the assessment is the Nature4Cities platform, which is a closed source product of the EC Horizon 2020 Nature4Cities project, which this article was developed as part of in parallel. In that respect, to evaluate both of the abovementioned KPIs, the Nature4Cities platform is one of the possible tools that can be used, and is simple and free to utilize. This web-based platform is the main output of the Nature4Cities project where 14 online tools are integrated to support design, evaluation, and implementation of NBS project(s). In this platform, in order to track the environmental performance of an NBS, “NBS project assessment” module under “Assess and NBS Project” category can be used to create the abovementioned hypothetical NBS scenario.
A summary of the process of initiating the assessment of a PUGS in the Nature4Cities platform follows.
It starts by describing the NBS project and then the next stage (i.e., data insertion) is about the data related to the NBS (e.g., drone services, Terramap services, GIS data and others). This stage aims to collect and store all the information in the same location (e.g., project folder). Next, it is time to draw the area of intervention, explained as the area of interest in which one could establish an NBS occupying, partially or totally, that area. The fourth stage is the creation of an NBS scenario regarding the description identified in the first stage. Here, PUGS would be selected from the suggested NBS list (NBS pre-selected) and the area of the PUGS has to be marked on the map. As a result, the platform will calculate the drawn area in m2, and the NBS scenario is created. The following three stages (i.e., 5, 6 and 7) comprise different performance indicators within urban, socio-economic, and environmental contexts. Stage 8 is the environmental assessment module where one can choose related performance indicators from the list and get the requested inputs list for the evaluation easily. Stage 9 is for viewing the results of the assessments computed in the previous stage and Stage 10 is for exporting the results stated in Stage 9. Results are visualized and presented with graphs, charts, and tables (i.e., numerical). Lastly, data is the key factor, especially in Stage 8 for assessment purposes, that needs to be collected.
Monitoring
The methodology described in Step 2 through to Step 5 has a close connection to the monitoring activity. With the help of monitoring, the dynamic nature of environmental challenges (analytical insight) in an urban context is identified. It helps to evaluate urban transformation impacts and show the level of environmental hazards and alleviation of different challenges. Eventually, this operational insight allows the decision maker or expert to adjust the NBS maintenance plan, acting as a performance booster (critical insight). These yield various advantages such as tracking the performance in a periodic manner and support for urban planning (strategic insight) and NBS implementation as well as determination of intervention period.
Monitoring activity can be supported by the visual representation of the outputs obtained from performance tracking, which should be clear and descriptive. As can be seen in Figure 9, a sample dashboard or, in other words, a brief reporting page, can define the NBS KPI results over time, together with different graphical representations, and be supportive for decision makers and/or urban planners. This is related to human perception in that this concept is linked with the processing of large amounts of data in the human brain. Charts, graphs, and other visuals make things understandable and facilitate an efficient decision-making process. Well-structured data visualisation can improve insights and make aspects of the data set visible which might otherwise be overlooked34. There are different tools for visualization purposes like Tableau (Tableau Software, LLC, A Salesforce Company) for big data, Fusion Charts (An Idera, Inc. Company) for static and dynamic charts, Qlikview (QlikTech International AB) for analytics and intelligent insights, Plotly (an open source software by Plotly Enterprise) for more complex visuals, Flot (an open source software by IOLA and Ole Laursen) and others.
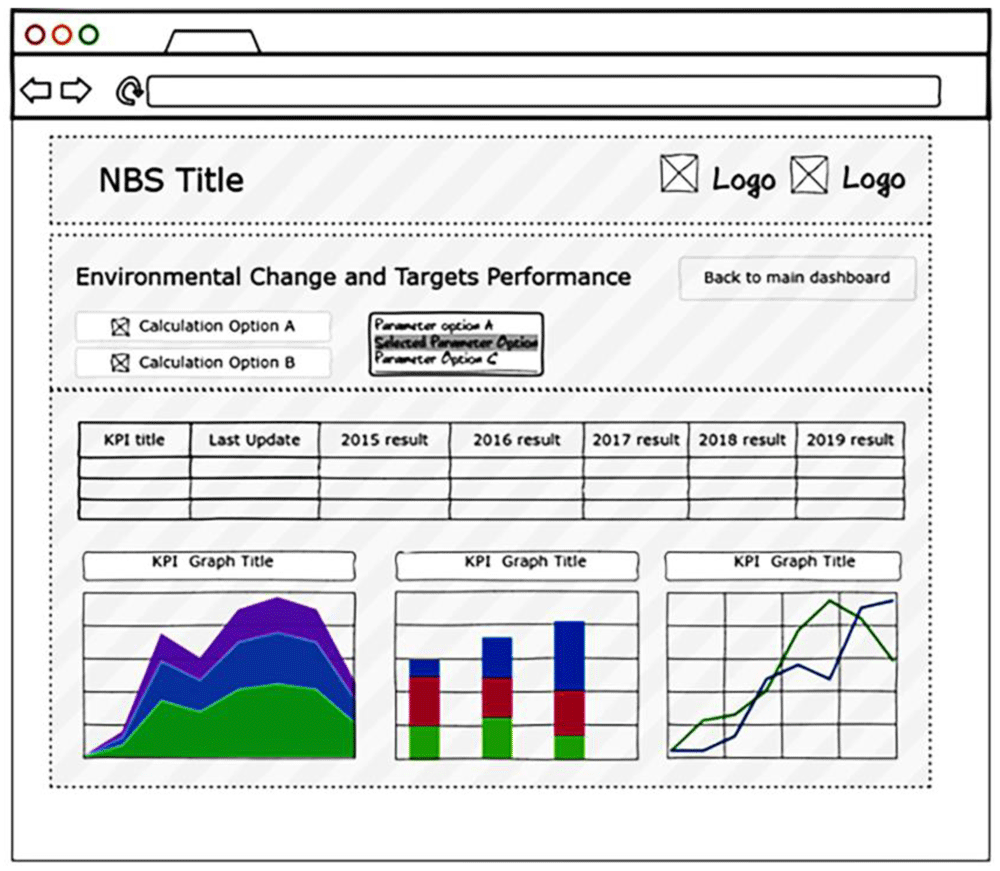
Figure 9. Sample visualisation dashboard.
Decision making in the context of NBS is based on the data displayed together with the comparison of potential consequences across different NBS alternatives. This process can be a participatory process in which different user levels are available.
In order to put this methodology into practice for NBS, it is important to understand the decision-making process undergone by relevant stakeholders, which is directly related to environmental compliance monitoring results in the development of policies. Thus, the connection between performance tracking of an NBS and policy linked with funding and stakeholder engagement is described in the following section.
Policy relevance and stakeholders’ perspective
NBS support many EU policies including the European Green Deal (EGD), EU Biodiversity Strategy and EU Adaptation Strategy through fostering biodiversity and making Europe more climate resilient. From a bottom-up perspective, the abovementioned policies must be assisted by different strategies, regulations and action plans including methodologies such as the one presented in this study, which can provide support by creating means to proceed into actionable projects. Among these, EGD aims for a climate neutral EU by 2050 along with a clean and circular economy by means of restoring and protecting biodiversity in addition to resource efficiency and pollution prevention. This transition needs mobilisation of at least 1 trillion EUR of sustainable investments over the next decade35. In order to establish necessary financial mechanisms to achieve these goals, “The Sustainable Europe Investment Plan” considers a blend of private sector investment, EU budget and national budgets. One of the dimensions of this financial plan is customised support for public administrations and project promoters in planning and implementing sustainable projects. It is crucial to mention that the Sustainable Europe Investment Plan will try to make viable impact visible, meaning that feasibility proofing and green budgeting35. Another important issue is that biodiversity loss and ecosystem collapse, closely linked to climate change, are two of the biggest threats facing humanity in the next decade. Therefore, a significant proportion of budgets, in respect to the EU Biodiversity Strategy, will be invested in biodiversity and NBS, for which 25% of the EU budget on climate action is dedicated. Sustainability metrics, such as the ones presented within the framework of this study is important for validation of bankability of NBS projects to access necessary finances.
The last policy considered is the EU Adaptation Strategy for climate change adopted by the European Commission (EC) in 2013 with various goals to foster capacity at all governance levels for resilience against the impacts of climate change. The EU Adaptation Strategy recognises the multiple benefits of ecosystem-based approaches, and their contribution to achieving its objective of a climate-resilient Europe36. To tackle climate impacts at all levels, it is important to establish top-down communication starting from city to district governorship. In that sense, one of the focuses of the EU Adaptation Strategy is to close the existing gap with better informed decision-making processes that are directly related to knowledge and expertise about climate adaptation and related subjects. Therefore, an environmental assessment framework for NBS is required to establish that expertise, which will eventually be translated into knowledge for ongoing and future activities, helping to close the abovementioned gap.
Last, the methodology for implementation of these three policies is linked with the EU’s funding programs like BiodivERsA ERA-Net, Horizon 2020, and Horizon Europe. In general, the ambition is to deliver evidence on the potential benefits of NBS to serve the abovementioned policies. For example, the ambition described and elaborated within this article is created by making use of the output of the Nature4Cities Horizon2020 EU-funded Research & Innovation project under Grant Agreement No. 730468, which is aiming to create a comprehensive reference platform for NBS offering technical solutions, methods and tools to empower urban planning decision making. These funding programmes are mainly aimed at improving framework conditions for NBS at EU policy level, developing a European research and innovation community, and advancing the development, uptake and upscale of innovative NBS and mainstream NBS in international research and innovation.
Apart from EU grants, private companies, and charities as well as crowdfunding are potential sources of finance. Moreover, another viable approach is to redirect taxes or strategies addressing innovative use of public budget for that purpose.
Most of the existing solutions for different urban challenges within the context of ecosystem services need the performance quantification methodology described in this article, which clearly facilitates the use of NBS as a mainstream solution for green urban planning, leading to green investment. NBS are seen by the investor as an innovative and highly risky solution37. Therefore, the assessment outputs obtained from this methodology promote the application of NBS by reducing risk and showcasing value, where acquired benefits as well as trade-offs can be clearly seen. This will eventually assist all relevant stakeholders to identify and integrate payment for ecosystem service schemes that are designed for risk management purposes38.
In 2020, all cities globally were severely affected by the COVID-19 pandemic, creating massive loss of life and a shift in the focus of economic activities. Climate change impacts such as displacement of species and deforestation have been suggested to be linked to easier transmission of pathogens and viruses from animals to humans. To minimize the risk of such pandemics in the future, it is important to resume and strengthen public-private cooperation efforts towards climate neutral objectives. Methodologies like the one in this article strengthen NBS projects and support these efforts by revealing the importance of NBS monitoring action.
From a stakeholder perspective, meeting society’s needs, facilitating smart and sustainable urbanisation, recovering and restoring degraded ecosystems, and other climate-related actions for resilience are major necessities that are not only valid from a global perspective, but also business drivers for NBS. In that respect, business linked with NBS is supported with the identification of short and long term gains evaluated with the developed methodology described in ‘Indicator-based quantification approach’38.
The stakeholder involvement in the implementation process of the NBS depends on various factors. One of these factors is related to the perception of the audience, considered an important matter orienting most subjects relevant to humans. By creating a time-based panorama of an NBS and making it comprehensible for everyone, the perception of local people and relevant actors will change considerably. Therefore, this kind of evaluation could be utilised as an awareness platform helping to strengthen environmental system resilience.
The main initiator to establish a robust public policy umbrella is beginning with NBS characterisation in the context of innovative and sustainable solutions followed by the value triplets (value proposition, provision and capturing) to pave the way for financial investment37. Value capturing leads to another aspect, which is perception of multiple benefits as well as trade-offs. This effort significantly affects the preference of decision makers in urban planning by closing the knowledge gap in this area. Although it is beneficial to include citizens in urban management in a participatory manner, political support together with skilled personnel (experts) have the utmost importance. The government and key administrators’ support are dependent on their level of understanding of the value by identifying environmental impacts, which is located at the heart of this methodology. According to a study carried out by Cummins et al. (2019), the primary business driver for adopting NBS is lowering project costs followed by managing regulatory requirements and risk. Mitigating natural disaster risk and engaging community stakeholders are also considered to be primary business drivers but their levels of contribution are intermediate. Achieving sustainability goals is the least valued primary business driver39,40.
Sustainable governance is currently key for success in dealing with future targets and long-term goals involving nationally determined contributions agreed through international commitments. In that respect, the government, public authority or key administrators should support the methodology and finance the whole life cycle (design phase to use phase) of an NBS. The EU has set short-term (2020 and 2030) and long-term targets (2050) to achieve the Paris Agreement objectives. For example, a slow decrease in terms of the amount of CO2-equivalent emissions at present cannot match the speed of measures required to reach climate targets under the mitigation framework.
It is necessary to apply methodology that provides simple and convenient monitoring action to assess relevant performance indicators with respect to the defined targets. In this way, it is possible to identify trends and therefore the truth behind urban transformation. This information assists the development of policies. Since 2013, the EC has actively invested in NBS and the EU policies on climate action, disaster risk reduction, the circular economy, biodiversity protection and health security have greatly contributed to the international mainstreaming of policies that innovate with nature41. The decision making process is directly connected to the benefits acquired during the life cycle of the NBS.
Discussion and conclusion
Based on the proposed assessment framework, this paper scrutinizes the gap linked to the identification of NBS environmental performance and its monitoring in the context of sustainable urban management practices. The outputs of the established framework enable the following:
• Knowledge building
• Short- and long-term urban planning
• Performance tracking and analytical insights
• Scientific evidence
• Help to establish inputs and outputs of the NBS
• Comparison with respect to BAU, defined targets (local, national, international, etc.)
On the other hand, although the development and application of best practices strengthen the dialog between urban planners, data analysts and decision makers, the presented framework has some aspects open to improvement like the data availability required for a data-driven methodology, time dependence for accurate future predictions, expertise required for the analysis, uncertainty due to use of different data sources, and a need for expert models for indicator assessments. On top of these points, the type of monitoring or the need for monitoring and evaluation systems in most countries is critical for understanding the hidden subject of finance (i.e., cost of data related to city data management including gathering, sharing, analysing, aggregating, and storing) behind this framework. Therefore, a suggested future study for that purpose is on the indirect cost of real time monitoring which can include different cost items such as equipment, technician/expert salaries, spare parts, maintenance, and other unforeseen budgets. It is necessary to state here that not only the financial issues should be considered but also the lack of human resources, technical resources (e.g., technology readiness level of the monitoring equipment, low-cost sensors) and capacities that hinder the development and use of effective monitoring and evaluation systems.
The evidence-based structure of this framework supports green finance by revealing different performance metrics of an NBS. In addition, it creates green job positions, which can be counted as an indirect opportunity, most probably requiring the tracking and evaluation qualifications. Moreover, it helps to maximise the benefits of existing, current, and future NBS by executing proactive analysis of the NBS use phase.
Considering the urban planning and decision-making process, another point worth discussing is the necessity to promote sustainable solutions like NBS for different urban challenges. In that sense, this framework is in a way facilitating mainstreaming of NBS projects that support climate mitigation and adaptation actions. This is directly linked with short- and long-term climate resilience for cities using nature.
Future research will test different use cases with real data, which will clearly strengthen the structure of the dynamic assessment and help to validate the applicability of this framework. Moreover, the outputs that will be obtained from this testing will help to understand underlying challenges like data availability, its resolution and other related concerns.
Lastly, this framework will presumably take its place in the context of the smart city concept. This is another area for future studies and related policies to be implemented accordingly. For example, the results obtained using this framework or the inputs necessary for quantification could be integrated with building automation systems (e.g., smart city solution with IoT, building automation, etc.) so that continuous surveillance of an NBS would be possible. In that respect, if the next generation policies count this process as a compulsory component to support climate resilience in cities, the framework in this article, in the context of a smart city management structure, will come into play as a data-driven decision making support that enables the demonstration of NBS benefits to relevant investors as well as the creation of new green business opportunities.
Data availability
Underlying data
All data underlying the results are available as part of the article and no additional source data are required.
Extended data
Zenodo:Supplementary File for "An Environmental Evaluation Framework for Planning and Monitoring of Nature Based Solutions for Sustainable Urban Management" manuscript. https://doi.org/10.5281/zenodo.476463930.
This project contains the following extended data within the file ‘Supplementary Material.pdf’:
Table S1: NBS classification, Table S2: System boundary infosheet for botanical gardens, Table S3: System boundary infosheet for cemetery, Table S4: System boundary infosheet for flower fields, Table S5: System boundary infosheet for hedge and planted fences, Table S6: System boundary infosheet for heritage gardens, Table S7: System boundary infosheet for large urban public parks, Table S8: System boundary infosheet for lawns, Table S9: System boundary infosheet for pocket gardens, Table S10: System boundary infosheet for private gardens, Table S11: System boundary infosheet for public urban green spaces-public urban green spaces with specific uses-take into account the distribution of public green spaces through the city, Table S12: System boundary infosheet for single trees, Table S13: System boundary infosheet for vegetated pergolas, Table S14: System boundary infosheet for woods, Table S15: System boundary infosheet for grass tram tracks, Table S16: System boundary infosheet for green strips, Table S17: System boundary infosheet for green waterfront city, Table S18: System boundary infosheet for planted car parks, Table S19: System boundary infosheet for street trees, Table S20: System boundary infosheet for unsealed car parks, Table S21: System boundary infosheet for meadow, Table S22: System boundary infosheet for urban farms, Table S23: System boundary infosheet for urban forests, Table S24: System boundary infosheet for urban orchards, Table S25: System boundary infosheet for urban vineyard, Table S26: System boundary infosheet for vegetable gardens, Table S27: System boundary infosheet for phytoremediation-management of polluted areas by plants, Table S28: System boundary infosheet for quarry restoration, Table S29: System boundary infosheet for rustic plants-horticultural but non-invasive plants-indigenous species-diversity of plant species-plants with bio-filter features, Table S30: System boundary infosheet for vegetation systems for slope erosion control/vegetation engineering systems for wind erosion control, Table S31: System boundary infosheet for mulching, Table S32: System boundary infosheet for soil amelioration/amendment/improvement -smart soils- reinforced/structural soil, Table S33: System boundary infosheet for excavation of new water bodies-infrastructure removed on rivers, Table S34: System boundary infosheet for gravity fountain, Table S35: System boundary infosheet for reopened streams, Table S36: System boundary infosheet for re-profilling river banks, Table S37: System boundary infosheet for vegetation systems for riverbanks erosion control, Table S38: System boundary infosheet for constructed wetland for phytoremediation-constructed wetland for wastewater treatment, Table S39: System boundary infosheet for de-sealed areas, Table S40: System boundary infosheet for rain/infiltration gardens, Table S41: System boundary infosheet for swales, Table S42: System boundary infosheet for use of terraces, Table S43: System boundary infosheet for extensive green roofs, Table S44: System boundary infosheet for intensive/semi-intensive green roofs, Table S45: System boundary info-sheet for roof ponds, Table S46: System boundary infosheet for climber green walls, Table S47: System boundary infosheet for living wall systems-build or attached planter systems, Table S48: System boundary infosheet for as much as possible keeping old trees, Table S49: System boundary infosheet for composting, Table S50: System boundary infosheet for conserving dead wood on the ground, Table S51: System boundary infosheet for eco management plans/No management/Limited number of management interventions in time/specific positioning of management interventions in time, Table S52: System boundary infosheet for mulching, Table S53: System boundary infosheet for reasoned or no use of chemical fertilizers, Table S54: System boundary infosheet for reasoned use of organic fertilizer, Table S55: System boundary infosheet for beehives, Table S56: System boundary infosheet for insect hotels, Table S57: System boundary infosheet for use of grazing animals, Table S58: System boundary infosheet for composting, Table S59: System boundary infosheet for limit or prevent some specific uses and practices, Table S60: System boundary infosheet for ensure continuity with ecological network, Table S61: System boundary infosheet for integration in the flooding map, Table S62: System boundary infosheet for limit use of agricultural land.
Data are available under the terms of the Creative Commons Attribution 4.0 International license (CC-BY 4.0).
Faculty Opinions recommendedReferences
- 1.
UNFCCC:
Initiatives in the area of human settlements and adaptation. 2017; 06622. Reference Source
- 2.
European Commission Nature-Based Solutions:
Environment - Research and Innovation. European Commission. Reference Source
- 3.
Kennedy C, Pincetl S, Bunje P:
The study of urban metabolism and its applications to urban planning and design.
Environ Pollut.
2011; 159(8–9): 1965–1973. PubMed Abstract
| Publisher Full Text
- 4.
Goldstein B, Birkved M, Quitzau MB, et al.:
Quantification of urban metabolism through coupling with the life cycle assessment framework: Concept development and case study.
Environ Res Lett.
2013; 8(3): 035024. Publisher Full Text
- 5.
Rosado L, Kalmykova Y, Patrício J:
Urban metabolism profiles. An empirical analysis of the material flow characteristics of three metropolitan areas in Sweden.
J Clean Prod.
2016; 126: 206–217. Publisher Full Text
- 6.
Minx J, Creutzig F, Ziegler T, et al.:
Developing a Pragmatic Approach to Assess Urban Metabolism in Europe-A Report to the Environment Agency. Berlin, 2011; 240. Reference Source
- 7.
Robert JS, John W, Mullins P, et al.:
Urban metabolism as a framework for investigating quality of life and sustainable development in the Brisbane-Southeast Queensland Metro region.
Urban quality of life: Critical issues and options.
1999; 143–168. Reference Source
- 8.
Lennox JA, Turner GM:
State of the environment report on human settlements: stocks and flows indicators.
Prep Dep Environ Heritage Canberra CSIRO Sustain Ecosyst Canberra.
2004; 17.
- 9.
Pinho P, Santos S, Oliveira V, et al.:
Manual of evaluation methodologies-SUME-Working Paper 3.1. 2010.
- 10.
Lei K, Liu L, Hu D, et al.:
Mass, energy, and emergy analysis of the metabolism of Macao.
J Clean Prod.
2016; 114: 160–170. Publisher Full Text
- 11.
de Marco O, Lagioia G, Mazzacane EP:
Materials flow analysis of the Italian economy.
J Ind Ecol.
2000; 4(2): 55–70. Publisher Full Text
- 12.
Chambers N, Heap R, Jenkin N, et al.:
City Limits: A resource flow and ecological footprint analysis of Greater London.
OxP ford Best Foot Forw.
2002; 72.
- 13.
Goldstein BP, Hauschild MZ, Fernández JE, et al.:
Contributions of Local Farming to Urban Sustainability in the Northeast United States.
Environ Sci Technol.
2017; 51(13): 7340–7349. PubMed Abstract
| Publisher Full Text
- 14.
Renouf MA, Serrao-Neumann S, Kenway SJ, et al.:
Urban water metabolism indicators derived from a water mass balance - Bridging the gap between visions and performance assessment of urban water resource management.
Water Res.
2017; 122: 669–677. PubMed Abstract
| Publisher Full Text
- 15.
Pomázi I, Szabó E:
Urban metabolism: The case of Budapest.
ConAccount 2008 Urban Metab Meas Ecol City.
2008; 352–375. Reference Source
- 16.
Guibrunet L, Sanzana Calvet M, Castán Broto V:
Flows, system boundaries and the politics of urban metabolism: Waste management in Mexico City and Santiago de Chile.
Geoforum.
2017; 85: 353–367. Publisher Full Text
- 17.
Thomson G, Newman P:
Urban fabrics and urban metabolism - from sustainable to regenerative cities.
Resour Conserv Recycl.
2018; 132: 218–229. Publisher Full Text
- 18.
Hoekman P, von Blottnitz H:
Cape Town’s Metabolism: Insights from a Material Flow Analysis.
J Ind Ecol.
2017; 21(5): 1237–1249. Publisher Full Text
- 19.
Cañellas S, González AC, Puig I, et al.:
Material flow accounting of Spain.
Int J Glob Environ Issues.
2004; 4(4): 229–241. Publisher Full Text
- 20.
Barrett J, Vallack HW, Jones A, et al.:
A Material Flow Analysis and Ecological Footprint of York Technical Report.
Stockholm.
2002; 129. Publisher Full Text
- 21.
Nature4Cities Horizon 2020 Project:
System of integrated multi-scale and multi-thematic performance indicators for the assessment of urban challenges and NBS - Deliverable 2.1. 2016; 755.
- 22.
Chrysoulakis N, Lopes M, San José R, et al.:
Sustainable urban metabolism as a link between bio-physical sciences and urban planning: The BRIDGE project.
Landsc Urban Plan.
2013; 112: 100–117. Publisher Full Text
- 23.
Nature4Cities Horizon 2020 Project:
NBS multi-scalar and multi-thematic typology and associated database-Deliverable 1.1. 2016.
- 24.
Gerdes H, Bassi S, Policy EE, et al.:
In Stream D2.2 Final Report : Evaluation of Indicators for EU Policy Objectives. 2011. Reference Source
- 25.
Fink HS:
Human-nature for climate action: Nature-based solutions for urban sustainability.
Sustain.
2016; 8(3): 254. Publisher Full Text
- 26.
BIO Intelligence Service:
Institute for Social Ecology and Sustainable Europe Research Assessment of resource efficiency indicators and targets. Final report prepared for the European Commission, DG Environment. 2012; 11–267.
- 27.
Bousted I, Hancock GF:
Handbook of Industrial Energy Analysis. 1979. Reference Source
- 28.
Boulay AM, Bare J, Benini L, et al.:
The WULCA consensus characterization model for water scarcity footprints: assessing impacts of water consumption based on available water remaining (AWARE).
Int J Life Cycle Assess.
2018; 23: 368–378. Publisher Full Text
- 29.
Ellen MacArthur Foundation Project Team:
Circularity Indicators-An Approach to Measuring Circularity. 2013. Reference Source
- 30.
Yılmaz Ö, Koç E, Venturin A, et al.:
Supplementary File for "An Environmental Evaluation Framework for Planning and Monitoring of Nature Based Solutions for Sustainable Urban Management" manuscript. 2021. http://www.doi.org/10.5281/zenodo.4764639
- 31.
Gülersoy NZ, Özsoy A, Tezer A:
Strategic quality planning in urban environment.
A|Z ITU Journal of Faculty of Architecture.
2009; 6(1): 109–125. Reference Source
- 32.
BSI P. 182:2014,Smart city concept model – Guide to establishing a model for data interoperability. 2014. Reference Source
- 33.
Hipel KW, McLeod AI:
Time Series Modelling of Water Resources and Environmental Systems. Elsevier Science, 1994; 45. Reference Source
- 34.
Ware C:
Information Visualization: Perception for Design: Second Edition. 3rd ed.; Elsevier, 2004. Reference Source
- 35.
European Commission:
Sustainable Europe Investment Plan. European Green Deal Investment Plan. 2020. Reference Source
- 36.
Malinovska V:
Global WS Ecosystem Based Adaptation-UNEC Session 1.2 Speech Notes. 2019.
- 37.
Toxopeus H, Polzin H:
Naturevation: Characterizing nature-based solutions from a business model and financing perspective. 2017; V. Reference Source
- 38.
European Commission:
Towards an EU research and innovation policy agenda for Nature-Based Solutions & Re-Naturing Cities: Final report of the Horizon 2020 expert group on “Nature-based solutions and re-naturing cities”. 2015. Publisher Full Text
- 39.
Cummins N, Conti J, Gentry B, et al.:
Strategies for Operationalizing Nature-Based Solutions in the Private Sector. The Nature Conservancy Business Council - Natural Infrastructure Working Group (Whitepaper); 2019. Reference Source
- 40.
Nicolas C, Kim J, Chi S:
Quantifying the dynamic effects of smart city development enablers using structural equation modeling.
Sustain Cities Soc.
2020; 53: 101916. Publisher Full Text
- 41.
Botí MAM, de Gusmão-Sørensen D:
Climate Change Adaptation - Research, Science and Innovation - Informing decisions, prodividing solutions. 2018. Reference Source