Introduction
Sex estimation is the primary step towards profiling unidentified skeletal remains of adult individuals. The os coxa is largely regarded as the most reliable skeletal source of sex information (Lesciotto & Klales, 2025) and forensic anthropologists as well as archaeologists have an array of qualitative (Bruzek, 2002; Klales et al., 2012; Phenice, 1969) and quantitative (Brůžek et al., 2017; Kuchař et al., 2024; Murail et al., 2005) methods at their disposal. Nevertheless, it is often the case that the os coxa is unavailable, damaged or significantly deteriorated, or it cannot produce a definite answer. Thus, practitioners have to rely on other skeletal elements to make an informed decision with long bones being largely regarded the best alternative option for sex estimation (Klales & Lesciotto, 2025; Spradley & Jantz, 2011). Furthermore, increasingly often forensic practitioners may utilize more than one sex estimation methods even when the os coxa is available, and the quantitative methods on long bones are largely considered a good supplement to the qualitative methods applied on the pelvis.
The importance and utilization of long bones in sex estimation is also reflected by the numerous methods available in literature, although, admittedly, population specificity and secular changes may also contribute to the number of bone-specific sex-diagnostic methods available. The vast majority of available methods utilizing long bones relies on standard osteometric measurements, which are either statistically modeled with the use of discriminant functions (Charisi et al., 2011; Duangto & Mahakkanukrauh, 2020; Frutos, 2005; Kranioti & Michalodimitrakis, 2009; Moore et al., 2016; Šlaus et al., 2013) or by utilizing standard machine learning algorithms (Attia et al., 2022; Curate et al., 2016; Knecht et al., 2023). However, few studies utilizing other types of metric data have demonstrated that standard osteometric measurements do not necessarily provide the best sex discriminant variables (Ammer et al., 2019; Bertsatos et al., 2021; Kranioti et al., 2011) and their utilization poses further issues regarding inter-observer measurement error when it comes to applying sex discriminant functions in the forensic context (Bertsatos et al., 2020). Moreover, the high correlation of long bone linear measurements with body size and stature hinders the sex estimation capacity of discriminant statistical models and this is further amplified by population specificity, which is an inherent problem in forensic anthropology due to the ever changing demographic structure of modern populations (Spradley et al., 2008). Previous work on the Athens Collection has shown that the cross-sectional geometric properties of the diaphysis are very well suited to capture the overall expression of sexual dimorphism in long bones, while they are relatively robust to secular changes (Bertsatos et al., 2021).
The present work focuses on the long bones of the lower (femur, tibia) and upper limbs (humerus, ulna) and it introduces a novel sex classification algorithm, which utilizes the diaphyseal cross-sectional geometric properties along with a set of other standard and non-standard measurements. The newly introduced algorithm, which is based on the concept of a hierarchical fusion framework of homogeneous and heterogeneous classifiers (Wang et al., 2021), aims to push the limits of sex classification accuracy, while preserving robust estimates of posterior probabilities, which usually are not readily available in machine learning algorithms.
Materials and Methods
The present study utilizes in total 3618 skeletal elements of the lower and upper limbs of 518 adult individuals of known sex and age-at-death from three skeletal reference collections of modern European populations from Greece and Spain. More specifically, the Athens Collection, which is housed at the Department of Animal and Human Physiology of the National and Kapodistrian University of Athens, the Cretan Collection, which is housed at the Forensic Medicine Unit of the Faculty of Medicine of the University of Crete, and the Granada Collection, which comprises individuals from the Cemeterio de San José Cemeterio in Granada, Andalucia and it is currently curated at the Department of Toxicology and Physical Anthropology of the University of Granada. The overall sample comprises intact femur, humerus, tibia, and ulna bones without any observable severe pathology and it is well distributed between sides and sex as well as among age-at-death groups. Table 1 summarizes the sample sizes for each bone grouped by collection and side, whereas Table 2 groups the number of skeletal elements as well as the number of individuals according to sex. The age-at-death distributions of the three population samples are shown as histograms in Figure 1.
Table 1. Skeletal sample size with respect to bone, side, and collection.
| Femur | Humerus | Tibia | Ulna |
|---|
| Left | Right | Left | Right | Left | Right | Left | Right |
|---|
| Athens | 196 | 200 | 204 | 209 | 205 | 210 | 206 | 200 |
| Crete | 106 | 103 | 114 | 115 | 117 | 115 | 97 | 100 |
| Granada | 148 | 146 | 130 | 140 | 150 | 149 | 131 | 127 |
| Total | 450 | 449 | 448 | 464 | 472 | 474 | 434 | 427 |
Table 2. Skeletal elements and number of individuals with respect to collection, sex, and bone.
| Athens | Crete | Granada |
|---|
| Males | Females | Males | Females | Males | Females |
|---|
| Femura | 220 | 176 | 108 | 101 | 172 | 122 |
| Humerusa | 231 | 182 | 120 | 109 | 156 | 114 |
| Tibiaa | 224 | 191 | 118 | 114 | 168 | 131 |
| Ulnaa | 228 | 178 | 109 | 88 | 153 | 105 |
| Totalb | 126 | 101 | 62 | 61 | 98 | 70 |
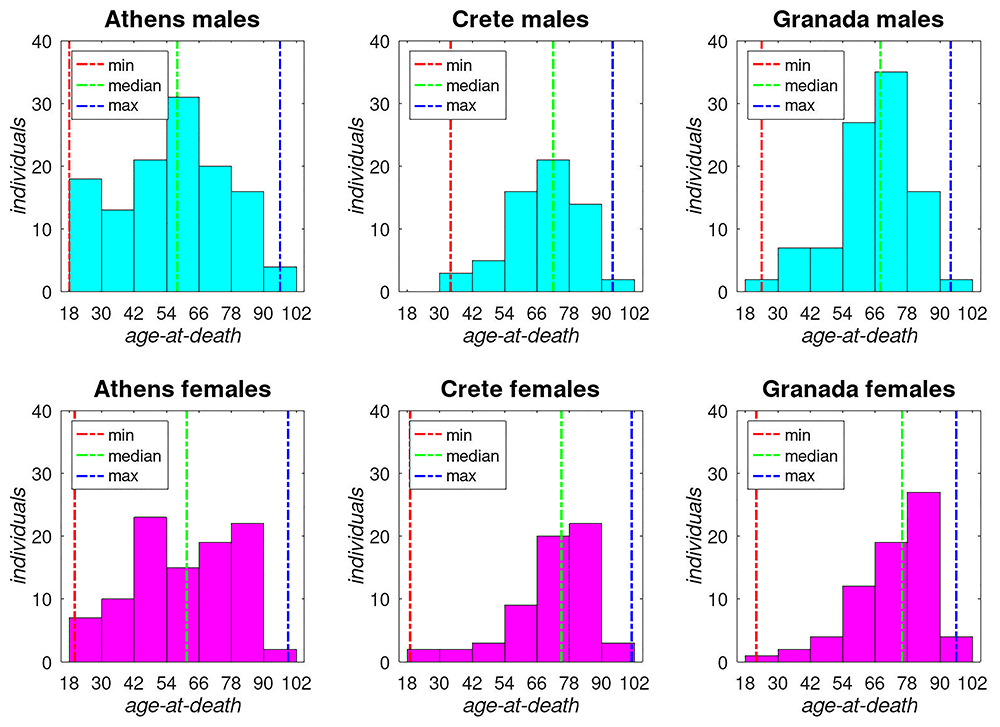
Figure 1. Age-at-death distributions of the three European population samples.
All skeletal elements have been digitized into 3D triangular meshes by means of photogrammetry. The skeletal material from the Athens Collection was previously digitized with the Photoscan Pro v1.4 software (Agisoft LLC, Russia), and the rated accuracy of these produced 3D models have been rated at about 0.2mm along their maximum length distance (Bertsatos et al., 2020). The skeletal collections from Crete and Granada were digitized with the same workflow and software albeit a much more recent version (Metashape Pro 2.10, Agisoft LLC, Russia), hence the rated accuracy of these 3D models is considered on par with those from the Athens Collection. Each skeletal digital twin has been processed with the csg-toolkit (Bertsatos, 2025b) (v1.4.1) package for the GNU Octave scientific programming language in order to extract 61 measurements including each long bone’s max distance, diaphyseal bending angles, and several cross-sectional geometric properties from 5 cross-sections evenly distributed along the diaphyseal shaft. The exact measurements are listed and described in Table 3. The complete dataset utilized in the present study is publicly available via the csg-dataset (Bertsatos, 2025a) (v1.0.0) package for the GNU Octave scientific programming language.
Table 3. List of long bone measurements extracted from 3D models.
| # | Variables |
|---|
| 1 | Max Distancea |
| 2, 14, 26, 38, 50 | Area (20%, 35%, 50%, 65%, 80%)b |
| 3, 15, 27, 39, 51 | Perimeter (20%, 35%, 50%, 65%, 80%)a |
| 4, 16, 28, 40, 52 | ArPerIndex (20%, 35%, 50%, 65%, 80%)c |
| 5, 17, 29, 41, 53 | IX (20%, 35%, 50%, 65%, 80%)d |
| 6, 18, 30, 42, 54 | IY (20%, 35%, 50%, 65%, 80%)d |
| 7, 19, 31, 43, 55 | IXY (20%, 35%, 50%, 65%, 80%)d |
| 8, 20, 32, 44, 56 | IX / IY (20%, 35%, 50%, 65%, 80%)c |
| 9, 21, 33, 45, 57 | IMIN (20%, 35%, 50%, 65%, 80%)d |
| 10, 22, 34, 46, 58 | IMAX (20%, 35%, 50%, 65%, 80%)d |
| 11, 23, 35, 47, 59 | IMAX / IMIN (20%, 35%, 50%, 65%, 80%)c |
| 12, 24, 36, 48, 60 | Theta Angle (20%, 35%, 50%, 65%, 80%)e |
| 13, 25, 37, 49 | Dihedral Angle (20-35%, 35-50%, 50-65%, 65-80%)e |
| 61 | Diaphyseal Bendinge |
For each of the four bones evaluated in the present study, all three collections as well as both bilateral pairs were pooled together composing a single unified population data set for each bone, which thereafter was processed separately with the following workflow. All 61 measurements grouped by male and female individuals were independently screened for outliers using median and interquartile range [Q1 – 1.5 × IQR: Q3 + 1.5 × IQR] and thereafter tested for sexual dimorphism with a two-samples independent t-test at a significance level of 0.05. Measurements exhibiting sexual dimorphism were standardized with a z-score transform and evaluated with univariate linear discriminant analysis classifier with regularization parameter γ set to 0.3 and uniform prior probability. Only 31 measurements from each bone with univariate classification performance above 70% accuracy were selected for the subsequent multivariate analysis that led to the construction of the sex classification ensemble model.
The design of the sex classification model follows a hierarchical predictive scheme based on embedded ensembles of univariate and multivariate classification models, which is illustrated in Figure 2. The previously selected standardized measurements were used for training two multivariate classifiers. A Linear Discriminant Analysis (LDA) classifier with regularization parameter γ set to 0.3 and uniform prior probability and a k-Nearest Neighbor (kNN) classifier with Euclidean metric distance and K = 10. The same measurements were also trained individually with same classifiers with the only difference regarding the kNN classifier with K = 20. Finally, the classification scores from all previously trained models were used for training a Fully-Connected Neural Network (FCNN) classifier with three hidden layers comprising 80, 40, and 20 neurons, respectively, and each utilizing a sigmoid function as an activation layer. In total, 65 classifiers have been trained for each bone and their output scores constitute the intermediate feature vectors for defining the criteria for the final multi-level voting-based hierarchical prediction model. All initial classifiers were trained on approximately 80% of the overall sample, which comprises only the bones whose measurements collectively do not exhibit any outlier values. Thus, the hierarchical prediction model contains two decision-making routes, one, which utilizes the full ensemble of pretrained classifiers, targeting long bones with non-outlier measurements, and a second, which only relies on the ensemble of univariate linear discriminant classifiers for predicting sex, targeting long bones containing outlier measurements. The posterior probabilities of correct sex classification were based on the evaluation of the final model across the entire dataset, that is all 3618 long bones from 518 individuals. The complete code for the entire analysis of this work is available at https://github.com/pr0m1th3as/long-bone-sex-estimation-analysis
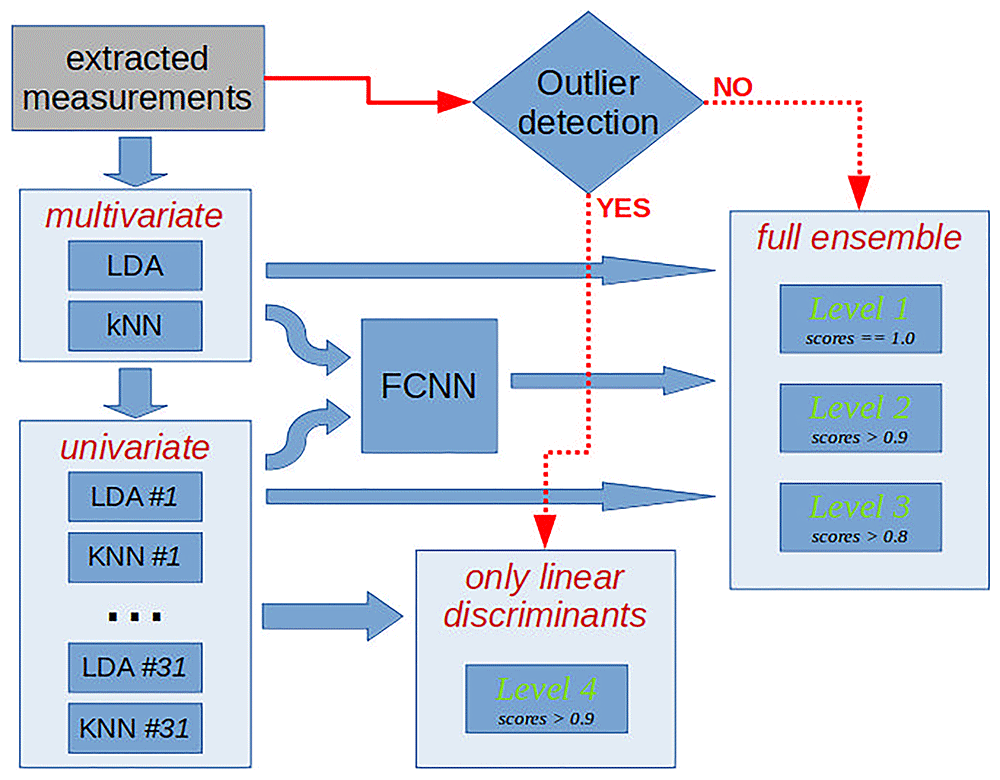
Figure 2. Block diagram of the designed sex classification model.
Results
The univariate statistics regarding all four bones revealed that only a subset of measurements exhibit sexual dimorphism, but most importantly, it further revealed that sexual dimorphism follows a distinct pattern of expression in each bone with respect to the classification accuracy of each measurement. For example, the midshaft cross-sectional area is the most sexually dimorphic measurement in femur, humerus, and ulna, whereas in tibia it is surpassed by cross-sectional perimeters. Another example is the maximum distance, which is a much more prominent sex classifier for ulna (>88%), but significantly less in other bones. The measurements utilized in multivariate analysis are listed in Table 4 along with their corresponding univariate accuracy and sample size, whereas additional statistical parameters for all sexually dimorphic measurements for each bone are provided in Appendix A.
Table 4. Long bone measurements utilized in multivariate analysis.
| Femur | Humerus | Tibia | Ulna |
|---|
| measurement | acc.a | sizeb | measurement | acc.a | sizeb | measurement | acc.a | sizeb | measurement | acc.a | sizeb |
|---|
| Area 50% | 82.6 | 892 | Area 80% | 88.5 | 894 | Perimeter 35% | 85.6 | 940 | Area 50% | 91.9 | 848 |
| Ix 50% | 82.0 | 884 | Area 65% | 87.7 | 901 | Imax 35% | 85.6 | 935 | Area 35% | 91.1 | 847 |
| Imin 50% | 81.9 | 882 | Ix 80% | 87.5 | 889 | Imax 50% | 85.3 | 926 | Area 65% | 90.9 | 849 |
| Imax 50% | 81.1 | 884 | Imin 65% | 86.7 | 897 | Perimeter 50% | 85.2 | 934 | Imin 65% | 90.2 | 849 |
| Imin 35% | 80.8 | 892 | Imin 80% | 86.6 | 889 | Iy 35% | 84.9 | 921 | Imin 50% | 90.2 | 847 |
| Area 35% | 80.7 | 893 | Iy 65% | 86.6 | 895 | Ix 35% | 84.0 | 935 | Perimeter 35% | 90.0 | 848 |
| Ix 80% | 80.7 | 874 | Imax 65% | 86.4 | 894 | Iy 50% | 83.7 | 921 | Iy 35% | 89.7 | 843 |
| Iy 50% | 80.3 | 888 | Perimeter 65% | 86.3 | 901 | Area 35% | 83.4 | 938 | Imax 35% | 89.6 | 845 |
| Area 65% | 80.1 | 891 | Ix 65% | 85.8 | 895 | Ix 50% | 82.6 | 925 | Perimeter 65% | 89.0 | 848 |
| Imin 80% | 80.0 | 876 | Imax 20% | 85.6 | 882 | Perimeter 65% | 82.3 | 936 | Imin 35% | 88.9 | 844 |
| Ix 65% | 79.8 | 882 | Perimeter 80% | 85.4 | 891 | Imax 20% | 82.2 | 934 | Perimeter 50% | 88.4 | 851 |
| Imin 65% | 79.8 | 882 | Area 20% | 85.1 | 898 | Perimeter 20% | 82.2 | 947 | Ix 35% | 88.2 | 851 |
| Perimeter 35% | 79.6 | 893 | Perimeter 20% | 84.8 | 894 | Area 50% | 81.9 | 936 | Max Distance | 88.1 | 855 |
| Imax 35% | 79.2 | 895 | Ix 35% | 84.8 | 886 | Max Distance | 81.9 | 933 | Iy 65% | 87.5 | 841 |
| Ix 35% | 79.2 | 885 | Area 50% | 84.7 | 897 | Iy 65% | 81.0 | 915 | Imax 50% | 87.4 | 844 |
| Perimeter 50% | 79.1 | 892 | Imin 50% | 84.7 | 887 | Imin 35% | 80.3 | 936 | Imax 65% | 87.2 | 847 |
| Perimeter 65% | 78.7 | 892 | Iy 20% | 84.3 | 885 | Ix 20% | 80.3 | 932 | Ix 65% | 86.2 | 838 |
| Max Distance | 78.5 | 894 | Imax 80% | 84.2 | 891 | Iy 20% | 80.2 | 930 | Area 80% | 86.1 | 847 |
| Iy 65% | 78.5 | 883 | Iy 80% | 84.1 | 892 | Imax 65% | 80.1 | 926 | Area 20% | 85.6 | 848 |
| Imax 65% | 78.5 | 887 | Max Distance | 83.9 | 893 | Ix 65% | 79.7 | 929 | Perimeter 80% | 85.4 | 850 |
| Iy 35% | 78.4 | 889 | Imin 20% | 83.4 | 888 | Area 20% | 79.5 | 937 | Ix 50% | 85.3 | 844 |
| Imin 20% | 77.6 | 870 | Ix 20% | 83.3 | 888 | Imin 50% | 79.2 | 932 | Ix 80% | 85.1 | 839 |
| Area 20% | 77.1 | 879 | Area 35% | 83.3 | 894 | Area 65% | 79.2 | 931 | Iy 20% | 84.8 | 841 |
| Area 80% | 75.7 | 886 | Iy 50% | 83.2 | 889 | Imin 65% | 78.1 | 921 | Imin 20% | 84.8 | 840 |
| Ix 20% | 75.3 | 870 | Imin 35% | 82.9 | 887 | Imin 20% | 76.9 | 934 | Imax 80% | 84.7 | 843 |
| Imax 20% | 74.7 | 842 | Imax 35% | 82.9 | 887 | Perimeter 80% | 73.7 | 930 | Imin 80% | 84.5 | 844 |
| Perimeter 80% | 74.3 | 887 | Perimeter 50% | 82.6 | 902 | Imin 80% | 73.4 | 929 | Iy 50% | 83.5 | 847 |
| Iy 20% | 73.8 | 852 | Ix 50% | 82.6 | 896 | Iy 80% | 73.3 | 920 | Iy 80% | 83.1 | 839 |
| Perimeter 20% | 72.9 | 890 | Perimeter 35% | 82.5 | 899 | Ix 80% | 73.2 | 930 | Perimeter 20% | 82.4 | 848 |
| Imax 80% | 72.4 | 912 | Imax 50% | 81.7 | 894 | Imax 80% | 73.2 | 921 | Imax 20% | 81.2 | 833 |
| ArPerIndex 80% | 70.9 | 876 | Iy 35% | 79.9 | 884 | Area 80% | 72.4 | 927 | Ix 20% | 80.5 | 839 |
The results with respect to the training accuracy of the multivariate models are summarized in Table 5. Apparently, all multivariate classifiers trained on the actual measurement data yield well above 90% of correct classification estimates with those trained on humerus and ulna performing better than their counterparts for femur and tibia. Moreover, the trained FCNN, which utilizes the output scores, performs even better reaching a maximum of 97.5% correct classification for ulna. However, even more promising results are observed at the performance of the voting-based hierarchical predictor, which for the vast majority of the samples can make highly confident predictions. According to our results, the first level of the hierarchical voting-based classifier can correctly determine sex in about three quarters of the femurs of training sample, whereas in ulnae the percentage of correct first-stage evaluation boosts to 94%. The overall performance of the complete classifier reaches 93% for tibia, 94% for femur, 95% for humerus, and 98% for ulna.
Table 5. Training accuracy of multivariate classifiers and multi-level voting-based hierarchical prediction model.
| Femur | Humerus | Tibia | Ulna |
|---|
| sample size (males, females) | 753 (410, 343) | 818 (457, 361) | 847 (453, 394) | 759 (435, 324) |
|---|
| LDAa | 90.84% | 93.52% | 91.50% | 95.52% |
| kNNb | 91.63% | 95.23% | 91.15% | 96.97% |
| FCNNc | 91.63% | 95.84% | 91.03% | 97.50% |
VB-HPMd
Scores == 1.0 | 77.03
@ 100% certainty | 86.67
@ 100% certainty | 84.30
@ 100% certainty | 94.07
@ 100% certainty |
VB-HPM
1.0 > Scores >= 0.9 | 12.75 | Males | Females | 7.21 | Males | Females | 7.91 | Males | Females | 1.98 | Males | Females |
| True | 29.2 | 45.8 | True | 33.9 | 35.6 | True | 10.4 | 38.8 | True | 20.0 | 33.3 |
| False | 3.1 | 21.9 | False | 6.8 | 23.7 | False | 7.5 | 43.3 | False | 6.7 | 40.0 |
VB-HPM
0.9 > Scores >= 0.8 | 9.83 | Males | Females | 6.11 | Males | Females | 7.56 | Males | Females | 3.82 | Males | Females |
| True | 32.9 | 43.4 | True | 36.0 | 20.0 | True | 31.2 | 32.8 | True | 31.0 | 44.8 |
| False | 9.2 | 14.5 | False | 6.8 | 10.0 | False | 21.9 | 14.1 | False | 13.8 | 10.3 |
| Full Model | 94.29% | 95.11% | 93.03% | 98.02% |
The results obtained from the cross-validation scheme of our classification models, presented in Table 6, show, as expected, a somewhat lower classification accuracy, but still of substantial performance, since femur and tibia scored about 88% accuracy, humerus exceeded 91%, and ulna reached 94%. The first level of the hierarchical voting-based classifier still produces an output with posterior probabilities of 95% or higher for the vast majority of our testing sample. According to our cross-validation results the worst performing classifier is the one utilizing the femur, which has the lowest percentage of samples (about 66%) in the best classification category (level 1, > 0.95 posterior probability) as well as the largest number of classified samples (about 22%) in the classification category with the smallest posterior probability (level 2, ~0.62). On the other hand, the best performing classifier concerns ulna, for which more than 86% of the total samples were classified at level 1 with an average posterior probability of about 0.97, whereas only 1.9% of the samples were classified by the classification category with the smallest posterior probability (level 2, ~0.56).
Table 6. Cross-validation accuracy of the final multi-level voting-based hierarchical prediction model.
| Femur | Humerus | Tibia | Ulna |
|---|
| sample size | 899 | 912 | 946 | 861 |
|---|
| Level 1 | 66.2 @ 0.956 | 80.0 @ 0.967 | 77.2 @ 0.948 | 86.5 @ 0.965 |
| Level 2 | 21.5 @ 0.617 | 6.7 @ 0.672 | 7.1 @ 0.493 | 1.9 @ 0.562 |
| Level 3 | 2.2 @ 0.750 | 6.9 @ 0.556 | 10.1 @ 0.646 | 4.8 @ 0.683 |
| Level 4 | 10.0 @ 0.956 | 6.2 @ 0.912 | 5.4 @ 0.980 | 6.6 @ 0.930 |
| undetermined | 0.1 | 0.1 | 0.2 | 0.2 |
| Total Classifcation Accuracy | 87.8% | 91.4% | 88.5% | 94.0% |
Discussion
A recent study evaluating sex estimation practices in forensic anthropology has shown that long bones are the most preferred skeletal elements when utilizing metric data (Klales & Lesciotto, 2025). Moreover, the same study showed that, when considering all methods available (both qualitative and quantitative), practitioners are most likely to prioritize pelvic bones and the skull for estimating sex. This often leads to the general assumption that long bones are considered a second-tier option with respect to sex estimation (Díaz-Navarro et al., 2024) even though several publications have shown a better performance of long bones compared to the skull (Spradley & Jantz, 2011) Thus, we argue that this general assumption is a result of an oversimplification of practitioners’ preferences over the available sex estimation methods rather than the actual sex-discriminatory capacity of the long bones. First and foremost, visual (qualitative) methods usually give relatively quick results (Krishan et al., 2016), which primarily impacts practitioners’ preferences. Secondly, most quantitative sex estimation methods rely on traditional measurements (even when acquired through virtual techniques) and simple statistical multivariate modeling of sexual dimorphism, which limits the capacity to successfully model the overall expression of sexual dimorphism. Lastly, advanced quantitative methods often involve an overly complex and/or laborious workflow to obtain the required metric data, which makes them less appealing to practitioners’ daily workload. Our proposed sex estimation model aims to address these shortcomings over existing methods by providing a fully automated workflow from metric data collection to final sex classification including posterior probability estimates and our results suggest that for the majority of cases, estimating sex from long bones can be in par with other methods involving the pelvis or the cranium. This is most prominent in our results regarding the humerus and ulna, for which sex can be correctly predicted with a posterior probability of 0.97 for about 80% of the skeletal samples, which marginally outperforms the renown DSP2 software, which deals with pelvic bones, as evaluated by several studies (Kranioti et al., 2019; Lesciotto & Klales, 2025). Ιt is important to stress that the model for ulna resulted in 91% of the sample correctly classified with over 95% posterior probability which is in line with one classical osteometric studies that mark ulna as the best sex indicator amongst the upper limb long bones (Mažuranić et al., 2025) in which however the posterior probabilities are not calculated.
Previous studies have already explored the potential of machine learning (ML) algorithms for sex estimation using long bone measurements (Knecht et al., 2023) as well as the benefits of utilizing non-standard metric data with ML algorithms to improve classification performance (Bertsatos et al., 2021). When evaluating the competence of a classification algorithm, this usually boils down to its classification accuracy (usually by applying a cross-validation scheme) and it’s potential to correctly estimate a posterior probability for each predicted outcome. Especially in forensic anthropology, where the cases usually concern a single or just a few individuals, the correct estimation of posterior probability for the predicted sex is much more important than the overall cross-validated accuracy of the classification algorithm used. The analytical calculation of the posterior probability is quite straight forward for a linear model prediction, but as soon as non-linear ML algorithms come into play, there are no analytical solutions and the estimation of posterior probabilities relies on complex cross-validation techniques (Wang, 2008). Consequently, the accuracy of posterior probability estimates is limited by the amount of training and cross-validation datasets, which poses a severe restriction in our field given the limited amount of osteological collections available for training such models. The present study mitigates this by utilizing the largest (to our knowledge) assemblage of referenced skeletal samples to train a sex estimation model for human long bones. Besides the large amount of bones used in the present study, the overall design of our proposed multi-level voting-based hierarchical prediction model was designed from the ground up with the accuracy of posterior probability estimates in mind. To this end, the intermediate FCNN classifier was trained on the output scores of the ensemble of univariate classifiers, which directly relate to the respective posterior probabilities contributed by individual measurements, but also the final posterior probability estimates were independently calculated for each level of the hierarchical based model, which is responsible for making the final classification based on the aggregated intermediate outcomes.
Another cause of concern when using ML algorithms for sex classification is overfitting, which in simple terms determines how well a model generalizes from the training data to new unseen data (Ying, 2019). The importance of overfitting when it comes to classification models cannot be overstated, but it suffices to say that using an overfitted model for sex classification is as useful as just guessing. And this is independent of how big the training data was or how well crafted scheme was utilized for computing posterior probabilities. The usual approach to evaluate overfitting (or rather its absence) from a trained model is to apply a cross-validation scheme and compare cross-validated accuracy against training/testing accuracies. The closer they are the more confidence that the model is not overfitted. However, although widely adopted, this approach does not guaranty generalization since measurements from new unseen samples may not adhere to the multivariate distributions the model was trained upon (Roelofs et al., 2019). This is the rationale behind our classification model’s design, which involved splitting the hierarchical prediction stage into two distinct paths, one utilizing the full ensemble of initial and intermediate classifiers for samples that respect the multivariate distribution of our training data, and another path for non-conforming samples, which only utilizes the scores of the univariate linear discriminant classifiers. Our cross-validation results, especially those from level 4, which directly correspond to non-conforming samples, corroborate the classification advantages of sample filtering into a dual path hierarchical prediction model. Of course, this does not make our model immune to extreme outliers or inter-population differences or secular changes, but it certainly makes it more robust.
As a final remark, an accurate and robust classifier is of little value, unless people can easily apply it on their casework and incorporate it in their daily workflow. To this end, the classification algorithm presented in this paper has been implemented as a standalone software function, named “longbone_Sex”, which is integrated in the csg-toolkit version 1.4.2 (Bertsatos, 2025d), a free and open source package, licensed under GPLv3, for the GNU Octave programming language. The “longbone_Sex” function allows for the fully automated processing of a long bone 3D model including measurement extraction free of any observer error, accurate sex classification and posterior probability computation, while reporting the results back to the user within a few seconds on any modern computer. Detailed info about the usage of the function may be found online at https://pr0m1th3as.github.io/csg-toolkit/longbone_Sex.html or through the GNU Octave interface by typing help longbone_Sex. The csg-toolkit, is a well-established and actively maintained software for analyzing the cross-sectional geometry of long bones. The rationale behind integrating sex classification functionality into the csg-toolkit instead of publishing our newly proposed sex classification algorithm as an independent software is to facilitate its adoption and widespread usage.
Ethics and consent
Ethical approval and consent were not required.
Data availability statement
Github: csg-dataset: A large dataset of diaphyseal cross sectional geometric properties and relevant measurements from human long bones. https://doi.org/10.5281/zenodo.15460970 (Bertsatos, 2025a)
The dataset utilized in the present study is freely and publicly available through Zenodo and GitHub licensed under a Creative Commons Attribution 4.0 International license. See manuscript for more details.
Faculty Opinions recommendedReferences
- Ammer S, d’Oliveira Coelho J, Cunha EM: Outline shape analysis on the trochlear constriction and olecranon fossa of the humerus: insights for sex estimation and a new computational tool.
J Forensic Sci.
2019; 64(6): 1788–1795. PubMed Abstract
| Publisher Full Text
- Attia MAH, Attia MH, Farghaly YT, et al.: Performance of the supervised learning algorithms in sex estimation of the proximal femur: a comparative study in contemporary Egyptian and Turkish samples.
Sci Justice.
2022; 62(3): 288–309. PubMed Abstract
| Publisher Full Text
- Bertsatos A: pr0m1th3as/csg-dataset: a large dataset of diaphyseal cross sectional geometric properties and relevant measurements from human long bones. (Version v1.0.0) [Computer software]. Zenodo. 2025a. http://www.doi.org/10.5281/zenodo.15460970
- Bertsatos A: pr0m1th3as/csg-toolkit: a GNU Octave package for analyzing long bone diaphyseal cross sectional geometry. (Version v1.4.1) [Computer software]. Zenodo. 2025b. http://www.doi.org/10.5281/zenodo.15459205
- Bertsatos A:
Appendix A: descriptive statistics of sex-dimorphic long bone measurements [Data set]. Zenodo. 2025c. http://www.doi.org/10.5281/zenodo.15838539
- Bertsatos A: pr0m1th3as/csg-toolkit: A GNU Octave package for analyzing long bone diaphyseal cross sectional geometry. (Version v1.4.2) [Computer software]. Zenodo. 2025d. http://www.doi.org/10.5281/zenodo.15468991
- Bertsatos A, Garoufi N, Chovalopoulou ME: Advancements in sex estimation using the diaphyseal cross-sectional geometric properties of the lower and upper limbs.
Int J Legal Med.
2021; 135(3): 1035–1046. PubMed Abstract
| Publisher Full Text
- Bertsatos A, Gkaniatsou E, Papageorgopoulou C, et al.: “What and how should we share?” An inter-method inter-observer comparison of measurement error with landmark-based craniometric datasets.
Anthropol Anz.
2020; 77(2): 109–120. PubMed Abstract
| Publisher Full Text
- Bruzek J: A method for visual determination of sex, using the human hip bone.
Am J Phys Anthropol.
2002; 117(2): 157–168. PubMed Abstract
| Publisher Full Text
- Brůžek J, Santos F, Dutailly B, et al.: Validation and reliability of the sex estimation of the human os coxae using freely available DSP2 software for bioarchaeology and forensic anthropology.
Am J Phys Anthropol.
2017; 164(2): 440–449. PubMed Abstract
| Publisher Full Text
- Charisi D, Eliopoulos C, Vanna V, et al.: Sexual dimorphism of the arm bones in a modern Greek population.
J Forensic Sci.
2011; 56(1): 10–18. PubMed Abstract
| Publisher Full Text
- Curate F, Coelho J, Gonçalves D, et al.: A method for sex estimation using the proximal femur.
Forensic Sci Int.
2016; 266: 579.e1–579.e7. PubMed Abstract
| Publisher Full Text
- Díaz-Navarro S, Díez-Hermano S, Rojo-Guerra MA, et al.: Sex estimation using long bones in the largest burial site of the Copper age: linear discriminant analysis and random forest.
J Archaeol Sci Rep.
2024; 58: 104730. Publisher Full Text
- Duangto P, Mahakkanukrauh P: Sex estimation from upper limb bones in a Thai population.
Anat Cell Biol.
2020; 53(1): 36–43. PubMed Abstract
| Publisher Full Text
| Free Full Text
- Frutos LR: Metric determination of sex from the humerus in a Guatemalan forensic sample.
Forensic Sci Int.
2005; 147(2–3): 153–157. PubMed Abstract
| Publisher Full Text
- Klales AR, Lesciotto KM: Reevaluating skeletal sex estimation practices in forensic anthropology.
J Forensic Sci.
2025; 70(3): 825–834. PubMed Abstract
| Publisher Full Text
- Klales AR, Ousley SD, Vollner JM: A revised method of sexing the human innominate using Phenice’s nonmetric traits and statistical methods.
Am J Phys Anthropol.
2012; 149(1): 104–114. PubMed Abstract
| Publisher Full Text
- Knecht S, Santos F, Ardagna Y, et al.: Sex estimation from long bones: a machine learning approach.
Int J Legal Med.
2023; 137(6): 1887–1895. PubMed Abstract
| Publisher Full Text
- Kranioti EF, Michalodimitrakis M: Sexual dimorphism of the humerus in contemporary Cretans-a population-specific study and a review of the literature.
J Forensic Sci.
2009; 54(5): 996–1000. PubMed Abstract
| Publisher Full Text
- Kranioti EF, Nathena D, Michalodimitrakis M: Sex estimation of the Cretan humerus: a digital radiometric study.
Int J Legal Med.
2011; 125(5): 659–667. PubMed Abstract
| Publisher Full Text
- Kranioti EF, Šťovíčková L, Karell MA, et al.: Sex estimation of os coxae using DSP2 software: a validation study of a Greek sample.
Forensic Sci Int.
2019; 297: 371.e1–371.e6. PubMed Abstract
| Publisher Full Text
- Krishan K, Chatterjee PM, Kanchan T, et al.:
A review of sex estimation techniques during examination of skeletal remains in forensic anthropology casework.
Forensic Sci Int.
2016; 261: 165.e1–165.e8. PubMed Abstract
| Publisher Full Text
- Kuchař M, Pilmann Kotěrová A, Morávek A, et al.:
Automatic variable extraction from 3D coxal bone models for sex estimation using the DSP2 method.
Int J Legal Med.
2024; 138(6): 2647–2658. PubMed Abstract
| Publisher Full Text
| Free Full Text
- Lesciotto KM, Klales AR:
Sex estimation using metrics of the innominate: a test of the DSP2 method.
J Forensic Sci.
2025; 70(1): 249–257. PubMed Abstract
| Publisher Full Text
| Free Full Text
- Mažuranić A, Bubalo P, Baković M:
Osteometric sex estimation using the humerus, the radius and the ulna in the contemporary population of Croatia.
J Forensic Leg Med.
2025; 111: 102852. PubMed Abstract
| Publisher Full Text
- Moore MK, DiGangi EA, Niño Ruíz FP, et al.:
Metric sex estimation from the postcranial skeleton for the Colombian population.
Forensic Sci Int.
2016; 262: 286.e1–286.e8. PubMed Abstract
| Publisher Full Text
- Murail P, Bruzek J, Houët F, et al.:
DSP: A tool for probabilistic sex diagnosis using worldwide variability in hip-bone measurements.
Bulletins et Mémoires de La Société d’Anthropologie de Paris.
2005; 17(3–4): 167–176. Reference Source
- Phenice TW:
A newly developed visual method of sexing the os pubis.
Am J Phys Anthropol.
1969; 30(2): 297–301. PubMed Abstract
| Publisher Full Text
- Roelofs R, Fridovich-Keil S, Miller J, et al.:
A meta-analysis of overfitting in machine learning. In: Proceedings of the 33rd International Conference on Neural Information Processing Systems. Curran Associates Inc, 2019. Reference Source
- Šlaus M, Bedić Ž, Strinović D, et al.:
Sex determination by discriminant function analysis of the tibia for contemporary croats.
Forensic Sci Int.
2013; 226(1–3): 302.e1–302.e4. PubMed Abstract
| Publisher Full Text
- Spradley MK, Jantz RL:
Sex estimation in forensic anthropology: skull versus postcranial elements.
J Forensic Sci.
2011; 56(2): 289–296. PubMed Abstract
| Publisher Full Text
- Spradley MK, Jantz RL, Robinson A, et al.:
Demographic change and forensic identification: problems in metric identification of hispanic skeletons.
J Forensic Sci.
2008; 53(1): 21–28. PubMed Abstract
| Publisher Full Text
- Wang L, Mo T, Wang X, et al.:
A hierarchical fusion framework to integrate homogeneous and heterogeneous classifiers for medical decision-making.
Knowledge-Based Systems.
2021; 212: 106517. Publisher Full Text
- Wang X:
Posterior probability reconstruction for multi-class support vector machines. 2008 International Conference on Computational Intelligence and Security. 2008; 240–243. Publisher Full Text
- Ying X:
An overview of overfitting and its solutions.
Journal of Physics: Conference Series.
2019; 1168: 022022. Publisher Full Text









