The primary objective of this section is to detect stable topological patterns, using persistent entropy as the main tool. Additionally, we extend this analysis to define topology-based safety regions, which aim to prevent negative events such as collisions and deadlocks. In this way, we have followed two main lines of work:
Addressing these challenges contributes to the broader objective of improving agent fleet behavior analysis, efficiency, and safety by applying topological tools, ensuring robust performance in dynamic environments. This section is an extended version of the paper35 accepted at the Int. Conf. XAI20258.
5.2 Experiments
In this section, we present the experiments done and the results obtained from the two research lines studied.
5.2.1 L1: Detection of stable topological patterns using persistent entropy. The experiments conducted in this subsection are divided into two parts, based on the different scenarios used: Corridor and Cross scenario. In each of these scenarios, persistent entropy is used to assess the state of the agent fleet during the simulation run, as well as to differentiate between agent fleet behaviors, and explore the relationship between collision and simulation efficacy with the metrics computed.
Corridor scenario. Firstly, we executed a single simulation run with 20 agents, where each agent followed the HL behavior. This simulation run consists of 500 time steps with a time increment of 0.1 seconds between each step, lasting a total of 50 seconds.
We begin our analysis computing persistent entropy. It is of interest to understand the global significance of high or low entropy values, identifying the time step with the highest or lowest entropy in the persistent entropy time series (computed from the point cloud at each time step). Additionally, we seek to interpret the meaning of small or large entropy differences between consecutive time steps. See the persistent entropy time series for this simulation run in Figure 34. Persistent entropy is observed to vary between 2.42 and 2.56, showing a general upward trend until approximately time 200, followed by a fluctuating decline. This suggests that the agents initially become more uniformly dispersed before some begin to cluster again.
We interpret persistent entropy to understand the spatial distribution of agents as follows:
High entropy means that the intervals in the barcode are more evenly distributed in length, suggesting greater dispersion among the agents, so that the distribution of the agents is more uniform, without agent clusters in certain areas and without empty areas or areas with few agents. In Figure 35, we show the point clouds corresponding to local maxima with a minimum separation of 20 time steps, as consecutive maxima may not indicate significant changes.
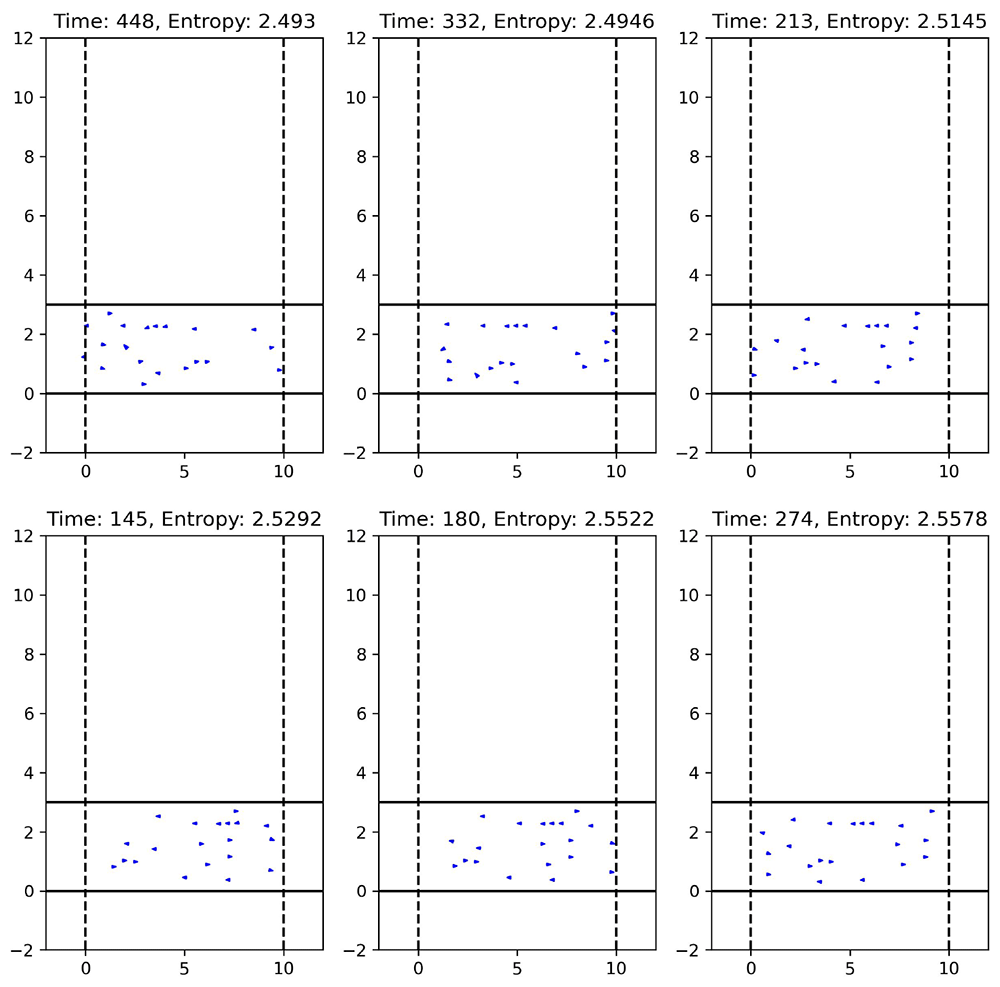
Figure 35. Time steps with high entropy of a simulation run with 20 agents, where agents followed the HL behavior.
Lower entropy means that intervals are more unevenly distributed and suggests less dispersion of the agents, so that some agents are somewhat clustered together in one area of space, and others are further apart in another area, leaving areas somewhat empty. In Figure 36, we show the point clouds corresponding to local minima with a minimum distance of 20 time steps between them, as consecutive minima may not indicate significant changes.
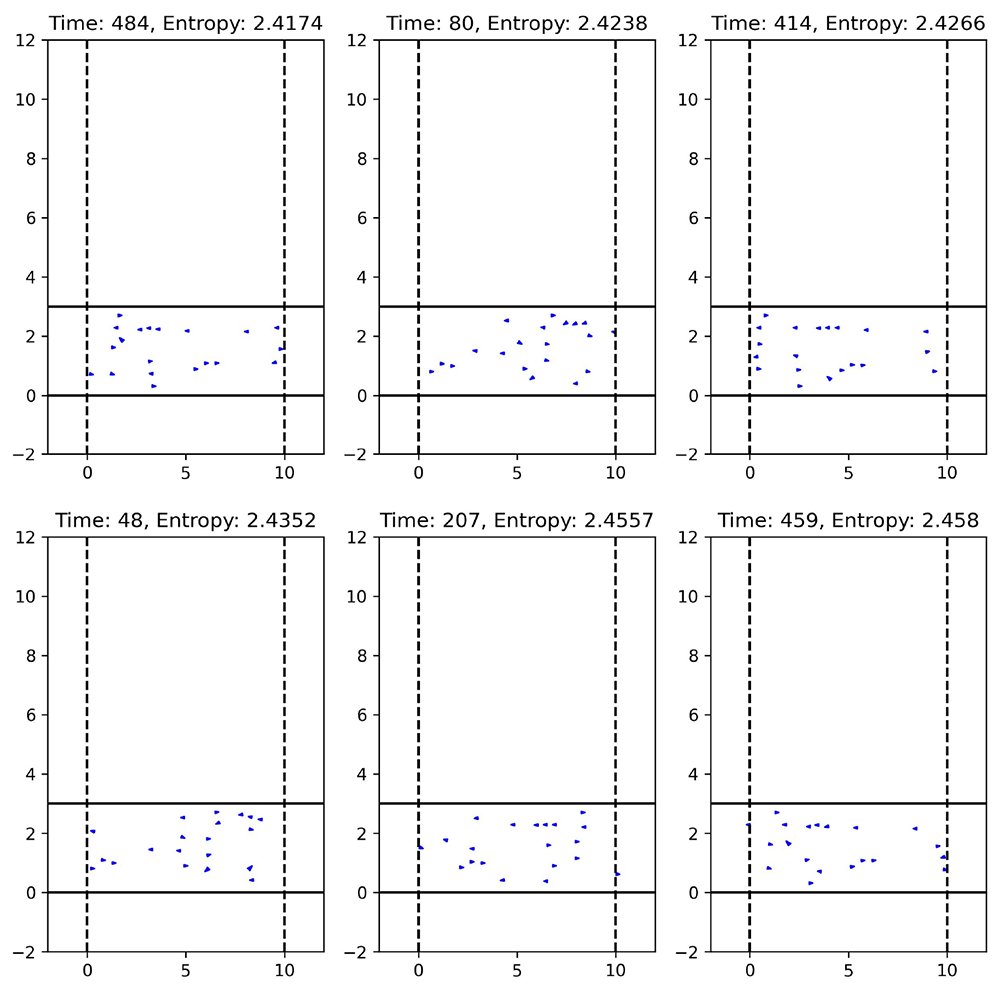
Figure 36. Time steps with low entropy of a simulation run with 20 agents, where agents followed the HL behavior.
Summing up, a specific time step in a simulation run with higher entropy indicates greater dispersion among the agents, that is, a more uniform distribution of the agents across the space, with fewer clusters and fewer empty or sparsely populated regions. Conversely, lower entropy suggests less dispersion of the agents, with agents more likely to concentrate in specific areas, forming clusters and leaving other regions empty.
Similarly, we executed a single simulation run with 20 agents, where each agent followed the ORCA navigation behavior. This simulation run consists of 500 time steps with a time increment of 0.1 seconds between each step, lasting a total of 50 seconds. We obtain similar results for this behavior as before. We explain the distribution of agents in space using persistent entropy: higher entropy suggests a greater dispersion among the agents. Conversely, lower entropy suggests less dispersion. See Figure 37 for the time steps corresponding to the different deciles of the entropy time series, where we illustrate how persistent entropy reflects the spatial distribution of agents. Figure 38 presents the time series of the persistent entropy time series obtained using ORCA behavior. In this case, entropy fluctuates between 2.325 and 2.5, showing a general downward trend over time. This indicates that the agents tend to cluster more over time, leaving some areas of space emptier.
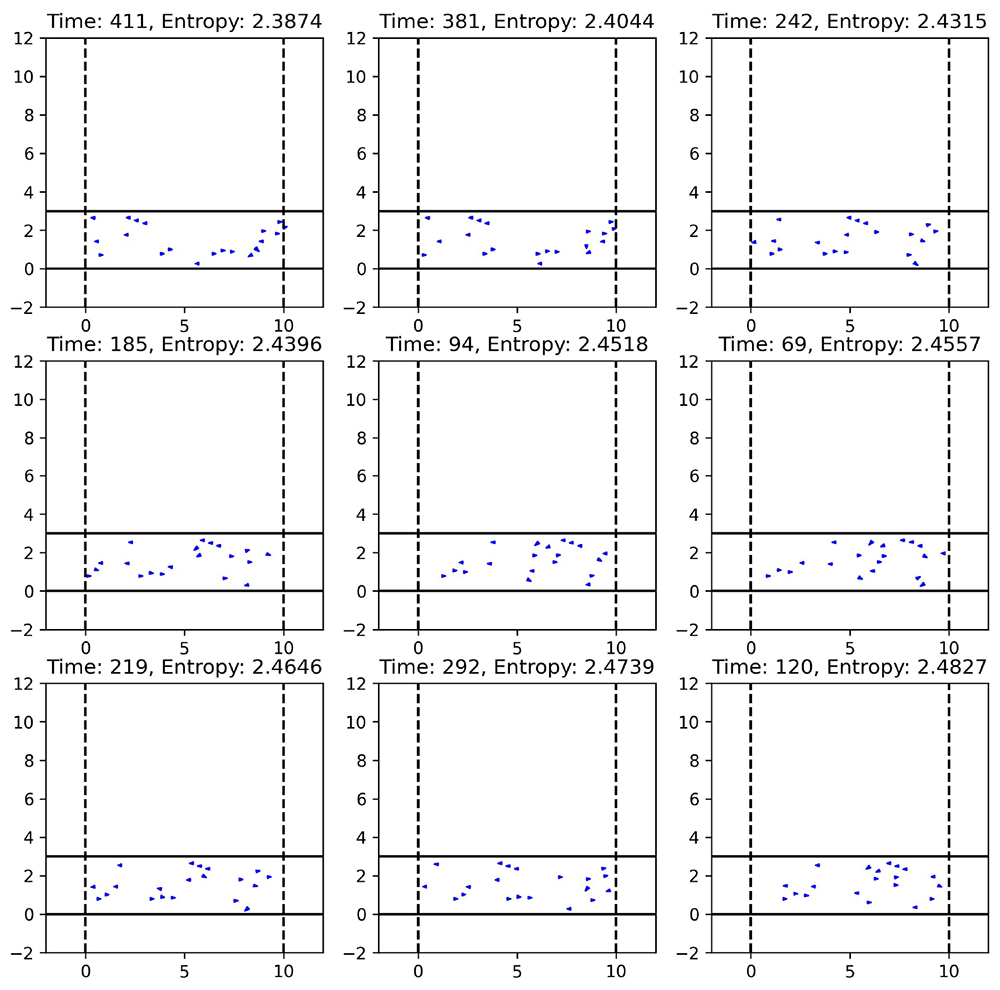
Figure 37. Time step of the different deciles of the persistent entropy time series for a simulation run with 20 agents, where agents followed the ORCA behavior.
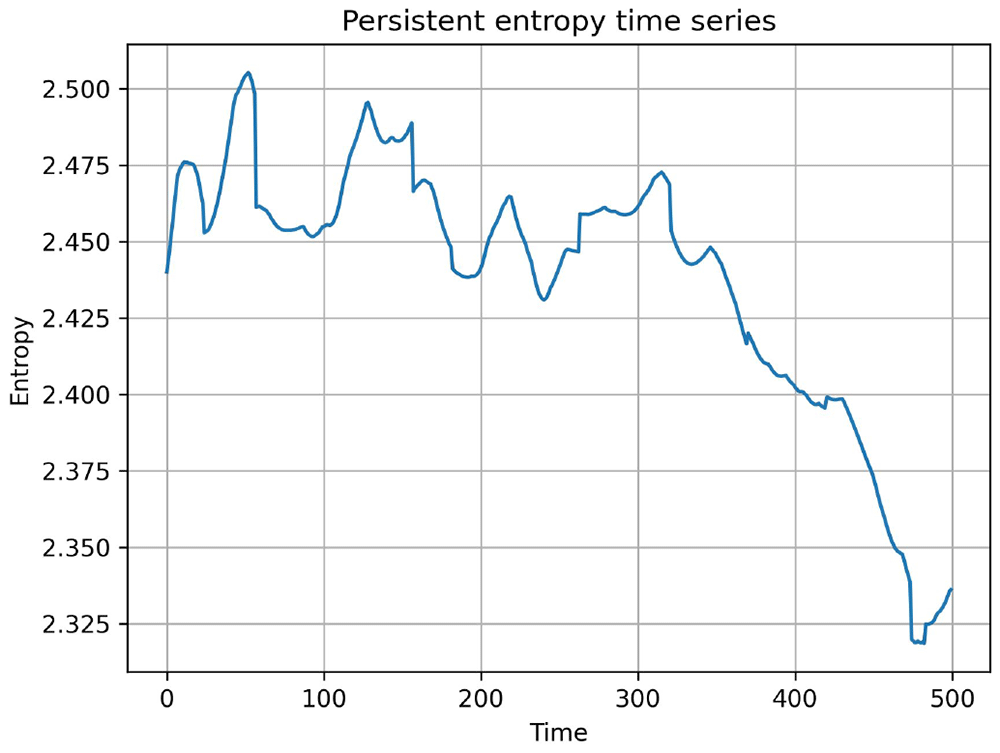
Figure 38. Persistent entropy time series of a simulation run with the agents following the ORCA behavior.
Figure 34 and Figure 38 show the persistent entropy time series for a simulation run following the HL and ORCA behaviors, respectively. As we can observe, the two series do not follow a similar pattern or shape. While HL persistent entropy time series shows an initial dispersion pattern followed by moderate clustering, ORCA persistent entropy time series tends towards more pronounced clustering over time.
Secondly, we executed N = 10 simulation runs with 20 agents, where agents followed the same behavior (HL or ORCA). Each simulation run consisted of 3000 time steps with a time increment of 0.1 seconds between each step, in a total duration of 300 seconds. We aimed to compare both behaviors through the persistent entropy time series. The safety_margin parameter was not fixed, but uniformly distributed between 0 and 0.5. The 10 simulation runs for each behavior were conducted with identical parameters, including the same safety_margin. We can see the persistent entropy time series obtained for the simulation runs using the HL and the ORCA behavior in Figure 39 and Figure 40, respectively. Several differences were noted:
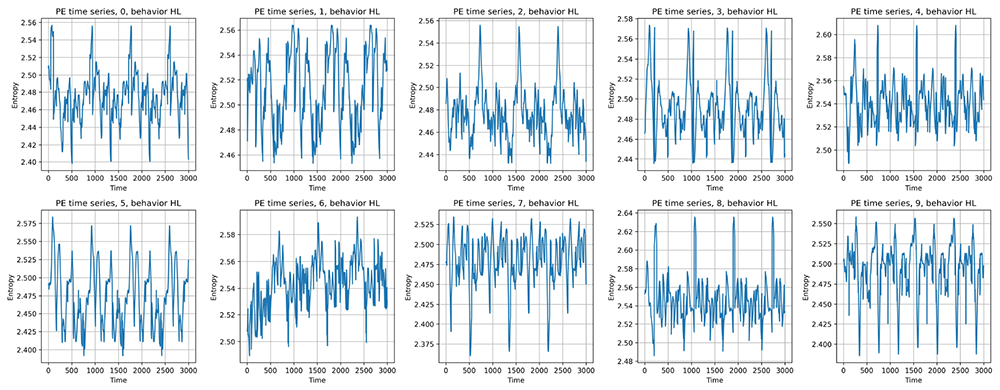
Figure 39. Persistent entropy time series for different simulation runs with the agents following the HL behavior.
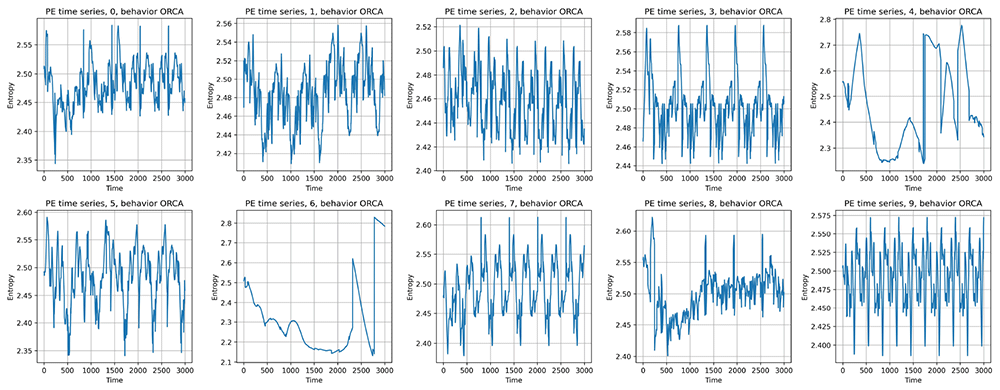
Figure 40. Persistent entropy time series for different simulation runs with the agents following the ORCA behavior.
Oscillation patterns: The persistent entropy time series for the HL behavior exhibit smooth and regular oscillations. The amplitude of these oscillations remains consistent over time, indicating a stable and predictable behavior of the system. In contrast, the time series for ORCA exhibit more irregular oscillations with greater variability in amplitude. There are more pronounced and less predictable fluctuations, suggesting a more unstable behavior.
Persistent entropy stability: The persistent entropy in HL simulation runs remains within a narrow range of values, showing little variation between different simulation runs. This denotes high stability and consistency in the agent’s behavior under this mode. On the other hand, ORCA simulation runs exhibit greater dispersion in persistent entropy values. Some experiments show significant variations, which indicate that the behavior is more sensitive to initial conditions or changes in parameter values, such as safety_margin.
Transitions and abrupt changes: Transitions between time steps with different persistent entropy values are gradual and smooth, reflecting continuous and controlled adaptation of the system in the HL simulation runs. In ORCA simulation runs, there are more abrupt and sudden changes in the persistent entropy time series. These rapid transitions indicate more reactive responses or fluctuations in the agent’s behavior.
Consistency between simulation runs: There is a high similarity between the persistent entropy time series of different simulation runs for the HL behavior. The patterns are consistent, suggesting that the behavior is robust and less prone to random variations. On the other hand, ORCA simulation runs show greater diversity in the persistent entropy time series. Some time series differ significantly from others, which implies that this behavior is more complex or influenced by multiple factors.
General trends: In the HL simulation runs, the persistent entropy time series maintain a relatively constant trend without marked deviations, which may be associated with balanced and stable behavior. In contrast, the persistent entropy time series computed from the ORCA simulation runs exhibit upward or downward trends during certain time intervals, indicating possible changes in the system’s state or the agents’ activity.
In summary, persistent entropy time series computed from simulation runs following HL behavior tend to exhibit greater stability, consistency, and regularity. In contrast, persistent entropy time series computed from simulation runs following ORCA behavior display greater variability, characterized by more irregular oscillations and abrupt transitions. These differences suggest that agents following HL behavior operate more predictably and stably, whereas those following ORCA behavior exhibit more complex dynamics and may be more adaptive or sensitive to changes in the environment.
Thirdly, we performed an analysis comparing specific statistical properties of the persistent entropy time series for the two behaviors, using boxplots and hypothesis testing, specifically the Mann–Whitney test. The boxplots are used to visualize the distribution of different metrics (means, medians, standard deviations, interquartile range) between the two types of simulation runs (HL and ORCA), while the Mann-Whitney test is performed to determine whether the observed differences between the two types of simulation runs are statistically significant. See Figure 41.
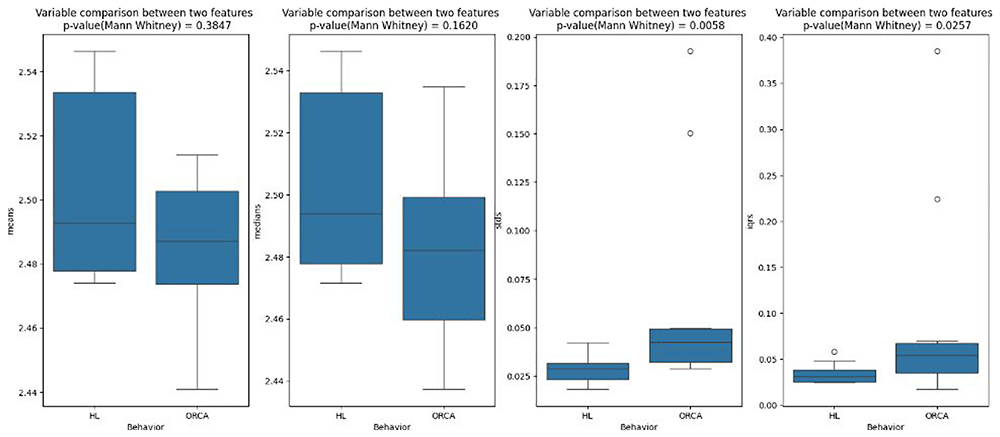
Figure 41. Boxplot analysis between HL and ORCA behaviors for the Corridor scenario.
Out of the four analyses performed, standard deviation and interquartile range show significant differences between the HL and ORCA behaviors, while the comparisons of means and medians do not present significant differences. This suggests that although the central tendency measures are similar for both behaviors, the dispersion measures differ.
Lastly, we executed N = 100 simulation runs for each behavior (HL and ORCA), with 40 agents. Each simulation run consists of 1000 time steps with 0.1 seconds between each step, lasting a total of 100 seconds, with safety_margin parameter not fixed, but uniformly distributed between 0 and 0.1. We aimed to analyze the relationship between the time series through statistical metrics (mean, median, standard deviation, skewness, and interquartile range) with collisions and simulation efficacy (which is highly related to deadlocks). First, we focus on simulation runs in which the agents follow the HL behavior and then on those in which the agents follow the ORCA behavior.
Regarding HL simulation runs, the analysis suggests that medians, standard deviations, and interquartile ranges have significant correlations with simulation efficacy. While medians are slightly positively correlated (ρ = 0.35, p-value= 0.0004), standard deviations (ρ = −0.89, p-value= 1.95 × e−34) and interquartile range (ρ = −0.83, p-value= 6.42 × e−27) are strongly negatively correlated with simulation efficacy, meaning that simulation runs with lower standard deviations and interquartile range about the persistent entropy time series will have a higher efficacy. Means and skewness do not show a significant relationship with efficacy. See, in Figure 42, the scatter plots between these statistical metrics of the persistent entropy time series and simulation efficacy, where we show the relationships we have discussed. Also, some examples of persistent entropy time series of simulation runs with lower efficacy are shown in Figure 43, and higher efficacy in Figure 44.
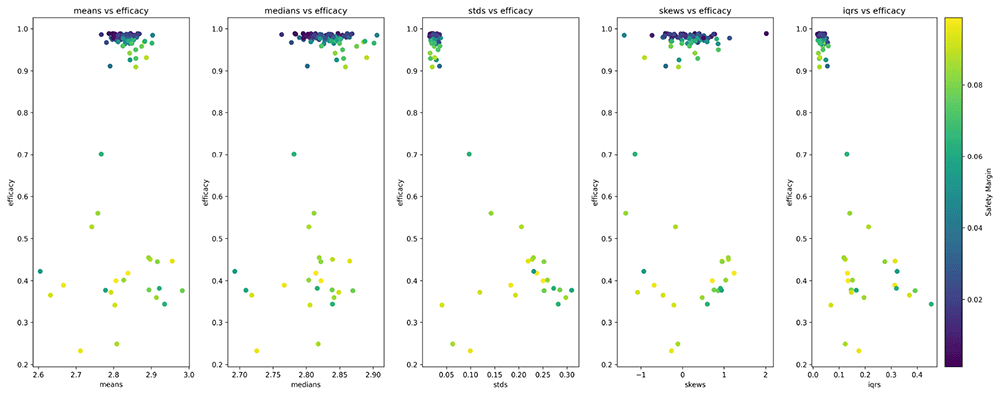
Figure 42. Scatter plots between statistical metrics of the persistent entropy time series and simulation efficacy for the HL behavior.
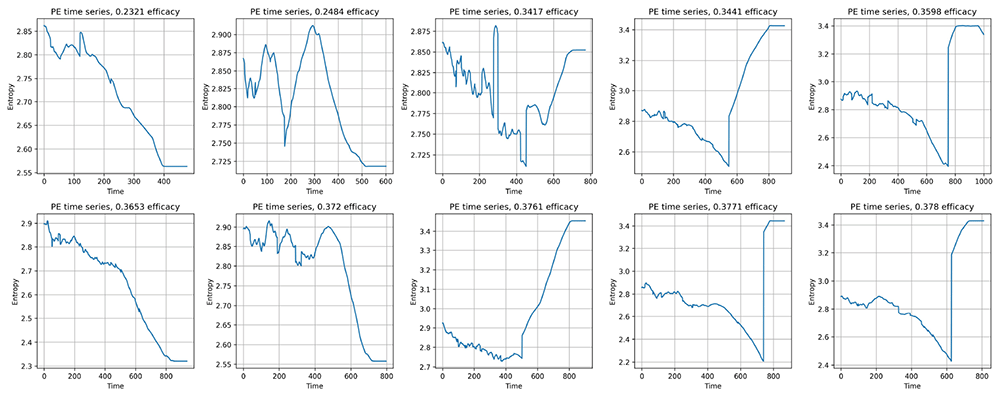
Figure 43. Persistent entropy time series of Navground simulation runs with less efficacy for the HL behavior.
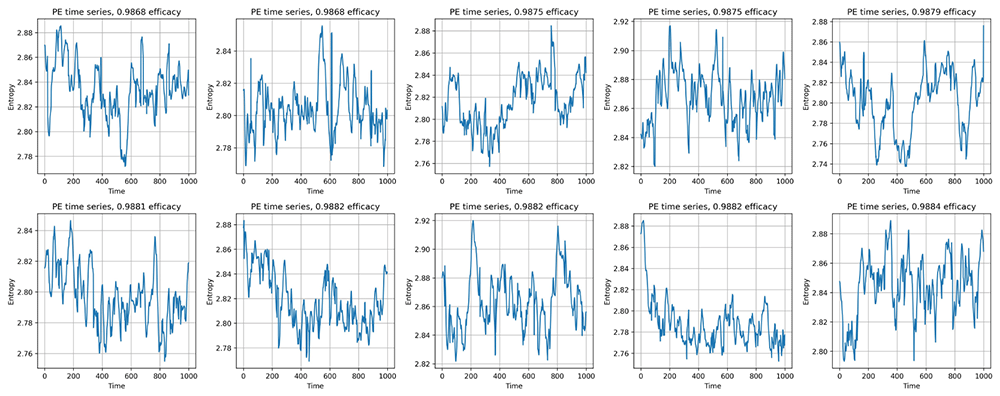
Figure 44. Persistent entropy time series of Navground simulation runs with greater efficacy for the HL behavior.
Different patterns can be observed, particularly in the time series of simulation runs with low efficacy, which show very pronounced drops or increases in entropy until they stabilize completely. This indicates that all the agents are likely in a deadlock state, with no movement occurring. In contrast, simulation runs with high efficacy exhibit the constant oscillations and periodicity that we have seen in previous graphs. On the other hand, if we make a similar analysis with collisions, we do not have any significant correlation between these metrics and collisions.
Regarding ORCA simulation runs, the analysis also suggests that standard deviations and interquartile ranges have significant negative correlations with simulation efficacy, meaning that simulation runs with lower standard deviations and interquartile ranges in reference to the persistent entropy time series will have a higher efficacy. See in Figure 45, the scatter plots between these statistical metrics of the persistent entropy time series and simulation efficacy, where the relationships we have discussed previously are shown. In the same way, the differences between persistent entropy time series of simulation runs with lower efficacy and higher efficacy persist for ORCA behavior.
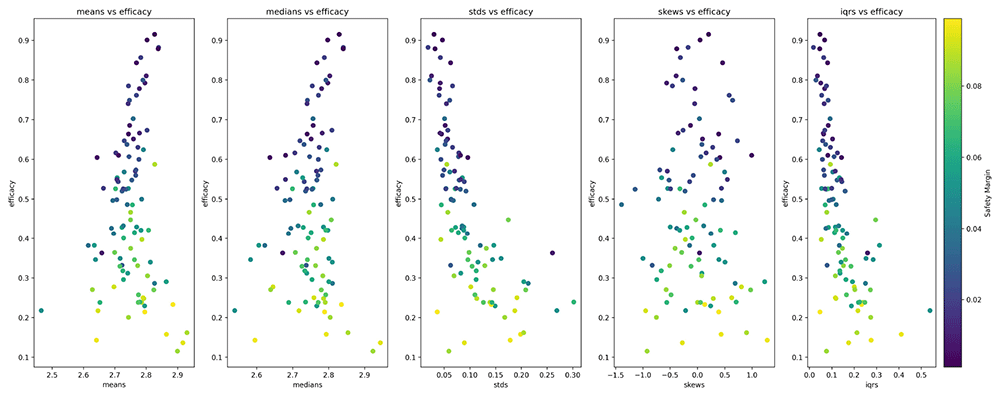
Figure 45. Scatter plots between statistical metrics of the persistent entropy time series and simulation efficacy for the ORCA behavior.
In addition, in ORCA simulation runs, the analysis suggests that while standard deviations and interquartile range are slightly positively correlated with simulation efficacy, means and medians are negatively correlated with simulation efficacy, meaning that simulation runs with lower means and medians in reference to the persistent entropy time series will be more efficient. Skewness does not show a significant relationship with efficiency. See in Figure 46, the scatter plots between these statistical metrics for the persistent entropy time series and safety.
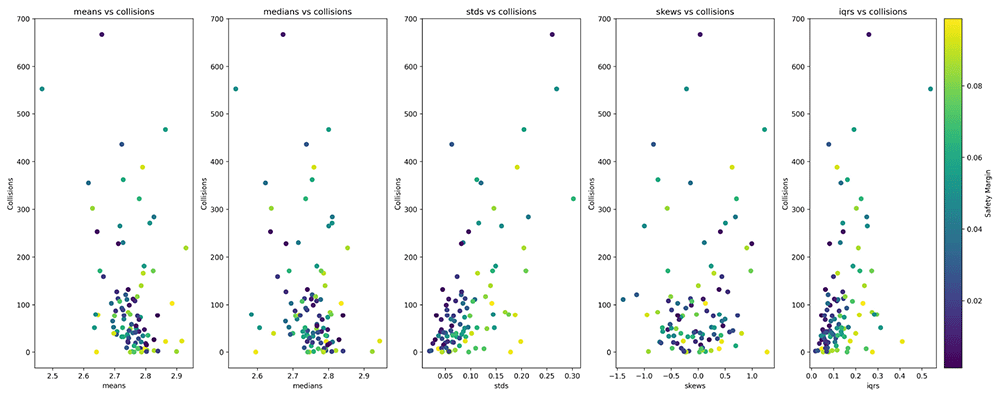
Figure 46. Scatter plots between statistical metrics of the persistent entropy time series and collisions for the ORCA behavior.
Cross scenario. For this scenario, we have limited ourselves to commenting and explaining the results obtained, without adding figures, in order not to extend the document any further.
First, we executed a single simulation run for each behavior, with 20 agents, where each agent followed the specific navigation behavior (ORCA or HL). This simulation run consists of 500 time steps with a time increment of 0.1 seconds between each step, lasting a total of 50 seconds.
As for the Corridor scenario, once again, a time step with a higher entropy indicates a greater dispersion among the agents in relation how they are distributed around the space, without agent clusters in certain areas and without empty areas or areas with few agents, being less likely to have empty areas and to form cluster of agents very grouped and another ones very far away, while a lower entropy indicates that less dispersion between the agents, being more likely to occupy specific regions of space and form clusters.
Regarding the study of the correlation between the persistent entropy changes between two consecutive time steps and the total distance traveled by the agents during these steps, we found a slightly significant correlation (ρ = 0.21, p-value= 3.2 × e−6 for ORCA and ρ = 0.15, p-value= 0.001 for HL), meaning that if there is a larger persistent entropy change in space due to the agents’ movement between two consecutive steps, the total distance traveled by the agents will be greater than in steps with lower or slight entropy changes, where the agents move less. This slightly positive significant correlation indicates a weak positive relationship between these two variables. Additionally, it is worth noting that between two consecutive time steps, the total distance traveled by the agents is greater for ORCA than for HL in the Corridor scenario, while the opposite occurs in the Cross scenario. Comparing different simulation runs in this type of scenario with HL and ORCA behaviors, they exhibit notable differences in several aspects. In terms of general trends, the HL simulation runs show persistent entropy values that remain within a relatively high range, whereas several ORCA simulation runs show a more pronounced downward trend, suggesting that the average entropy may be decreasing over time. Regarding variability and oscillations, HL simulation runs exhibit significant fluctuations but within a more constrained range, while for ORCA simulation runs, although oscillations are also present, some time series show a more pronounced decrease with lower minimum values.
The range of entropy values also differs between the two behaviors. In the HL simulation runs, the values appear to be concentrated between 2.55 and 2.75. In contrast, in the ORCA simulation runs, a wider range is observed, approximately between 2.3 and 2.8, indicating greater variability. Additionally, the long-term behavior shows that in the HL simulation runs, entropy remains relatively stable, fluctuating without a clear trend, while in the ORCA simulation runs, some time series exhibit a more evident decline, suggesting that this behavior tends to become more predictable over time.
In conclusion, the ORCA simulation runs display greater variability and a tendency toward persistent entropy reduction in some series, while in the HL simulation runs, entropy remains more stable and higher. This could indicate that the ORCA behavior generates a more structured or less chaotic pattern over time compared to the HL behaviour.
An analysis is also conducted that involves comparing certain statistical variables for the two behaviors using boxplots and hypothesis testing, specifically the Mann-Whitney test. In the boxplots that correspond to the means and medians of the time series, HL behavior shows slightly higher values compared to ORCA behavior, although the distributions overlap considerably. The p-value of 0.1859 indicates that this difference is not statistically significant, suggesting that the differences in mean and median entropy between the two behaviors are inconclusive. On the other hand, the boxplots representing standard deviation and interquartile range reveal more noticeable differences. In particular, ORCA behavior exhibits a higher standard deviation, indicating greater variability in entropy compared to HL behavior. The p-value of 0.0140 suggests that this difference is statistically significant. Additionally, kurtosis is also higher in ORCA behavior, meaning that its distribution has heavier tails or is more concentrated around certain values compared to HL behavior. The p-value of 0.0058 confirms that this difference is also significant.
In conclusion, while the mean and median entropy values do not show significant differences between HL and ORCA behaviors, the variability and distribution characteristics do. ORCA behavior exhibits greater dispersion and a more extreme distribution compared to HL behavior, supporting the idea that ORCA generates a more variable and less stable dynamic over time.
Lastly, we execute N = 100 simulation runs for each behavior (HL and ORCA), with 40 agents. Each simulation run consists of 1000 time steps with a time increment of 0.1 seconds between each step, lasting a total of 100 seconds. As we want to compare both behaviors through the persistent entropy time series for each simulation run, safety_margin parameter is not fixed, but uniformly distributed between 0 and 0.1. Regarding the HL simulation runs, the analysis suggests that the ranges of means and medians in the persistent entropy time series have a strong negative significant correlation with the number of collisions (ρ = −0.64 for the mean and the number of collisions, and ρ = −0.62 for the median and the number of collisions). This implies that simulation runs with lower mean or median persistent entropy are more likely to experience a higher number of collisions among agents. In contrast, standard deviation, skewness, and interquartile range do not show a significant relationship with the number of collisions.
Similarly, these variables exhibit the same relationship with simulation efficacy (ρ = −0.59 for the mean and the simulation efficacy, and ρ = −0.55 for the median and the simulation efficacy): the lower the mean or median persistent entropy, the higher the efficacy. In other words, a lower mean or median entropy value reduces the likelihood of deadlocks, as higher efficacy indicates that agents move at a speed close to the optimal one. This suggests that lower entropy states may correspond to more structured and coordinated agent movements, allowing for smoother navigation and fewer disruptions caused by congestion or erratic behavior.
The results obtained suggest that there is a strong, positive, and significant correlation between the mean and median time series with both the number of collisions (ρ = −0.57 for the mean and the number of collisions, and ρ = −0.57 for the median and the number of collisions) and simulation efficacy (ρ = −0.88 for the mean and the efficacy, and ρ = −0.88 for the median and the efficacy).
These aspects, which show differences between the behaviors in both scenarios, suggest that we could create a classifier that, using the time series of persistent entropy as input, could predict the type of behavior followed by the agents in the simulation run.
5.2.2 L2: Topology-based safety region construction for collision and deadlock avoidance. Using Navground, we generated a suitable dataset to study the safety of agents’ movement while avoiding collisions, deadlocks, and both of them, via probabilistic scaling and conformal prediction methods, with interpretation via rule-based classifiers. We executed N = 10000 simulation runs, each with 2000 time steps, with a time increment of 0.1 seconds. We considered a fleet of 20 agents. Each agent follows the HL behavior with the following parameters:
vopt = 0.12 m/s
τrot = 0.5 s
σ sampled uniformly from [0.0 m, 0.1 m] for collision avoidance, and from [0.0 m, 0.5 m] for deadlock avoidance and safe and efficient simulation runs.
τ and η sampled uniformly from [0.0 s, 1.0 s]
The HL parameters σ, η and τ (see Table 2) have been sampled to generate simulation runs of all types, including safe, aggressive, cautious, or efficient simulation runs.
For each simulation run, we apply the methodology explained in Subsection 5.1, recording the following values:
Then, we assigned a binary label y to each simulation run through the following criteria, depending on the avoidance event:
Safe simulation run (avoiding collision):
Efficient simulation run (avoiding deadlocks):
Compliant simulation run (avoiding both collision and deadlocks):
Finally, we obtained there dataset = {(xj, yj) | j = 1, . . . , N} for i = 1, 2, 3, corresponding to the three criteria, respectively.
A first visual inspection of how classes are distributed in the datasets is useful to understand the nontrivial nature of the problem. In Figure 47a, Figure 47b and Figure 47c, the relationships among the four entropy-based metrics — mean entropy, median entropy, standard deviation of entropy, and interquartile range of entropy — are visualized for the three binary classifications: collision avoidance, deadlock avoidance, and compliant simulation runs. Each plot displays pairwise scatterplots, overlaid with kernel density estimation (KDE) curves along the diagonals to depict distributions for each class. Simulation runs with lower meanEntropy and medianEntropy values are more closely associated with collisions, indicating that decreased entropy could signal potential collisions between agents. Higher values of meanEntropy and medianEntropy are more closely associated with the “deadlock” class, indicating that increased persistent entropy in the system could signal a potential deadlock situation. In this way, we can observe how safe and efficient simulation runs, without collisions or deadlocks, have relatively stable values for mean entropy and median entropy.
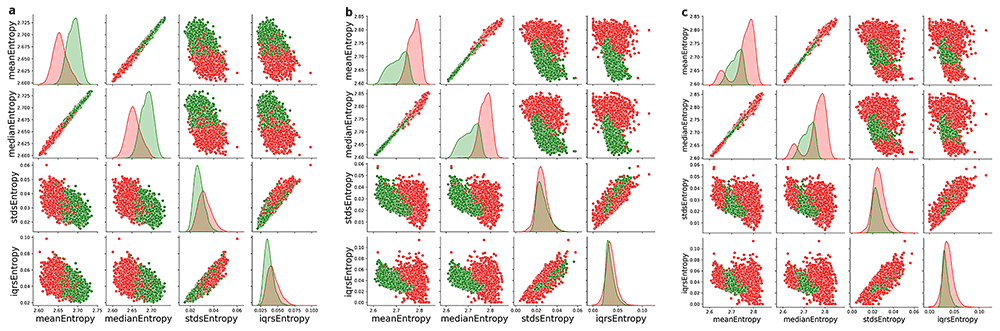
Figure 47. Pairwise class distributions of the features in for i = 1, 2, 3.
(a) Safety: green = no collision, red = collision. (b) Efficiency: green = no deadlock, red = deadlock. (c) Compliance: green= no collision or deadlock.
Across all three classifications — safe, efficient, and compliant simulation runs — meanEntropy and medianEntropy stand out as the most informative features for distinguishing between classes. While stdEntropy and iqrsEntropy provide less individual discriminatory power, they may still offer complementary information when used in combination with the other metrics. These insights highlight the potential of persistent entropy-based metrics for identifying critical system states and suggest a strong basis for further model development and optimization.
Results. First, we compare training a rule-based model with the behavior parameters (as is done in 36) against training it with the topological features extracted with our methodology for collision avoidance. For that, we use SkopeRules10, which is a rule-based ML algorithm that learns interpretable and diversified rules for “scoping” a target class of interest, i.e., detecting samples from this class with high precision. In practical applications, the SkopeRules model has been applied to several safety-critical classification tasks, as well as anomaly detection problems or cluster description.
Table 3 highlights the superior performance of SkopeRules using topological features compared to using behavior parameters. The topological model achieves higher accuracy (84.6% vs. 83.6%), F1-score (84.6% vs. 81.9%), and true negative rate (81.3% vs. 72.5%) while significantly reducing the false positive rate (18.7% vs. 27.5%). Although its true positive rate (87.1% vs. 92.0%) is slightly lower, and the false negative rate (12.9% vs. 8.0%) is higher, these trade-offs are outweighed by its improved balance across metrics. Remember that the positive class is the non-collision class (+1).
Table 3. Performance comparison between the adopted rule-based models.
The first column refers to the input features. The second column reports the number of generated rules. The other columns refer to the following metrics (expressed in %): accuracy (ACC), F1-score (F1), true positive rate (TPR), false positive rate (FPR), false negative rate (FNR), true negative rate (TNR).
| # of rules | ACC | F1 | TPR | FPR | FNR | TNR |
|---|
| SkopeRules-behavior parameters | 8 | 83.6 | 81.9 | 92.0 | 27.5 | 8.0 | 72.5 |
| SkopeRules-topological features | 20 | 84.6 | 84.6 | 87.1 | 18.7 | 12.9 | 81.3 |
The use of 20 rules, compared to 8 for behavior parameters, suggests the topological model captures more complex relationships, enhancing its robustness. Models with fewer rules have the advantage of being more interpretable, but the richest ones may generate more fine-grained rules with better discriminative ability. Overall, topological features provide a more discriminative representation, making this model preferable for scenarios prioritizing accuracy and minimizing false positives.
Also, we compared the safety regions generated using these two types of input features. Specifically, we considered a Gaussian kernel SVM, with a sigma set to 0.5, with a regularization parameter set to 0.3, and a weighting of 0.5. With this base model, before any error control, we achieved the following performance: 78.2% accuracy, 80.6% F1-score, 82.8% TPR, 72.7% TNR, 27.3% FPR, 17.2% FNR using behavior parameters as input and 85% accuracy, 88.1% F1-score, 91.6% TPR, 75% TNR, 25% FPR, 8.4% FNR using topological features as input.
Topological features consistently show better performance than behavior parameters across all metrics, both in baseline classification and in safety region generation. Among the methods for generating safety regions (see Table 4), conformal prediction demonstrates superior accuracy and F1-scores, particularly with topological features, making it the preferred approach for ensuring robust safety guarantees.
Table 4. Performance comparison between the adopted techniques for finding safety regions at ϵ = 0.1.
The first column refers to the input features used for training the classification models, the second column refers to the adopted techniques for finding safety regions (probabilistic scaling - PS, and conformal prediction - CP), and the third one reports the optimal scaling parameter. The other columns refer to the following metrics (expressed in %): accuracy (ACC), F1-score (F1), true positive rate (TPR), false positive rate (FPR), false negative rate (FNR), true negative rate (TNR).
| Method | ρϵ | ACC | F1 | TPR | FPR | FNR | TNR |
|---|
| Behavior parameters | PS | 0.49 | 77.9 | 77 | 67.8 | 9.9 | 32.1 | 90.1 |
| CP | 0.44 | 78.5 | 77.8 | 69 | 10.1 | 31 | 89.9 |
| Topological Features | PS | 0.42 | 79.8 | 81.6 | 74.3 | 11.9 | 25.7 | 88.1 |
| CP | 0.21 | 83.7 | 86.2 | 84.1 | 16.9 | 15.9 | 83.1 |
Now, we derive interpretable approximations for both regions in the form of decision rules. Local rule extraction via Anchors was performed on a set of steps labeled as +1 by the adjustable classifiers and sampled at a small distance d ≤ 0.05 from their border.
The results in Table 5 demonstrate the advantages of using topological features over behavior parameters in the context of local rule extraction with Anchors. Notably, the number of generated rules (anchors) is significantly reduced when using topological features—only 2 rules compared to 5 rules for behavior parameters:
Table 5. Performance comparison between the rules obtained using Anchors from the obtained adjustable classifiers (SVM).
The first column refers to the input features used for training the adjustable classifiers, the second refers to the adopted techniques for finding safety regions, and the third column reports the number of generated rules (anchors). Coverage and error percentages are reported for the logical union of the anchors being tested with respect to the labels assigned via PS and CP (Method labels column), and the real labels (Ground truth column). Coverage measures the proportion of correctly classified positive samples, and error represents the proportion of false positives, in the total predictions. Probabilistic scaling is denoted as PS, and conformal prediction is denoted as CP.
| | | Method labels | Ground truth |
|---|
| Method | # of
anchors | Coverage | Error | Coverage | Error |
|---|
| Behavior parameters | PS | 5 | 86 | 36 | 73 | 29 |
| CP | 5 | 85 | 35 | 73 | 29 |
| Topological features | PS | 2 | 79 | 0 | 69 | 9 |
| CP | 2 | 100 | 30 | 100 | 26 |
Topological features—rules: meanEntropy > 2.68 and medianEntropy > 2.68 for PS method, and meanEntropy > 2.66 and medianEntropy > 2.65 for CP method. Entropy above these values refers to simulation runs free of collision situations.
Behavior parameters -rules: the same 5 rules for both methods: η > 0.75, τ ≤ 0.5, τ ≤ 0.25, τ ≤ 0.76 and σ > 0.08.
This reduction highlights a key advantage: the rules obtained with topological features are simpler, more concise, and easier to interpret, which enhances their applicability in decision-making tasks. In addition, for topological features, the error rates are significantly lower. For step, under probabilistic scaling (PS), the error drops to 9%, compared to 29% with behavior parameters. Even with conformal prediction (CP), the error decreases to 26%, while achieving a perfect 100% coverage. Despite having fewer rules, topological features maintain competitive or superior coverage compared to behavior parameters.
These findings emphasize that topological features not only simplify the decision rules by reducing their number but also improve their accuracy and reliability, making them a more effective and interpretable choice for defining local decision regions.
Once we have verified that the proposed methodology achieves better results for differentiating between safe (no agent collisions) and non-safe simulation runs, we proceed to extend its use to the case of distinguishing between efficient (no deadlocks) and non-efficient simulation runs. We follow the same steps as above, but this time we do not compare the results/performance with those obtained using behavior parameters (σ, η and τ).
Using the SkopeRules method and topological features to classify non-efficient simulation runs (i.e., with deadlocks) versus efficient simulation runs (i.e., without them), we derive a total of 18 rules, achieving highly positive performance: 89% accuracy, 88.5% F1-score, 93% TPR, and 84% TNR. This demonstrates that these features achieve even better performance for deadlock avoidance than for collision avoidance when using SkopeRules.
Next, we generate the safety regions using these features in the same manner as before. We considered a Gaussian kernel SVM, with a sigma set to 0.5, a regularization parameter set to 0.3, and a weighting of 0.5. With this base model, prior to any error control, we achieve the following performance: 86% accuracy, 82.3% F1-score, 74.7% TPR, 94.7% TNR. Using PS method we achieve the following performance: ρε equal to -0.12, 87.2% accuracy, 84.6% F1-score, 80.1% TPR, 92.7% TNR; and using the CP method, we achieve the following performance: ρε equal to 0.17, 83.6% accuracy, 77.9% F1-score, 66% TPR, 97.3% TNR.
Again, local rule extraction via Anchors was performed on a set of steps labeled as +1 by the adjustable classifiers and sampled at a small distance d ≤ 0.05 from their border. The number of generated rules (anchors) is 2 (same for both methods: meanEntropy ≤ 2.75 and medianEntropy ≤ 2.75. Persistent entropy below these values refers to simulation runs free of deadlock situations, so again, the rules obtained are very simple and easy to interpret. We evaluate the logical union of the anchors being tested concerning the labels assigned via the method used, and the real labels, obtaining the following results:
91% coverage and 21% error for ground truth labels, and 100% coverage and 22% for method labels for PS method.
91% coverage and 21% error for ground truth labels, and 100% coverage and 39% for method labels for PS method.
We can see how, with the PS method, we obtain a better performance in terms of error and, with the CS method, a better performance in terms of covering (as for collision avoidance using topological features), although the rules are the same, obviously obtaining the same performance for the real labels. Considering the non-trivial nature of the problem and of approximating a complex SVM shape via hyper-rectangular shapes (rules) while keeping the error bound as low as possible, we consider our results as a promising compromise between safety and transparency.
Thus, if we focus on distinguishing between compliant (safe and efficient) simulation runs (i.e., free of collisions and deadlocks) and non-compliant simulation runs, we obtain very simple rules for both methods:
In summary, our results highlight the advantages of using topological features in rule-based explanations and the generation of safety regions for classification. First, for differentiating between safe and unsafe simulation runs, we achieve better results compared to not using these topological features. The results were even more favorable for distinguishing between efficient and non-efficient simulation runs, ultimately yielding a very simple rule for differentiating between compliant and non-compliant simulation runs. These findings confirm the suitability of topological features for enhancing transparency and reliability in classification and safety detection tasks.
Finally, since these rules are a posteriori to the simulation runs — meaning that we need to have the complete simulation run and calculate these topological features to determine whether it falls within the safety margins defined by the obtained rules — it would be interesting to explore how to define the simulation parameters a priori so that the resulting runs exhibit a safe persistent entropy value, that is, one that falls within the range identified as safe by the rules.
The results presented in Figure 48 and Figure 49 analyze the relationship between three parameters (σ, η and τ) and the classification of simulation runs into safety or non-safety, based on a posteriori safety rule evaluation. The goal is to understand how these parameters influence the safety classification and derive insights that could help define simulation parameters a priori to ensure safety.
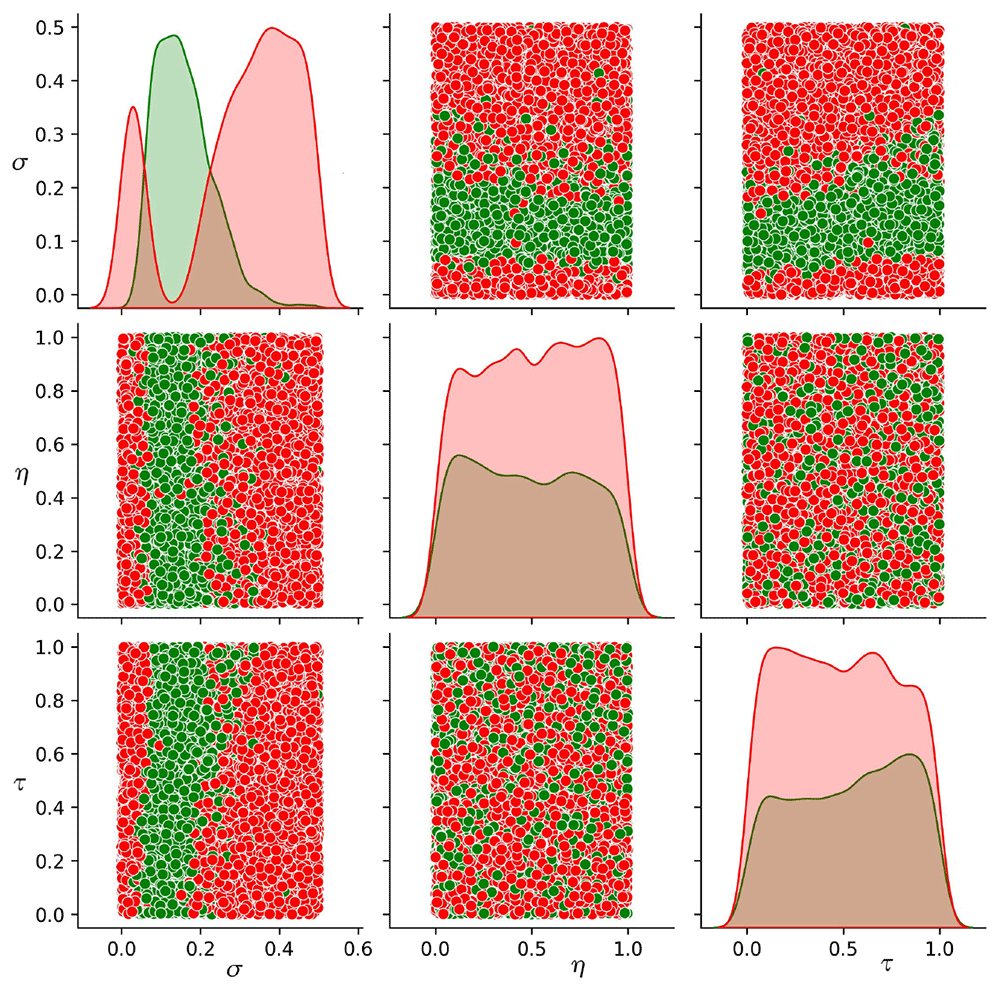
Figure 48. Pairwise class distributions between simulation parameters (σ, η and τ) and the compliance classification (green color refers to “safe” label, and red color to “non-safe” label) based on the a posteriori safety rule (using the PS method rules, since it has a lower error for both collision and deadlock avoidance than the CP method rule).
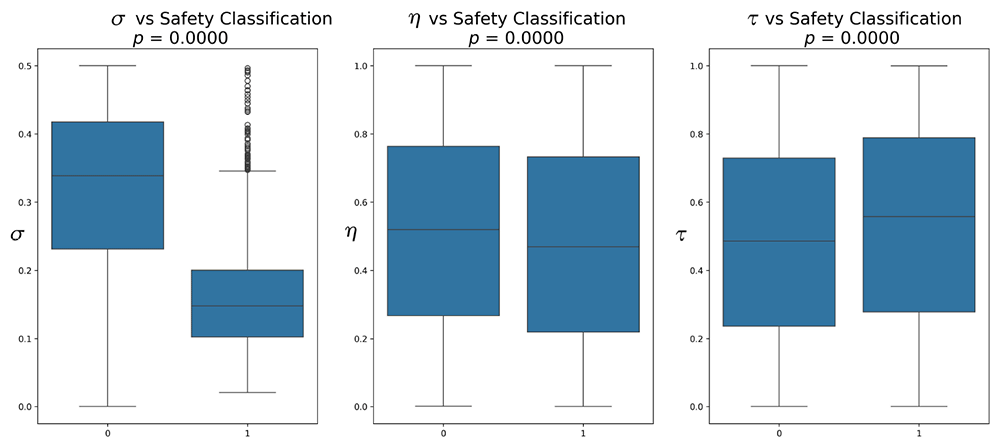
Figure 49. Statistical comparison using boxplots for the parameters σ, η and τ, and the safety classification (0: unsafe, 1: safe), evaluated based on the a posteriori safety rule.
The p-values fromthe Mann-Whitney test indicate statistically significant differences between the safety categories (p ≤ 0.05).
The findings suggest that σ is the most influential parameter for determining whether a simulation run satisfies the safety rule. Specifically, setting lower values of σ a priori increases the likelihood of achieving a safe outcome. Setting σ within a low range (0.1–0.2) a priori may increase the likelihood of meeting the safety rule. While η and τ also show statistically significant relationships with safety, their influence appears more subtle and may act as secondary contributors. To optimize simulation parameters for safety adherence, prioritizing low σ values, with careful consideration of η and τ, is recommended. This analysis provides a robust foundation for a priori parameter selection in simulation runs, enabling a more systematic and predictive approach to ensuring safety compliance.
An important aspect to consider is that these ranges are sensitive to the number of agents and the scenario, meaning these results cannot be generalized to all cases. Additionally, it is necessary to assess whether it is also sensitive to the type of behavior used.